All-atom molecular dynamics of the HBV capsid reveals insights into biological function and cryo-EM resolution limits
- University of Delaware, United States
- Indiana University, United States
- University of Illinois at Urbana-Champaign, United States
Figures
Figure 1 with 1 supplement
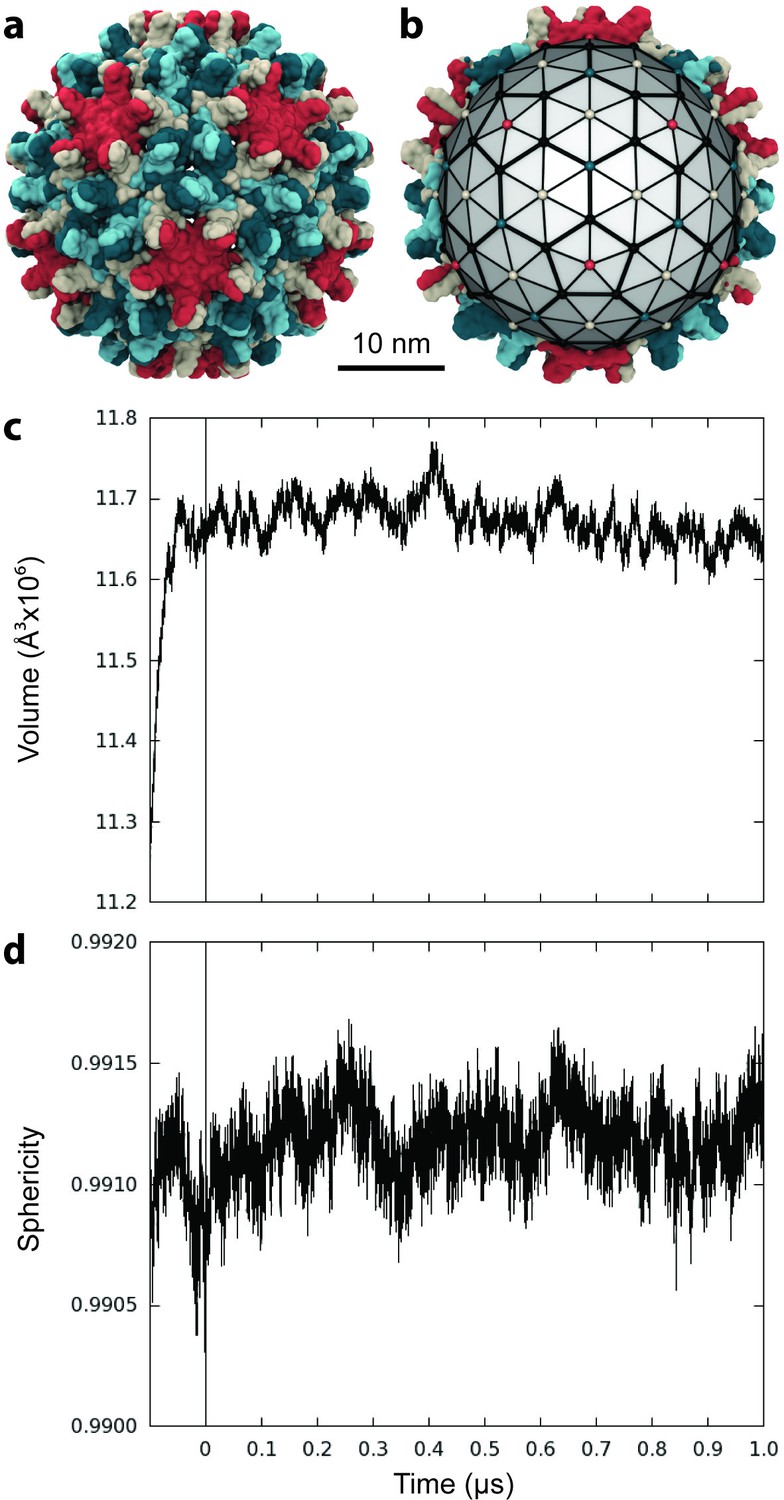
Capsid size, stability, and morphology.
(a) The T = 4 HBV capsid is composed of 120 copies of Cp homodimer, where A (red) and B (beige) quasi-equivalent chains comprise AB dimers, and C (cyan) and D (blue) quasi-equivalent chains comprise CD dimers. (b) A polyhedron of 240 triangular faces was used to estimate capsid inner volume and sphericity; see Materials and methods. Polyhedron shown within a cross-section of the capsid, with fivefold (red spheres), sixfold (beige spheres), and threefold (blue spheres) vertices indicated. (c) Capsid inner volume increased and stabilized within 0.05 µs. (d) Capsid sphericity remained high throughout the simulation.
-
Figure 1—source data 1
Raw data for plots 1c-d in plain text format.
- https://doi.org/10.7554/eLife.32478.004
Figure 1—figure supplement 1
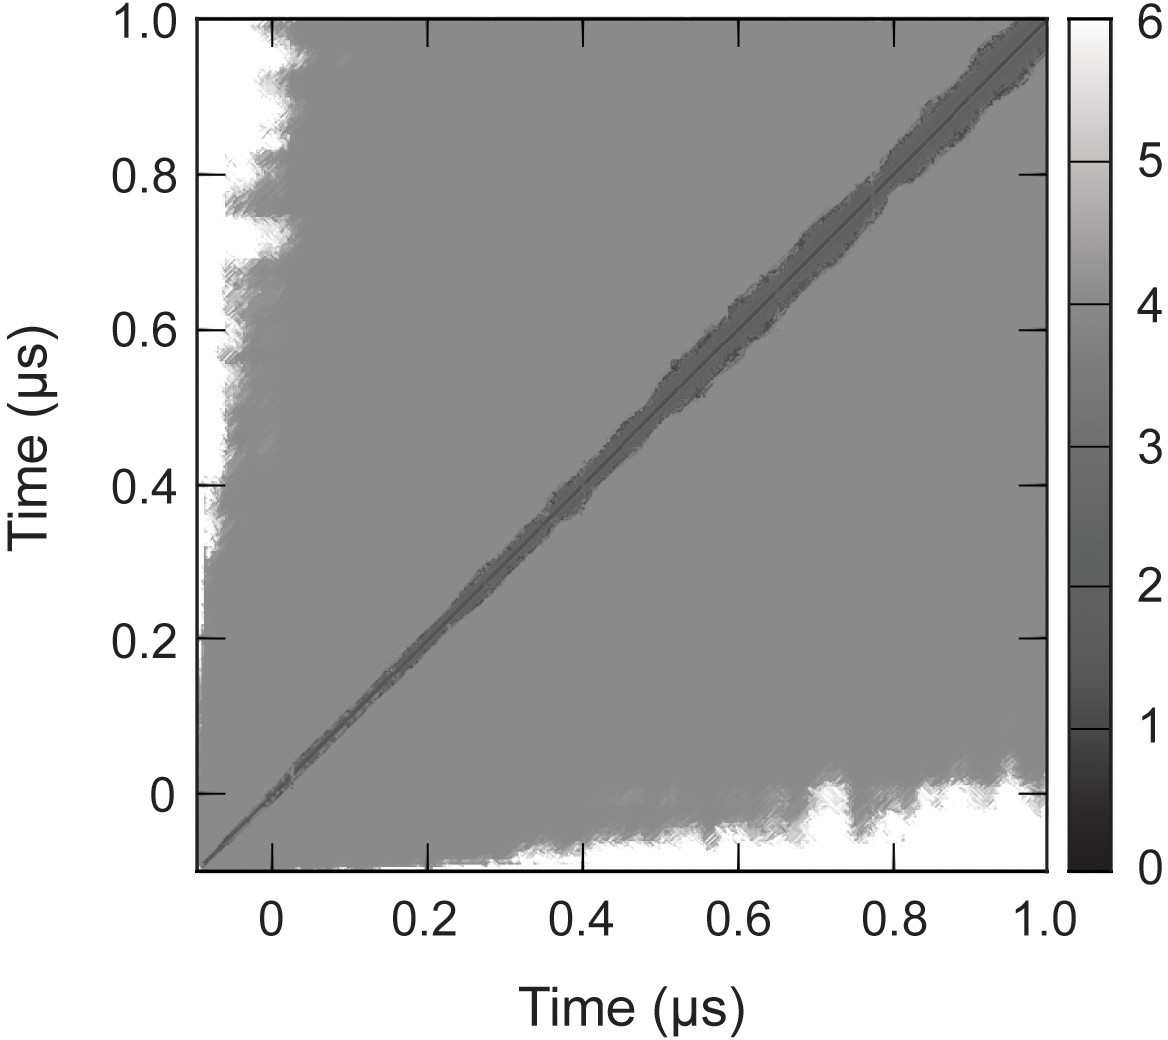
RMSD of complete capsid.
Cα RMSD of the capsid (Å), measured pairwise between sampled conformations, converged to within 5 Å around 0.1 µs. This indicates the total simulation time necessary for the capsid to relax from its crystallographic state and equilibrate to a stable configuration under physiological conditions.
Figure 2
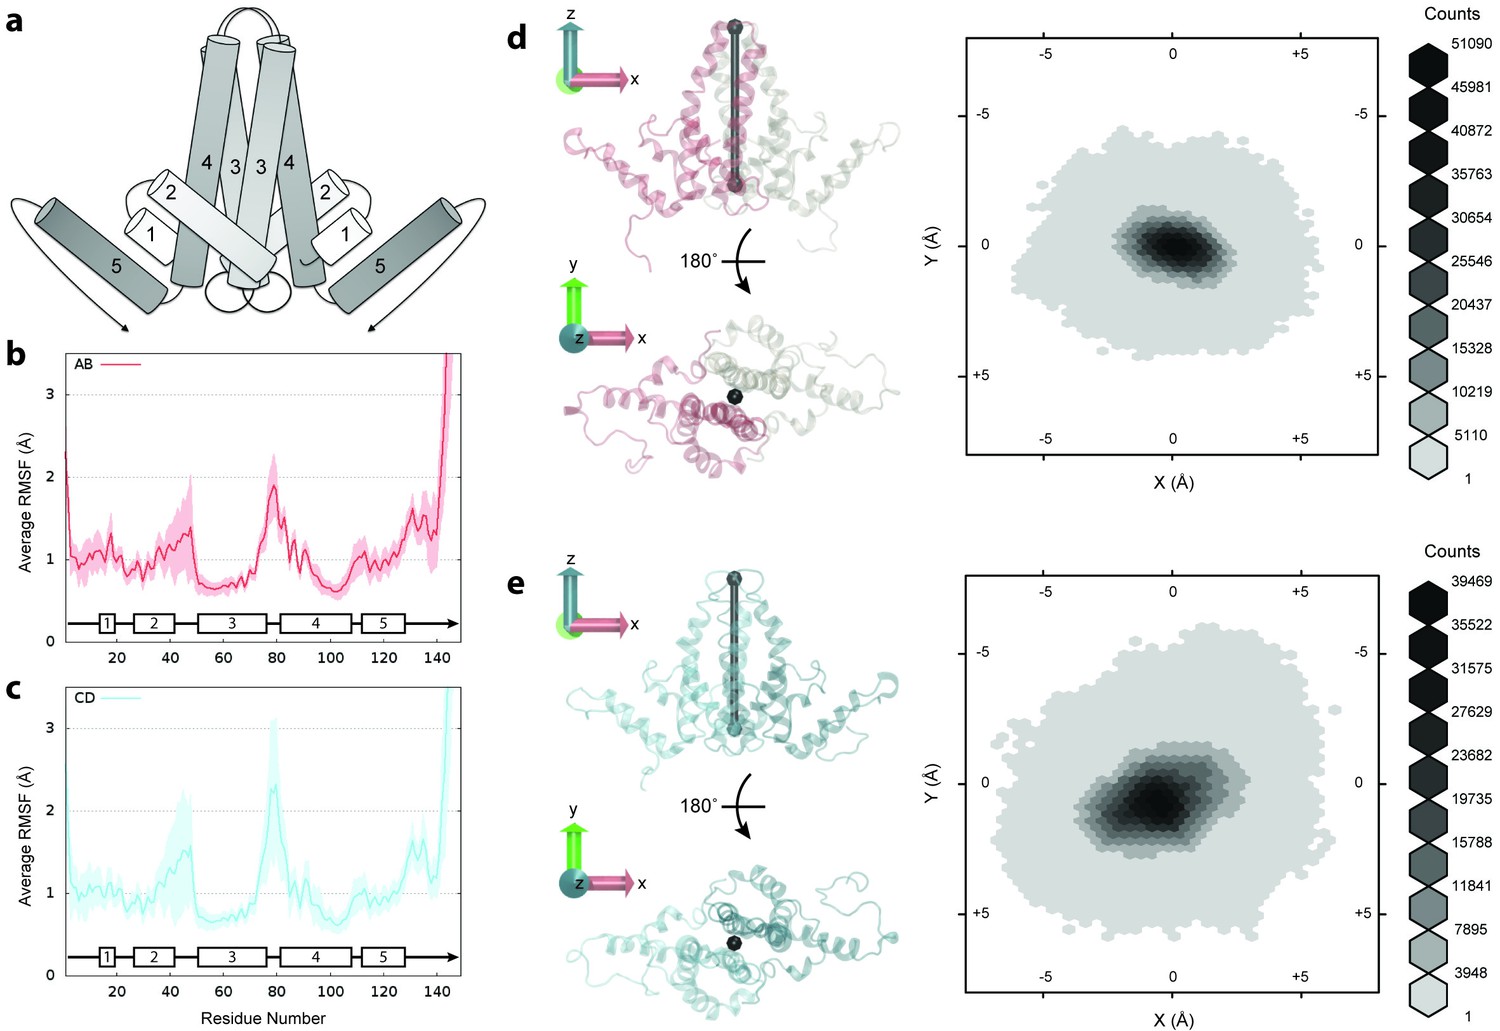
Flexibility of Cp dimers.
(a) Schematic of Cp dimer, with helices 1 through 5 indicated. (b) Average Cα RMSF (Å) over 60 copies of AB dimers. (c) Average Cα RMSF (Å) over 60 copies of CD dimers. CD dimers are more flexible than AB dimers, with greater mobility in the spike tips. Calculations are based on internal alignment of dimers extracted from the capsid simulation, totaling 60 µs of conformational sampling for each dimer group. Error bars are given as standard deviation. (d) 3D histogram of AB dimer spike tip motions in the plane, given alignment of dimers along the -axis. (e) 3D histogram of CD dimer spike tip motions in the plane, given alignment of dimers along the -axis. CD dimer spike tips sample a larger spatial area than AB dimer spike tips. Histograms are based on 60 µs of conformational sampling for each dimer group, or a total of 3 M conformations. See Materials and methods for more information on dimer alignments and spike tip definitions.
-
Figure 2—source data 1
Raw data for plots 2b-c in plain text format.
- https://doi.org/10.7554/eLife.32478.007
Figure 3 with 1 supplement

RMSF of complete capsid.
(a) Average Cα RMSF (Å) of Cp dimers. Calculations are based on internal alignment of dimers extracted from the capsid simulation (local dynamics, bottom curve) and alignment of the full capsid (global dynamics, top curve), totaling 120 µs of conformational sampling. The increase in apparent dimer flexibility in the latter case arises from spatial movements of dimers relative to each other within the capsid assembly. (b) Projection of RMSF values fonto their corresponding locations in the capsid model instead of averaging over dimer copies reveals clear asymmetry in global dynamics. Fivefold vertices are highlighted with stars.
-
Figure 3—source data 1
Raw data for plot 3a in plain text format.
- https://doi.org/10.7554/eLife.32478.010
Figure 3—figure supplement 1
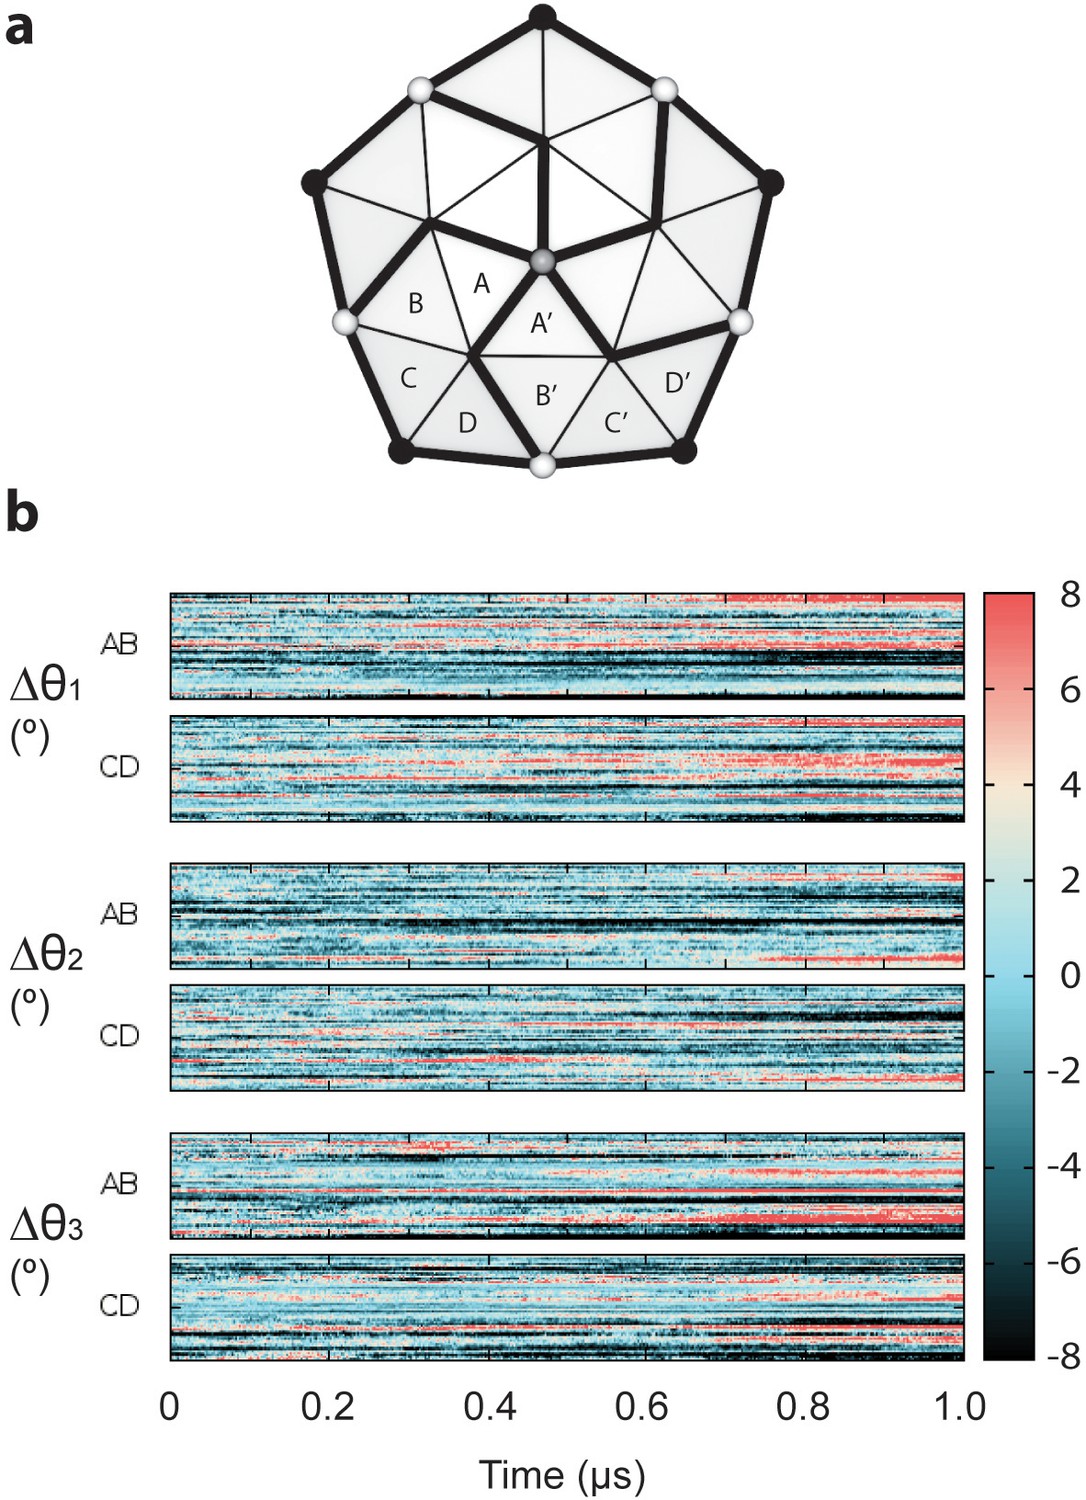
Deviations in transformations between dimers of neighboring subunits.
(a) Schematic showing the relationship of capsid chains around a fivefold symmetry axis. A given set of Euler angles θ1, θ2, and θ3 transform the dimers composed of chains AB and CD to their neighbors A’B’ and C’D’. (b) The Euler angles required to transform the chains AB and CD to their neighbors A’B’ and C’D’ show deviations in excess of ±8° relative to the idealized structure. These altered Euler angles produce deviations in displacements of neighboring chains up to ±8 Å compared to a symmetric structure.
Figure 4

Spatial fluctuations of pentamers with respect to the capsid center.
(a–f) Pentamers in the upper hemisphere (red) of the capsid are shown paired with their counterparts across the twofold symmetry axis in the lower hemisphere (blue). Icosahedral schematics indicate the relative locations of the measured distances (Å) within the capsid. Distances are measured between the center of mass of pentamers and the center of mass of the capsid. Variations in distance profiles indicate asymmetric distortions in capsid shape over time.
-
Figure 4—source data 1
Raw data for plots 4a-f in plain text format.
- https://doi.org/10.7554/eLife.32478.012
Figure 5 with 1 supplement
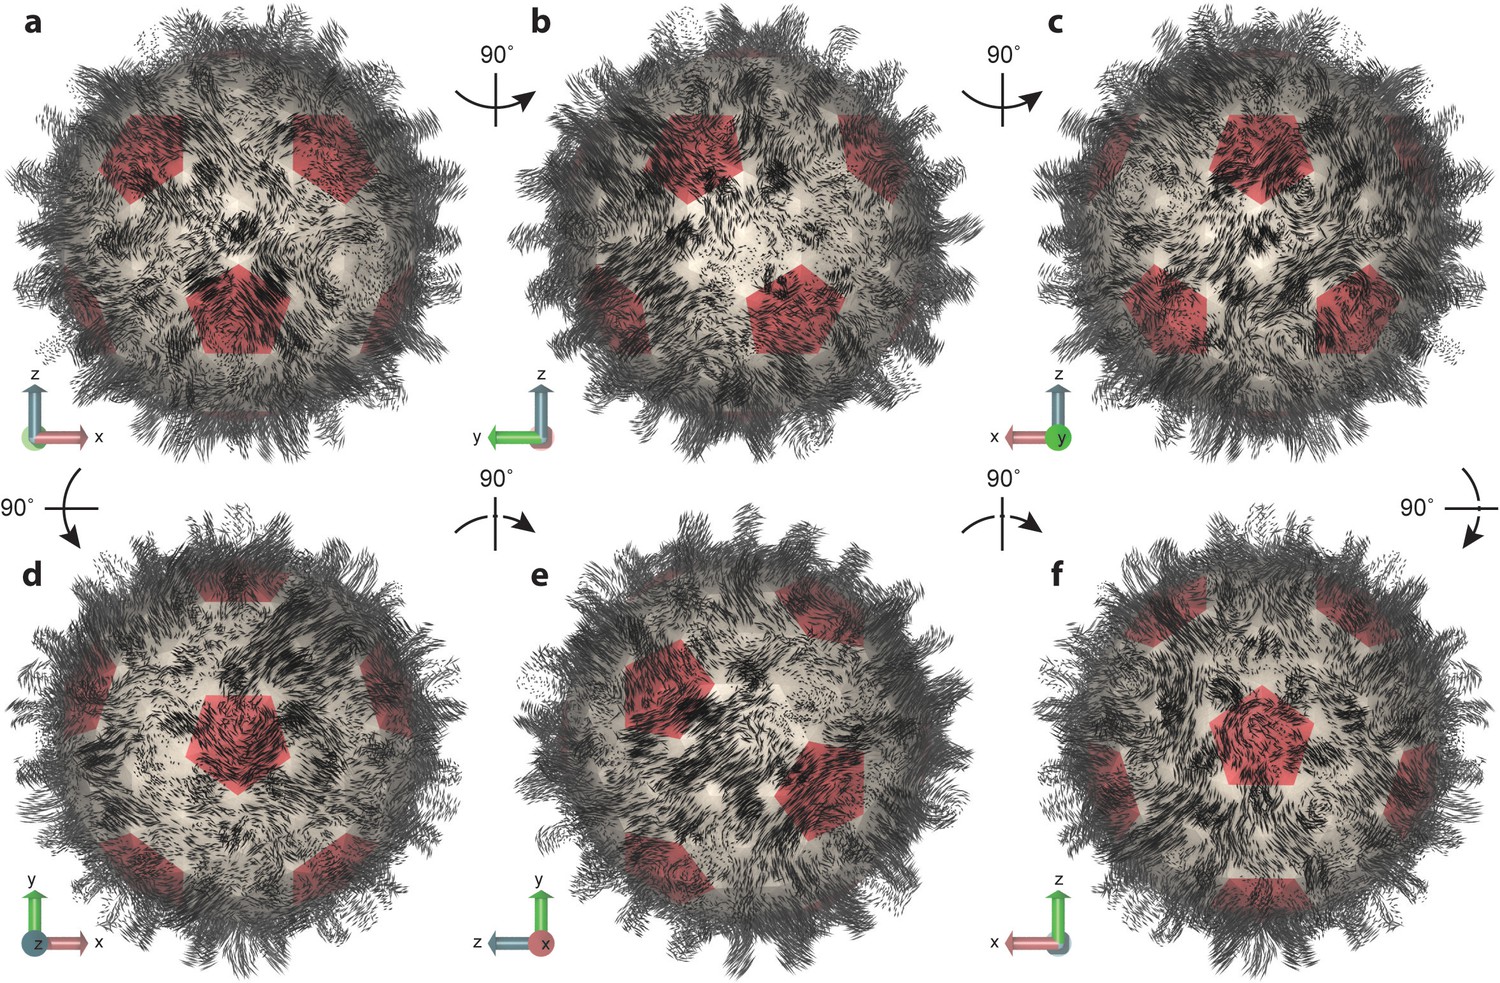
Essential dynamics of the capsid.
(a–f) Views of the first mode from PCA, which comprises only 6% of total variance, illustrate the striking complexity and intrinsic asymmetry of capsid dynamics. PCA calculation based on Cα trace of 50,000 conformations sampled over 1 µs of simulation. Mode representation shown as a porcupine plot projected onto a polyhedral surface with pentamers highlighted in red; eigenvalue scaling increased by five for visual clarity.
-
Figure 5—source data 1
Mode data in plain text format for NMWiz.
- https://doi.org/10.7554/eLife.32478.015
Figure 5—figure supplement 1
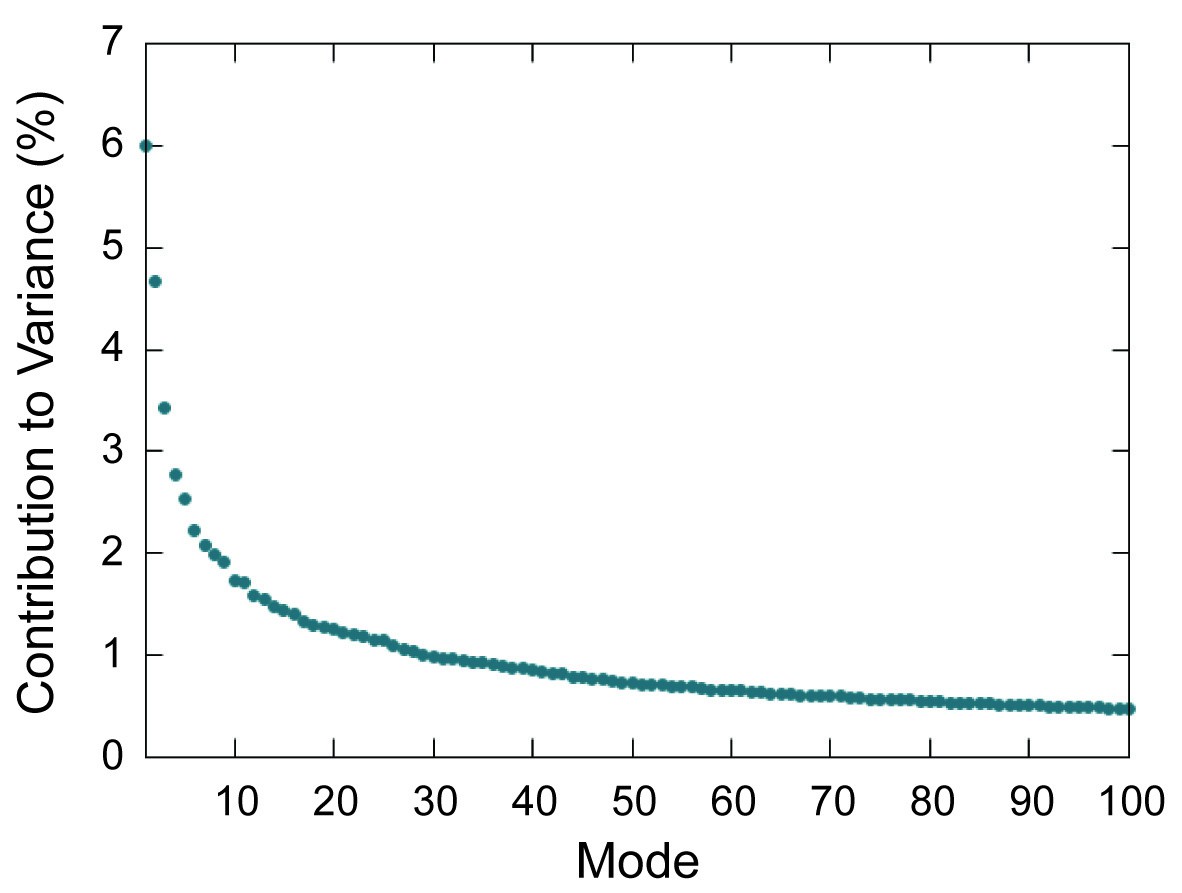
Scree plot for PCA modes.
Scree plot showing percent contribution to total variance for the first 100 modes determined by PCA of the capsid.
Figure 6 with 1 supplement
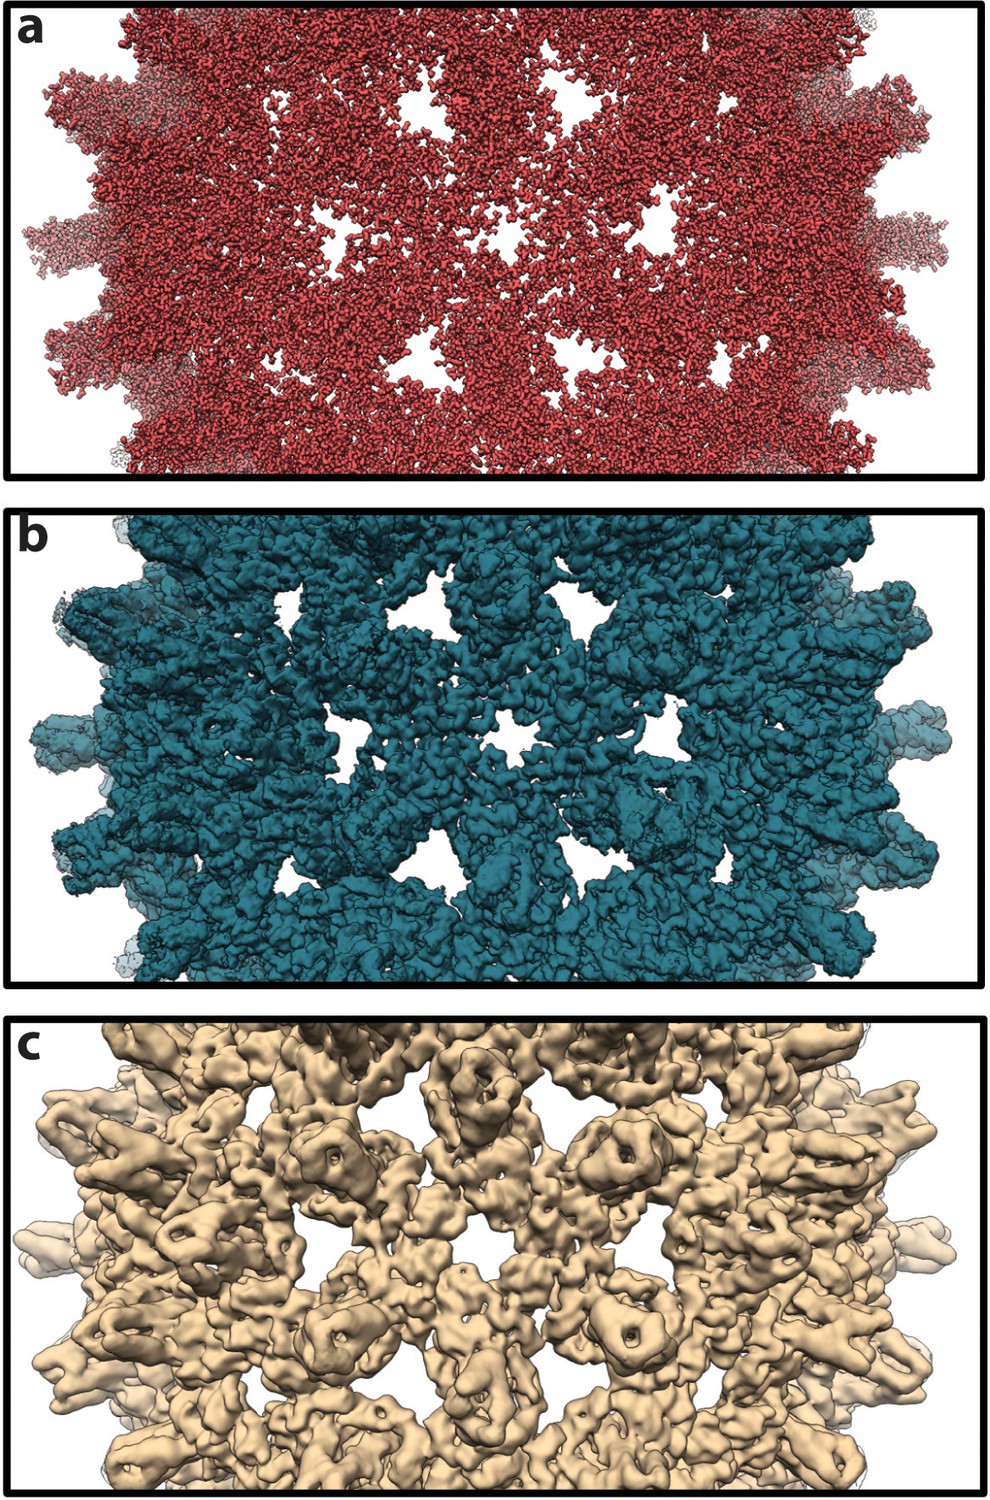
Theoretical density maps.
(a) A representative density map calculated for a single conformer sampled during simulation. The map necessarily shows atomic detail, with individual side chains clearly visible. (b) An averaged map calculated as the mean of 1,000 individual maps, such as that in panel a, based on conformers extracted from the simulation at 1-ns intervals. All maps used in the calculation share a common orientation, based on alignment on the capsid’s Cα trace. Averaging clearly reduces molecular detail. (c) A map calculated by icosahedral averaging of the map in panel b. With icosahedral averaging, a technique commonly used in experimental structure determination, molecular detail is further reduced and features at low spatial frequency become more apparent. For map calculations, individual atoms were treated as Gaussian density distributions with a width of 1 Å at half maximal density and pixel size of 0.75 Å.
Figure 6—figure supplement 1
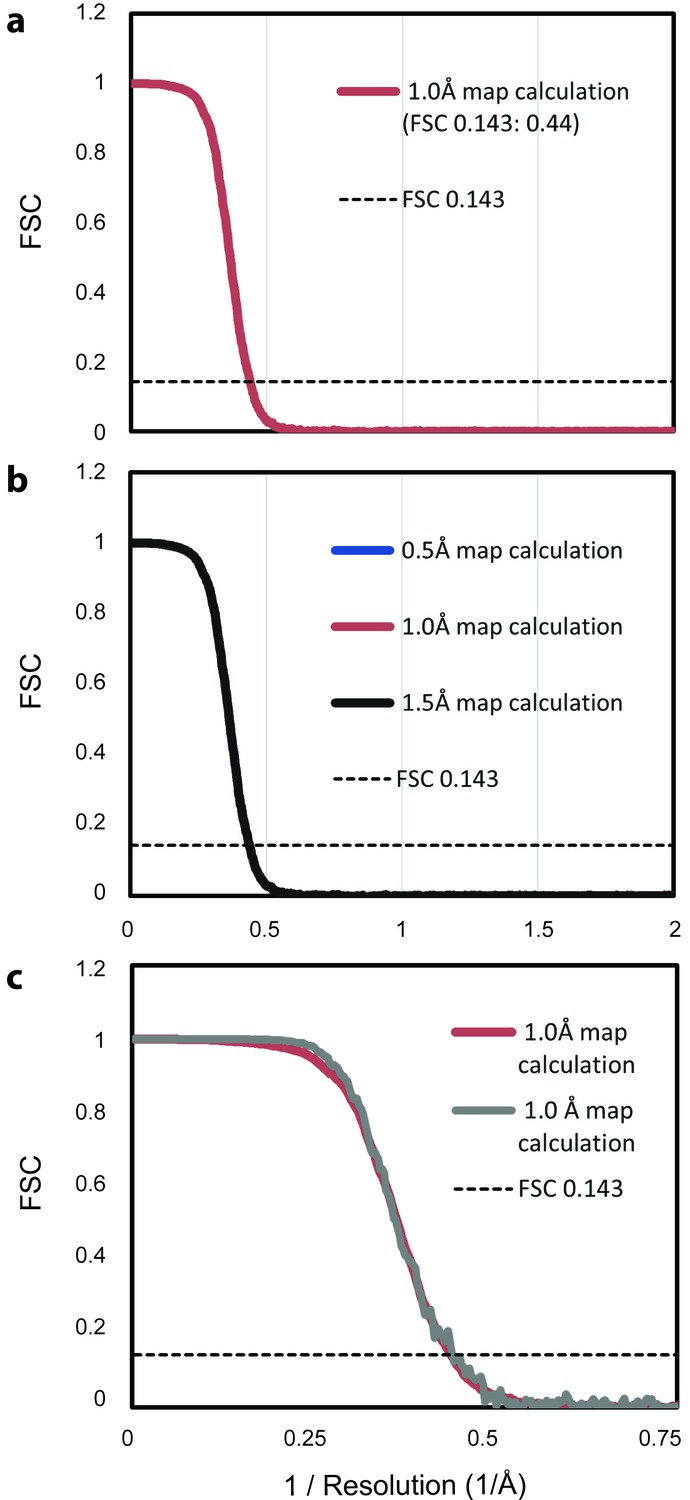
FSC analysis of theoretical density maps.
(a) Two average maps, each based on 500 randomly selected maps from the ensemble of 1,000 maps, were calculated with a width of 1 Å at half maximal density. The FSC between the two maps falls below the cutoff of 0.143 (dotted line) at 0.44, the inverse of 2.3 Å, indicating the resolution of the map based on the full ensemble. (b) Repeating the analysis from panel a with maps calculated with widths of 0.5 Å and 1.5 Å at half maximal density produces an equivalent FSC curve, demonstrating that the selection of this parameter does not introduce bias. (c) Repeating the analysis from panel a with an icosahedrally averaged map shows increased correlation at lower spatial frequencies, but does not alter the predicted resolution.
Figure 7
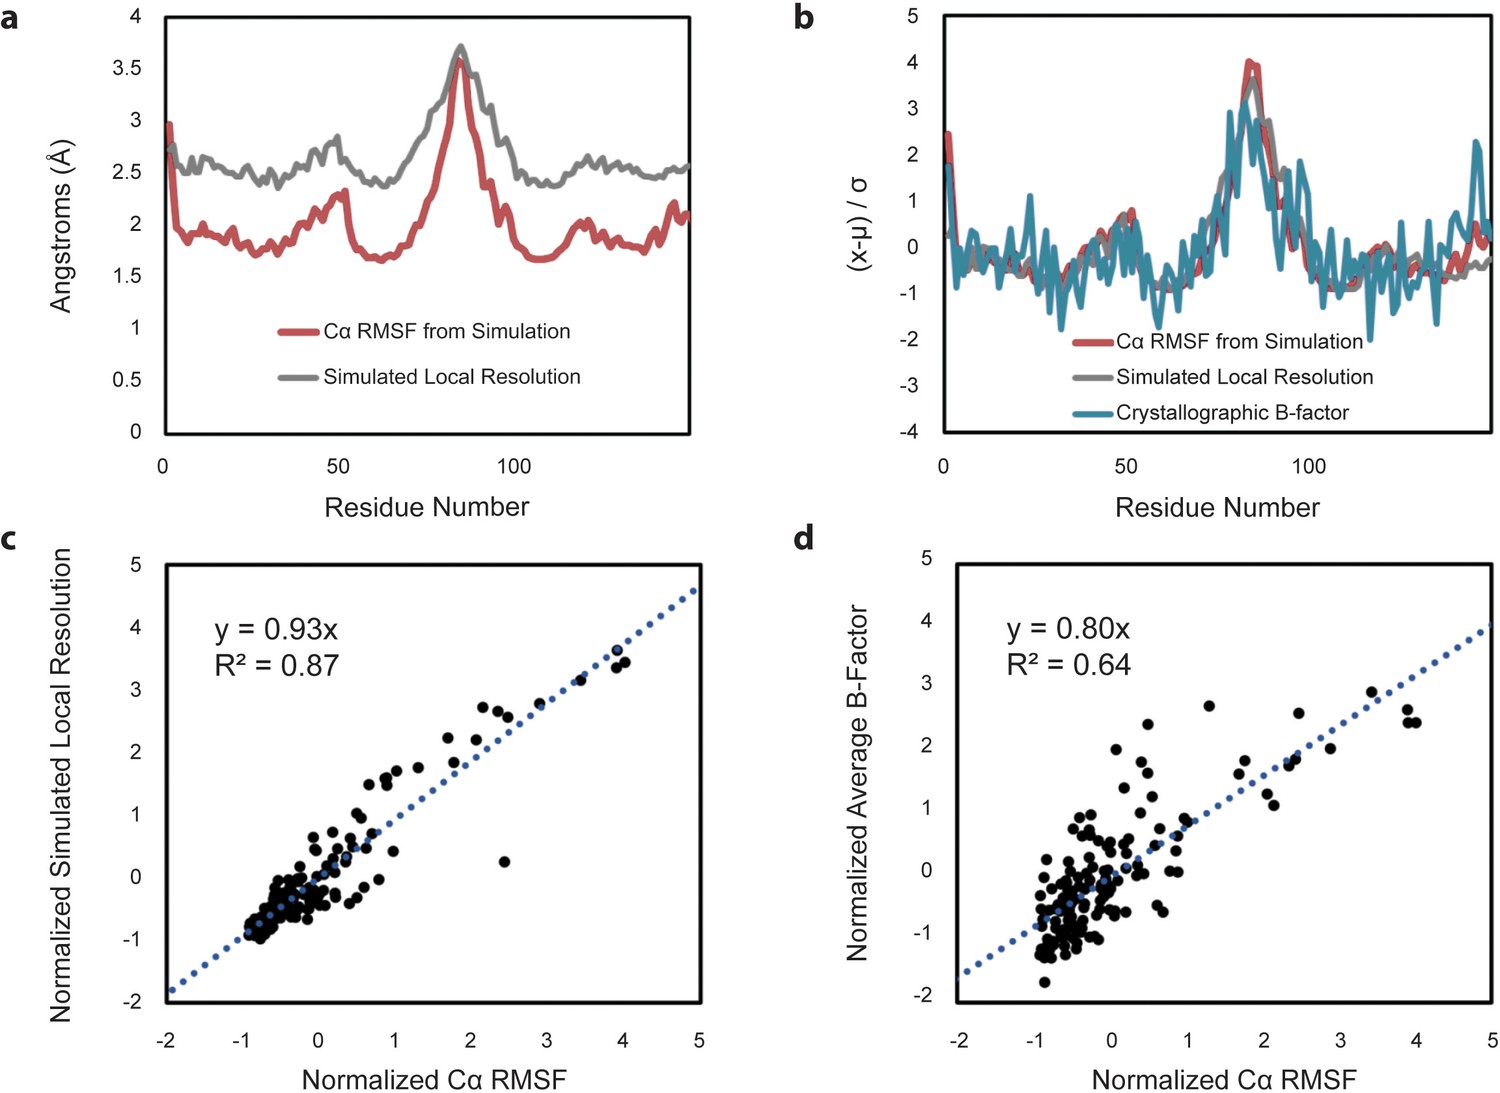
Comparison of Cα RMSF with theoretical local resolution and experimental B-factors.
(a) Per-residue comparison of RMSF and local resolution; average RMSF is 2.03 Å, while average local resolution is 2.65 Å. For reference, the global FSC value of the theoretical density map is 2.3 Å. (b) Per-residue comparison of normalized RMSF and normalized local resolution with normalized experimental B-factors, reported as an average based on the two available apo-form HBV capsid crystal structures. To place metrics on the same scale for comparison, values (x) minus their average (µ) are normalized in units of standard deviation from the mean (σ). (c) Relative changes between normalized RMSF and normalized local resolution are highly correlated. (d) Relative changes between normalized RMSF and normalized experimental B-factors are also highly correlated, although noisier.
Figure 8 with 1 supplement
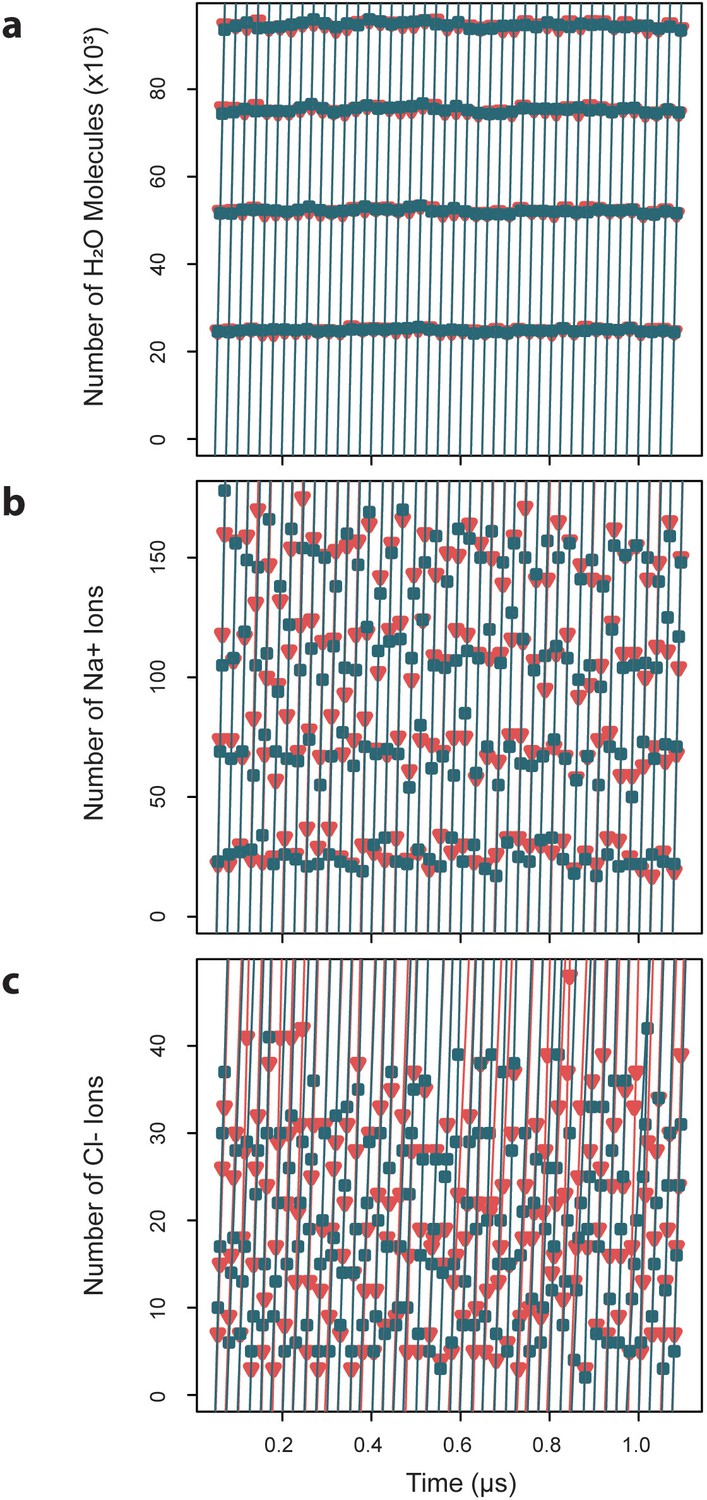
Exchange rates for water and ions crossing the capsid surface.
Cumulative numbers of solvent species moving inward (blue) and outward (red) across the capsid surface over a given segment of simulation time are plotted versus that simulation time, and the slope of the linear fits give the exchange rates, which are reported as averages ± standard deviations. (a) Water molecules exchange at a rate of 4.7×10³ ± 0.03 ns-1 inward and 4.70.04 ns outward. (b) Sodium ions exchange at a rate of 8.40.7 ns-1 inward and 8.5 ± 0.6 ns-1 outward. (c) Chloride ions exchange at a rate of 1.8 ± 0.4 ns-1 inward and 1.7 ± 0.3 ns-1 outward.
Figure 8—figure supplement 1
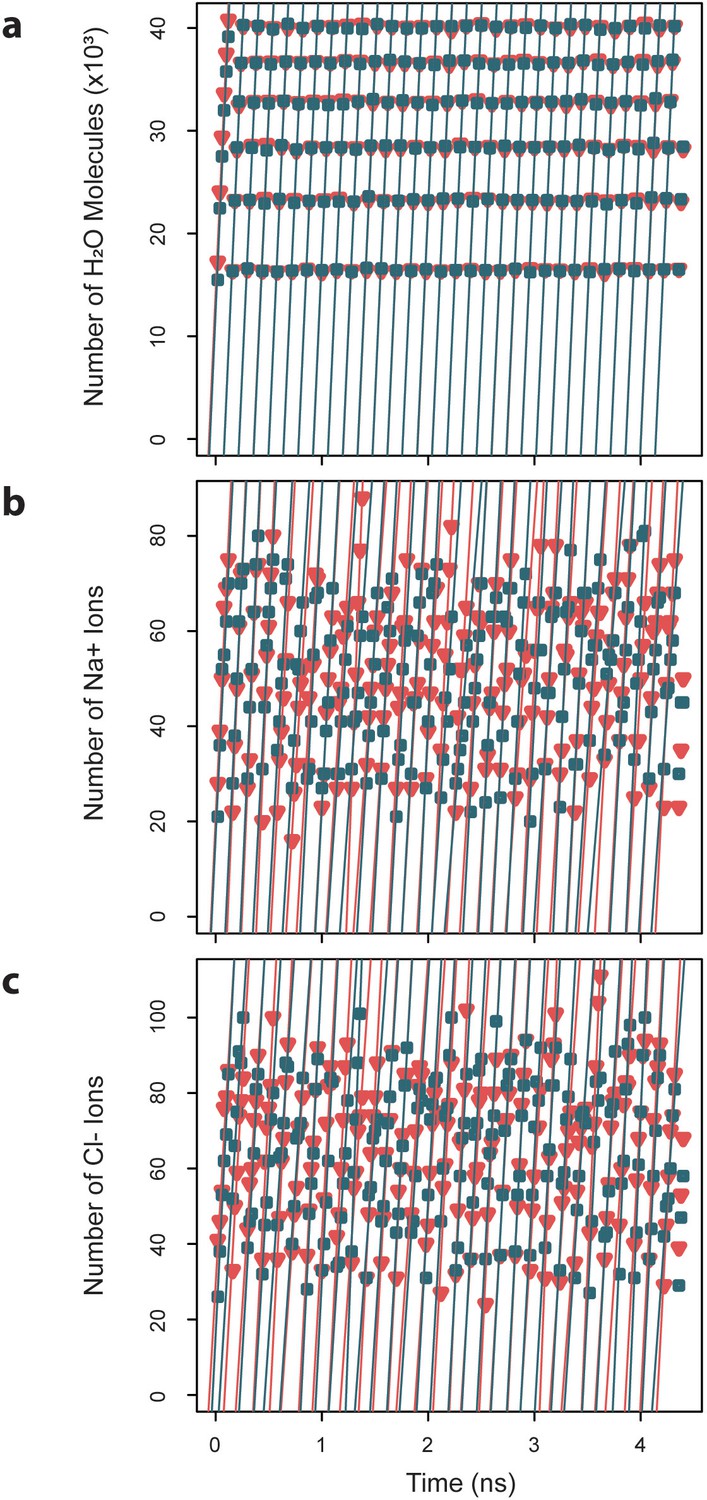
Exchange rates for water and ions crossing a spherical surface.
Cumulative numbers of solvent species moving inward (blue) and outward (red) across the spherical surface of radius 145.4 Å over a given segment of simulation time are plotted versus that simulation time, and the slope of the linear fits give the exchange rates, which are reported as averages ± standard deviations. (a) Water molecules exchange at an average rate of 233.1×10³ ± 2.1 ns-1. (b) Sodium ions exchange at an average rate of 412.3 ± 93.3 ns-1. (c) Chloride ions exchange at an average rate of 516.6 ± 121.1 ns-1.
Figure 9 with 1 supplement
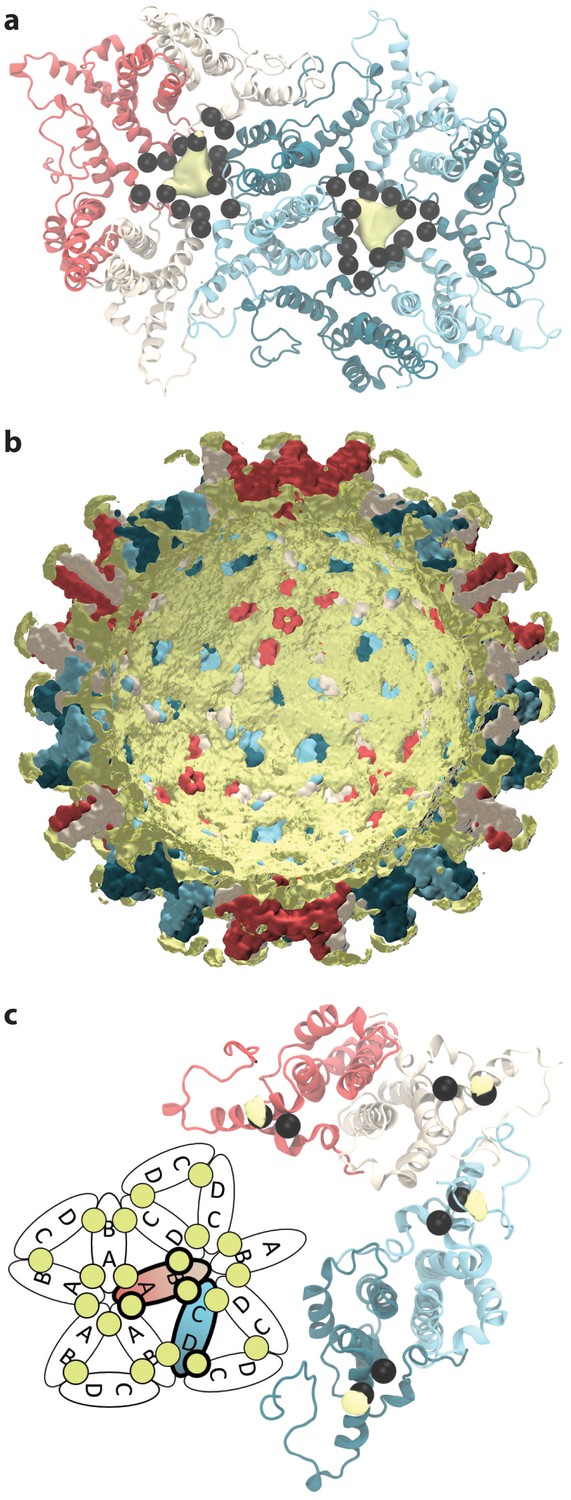
Sodium ion occupancy.
(a) View of two AB and three CD dimers from the capsid exterior, illustrating sodium ion localization (yellow) within the pores at the center of trimers of dimers, where three copies each of D2, D4, E14, D40, and E43 (black spheres) aggregate. Isosurface contour level at ΔG = −1.0 kcal mol-1. Calculation based on alignment of 60 asymmetric units with surrounding solvent, totaling 60 µs of conformational sampling. (b) Cross-section of the capsid showing sodium ion localization (yellow) in a shell along the interior and in arcs above the spike tips. Isosurface contour level at ΔG = −0.5 kcal mol-1. Calculation based on alignment of full capsid with surrounding solvent, totaling 1 µs of conformational sampling. (c) View of the asymmetric unit from the capsid interior, illustrating sodium binding (yellow) at E117, adjacent to E113 (black spheres). Isosurface contour level at ΔG = −1.4 kcal mol-1. Calculation based on alignment of 60 asymmetric units with surrounding solvent, totaling 60 µs of conformational sampling. Inset: Schematic showing sodium binding locations within extended capsid lattice. ΔG error estimates are all within 4×10⁻⁵ kcal mol-1.
Figure 9—figure supplement 1
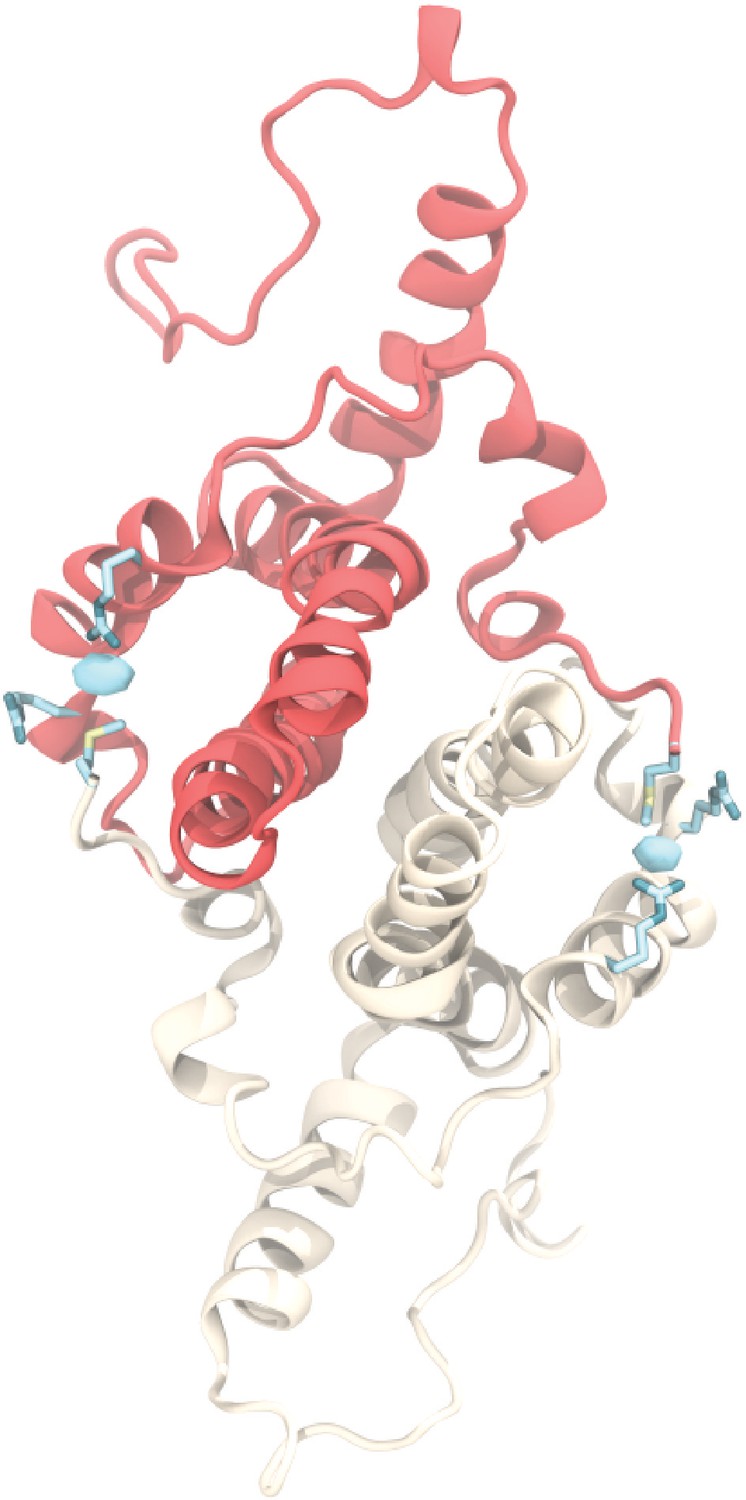
Chloride ion occupancy.
View of an AB dimer from the capsid exterior illustrating chloride binding (cyan), which mediates a contact between R28 and R39 from one Cp and the positively charged N-terminal M1 from its partner. Equivalent interaction occurs in the CD dimer. Isosurface contour level at ΔG = −0.8 kcal mol-1. Error estimates for ΔG are within 4×10⁻⁵ kcal mol-1.
Videos
Video 1
All-atom MD simulation of the HBV capsid.
Animation illustrating dynamics of the HBV capsid sampled over 1 µs of all-atom MD simulation. The capsid is composed of 120 copies of Cp homodimer, where Cp occupies quasi-equivalent chain positions A (red), B (beige), C (cyan), and D (blue). Animation rendered using VMD.
Video 2
Essential dynamics of the HBV capsid.
Animation depicting the first three modes from PCA of the capsid, computed based on an ensemble of 50,000 conformations sampled over 1 µs of MD simulation. Modes are ordered from left to right and comprise 6.0%, 4.7%, and 3.4% contribution to total variance, respectively. Top panel illustrates the capsid’s Cα trace, while the lower panel provides an abstraction based on a polyhedron used to describe changes in the capsid’s global morphology. Animation rendered using NMWiz and VMD.
Video 3
Exchange of NaCl across the HBV capsid.
Animation depicting the motions of ions contained within the capsid at the beginning of MD simulation over 0.1 µs of system equilibration. Ions exchange from the capsid interior to exterior over time. Due to the capsid’s preference to exchange positive ions, more sodium (yellow) exits the capsid than chloride (cyan). Animation rendered using VMD.
Additional files
-
Transparent reporting form
- https://doi.org/10.7554/eLife.32478.025
Download links
A two-part list of links to download the article, or parts of the article, in various formats.
Downloads (link to download the article as PDF)
Open citations (links to open the citations from this article in various online reference manager services)
Cite this article (links to download the citations from this article in formats compatible with various reference manager tools)
All-atom molecular dynamics of the HBV capsid reveals insights into biological function and cryo-EM resolution limits
eLife 7:e32478.
https://doi.org/10.7554/eLife.32478


