Chiral cell sliding drives left-right asymmetric organ twisting
- Graduate School of Science, Osaka University, Japan
- Graduate School of Medicine, Osaka University, Japan
- Graduate School of Medicine, Kobe University, Japan
Figures
Figure 1 with 6 supplements
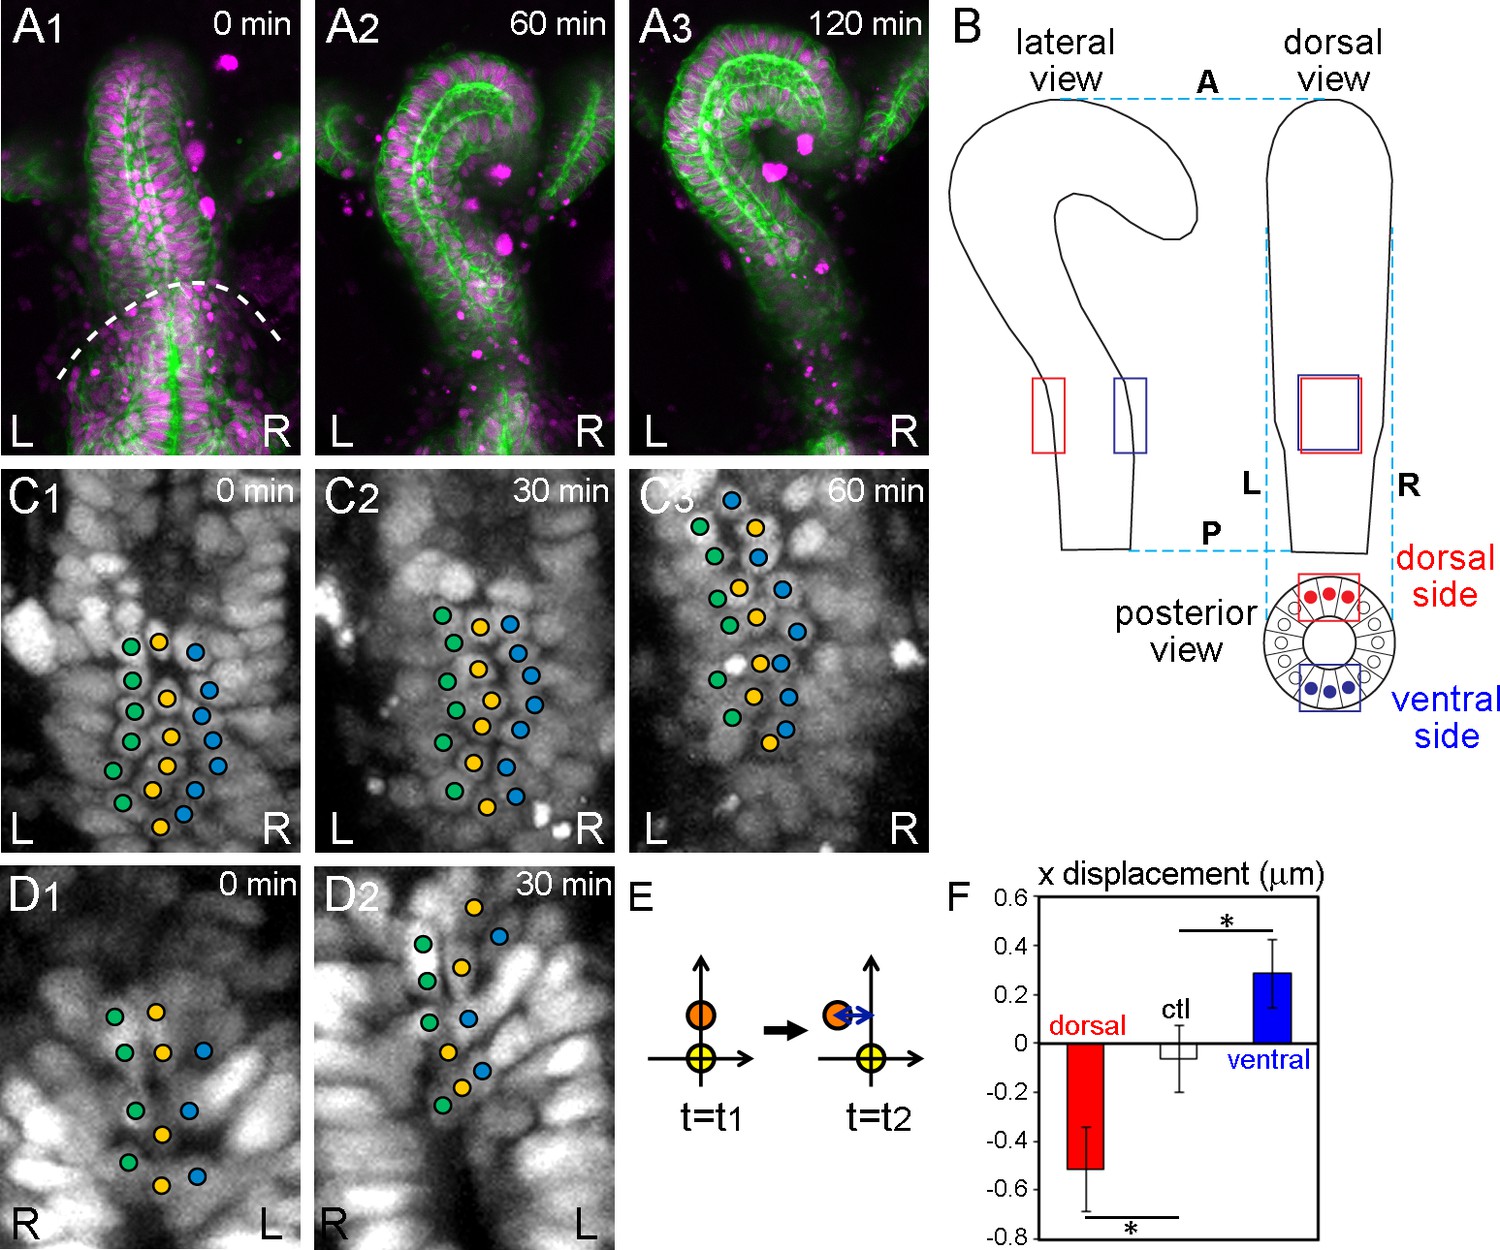
Wild-type hindgut epithelial cells slide leftward.
(A) Drosophila embryonic hindgut visualized by UAS-myr-GFP (membrane in green) and UAS-redstinger (nuclei in magenta) driven by byn-Gal4, starts to rotate at late stage 12, when the germ band is almost completely retracted (dashed line in A1). The hindgut rotates anticlockwise (A2) and completes the rotation in 2 hr, exhibiting a rightward pointing hook shape (A3). Time after the start of rotation is indicated at upper right. (B) Schematic of the hindgut before rotation. Lateral (left), dorsal (right), and posterior (bottom) views are shown. The hindgut is LR symmetric with the hook shape pointing in the ventral direction. The regions observed in the displacement measurements are indicated by red (dorsal) and blue (ventral) rectangles. (C, D) Cell nuclei in the dorsal (C) and ventral (D) sides of the hindgut, schematically shown as red and blue circles in B (posterior view), respectively, visualized by byn-Gal4 and UAS-redstinger (C) or UAS-stinger (D). Three central columns of cells are marked by colored circles. Cells slid leftward on both the dorsal and ventral sides. (E) Schematic of the displacement quantification. The coordinates of two cells located along the anterior-posterior axis at two time points were observed. The subjacent cell was set at (0,0), and the relative displacement of the upper cell in the x direction was measured. (F) Quantification of the cell movement during wild-type hindgut rotation. Dorsal cells showed minus directional movement (red bar, n = 126, N = 5) while ventral cells showed plus directional movement (blue bar, n = 78, N = 12), indicating that the cells on both sides moved leftward. Cells in the rectum region (shown as a control, ctl) did not show LR displacement (open bar, n = 91, N = 5). Error bars indicate SEM. *, p<0.05. For all images, anterior is up. A, anterior; P, posterior; L, left; R, right.
-
Figure 1—source data 1
Source data for Figure 1F.
- https://doi.org/10.7554/eLife.32506.006
Figure 1—figure supplement 1
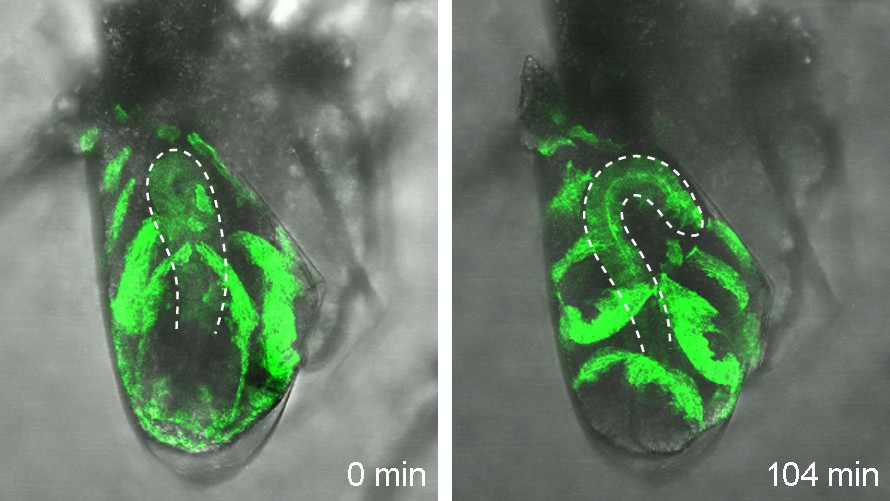
Explanted wild-type hindgut rotates counterclockwise in vitro.
The hindgut isolated from an embryo carrying UAS-GFP-moesin and en-Gal4 (otherwise wild type) was subjected to explant culture and imaged. Of the explanted hindguts, 85% (11 out of 13) showed normal counterclockwise rotation. Under these conditions, the GFP signal was detected in the ventral but not the dorsal half of the hindgut before its rotation. Due to the counterclockwise rotation of the hindgut, the GFP signal moved to the left side of the hindgut.
Figure 1—figure supplement 2

Cell movement in the root-most part of wild-type hindgut.
Cells in the root-most part of the hindgut did not show LR displacement but were gradually separated from each other in the AP direction. We could track these cells for more than 90 min.
Figure 1—video 1
Explanted wild-type hindgut rotates counterclockwisein vitro.
The hindgut isolated from an embryo carrying UAS-GFP-moesinanden-Gal4 (otherwise wild type) was subjected to explant culture and imaged.
Figure 1—video 2
Drosophilaembryonic hindgut visualized by UAS-myr-GFP (membrane in green) and UAS-redstinger (nuclei in magenta) driven bybyn-Gal4, rotates counterclockwise as viewed from the posterior.
https://doi.org/10.7554/eLife.32506.008
Figure 1—video 3
Wild-type hindgut epithelial cell movement in the dorsal side.
Cell nuclei were visualized bybyn-Gal4 and UAS-redstinger. Three central columns of cells are marked by colored circles. Cells slid leftward.
Figure 1—video 4
Wild-type hindgut epithelial cell movement in the ventral side.
Cell nuclei were visualized bybyn-Gal4 and UAS-stinger. Three central columns of cells are marked by colored circles. Cells slid leftward (to the right in the movie).
Figure 2 with 3 supplements
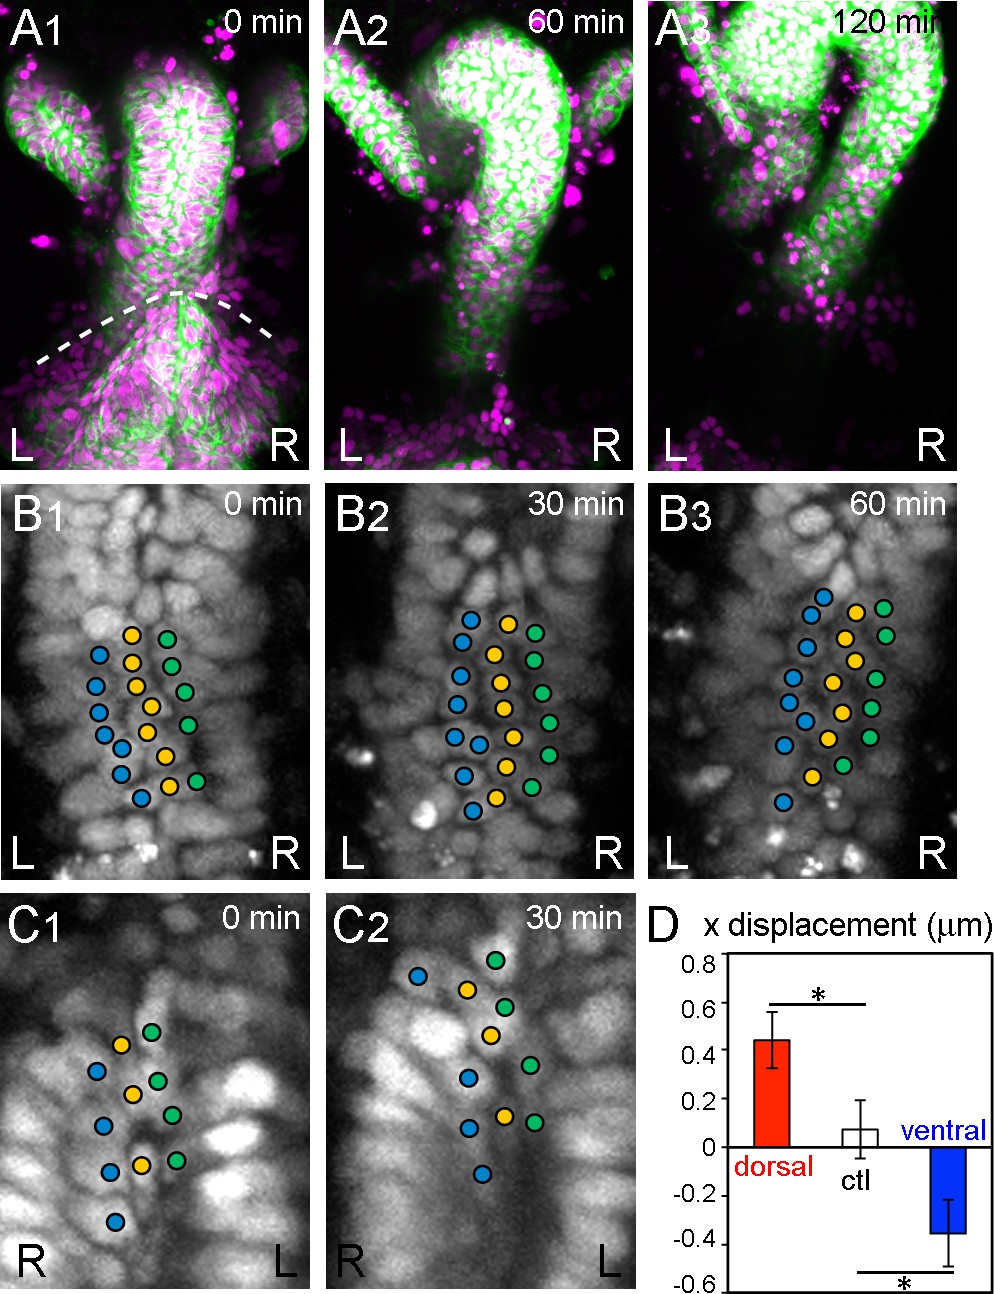
During inverted rotation in Myo31DF mutants, cells slide in the opposite direction to those in wild type.
(A) Cell nuclei and membranes of hindgut epithelial cells in Myo31DF mutants were visualized as in Figure 1. The rotation started at late stage 12, as judged by the position of the germ band (dashed line in A1). Myo31DF embryos show inverted rotation of the hindgut (A2). After rotation, the hindgut shows a leftward-pointing hook shape (A3). Time after the start of rotation is indicated at upper right. (B, C) Cell movement on the dorsal (B) and ventral (C) sides of the hindgut in Myo31DF mutants. Cells slide rightward on both the dorsal and ventral sides. (D) Quantification of the cell movement in Myo31DF mutants as calculated in Figure 1F. Dorsal cells showed plus directional movement (red bar, n = 134, N = 5) while ventral cells showed minus directional movement (blue bar, n = 40, N = 6), indicating that the cells on both sides moved rightward, which is opposite to the wild-type cell movement. Cells in the rectum region were used as a control (ctl) (open bar, n = 129, N = 5). Error bars indicate SEM. *, p<0.05. For all images, anterior is up. L, left; R, right.
-
Figure 2—source data 1
Source data for Figure 2D.
- https://doi.org/10.7554/eLife.32506.012
Figure 2—video 1
Myo31DFmutant hindgut visualized by UAS-myr-GFP (membrane in green) and UAS-redstinger(nuclei in magenta) driven bybyn-Gal4, rotates clockwise as viewed from the posterior.
https://doi.org/10.7554/eLife.32506.013
Figure 2—video 2
Myo31DFmutant hindgut epithelial cell movement in the dorsal side.
Cell nuclei were visualized bybyn-Gal4 and UAS-redstinger. Three central columns of cells are marked by colored circles. Cells slid rightward.
Figure 2—video 3
Myo31DFmutant hindgut epithelial cell movement in the ventral side.
Cell nuclei were visualized bybyn-Gal4 and UAS-redstinger. Three central columns of cells are marked by colored circles. Cells slid rightward (to the left in the movie).
Figure 3 with 4 supplements
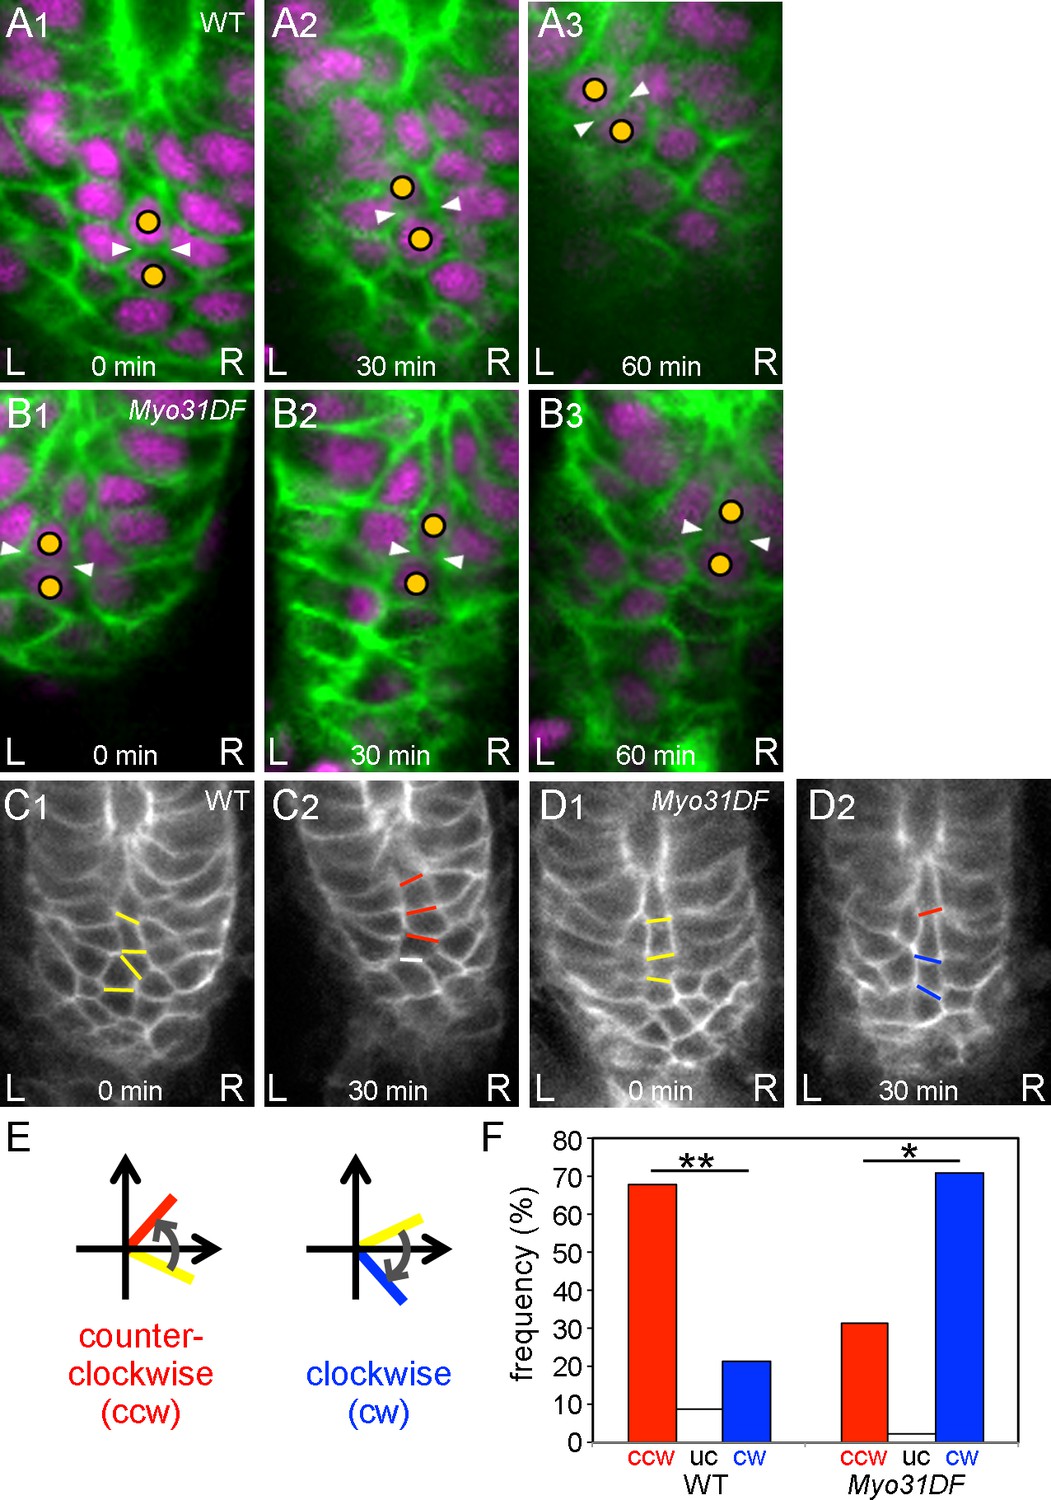
Chiral cell-shape change but not junctional remodeling could contribute to directional cell sliding.
(A,B) Still shots of cell nuclei (magenta) and boundaries (green) of wild-type (A) and Myo31DF (B) hindgut epithelial cells visualized as in Figure 1A. Cells maintained their junctions (white arrowheads) during sliding. (C,D) Angle change of the cell boundaries during rotation in the wild-type (C) and Myo31DF (D) hindgut. Initial cell boundaries are shown in yellow. Boundaries tilting in a counter-clockwise direction (ccw) are shown in red, while those in a clockwise direction (cw) are in blue. White bars show unchanged (uc) boundaries. (E) Schemes for boundary tilting. (F) Frequency of boundaries showing ccw, uc, and cw in the wild-type (n = 55, N = 5) and Myo31DF hindgut (n = 50, N = 5). **, p<0.01, *, p<0.05. For all images, anterior is up. A, anterior; P, posterior; L, left; R, right.
-
Figure 3—source data 1
Source data for Figure 3C,D.
- https://doi.org/10.7554/eLife.32506.018
Figure 3—figure supplement 1

Cell intercalation during LR asymmetric rotation of the hindgut is bidirectional.
(A, B) Cell nuclei (magenta) and boundaries (green) of wild type (A) and Myo31DF mutant (B) hindgut epithelial cells were visualized as in Figure 1A. Cells that were initially in contact with each other (yellow circles) were separated by an intervening cell (black circles). In wild type and Myo31DF mutants, no significant LR bias in the direction of intercalation was detected, as shown in Table 1. (C, D) Frequencies of angles of cell boundaries undergoing cell rearrangements in wild type (C) (n = 14, N = 5) and Myo31DF mutants (D) (n = 18, N = 7). For all images, anterior is up. L, left; R, right.
Figure 3—video 1
Tracking of two nuclei marked by yellow circles and an in-between boundary of wild-type hindgut epithelial cell.
Cell nuclei and boundaries were visualized by UAS-redstinger(magenta) and UAS-myr-GFP(green) driven bybyn-Gal4, respectively.
Figure 3—video 2
Tracking of two nuclei marked by yellow circles and an in-between boundary ofMyo31DFmutant hindgut epithelial cell.
Cell nuclei and boundaries were visualized by UAS-redstinger(magenta) and UAS-myr-GFP(green) driven bybyn-Gal4, respectively.
Figure 3—video 3
Dynamic distribution of MyoII visualized by sqhGFP in the wild-type hindgut epithelial cells.
We performed live imaging of MyoII using UAS-sqhGFP driven by byn-gal4 to visualize the medial and junctional MyoII in the apical regions of hindgut epithelial cells.
Figure 4 with 6 supplements
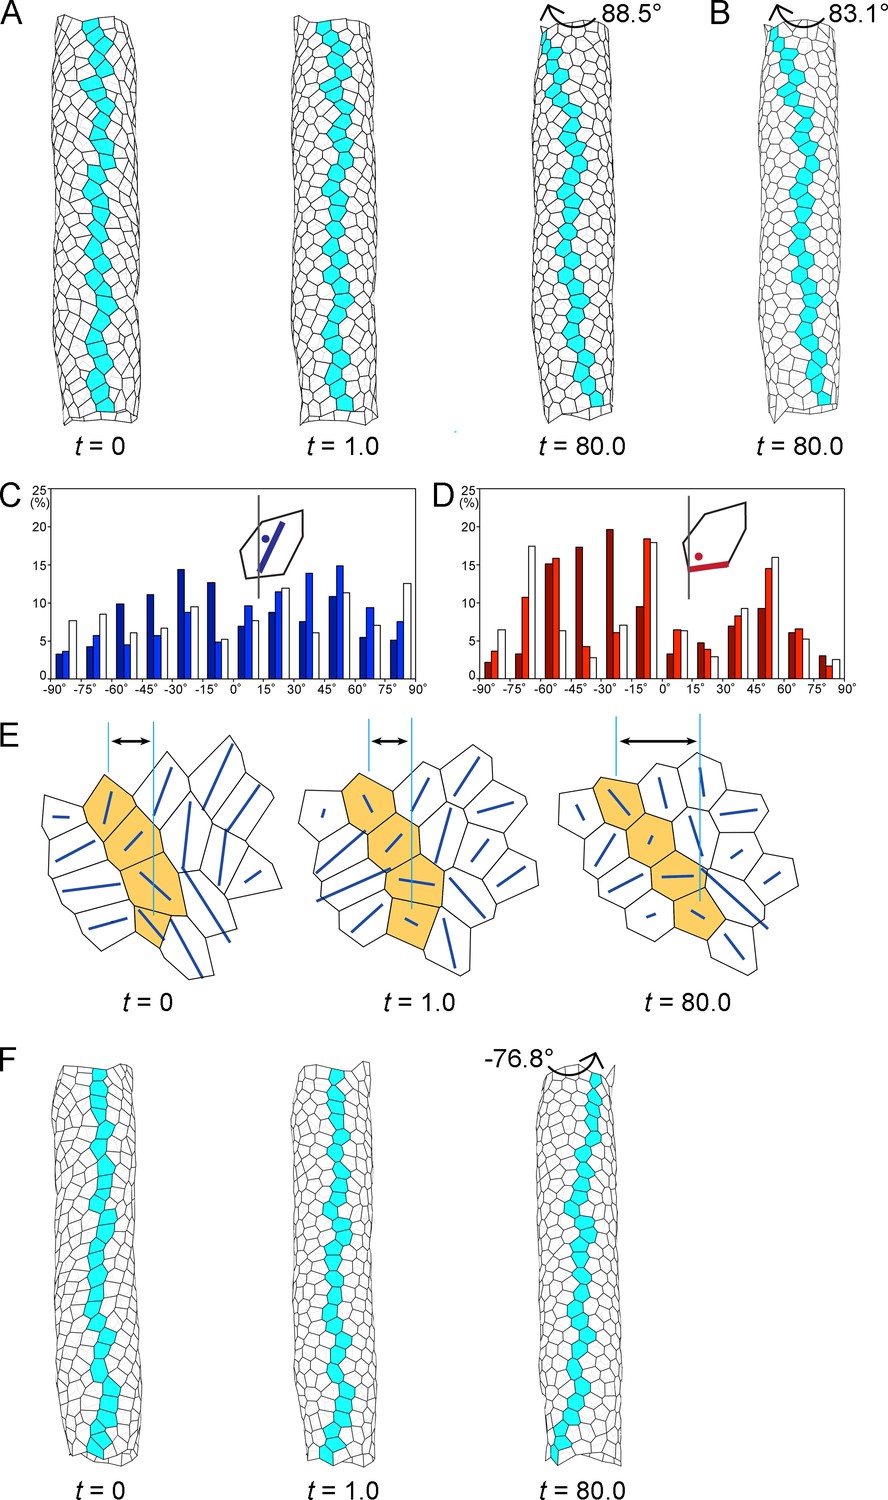
Computer simulation of the hindgut epithelial tube using a 3D cell-based vertex model for tissues and cell chirality, recapitulating the in vivo situation.
(A) Still shots of the twisting tube in a left-handed screw (its tip is oriented anteriorly). Twist angles were 10.7° (t = 1.0) and 88.5° (t = 80.0). Cells in a line along the tube length were colored blue to show the twisting. (B) A computer simulation without reconnection of vertices. The model tube still rotated to a similar extent as that with reconnection. Twist angle was 83.1° (t = 80.0). (C, D) Distributions of the directions of polygon axes (C) and edges (D) in the simulation. Dark, light, and white columns denote data at t = 0, 1.0, and 80.0, respectively. Polygons projected on a cylindrical surface were used for this analysis as described in the Methods. Ordinate, percentage of angle distribution. Abscissa, angle θ, −90 to 90°. The axis of the polygon was the major axis of an ellipse of inertia, which was an approximation of a polygon. (E) Polygonal patterns (t = 0, 1.0, and 80.0) projected on a flat plane as described in Methods. An array of four polygons colored orange show a leftward tilt during t = 0–80.0. Blue lines show the direction of the polygon axis (the major axis of a momental ellipse). The length of the blue line shows the degree of deviation of the polygon from a circular shape. Vertical turquois lines indicate the center of the top and bottom orange-colored cells, and arrows indicate the degree of cell sliding during the rotation. (F) A model for inverted rotation in which enantiomorphic cell chirality was introduced. Twist angles were −13.5° (t = 1.0) and −76.8° (t = 80.0), respectively. In A,B,E,F ‘t’ represents the number of simulation steps.
-
Figure 4—source data 1
Source data for Figure 4C,D.
- https://doi.org/10.7554/eLife.32506.029
Figure 4—figure supplement 1
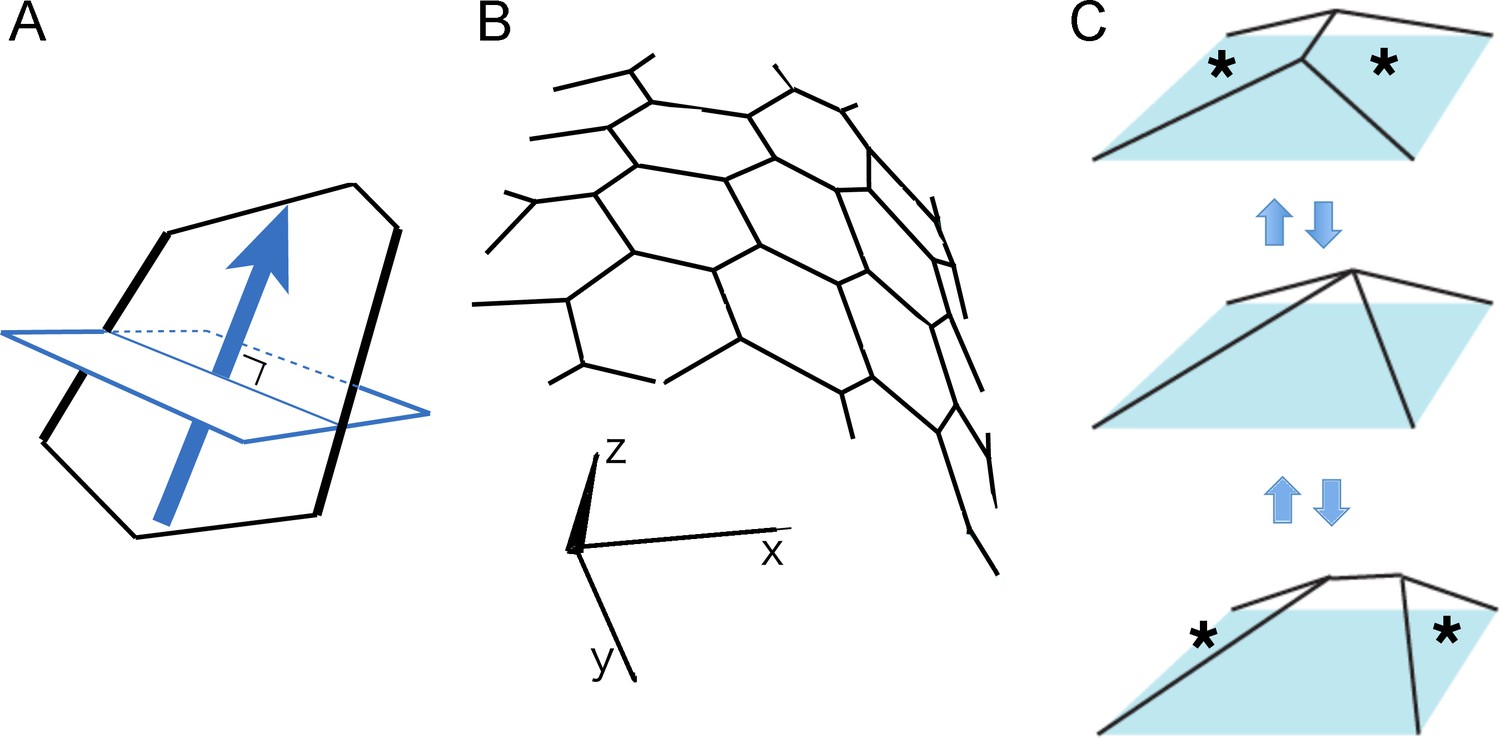
Principles of our 3D cell-based vertex model for a tissue.
(A) Determination of two specific edges by cell polarity. A plane (blue rectangle) was defined that was perpendicular to the polarity direction (blue arrow) and included the polygon center. The plane crossed two polygon edges (illustrated by thick black lines) to which a stronger contraction was applied. (B) A sheet of polygons in a 3D space. The polygonal pattern was described by the positions of vertices. The 3D positional vectors of the vertices were calculated using the cell-based vertex dynamics for tissues. (C) Reconnection of vertices in 3D space. Neighboring polygons (designated by *) were separated and other neighboring polygons intercalated between them.
Figure 4—figure supplement 2
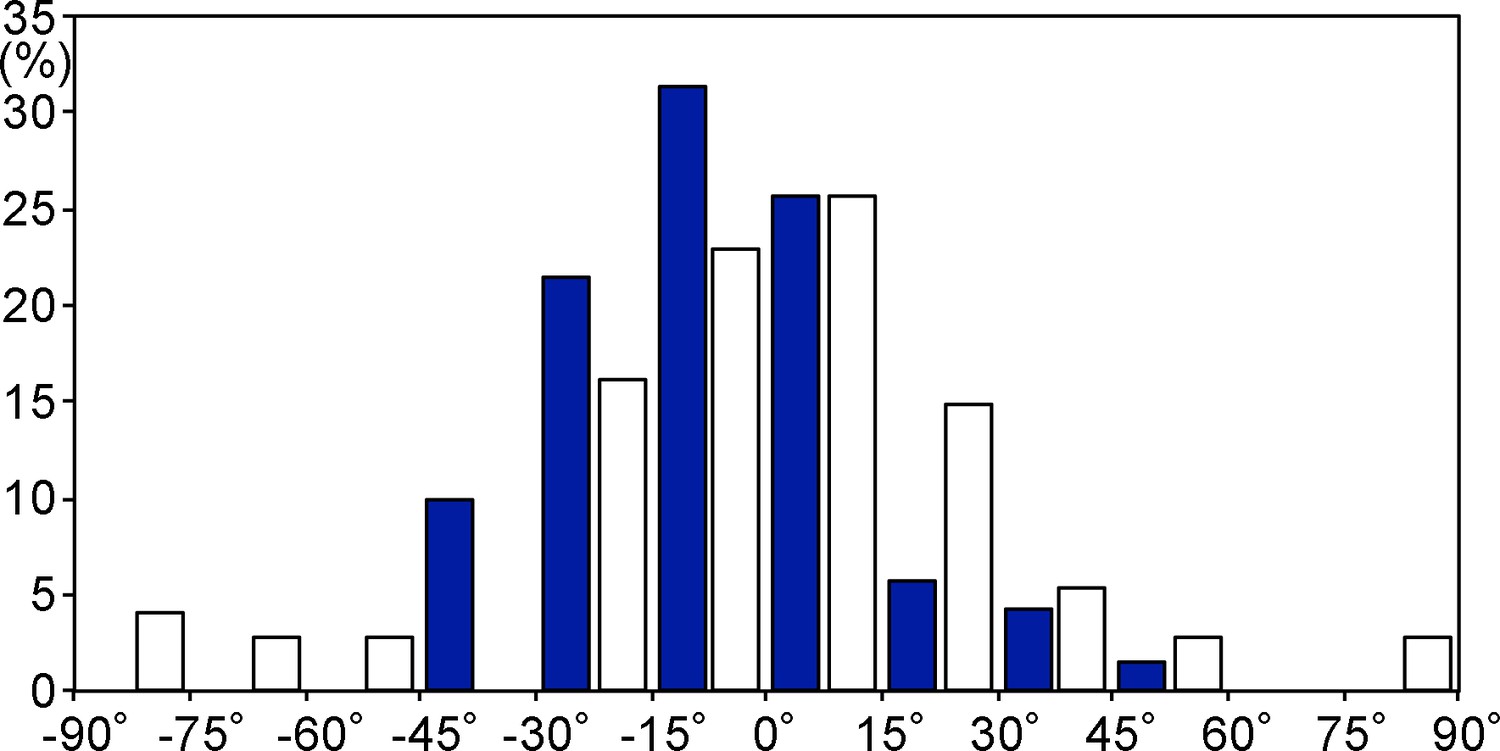
Cell axis distributions of the apical surfaces of hindgut epithelial cells.
Blue and white columns denote data before (n = 70, N = 5) and after (n = 74, N = 6) the rotation, respectively.
Figure 4—figure supplement 3

Vertex model for a tube in which the vertex movement was fixed at both ends.
(A) The initial configuration (t = 0) was the same as in Figure 4A. When the vertices at the top and bottom of the tube were fixed, the tube could not rotate. (B, C) Histograms showing the frequency of polygon axes (B) and edges (C) with each angle against the tube axis in the simulation. Dark, light, and white columns denote data at t = 0, 1.0, and 80.0, respectively. (D) Polygonal patterns (t = 0, 1.0, and 80.0) projected on a flat plane as described in Figure 4E. The chirality decreased, but the polygons did not slide in one direction.
Figure 4—figure supplement 4
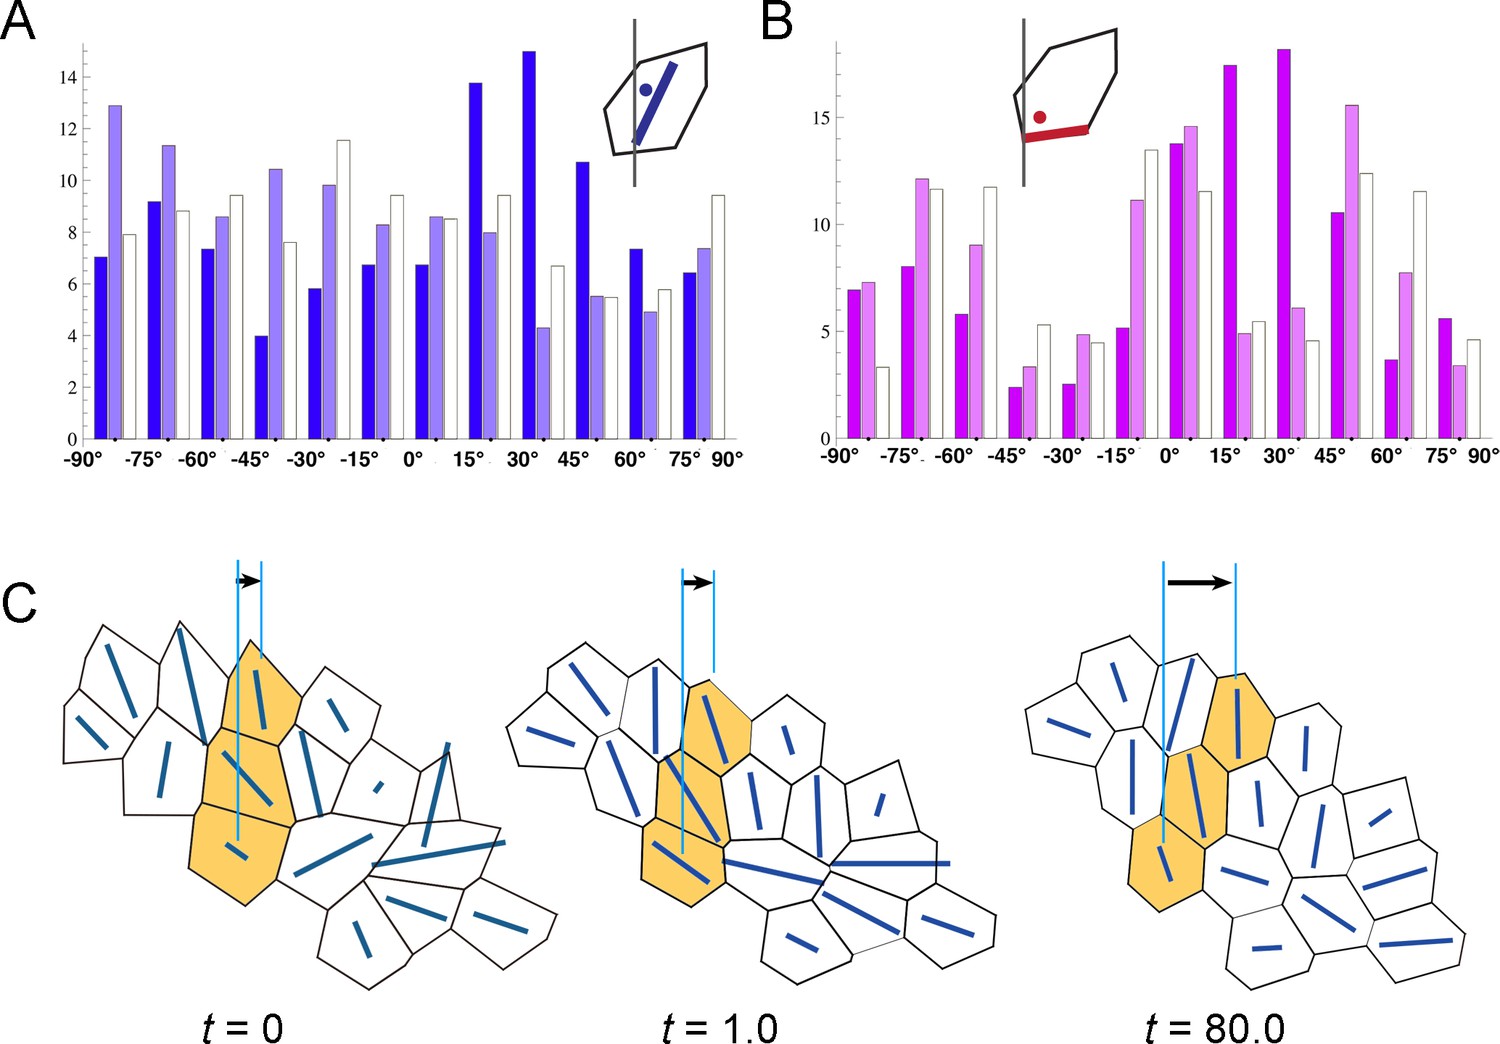
Vertex model for inverted rotation.
(A, B) Histograms showing the frequency of polygon axes (A) and edges (B) with each angle against the tube axis in the simulation of inverted rotation (see Figure 4F). Dark, light, and white columns denote data at t = 0, 1.0, and 80.0, respectively. An initial rightward biased distribution of polygon axes and edges became neutral after the rotation. (C) Polygonal patterns (t = 0, 1.0, and 80.0) projected on a flat plane as described in Figure 4E. Polygons changed their relative positions in a rightward direction.
Figure 4—video 1
Computer simulation of wild-type hindgut rotation using a 3D cell-based vertex model for tissues.
Hindgut epithelial cells were represented by polygons with wild-type chirality. By dissolving the cell chirality, the model gut tube rotate counterclockwise. Cells in a line along the tube length were colored blue to show the twisting.
Figure 4—video 2
Computer simulation of Myo31DFmutant hindgut rotation using a 3D cell-based vertex model for tissues.
Hindgut epithelial cells were represented by polygons with inverted chirality. By dissolving the cell chirality, the model gut tube rotate clockwise. Cells in a line along the tube length were colored blue to show the twisting.
Tables
Table 1
Frequency of cell-intercalation events.
https://doi.org/10.7554/eLife.32506.022| Genotype | Frequency of intercalation (%) | n | ||
|---|---|---|---|---|
| Leftward | Rightward | Total | ||
| +/+ | 4.0 | 4.8 | 9.2* | 250 |
| Myo31DF | 2.2 | 3.3 | 6.0* | 182 |
-
Frequency is defined as the number of intercalation events divided by the total number of examined cells, in 30 min.
When two cells in a column had initial contact and were subsequently separated by another intervening cell, cell intercalation was said to occur, and the direction from which the intervening cell came was determined.
-
*includes one event that was not distinguished as leftward or rightward.
-
Table 1-source data 1
Source data for Table 1.
- https://doi.org/10.7554/eLife.32506.023
Key resources table
| Reagent type (species) or resource | Designation | Source or reference | Identifiers | Additional information |
|---|---|---|---|---|
| Strain, strain background (D. melanogaster) | byn-Gal4 | Iwaki and Lengyel (2002), PMID:12175491 | ||
| Strain, strain background (D. melanogaster) | UAS-redstinger | Bloomington Drosophila Stock Center | BDSC Cat# 8547, RRID:BDSC_8547 | |
| Strain, strain background (D. melanogaster) | UAS-stinger | Bloomington Drosophila Stock Center | BDSC Cat# 28845, RRID:BDSC_28845 | |
| Strain, strain background (D. melanogaster) | UAS-myrGFP (JFRC29) | Pfeiffer et al. (2012), PMID: 22493255 | ||
| Strain, strain background (D. melanogaster) | UAS-NLS-tdTomato | this study | An NLS-tdTomato fragment obtained from pQC NLS TdTomato IX (Addgene, #37347) was cloned into 20 × UAS vector. Insertion site is attP2. | |
| Strain, strain background (D. melanogaster) | UAS-sqhGFP | this study | A sqhGFP fragment obtained from a sqhGFP fly strain (BL 57144) was cloned into pUAST (Brand and Perrimon, 1993). Random insertion. | |
| Strain, strain background (D. melanogaster) | Myo31DFL152 | Hozumi et al. (2006), PMID: 16598258 |
Additional files
-
Transparent reporting form
- https://doi.org/10.7554/eLife.32506.032
Download links
A two-part list of links to download the article, or parts of the article, in various formats.
Downloads (link to download the article as PDF)
Open citations (links to open the citations from this article in various online reference manager services)
Cite this article (links to download the citations from this article in formats compatible with various reference manager tools)
Chiral cell sliding drives left-right asymmetric organ twisting
eLife 7:e32506.
https://doi.org/10.7554/eLife.32506


