Pauses in cholinergic interneuron firing exert an inhibitory control on striatal output in vivo
- Okinawa Institute of Science and Technology Graduate University, Japan
Figures
Figure 1 with 3 supplements
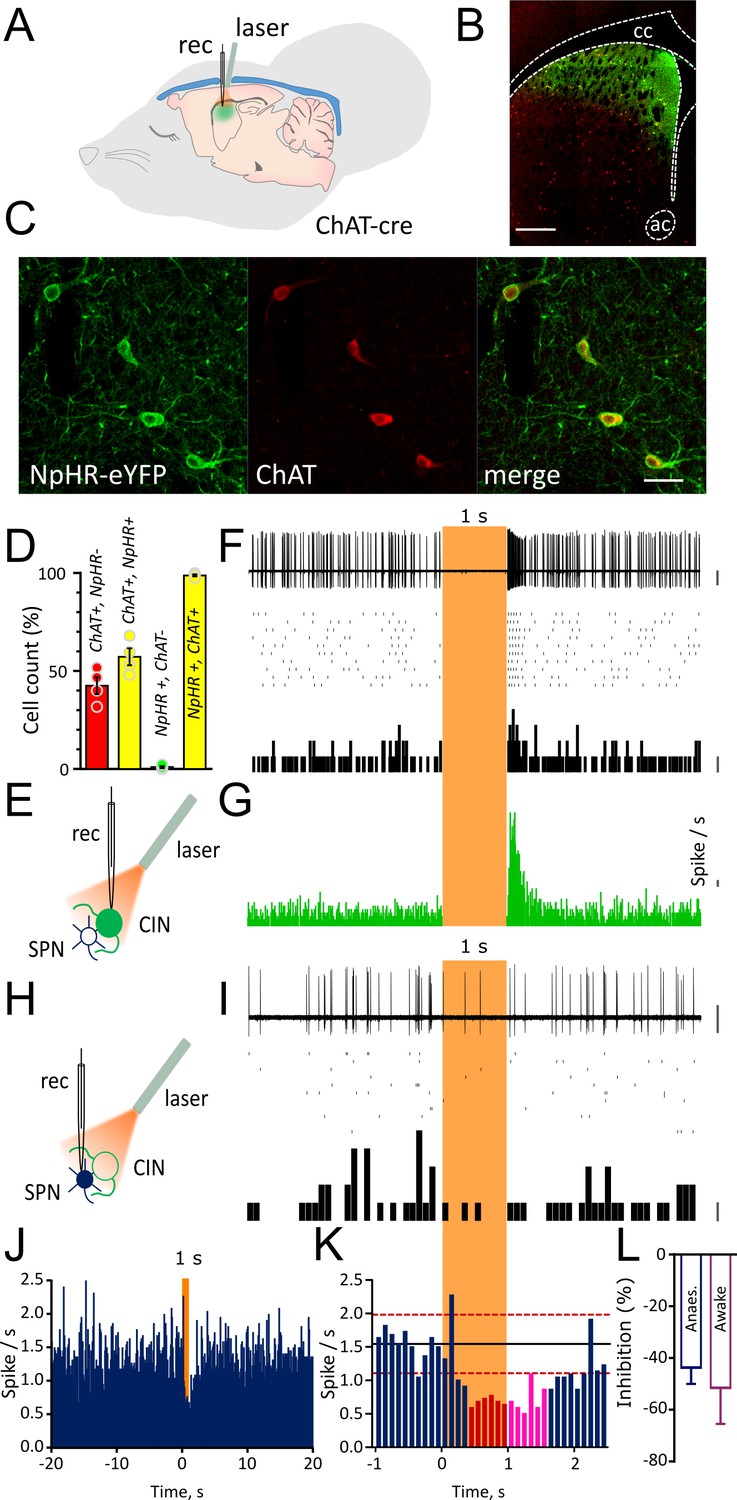
Light-induced pause in CINs inhibit spontaneous firing of SPNs in vivo.
(A) Schematic illustration of the optogenetic approach and in vivo recordings in the anaesthetized mouse. (B) Confocal fluorescent image of a coronal section of the striatum confirming cell-specific expression of NpHR-eYFP (green) in ChAT positive cells (red) restricted to dorsal striatum. Scale bar = 500 µm. cc: corpus callosum; ac: anterior commissure (C) Magnified area from (B) showing co-localization of NpHR-eYFP (green) and anti-ChAT (red) scale bar = 50 µm. (D) Bar graph summarizing the quantifications to show transduction level (left two bars) and high-specificity (right two bars) of NpHR in CINs in the dorsal striatum. (E) Experimental configuration for recording opto-tagged CINs in vivo. (F) Superimposed traces of a juxtacellular recording showing light-induced pause in their spontaneous firing (top) and relative raster plot (middle) and PSTH (bottom) PSTH calibration: 1 spike/bin. (G) PSTH of all CINs showing complete silencing during light (1 s) and rebound firing immediately after the light. (bin = 10 ms, N/n = 14/16) PSTH calibration: 1 spike/s. (H) Experimental configuration for juxtacellular recordings from SPNs during light-induced pauses of CINs. (I) Superimposed traces of a representative unit obtained from a SPN (top) and relative raster plot (middle) and PSTH (bottom). (J) PSTH of all SPNs showing the inhibition of firing during 1 s light pulse (bin = 100 ms; N/n = 18/22). (K) Magnified PSTH from J to show onset of significant inhibition during light pulse. Black line indicates the mean number of spikes in the second before the light. Red dash line indicates ±2 s.D. of the mean number of spikes. Red and magenta indicate significant bins during light pulse and after light offset, respectively. (L) Average firing inhibition measured during light pulse (1 s) in anesthetized (N/n = 18/22) or awake mice (N/n = 6/7). Data are represented as mean ± SEM. N = mice; n = cells. Calibration bar for juxtacellular traces: 2 mV. Orange boxes indicate light on period.
-
Figure 1—source data 1
This spreadsheet contains the quantication of the viral transduction and the firing responses to optogenetic manipulation of the neurons shown in Figure 1.
- https://doi.org/10.7554/eLife.32510.007
Figure 1—figure supplement 1
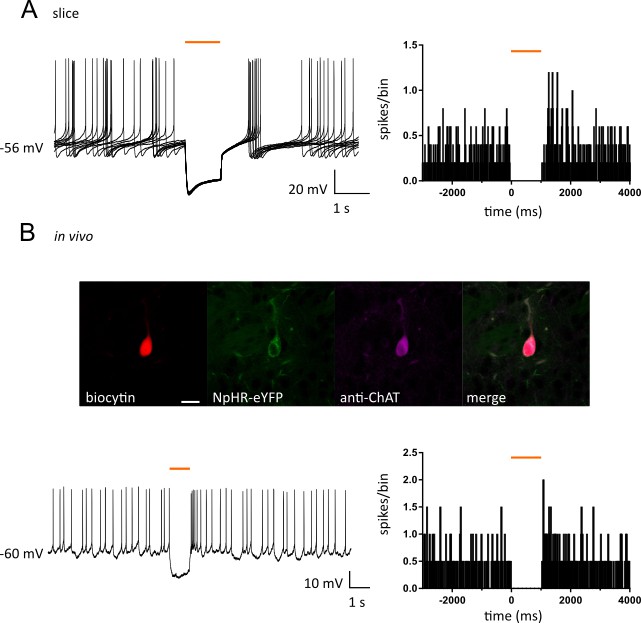
Optogenetic inhibition of CIN firing.
(A) (Left) Superimposed traces obtained in current clamp configuration from a NpHR-eYFP positive CIN in acute slices, showing a large hyperpolarization and firing inhibition, followed by rebound firing in response to 1 s light (530 nm). (Right) PSTH of CINs recorded in acute slices showing complete silencing during light (bin = 10 ms, N/n = 5/5). (B) Top: Confocal fluorescent image of a CIN filled with biocytin during whole cell recording in vivo showing colocalization with expression of NpHR-eYFP and staining of anti-ChAT (Alexa 647). Scale bar = 20 µm. Bottom: (left) current clamp recording obtained from the same CIN in vivo showing a hyperpolarizing current followed by rebound firing in response to 1 s light (593 nm). (Right) PSTH of CINs recorded intracellularly in vivo showing complete silencing during light (bin = 10 ms, N/n = 2/2). N = mice; n = cells.
-
Figure 1—figure supplement 1—source data 1
This spreadsheet contains the firing responses of individual cholinergic neurons in slices and in vivo used to validate the optogenetic approach as shown in the graphs in Figure 1—figure supplement 1.
- https://doi.org/10.7554/eLife.32510.008
Figure 1—figure supplement 2
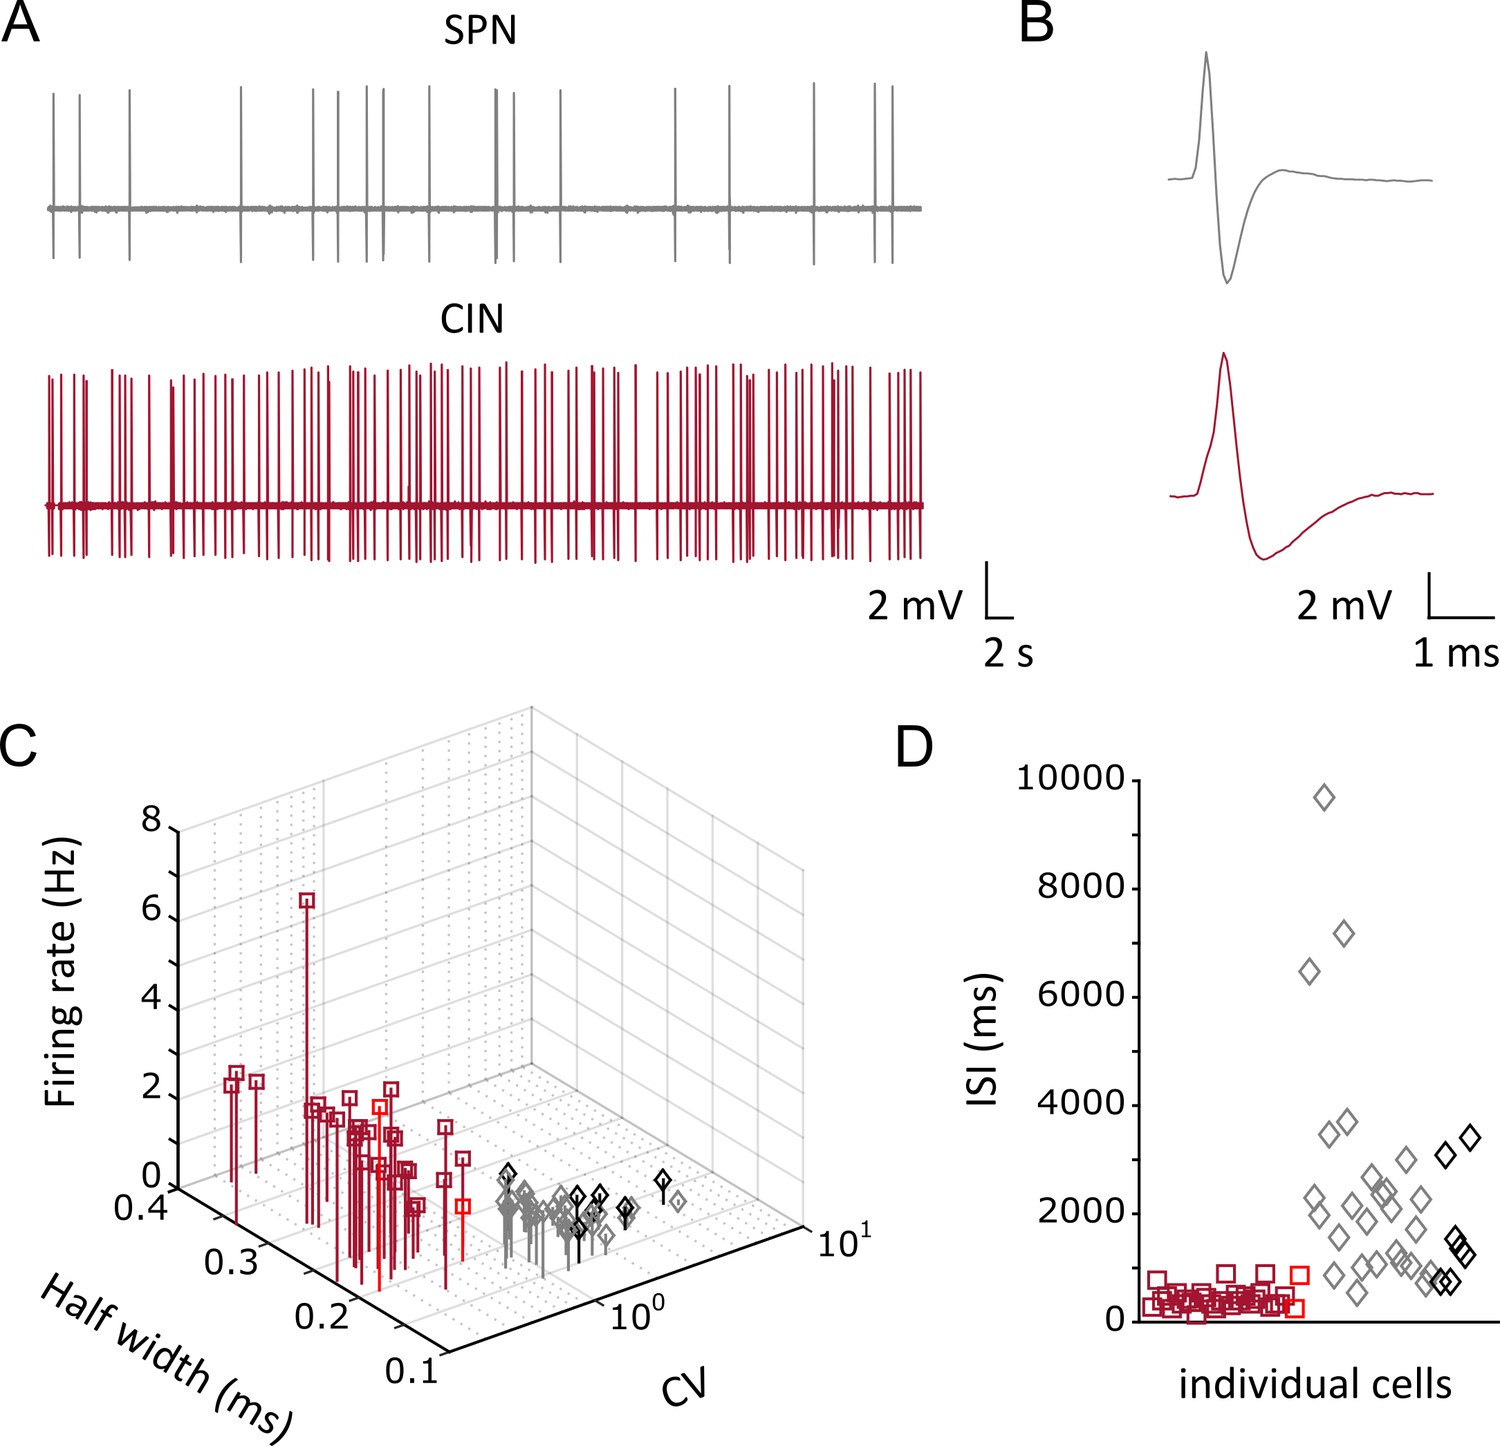
Firing properties of opto-tagged CINs and putative SPNs with juxtacellular recordings.
(A) Representative traces showing firing activity of a single unit obtained from a putative SPN (gray) and from an optically identified CIN (maroon). (B) Average action potential waveform showing larger spike width (half-width) in CINs. (C) 3D scatter plot of firing properties of single units showing two distinct clusters corresponding to CINs (N/n = 25/28, anesthetized; N/n = 2/2, awake) and SPNs (N/n = 18/28, anesthetized; N/n = 6/7, awake). The parameters used for the clustering separation appear in Figure 1—figure supplements 2—source data 1. (D) Scatter plot graph showing the interspike interval for each single unit of CINs and SPNs. Red and black symbols in (C) and (D), represent units recorded in awake head fixed configuration. N = mice; n = cells.
-
Figure 1—figure supplement 2—source data 1
This spreadsheet contains the firing properties for the individual neurons shown in Figure 1—figure supplement 2.
- https://doi.org/10.7554/eLife.32510.009
Figure 1—figure supplement 3
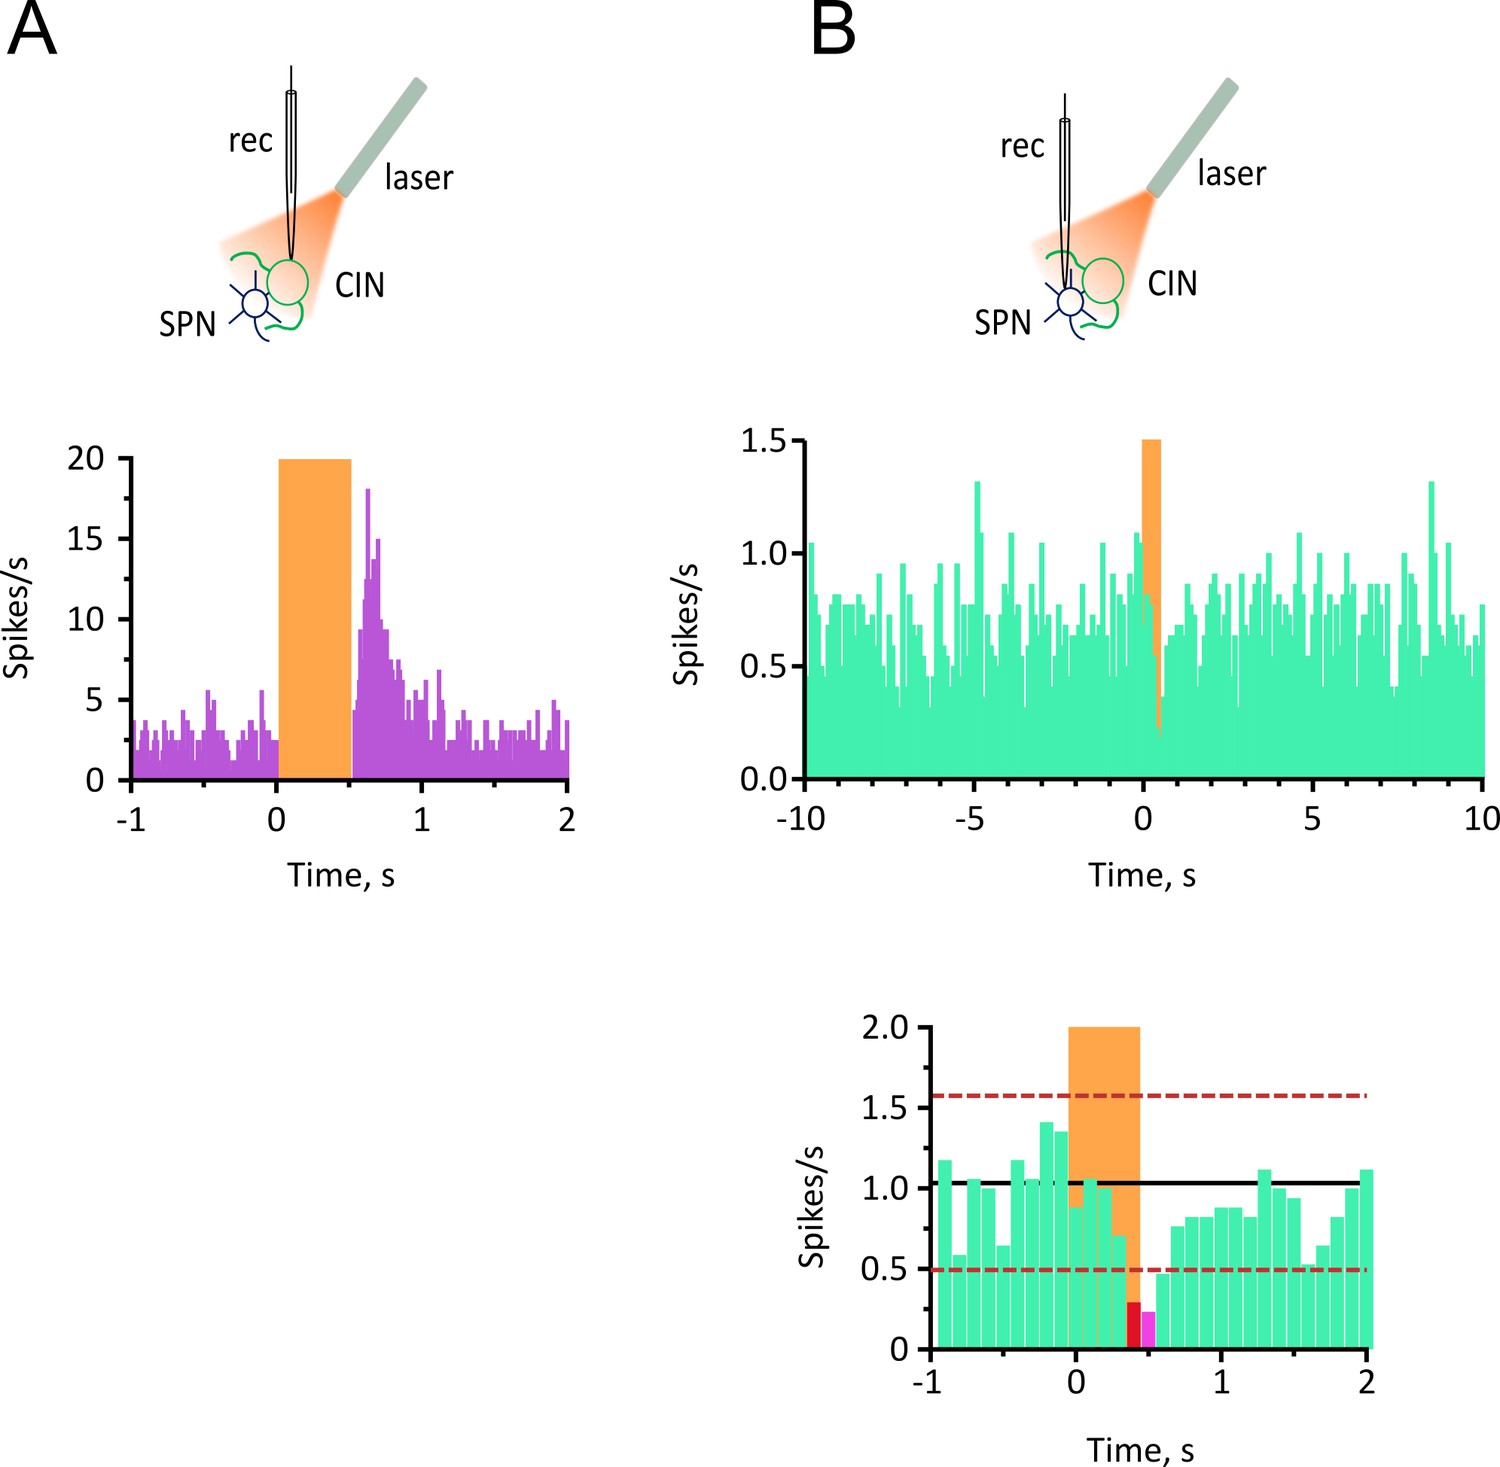
Short pause in CINs does not inhibit spontaneous firing of SPNs in vivo.
(A) Top: Experimental configuration for recording opto-tagged CINs in vivo. Bottom: PSTH of all CINs showing complete silencing during light (0.5 s) and rebound firing immediately after the light. (bin = 10 ms, N/n = 14/16). (B) Top: Experimental configuration for juxtacellular recordings from SPNs during light-induced pauses of CINs. Bottom: PSTH of all SPNs showing the effect on firing during 0.5 s light pulse (bin = 100 ms, N/n = 12/17).
-
Figure 1—figure supplement 3—source data 1
This spreadsheet contains the firing responses to optogenetic manipulations of the individual neurons shown in Figure 1—figure supplement 3.
- https://doi.org/10.7554/eLife.32510.010
Figure 2
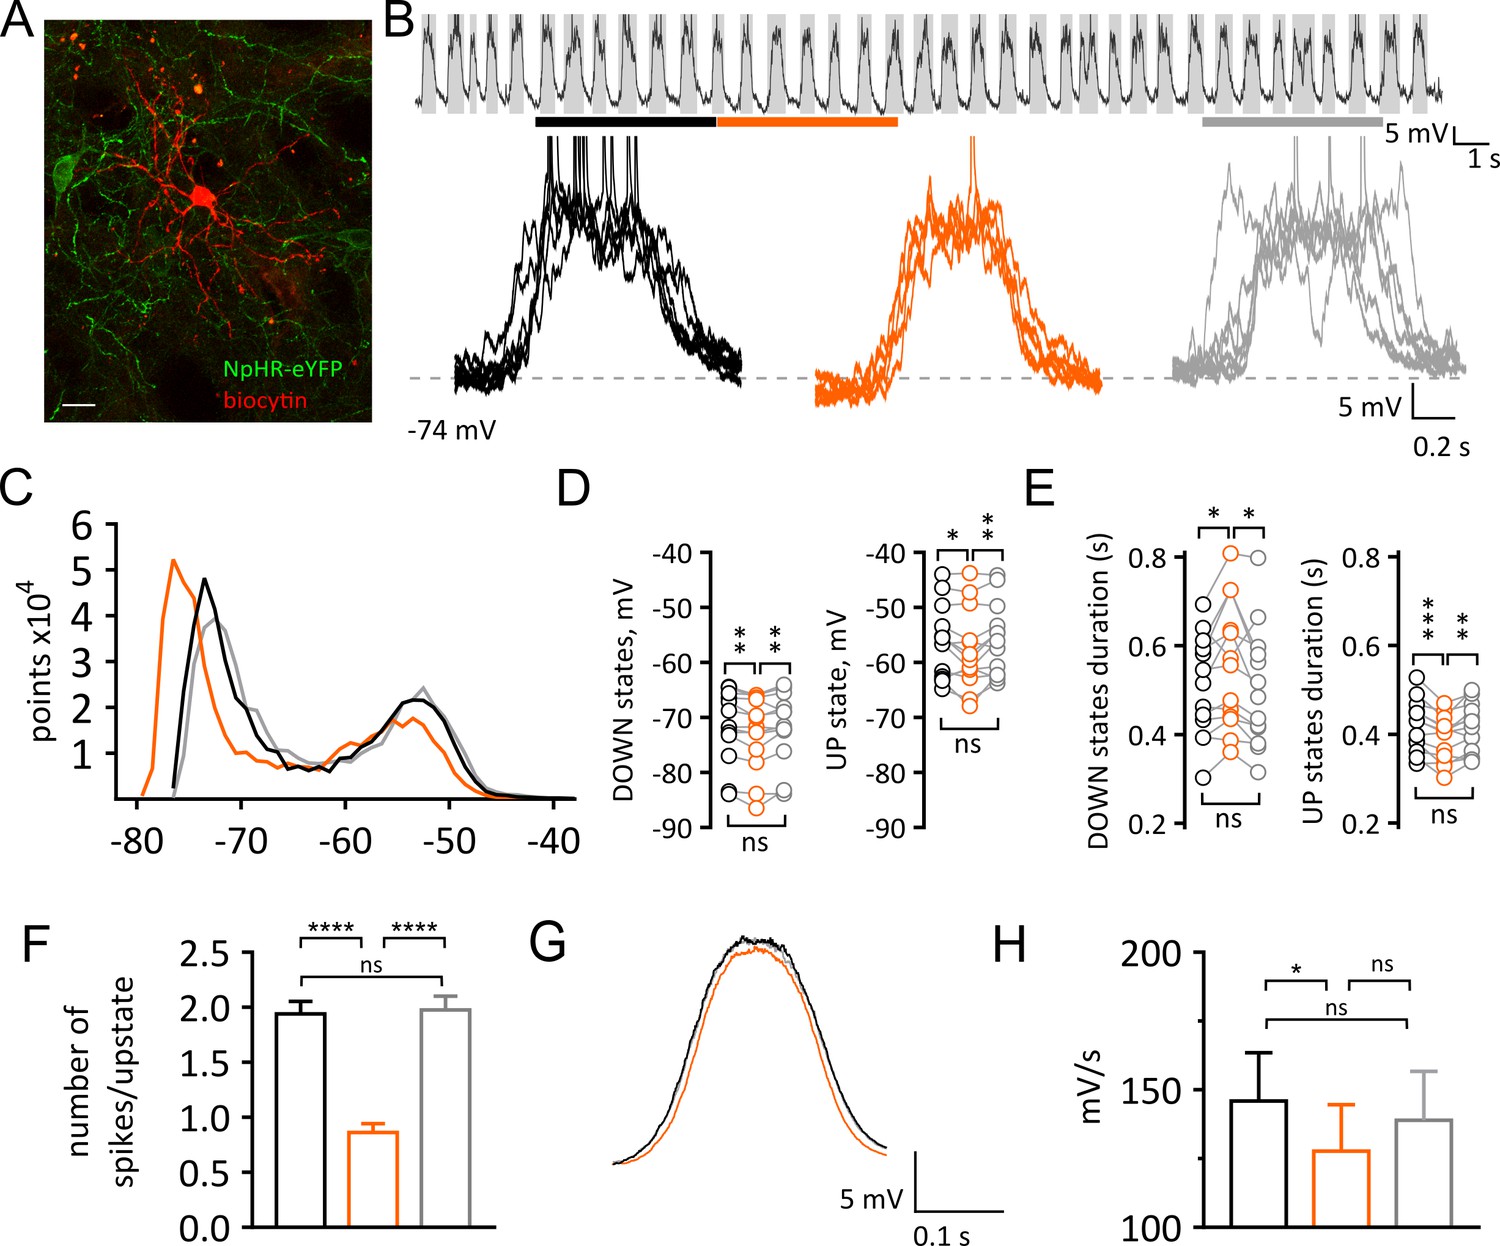
Light-induced pause in CINs alters UP and DOWN states of SPNs in vivo.
(A) Confocal fluorescent image of a biocytin filled SPN (red) during whole cell recording and surrounding CINs expressing NpHR-eYFP (green), scale bar = 20 µm. (B) Top: example trace of a current clamp recording from a SPN showing UP and DOWN membrane fluctuations. Gray boxes define UP states. Bottom: superimposed UP states, each obtained from 5 s time window before, during and after a pause highlighted by black, orange, and gray lines respectively. (C) Representative all points histogram from SPN in (B) showing the effect of a pause on the distributions of membrane potentials. (D) Membrane potential (mV) changes during UP and DOWN states. Tukey's multiple comparisons test for Down states: before vs pause: p=0.0051; pause vs after: p=0.0084. Tukey's multiple comparisons test for UP states: before vs pause: p=0.0456; pause vs after: p=0.0071. (E) Changes in UP and DOWN states duration. Tukey's multiple comparisons test for DOWN states: before vs pause: p=0.0258; pause vs after: p=0.0127. Tukey's multiple comparisons test for UP states: before vs pause: p=0.0003; pause vs after: p=0.0044. (F) The number of action potential occurring during UP states is significantly reduced during a pause; before vs pause: p<0.0001; pause vs after: p<0.0001, by Tukey's multiple comparisons test. (G) Average trace from all UP states occurring before, during and after a pause, showing a slower transition to UP states during a pause. (H) Slope of rising phase of the UP state is significantly slower during a pause; before vs pause: p=0.0113, by Tukey's multiple comparisons test. Data are represented as mean ± SEM. (N/n = 13/13, except for (F) n = number of UP states, see Materials and methods.) N = mice; n = cells. APs are truncated in (B). Time points before, during and after a pause are indicated by black, orange and gray colors respectively; ns = not significant.
-
Figure 2—source data 1
This spreadsheet contains the voltage responses to optogenetic manipulation for the individual neurons shown in Figure 2.
- https://doi.org/10.7554/eLife.32510.012
Figure 3
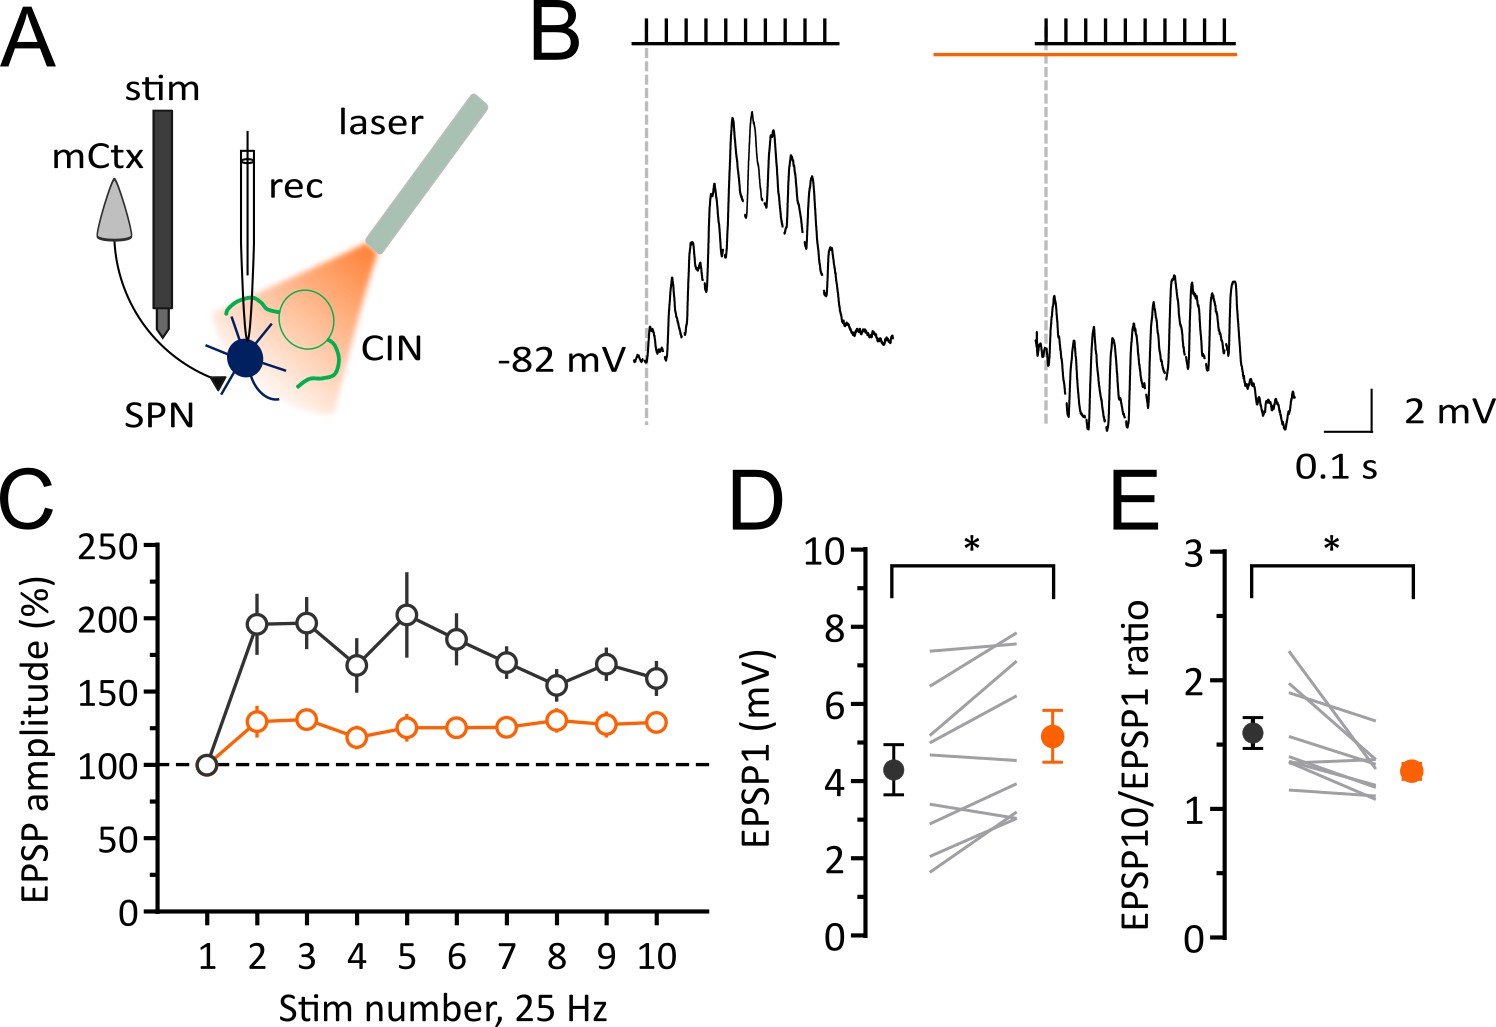
Light-induced pause in CINs decreases corticostriatal plasticity of SPNs in vivo.
Experimental configuration for whole-cell recordings of evoked EPSPs in SPNs during light-induced pauses of CINs. (B) Average trace of whole-cell current-clamp recording of EPSPs elicited by cortical stimulation (10 stimuli, 25 Hz) before (left) and during a pause (right). (C) Pooled data showing that facilitation is attenuated during a pause. (D) The first EPSP amplitude is significantly increased during a pause. (E) The ratio of last and first EPSPs is significantly decreased during a pause. Lines indicate individual cells and filled circles with error bars represent mean ± SEM. (N/n = 9/9) *p<0.05 with paired t-test. N = mice; n = cells.
-
Figure 3—source data 1
This spreadsheet contains the synaptic responses used to generate the graphs shown in Figure 3.
- https://doi.org/10.7554/eLife.32510.014
Figure 4
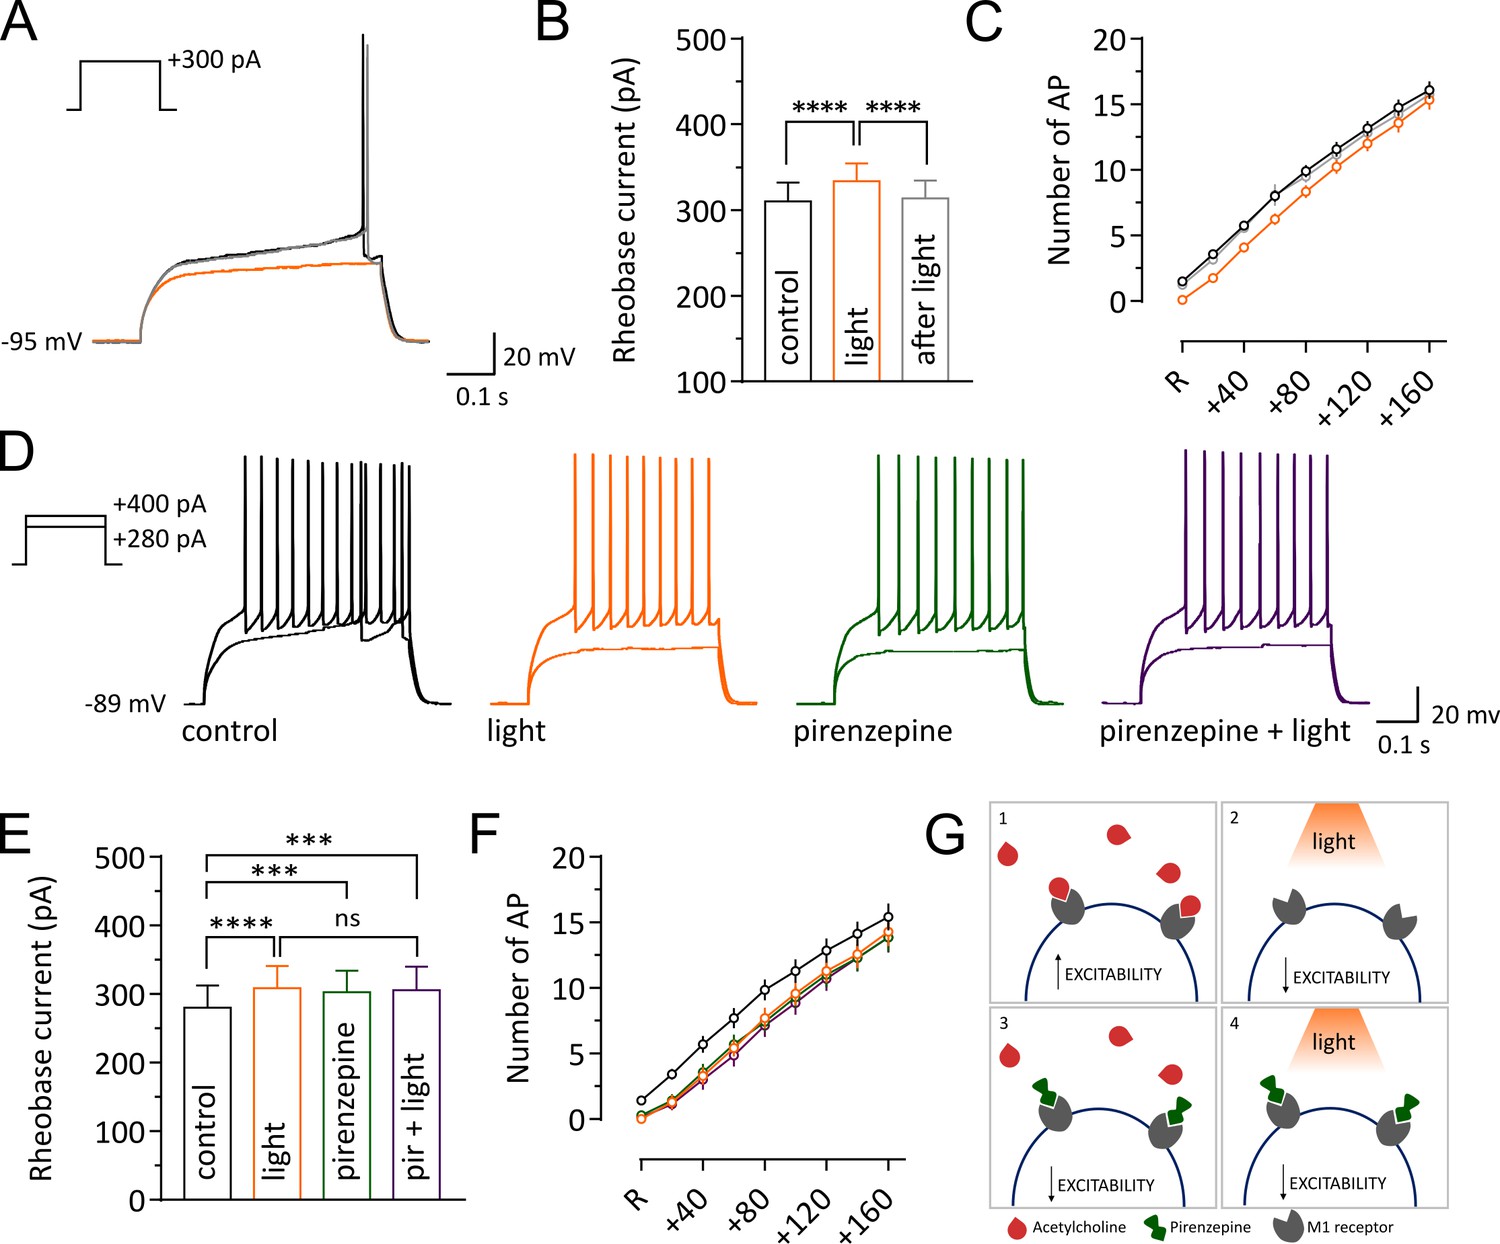
Light-induced pause in CINs decreases intrinsic excitability of SPNs via M1 receptor signaling.
Representative traces of an SPN showing membrane responses to current injections before (black) during (orange) and after a pause (gray). (B, E) Pooled data showing average rheobase current. Before vs pause: p =<0.0001; pause vs after: p =<0.0001, N/n = 8/12 in (B), by Tukey's multiple comparisons test. Before vs pause: p =<0.0001; before vs pirenzepine: p=0.0005; before vs pirenzepine + light: p=0.0001; n = 7 in (E), by Tukey's multiple comparisons test. (C, F) Action potential numbers plotted against current injection (N/n = 8/12 in C; N/n = 6/7 in F). (D) Representative traces of an SPN showing membrane responses under different conditions. (G) Tonic level of acetylcholine control SPNs excitability via activation of muscarinic receptors (1). Light-induced pause lowers acetylcholine (ACh) levels reducing M1 activation and decreasing excitability of SPNs (2). M1 receptors selective antagonist pirenzepine decreases SPNs excitability (3). Pirenzepine occludes the effect of the pause (4). In (C) and (F) R represents the minimum current needed to trigger an action potential in basal conditions. Data are represented as mean ± SEM; ns = not significant. N = mice; n = cells.
-
Figure 4—source data 1
This spreadsheet contains the intrinsic properties and firing responses for the individual neurons shown in Figure 4.
- https://doi.org/10.7554/eLife.32510.016
Additional files
-
Transparent reporting form
- https://doi.org/10.7554/eLife.32510.017
Download links
A two-part list of links to download the article, or parts of the article, in various formats.
Downloads (link to download the article as PDF)
Open citations (links to open the citations from this article in various online reference manager services)
Cite this article (links to download the citations from this article in formats compatible with various reference manager tools)
Pauses in cholinergic interneuron firing exert an inhibitory control on striatal output in vivo
eLife 7:e32510.
https://doi.org/10.7554/eLife.32510


