Resilience of small intestinal beneficial bacteria to the toxicity of soybean oil fatty acids
- Max Planck Institute for Developmental Biology, Germany
- Cornell University, United States
- University of Texas at Austin, United States
- Baylor College of Medicine, United States
- University of Alberta, Canada
Figures
Figure 1 with 1 supplement

L. reuteri is inhibited by 18:2.
(A) Disc diffusion of L. reuteri plated with the FAs of SBO. FAs were dissolved in DMSO to a concentration of 50 mg/ml, except for palmitic acid (16:0), which was dissolved to a concentration of 5 mg/ml. Clearings around the discs indicate growth inhibition. (B) Dose response curve of 18:2 with L. reuteri. IC50 is estimated at 20 μg/ml (p < 0.001). See also Figure 1—figure supplement 1.
Figure 1—figure supplement 1
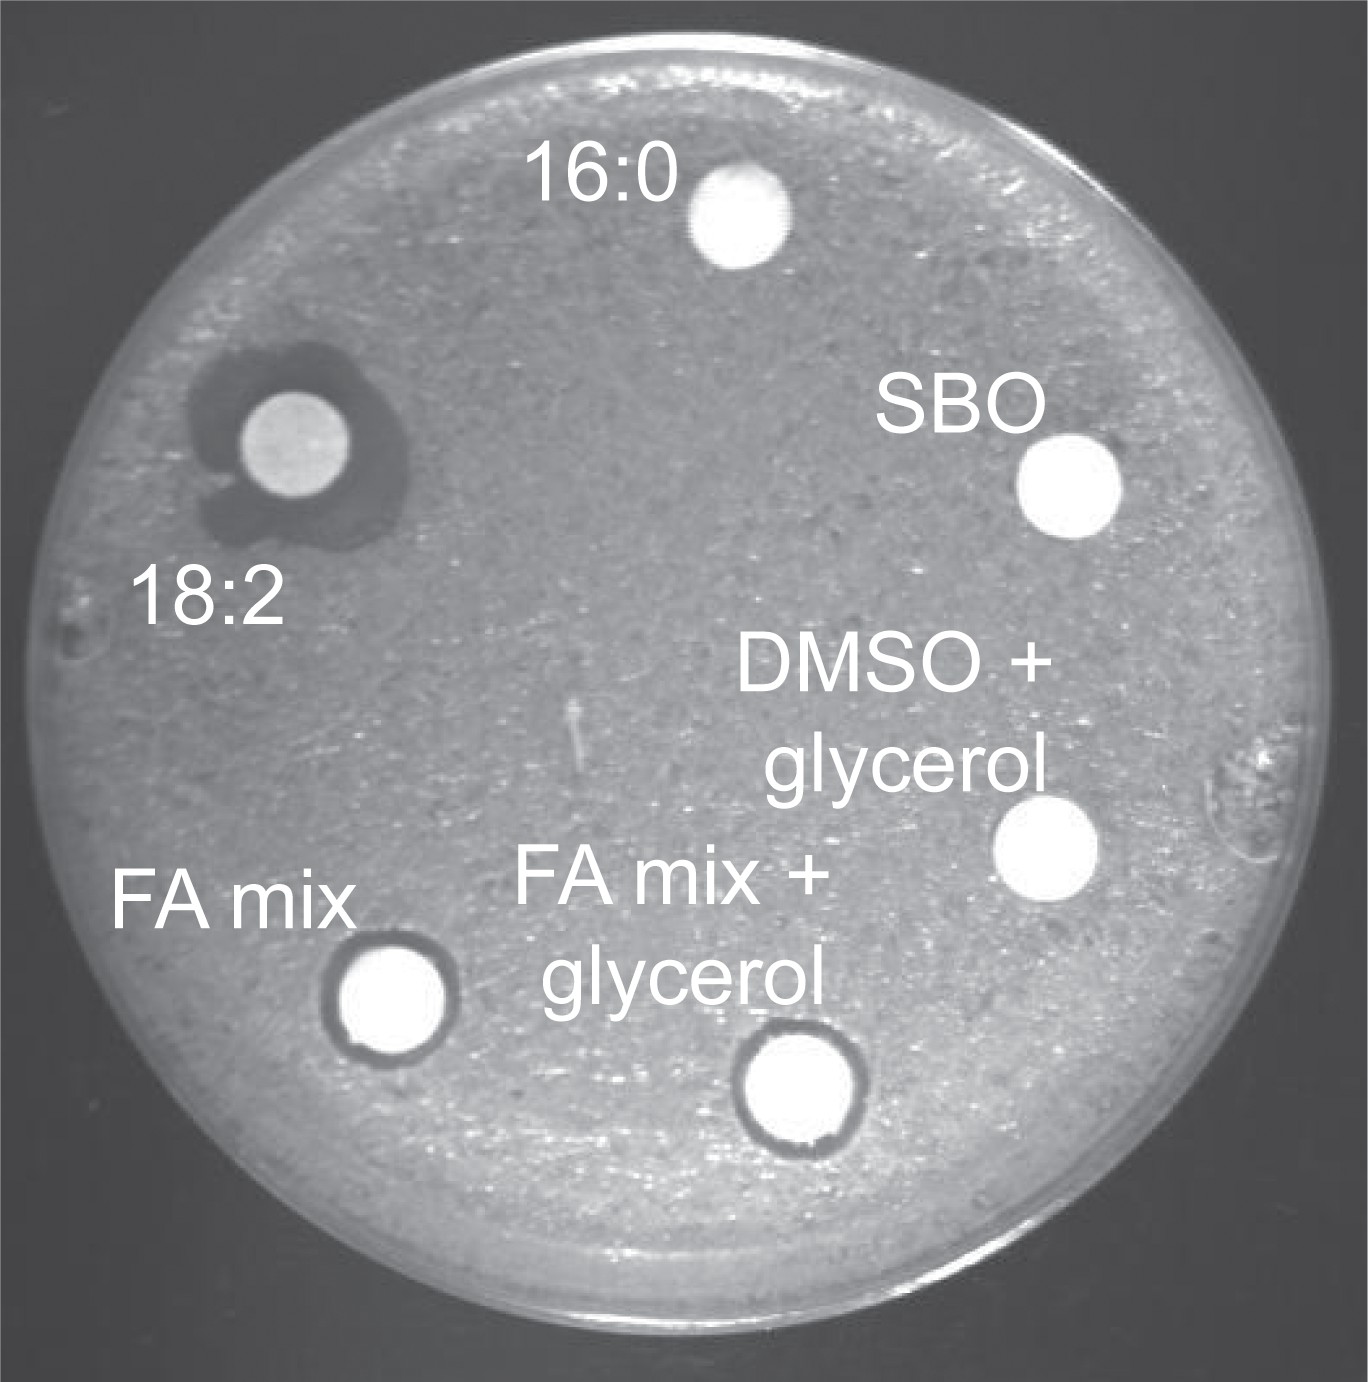
L. reuteri is inhibited by the hydrolysis products of SBO.
Disc diffusion assay of L. reuteri plated with each SBO FA and glycerol mixed to match their composition in soybean oil (FA mix + glycerol). Disc diffusions with 16:0, 18:2, total soybean oil, DMSO and glycerol, and a mix of only the FAs in SBO (FA mix) are shown as controls. Note that the size of a zone of inhibition reflects both the toxicity of the compound as well as the migration of the compound off the disc: the saturated FAs in the FA mix deter migration whereas the unsaturated FAs move well off the disc.
Figure 2 with 1 supplement
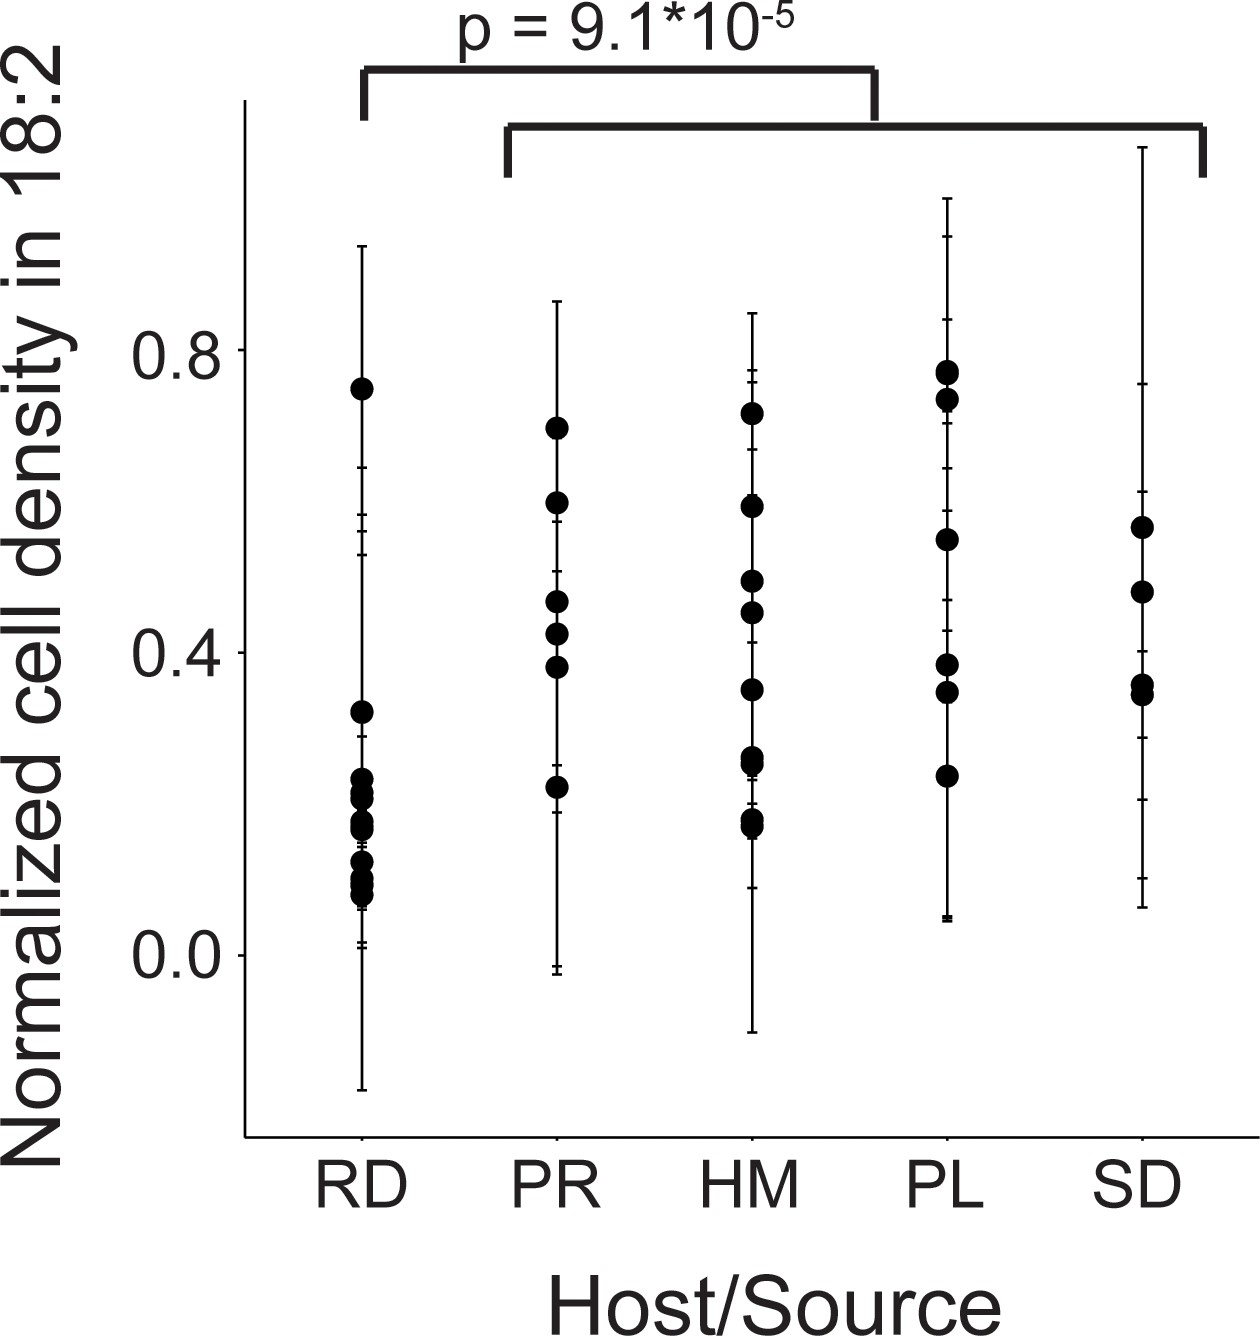
Variation in natural L. reuteri strains’ response to 18:2.
Fourteen rodent (RD), six porcine (PR), nine human (HM), seven poultry (PL), and four sourdough (SD) strains were tested. Standard deviations in normalized cell density in 18:2 are shown. Higher values indicate cellular density achieved in liquid culture is uninhibited by 18:2. Significance was determined by a Kruskal-Wallis test; mean in non-rodents = 0.45, mean in rodents = 0.22. See also Figure 2—figure supplement 1 and Supplementary file 1.
Figure 2—figure supplement 1
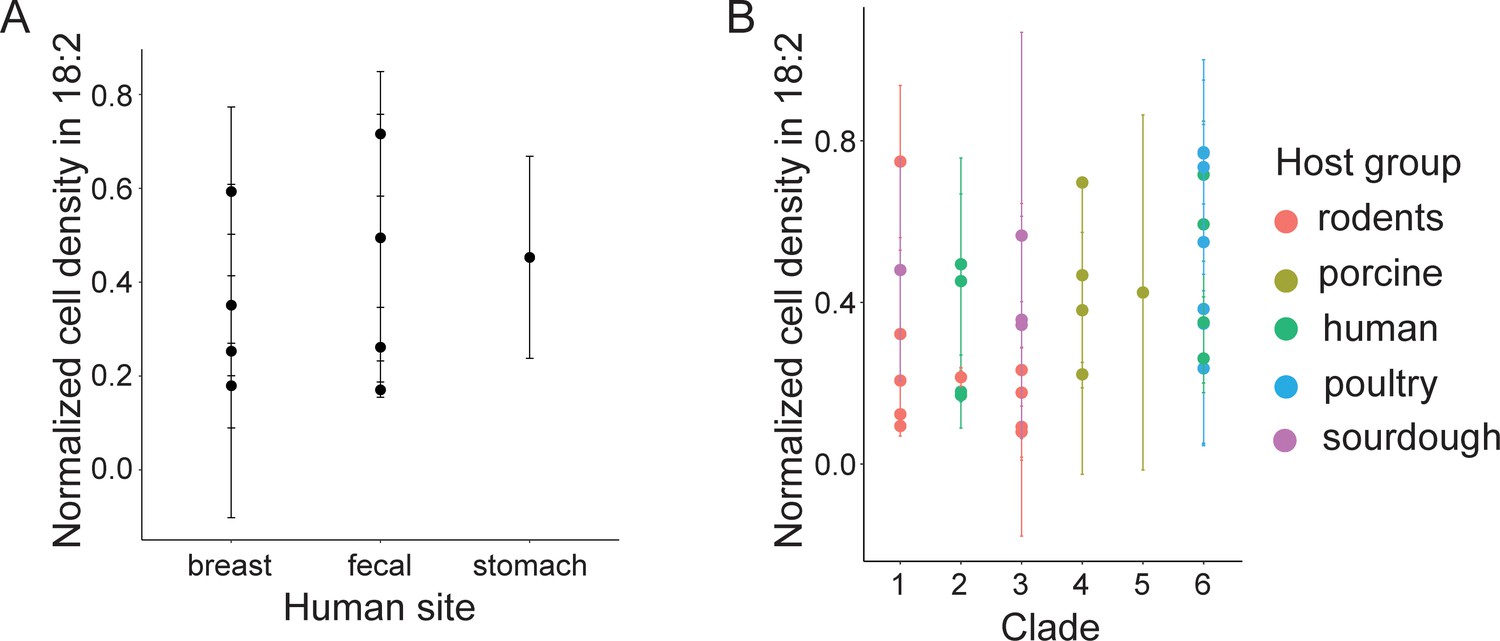
L. reuteri resistance to 18:2 is not related to site of isolation in humans nor phylogenetic clade.
Normalized cell density in 18:2 of human-derived L. reuteri by (A) body site and (B) all strains by clade.
Figure 3 with 2 supplements
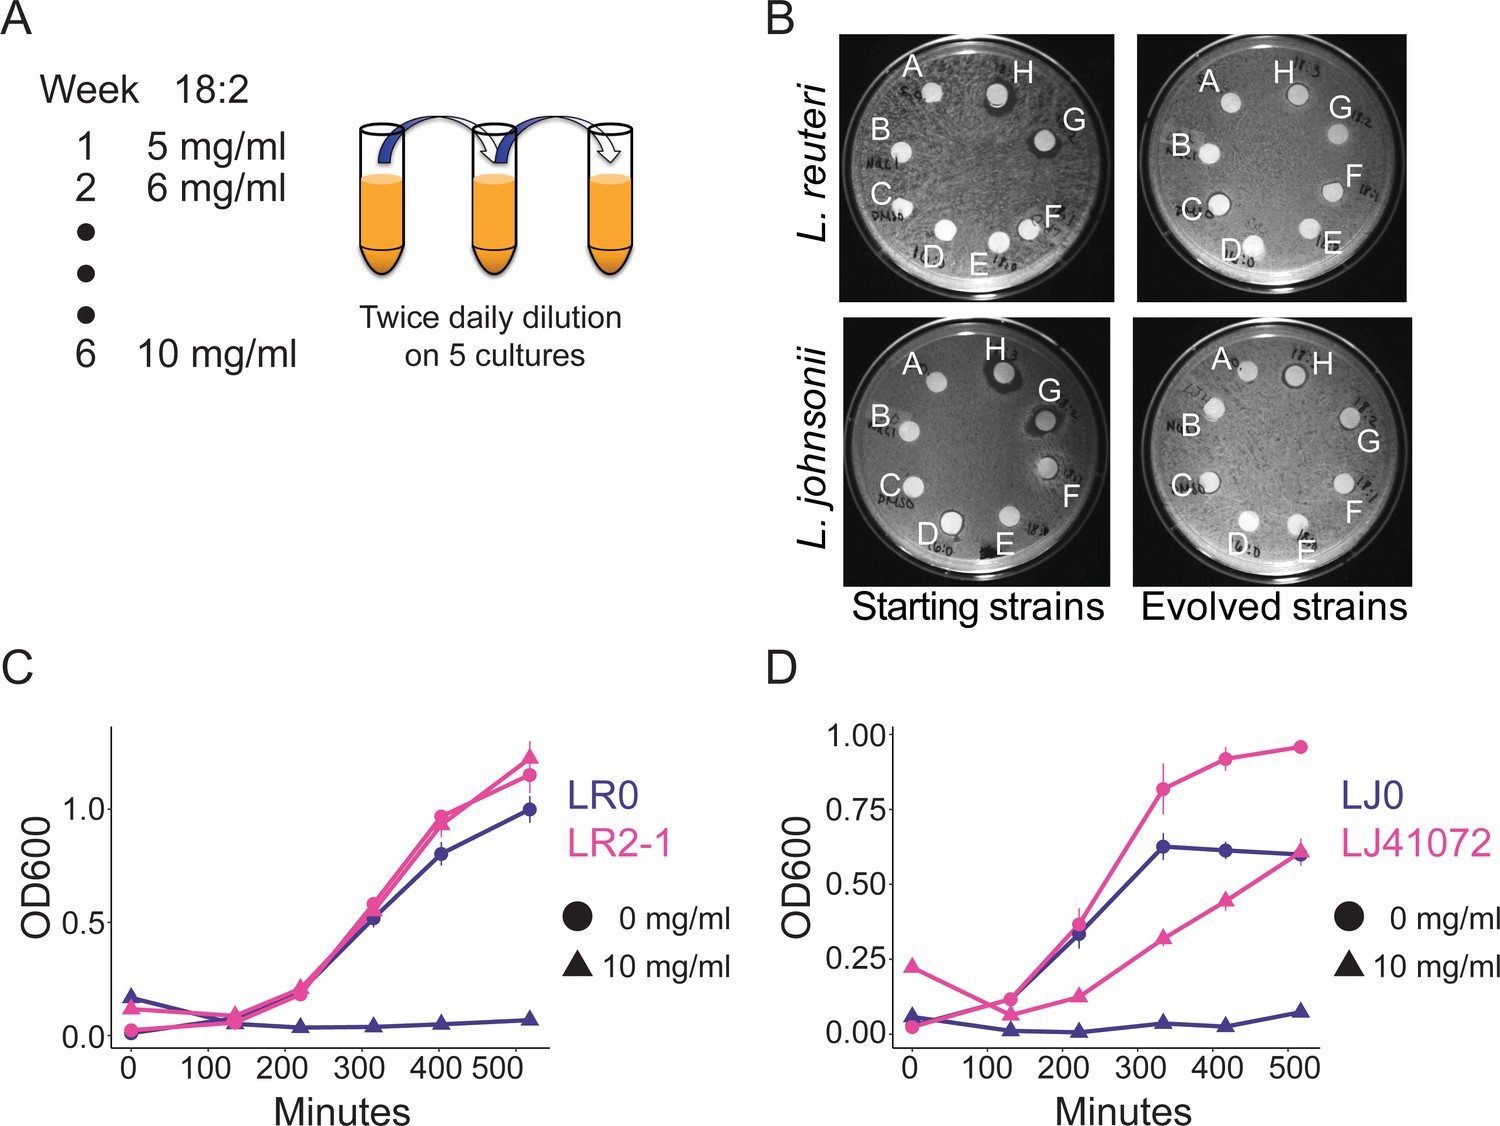
In vitro evolution of 18:2 resistance in lactobacilli.
(A) Five cultures of L. reuteri strain LR0 and five cultures of L. johnsonii strain LJ0 were passaged twice daily via a 100x dilution in liquid culture supplemented with 18:2. The 18:2 concentration was increased each week by 1 mg/ml from 5 to 10 mg/ml over a total of 6 weeks. (B) Disc diffusion (as in Figure 1) of L. reuteri and L. johnsonii starting strains LR0 and LJ0 and evolved populations LR2 and LJ4. Tested compounds: A. SBO, B. Saline, C. DMSO, D. 16:0, E. 18:0, F. 18:1, G. 18:2, H. 18:3. Growth curve of C) L. reuteri starting strain LR0, evolved isolate LR2-1 (from population LR2), (D) L. johnsonii starting strain LJ0, and evolved isolate LJ41072 (from population LJ4) in liquid medium with and without 18:2. Each point represents triplicate cultures and standard deviations are shown. See also Figure 3—figure supplements 1 and 2 and Supplementary file 2 to 6.
-
Figure 3—source data 1
Oligos used to generate L. reuteri mutants.
- https://doi.org/10.7554/eLife.32581.010
Figure 3—figure supplement 1
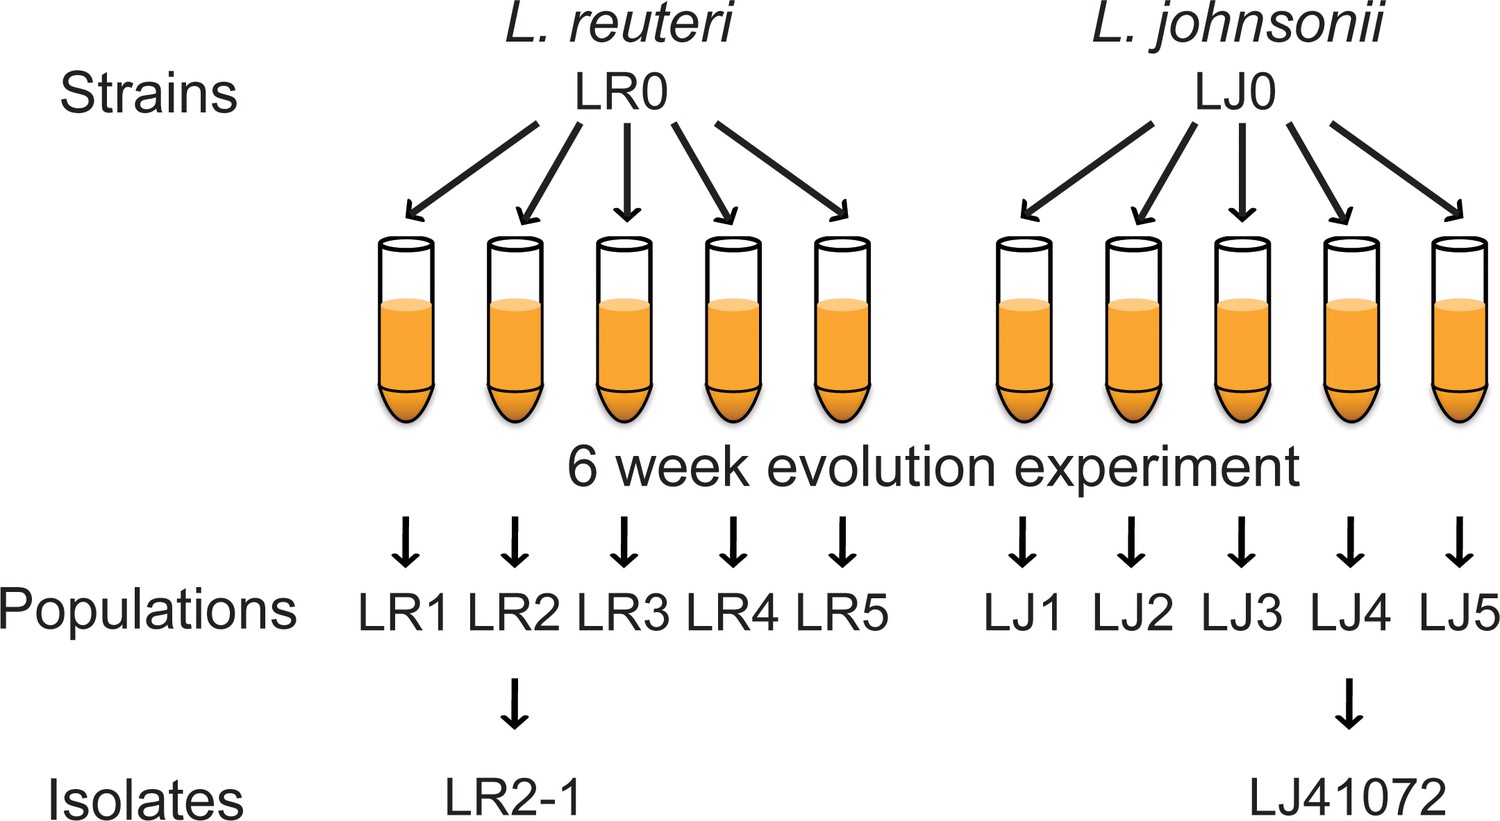
Lactobacillus strains, populations, and isolates involved in the in vitro evolution experiment.
Mouse derived strains LR0 (L. reuteri) and LJ0 (L. johnsonii) were inoculated into five cultures each. These cultures were passaged twice daily in media containing 18:2 for six weeks. The resulting populations for LR0 were LR1 to LR5 and for LJ0, LJ1 to LJ5. From population LR2, isolate LR2-1 was further analyzed as was isolate LJ41072 from LJ4.
Figure 3—figure supplement 2
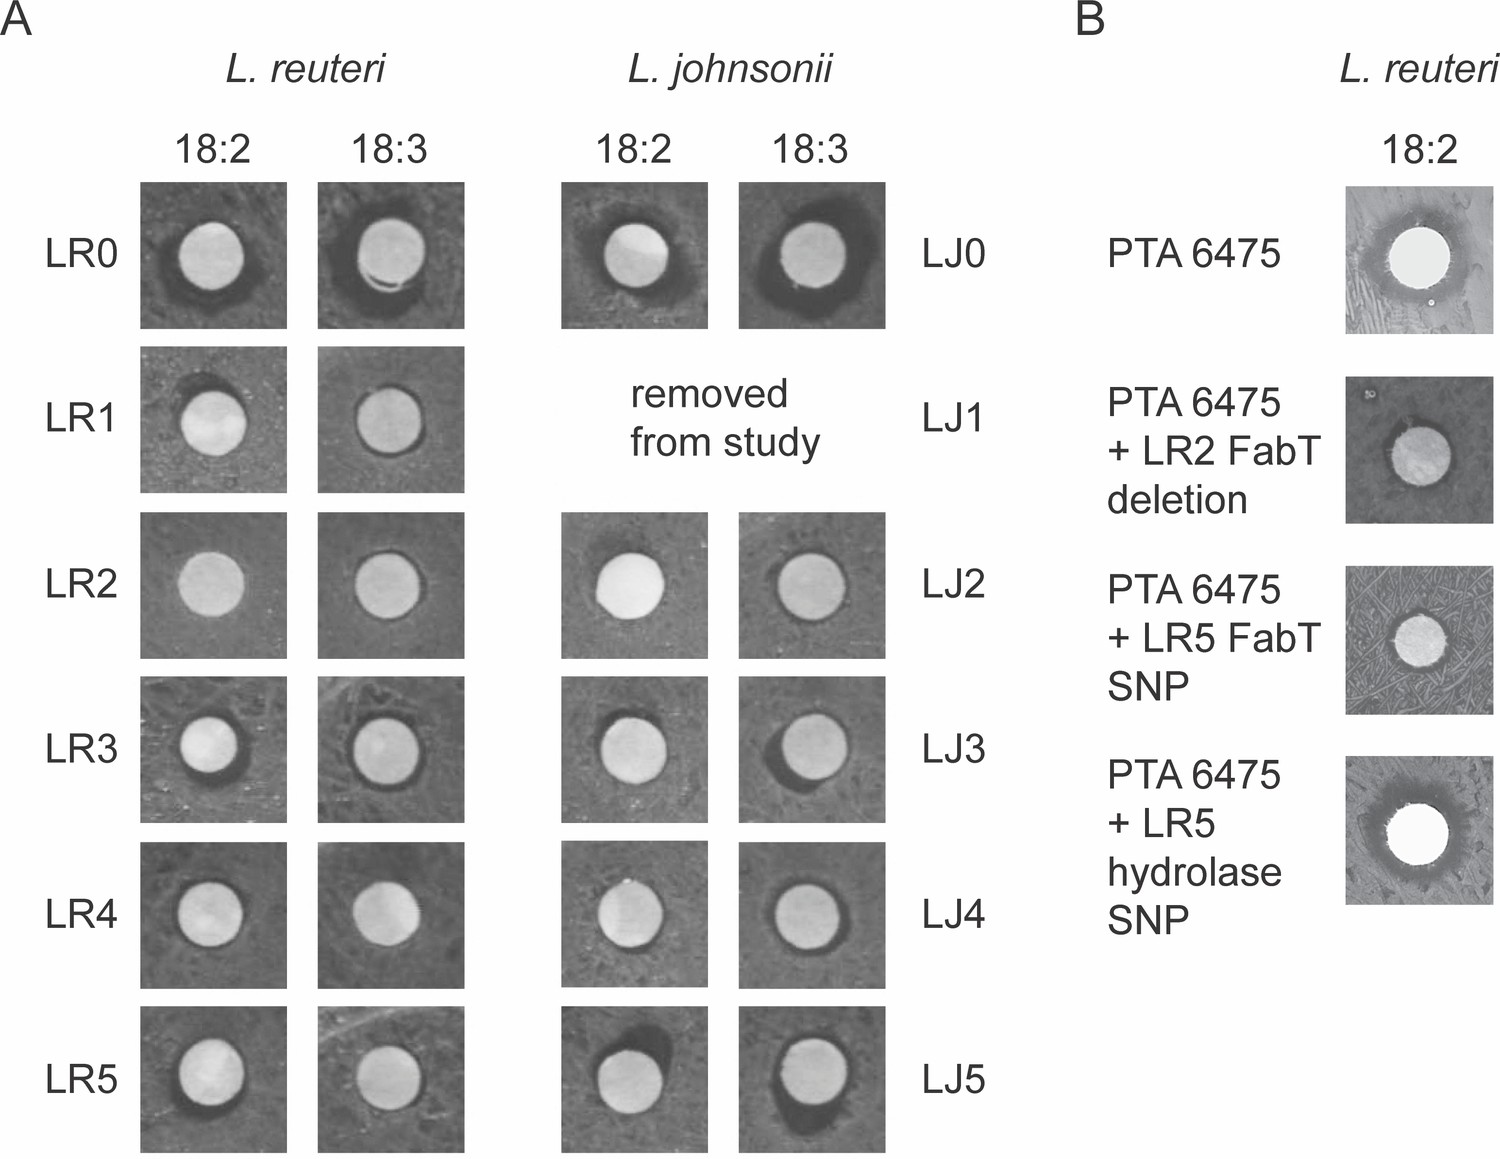
Lactobacillus populations passaged in 18:2 have increased resistance to 18:2.
A) Disc diffusions for all L. reuteri and L. johnsonii populations and their ancestor strains with 18:2 and 18:3. (B) Individual L. reuteri fatty acid mutations in FabT and the hydrolase gene created in the fatty acid sensitive strain PTA 6475.
Figure 4 with 5 supplements
L. reuteri and L. johnsonii can survive 18:2 in vivo without 18:2 resistance.
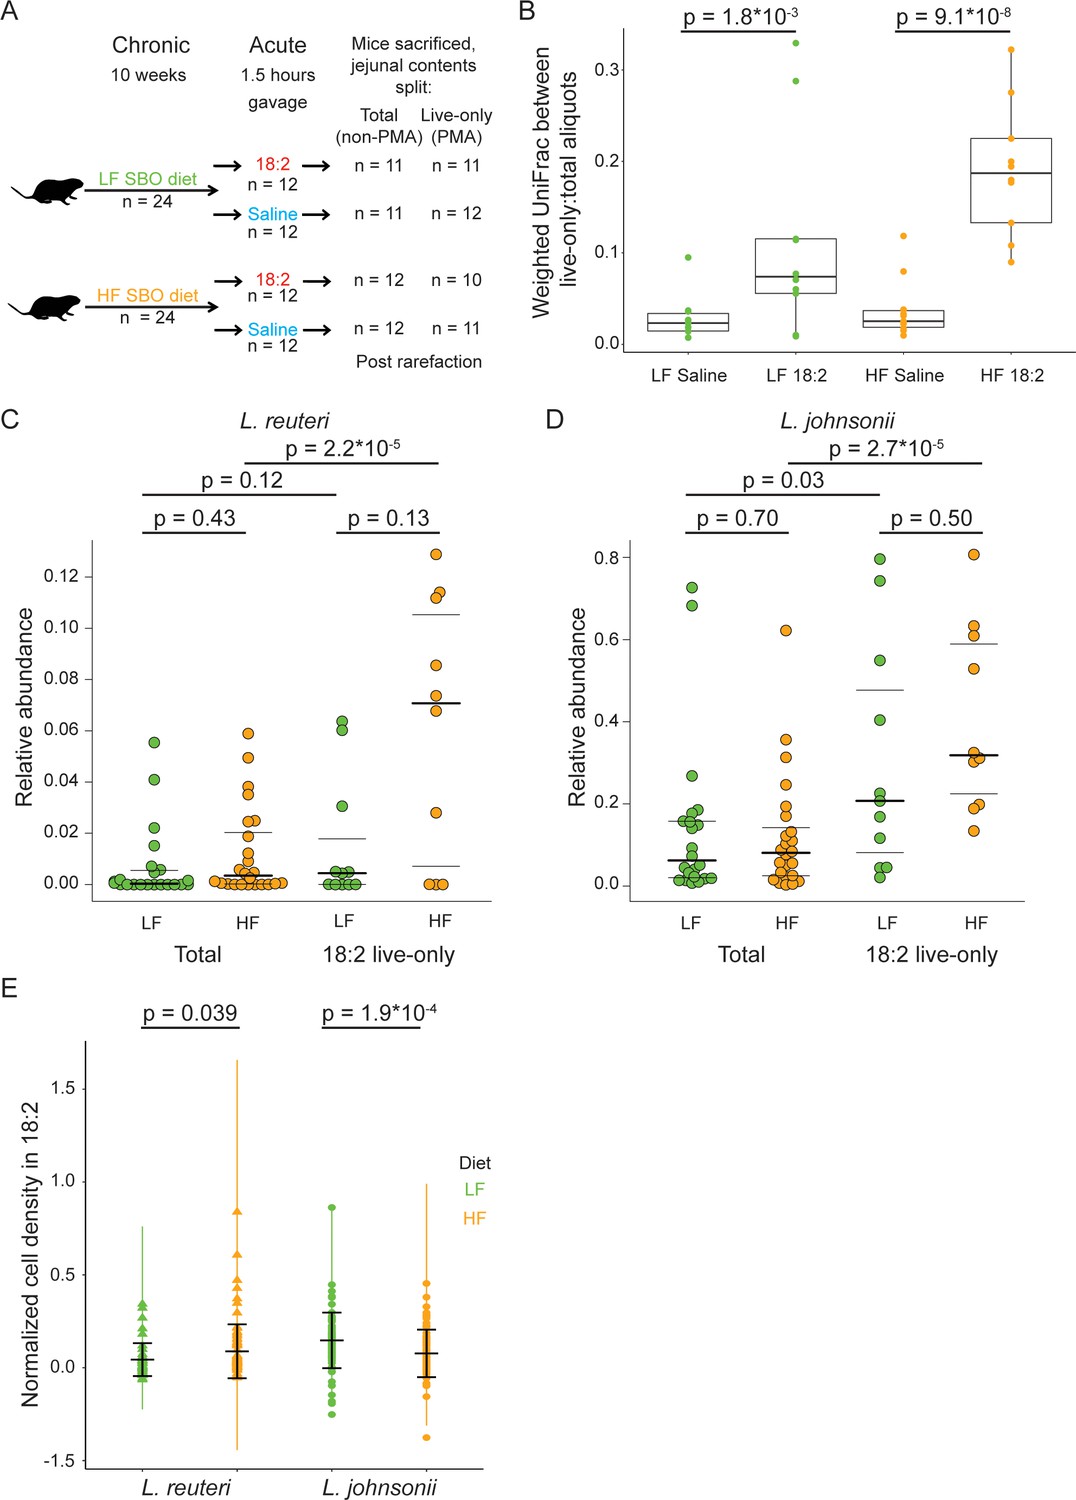
(A) Schematic of the SBO diet experiment. After 10 weeks on either the LF or HF SBO diet, 24 mice on each diet were gavaged with 18:2 or saline (n 12 for each). 1.5 hr post gavage, mice were sacrificed, jejunal contents collected and split into two. One aliquot was PMA treated (live-only cells) and the other was not (live and dead cells, total). 16S rRNA gene sequencing was performed on both aliquots. Sample size values shown on the right of the figure panel reflect samples passing rarefaction. (B) Weighted UniFrac distances between the live-only and total aliquots for each mouse sample. Significance values were determined using Kruskal-Wallis tests. For LF samples, mean in saline gavage group = 0.03, mean in 18:2 gavage group = 0.11; for HF samples, mean in saline gavage group = 0.04, mean in 18:2 gavage group = 0.19. (C) Relative abundance of L. reuteri OTU 692154 and D) L. johnsonii OTU 592160 in the total cell and 18:2 gavage live-only aliquots. For the total cell aliquots, post rarefaction, n = 22 for LF diet; n = 24 for HF diet. For the 18:2 gavage live-only aliquots, post rarefaction, n = 11 for LF diet; n = 10 for HF diet. Dark lines indicate the 50% quartile, and the two thinner lines show the 25% and 75% quartiles. Mean values for L. reuteri: total-LF diet = 0.007; total-HF diet = 0.012; 18:2-live-only-LF = 0.015; 18:2-live-only-HF = 0.061. Mean values for L. johnsonii: total-LF diet = 0.140; total-HF diet = 0.121; 18:2-live-only-LF = 0.302; 18:2-live-only-HF = 0.404. Significance values were determined using an ANOVA on a linear mixed model to include cage effects. For comparisons within diets, between total and live-only aliquots, similar results were obtained if only 18:2 gavaged animals were considered in the total aliquot. As well, similar results were obtained using Kruskal-Wallis tests. (E) Normalized cell density in 18:2 of lactobacilli isolated from mice on the low or high SBO diets. A value of one means cells were not inhibited by 18:2. For reference, the evolved strain LJ41072, which has enhanced resistance to 18:2 (Figure 3D), gives a value of 0.6. Black lines indicate the mean and standard deviations of the entire set of colonies. The colored lines show the standard deviations for replicate tested colonies. For L. reuteri, we excluded 7/120 isolates that failed to grow in medium lacking 18:2 and tested 113 isolates derived from 15 mice housed in 8 of 12 cages (5 HF diet cages and 3 LF diet cages; note that L. reuteri was not detected by 16S rRNA gene amplicon sequencing in several of the cages). For L. johnsonii, we excluded 33/192 isolates that failed to grow in medium lacking 18:2 and tested 159 isolates from 22 mice in all 12 cages. A single L. reuteri replicate gave a normalized cell density in 18:2 above 1.0. Significance values were determined by Kruskal-Wallis tests: for L. reuteri p = 0.039, mean in LF group = 0.04, mean in HF group = 0.09; for L. johnsonii p = 1.9*10−4, mean in LF group = 0.15, mean in HF group = 0.08. See also Figure 4—figure supplement 1–4 and Figure 4—source data 1.
-
Figure 4—source data 1
SBO mouse diets.
- https://doi.org/10.7554/eLife.32581.019
Figure 4—figure supplement 1
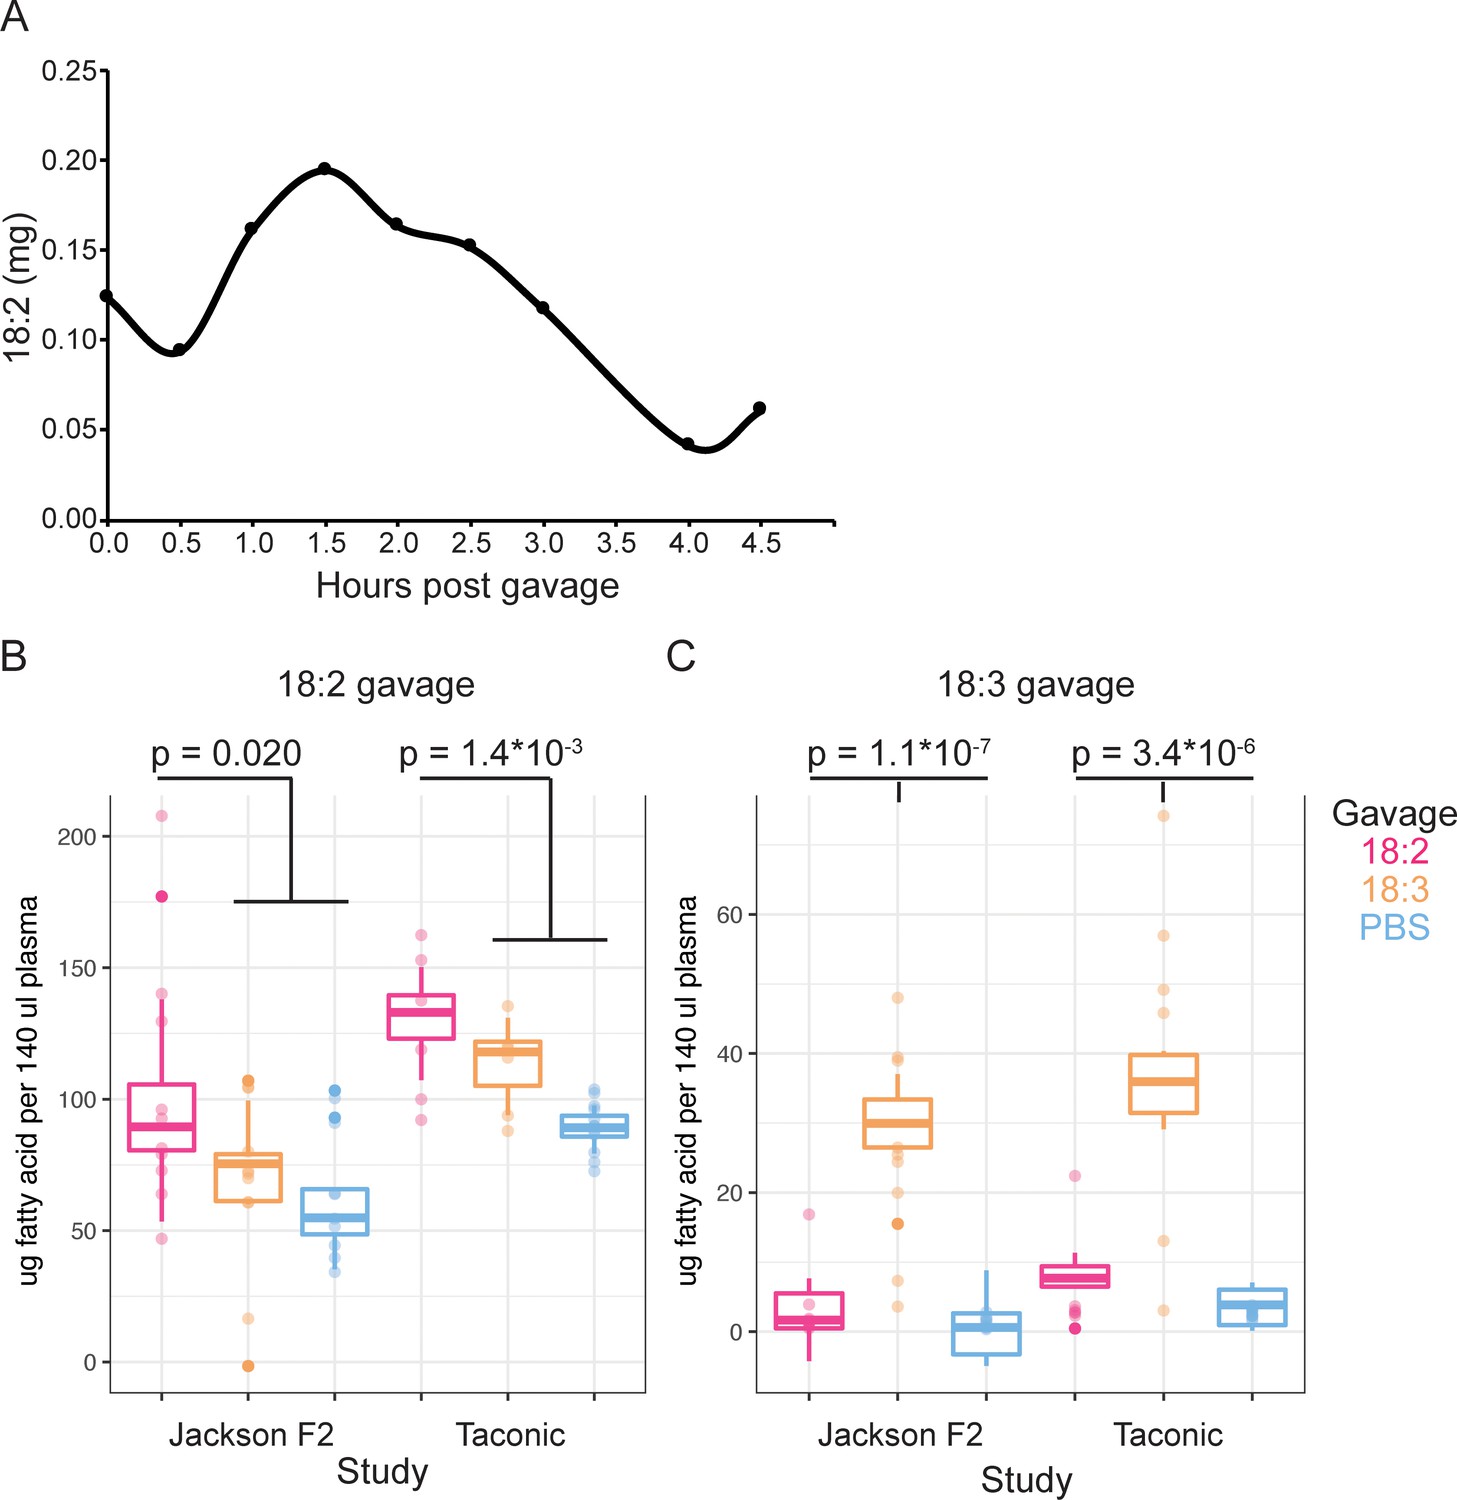
(A) 18:2 in the plasma of mice post gavage with 18:2. A single mouse per time point is shown. Amount of (B) 18:2 and (C) 18:3 in the plasma of Jackson F2 and Taconic mice 1.5 hr post gavage with 18:2, 18:3, or PBS. N = 6 to 13 for each group. Points represent normalized fatty acid amounts and boxplots show covariate adjustments from the least squares means estimates derived from a linear mixed model (see Material and methods). The p values indicate the significance of the amount of 18:2 (panel B)/18:3 (panel C) in the plasma of mice gavaged with 18:2/18:3 versus those in the other gavage groups. P values were determined using a t-test on the least squares means estimates data. In (B), for Jackson F2 mice, mean in 18:2 group = 98.8, mean for other gavages = 65.4, and 95% CI = (−60.96,–5.93); for Taconic mice, mean in 18:2 group = 130.8, mean for other gavages = 97.5, and 95% CI = (−49.81,–16.96). In (C), for Jackson F2 mice, mean in 18:3 group = 29.3, mean for other gavages = 1.4, and 95% CI = (−33.02,–22.68); for Taconic mice, mean in 18:3 group = 35.4, mean for other gavages = 4.8, and 95% CI = (−35.90,–25.36).
Figure 4—figure supplement 2
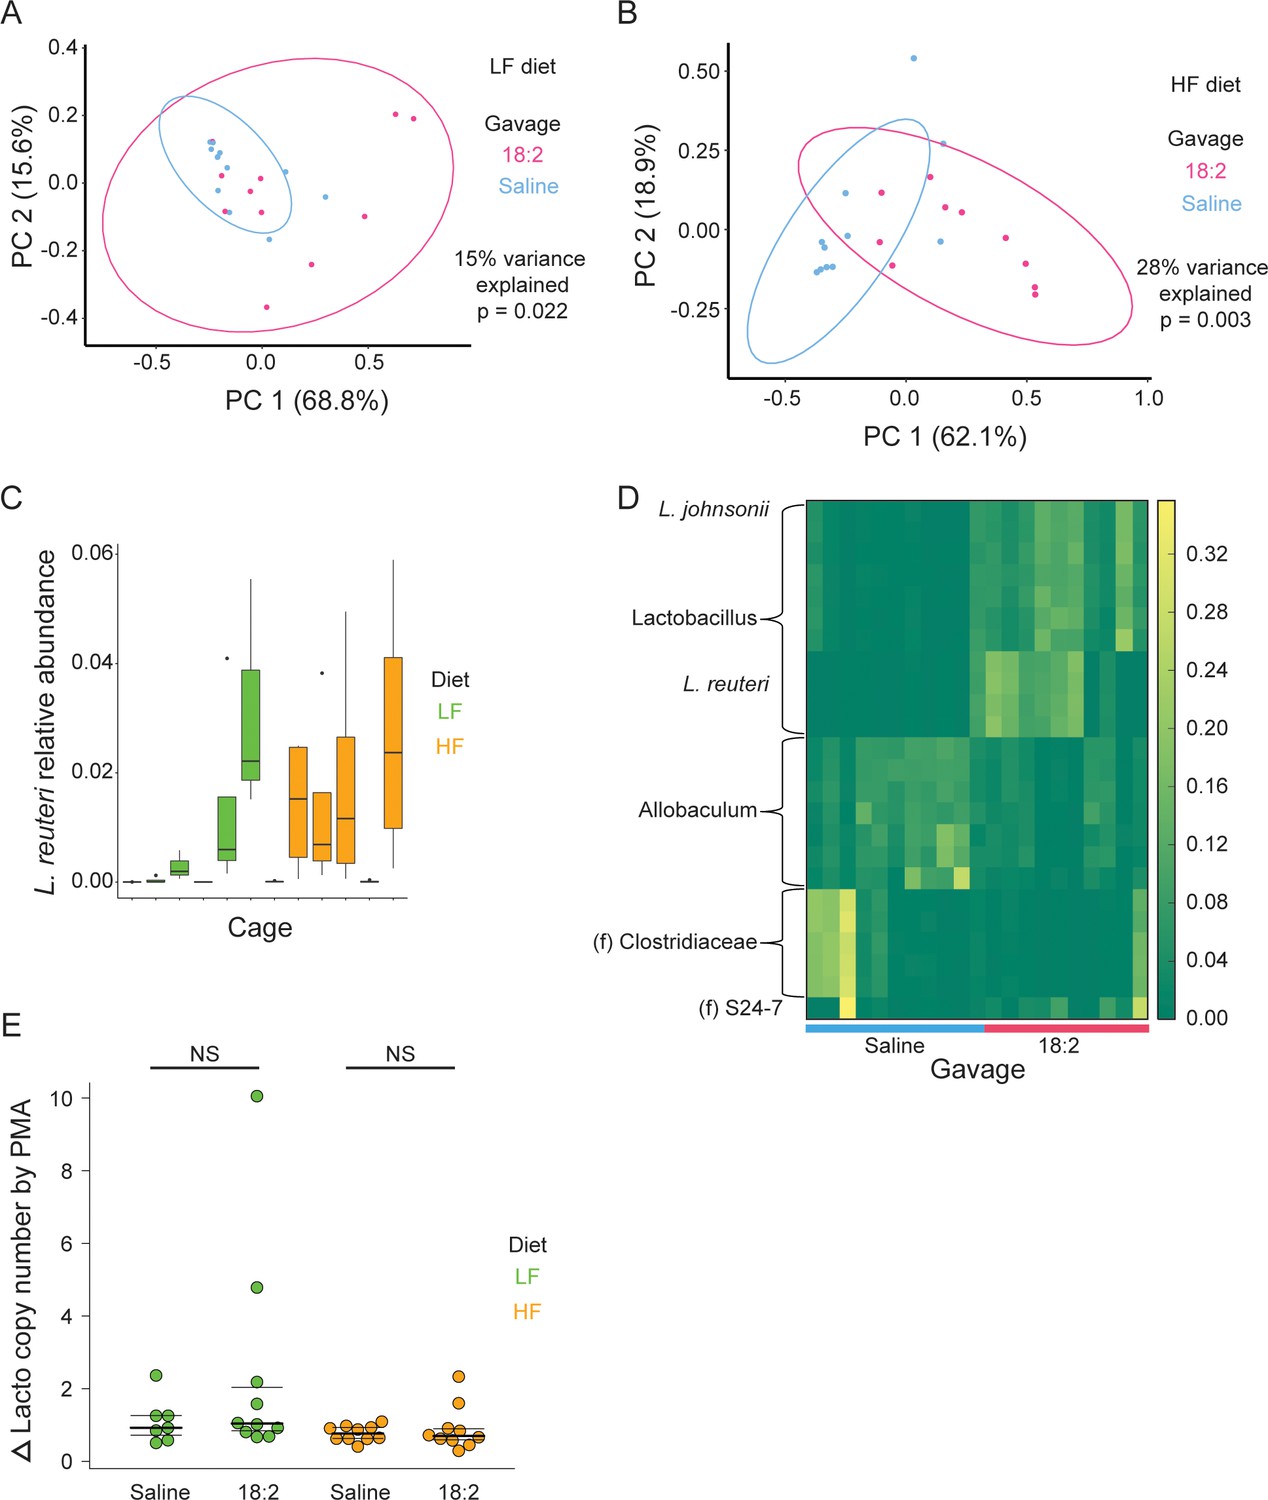
Lactobacilli survive acute and chronic 18:2 exposure in murine.
(A) Principal coordinate analysis on the weighted UniFrac distance metric for PMA treated (live-only) jejunal contents for mice on the LF or (B) HF diet. Points are colored by gavage. Ellipses show a t-distribution fit to the data to a provide an estimation of the full distribution if further samples were available. The percent variance explained and significance of the clusters as determined by performing adonis are shown. Post rarefaction, for the LF diet, n = 12 for the saline gavage and n = 11 for the 18:2 gavage; for the HF diet, n = 11 for the saline gavage and n = 10 for the 18:2 gavage. (C) Relative abundance of L. reuteri OTU 692154 in total cell population by cage (post rarefaction, n = 22 for LF diet; n = 24 for HF diet). (D) OTUs differentiating the 18:2 and saline gavage in live-only aliquots for mice on the HF diet (FDR < 0.10). Genus is shown unless otherwise noted (f = family). (E) qPCR analysis of the change in lactobacilli 16S rRNA copy numbers between live-only (PMA) and total (non-PMA) aliquots normalized by that change for Eubacteria. Significance values were determined by two sample, two-tailed t-tests: for the LF diet group p = 0.2181, mean in saline group = 1.11, mean in 18:2 group = 2.38, 95% CI = (−0.88, 3.42); for the HF diet group p = 0.5381, mean in saline group = 0.91, mean in 18:2 group = 0.78, 95% CI = (−0.32, 0.58). Dark lines indicate the 50% quartile, and the two thinner lines show the 25% and 75% quartiles.
Figure 4—figure supplement 3
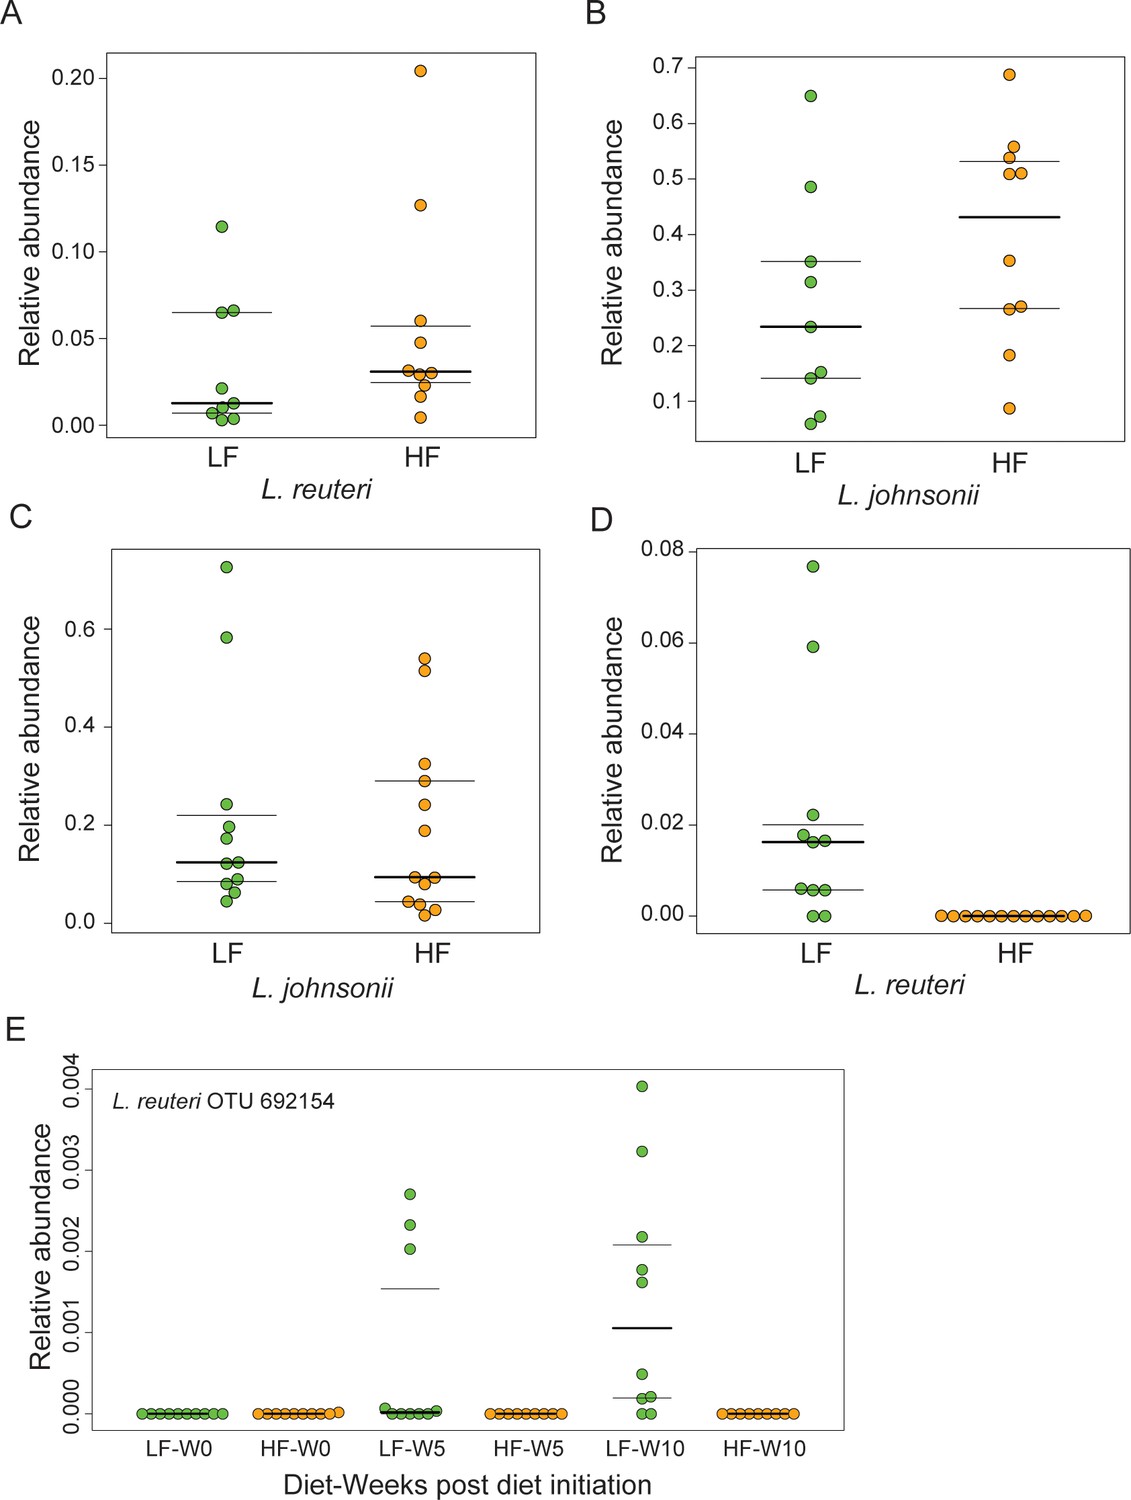
Lactobacilli survive chronic 18:2 exposure in murine.
(A) Relative abundance of L. reuteri OTU 692154 and (B) L. johnsonii OTU 592160 in Taconic mouse jejuna after 10 weeks on SBO diets (post rarefaction, n = 9 for LF diet; n = 10 for HF diet). (C) Relative abundance of L. johnsonii OTU 592160, and D) L. reuteri OTU 692154 F2 Jackson mouse jejuna after 10 weeks on SBO diets (post rarefaction, n = 11 for LF diet; n = 13 for HF diet). (E) Relative abundance on unrarefied 16S rRNA sequence counts from fecal pellets collected over the course of the diet experiment for F2 Jackson mice. Only samples with at least 10,000 total sequences were used. Number of fecal pellets tested at each time point per diet is at least 9, whereby five cages were sampled at each time point for the HF diet and four cages for the LF diet. Dark lines indicate the 50% quartile, and the two thinner lines show the 25% and 75% quartiles.
Figure 4—figure supplement 4
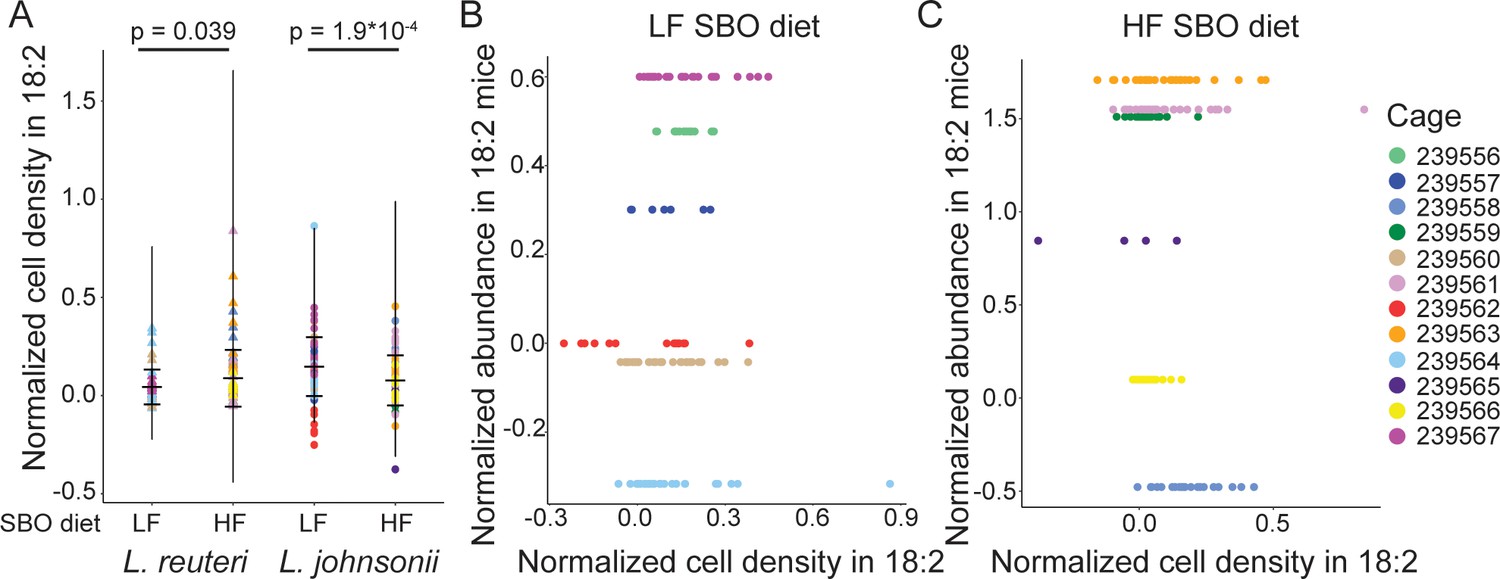
The 18:2 resistance of lactobacilli isolates in vitro does not relate to ability to survive acute 18:2 exposure in murine.
(A) Normalized cell density in 18:2 as in Figure 4E colored by cage. Lack of correlation between normalized cell density in 18:2 and normalized abundance in 18:2 mice for the L. reuteri isolated from the B) LF and C) HF diet mice.
Figure 4—figure supplement 5
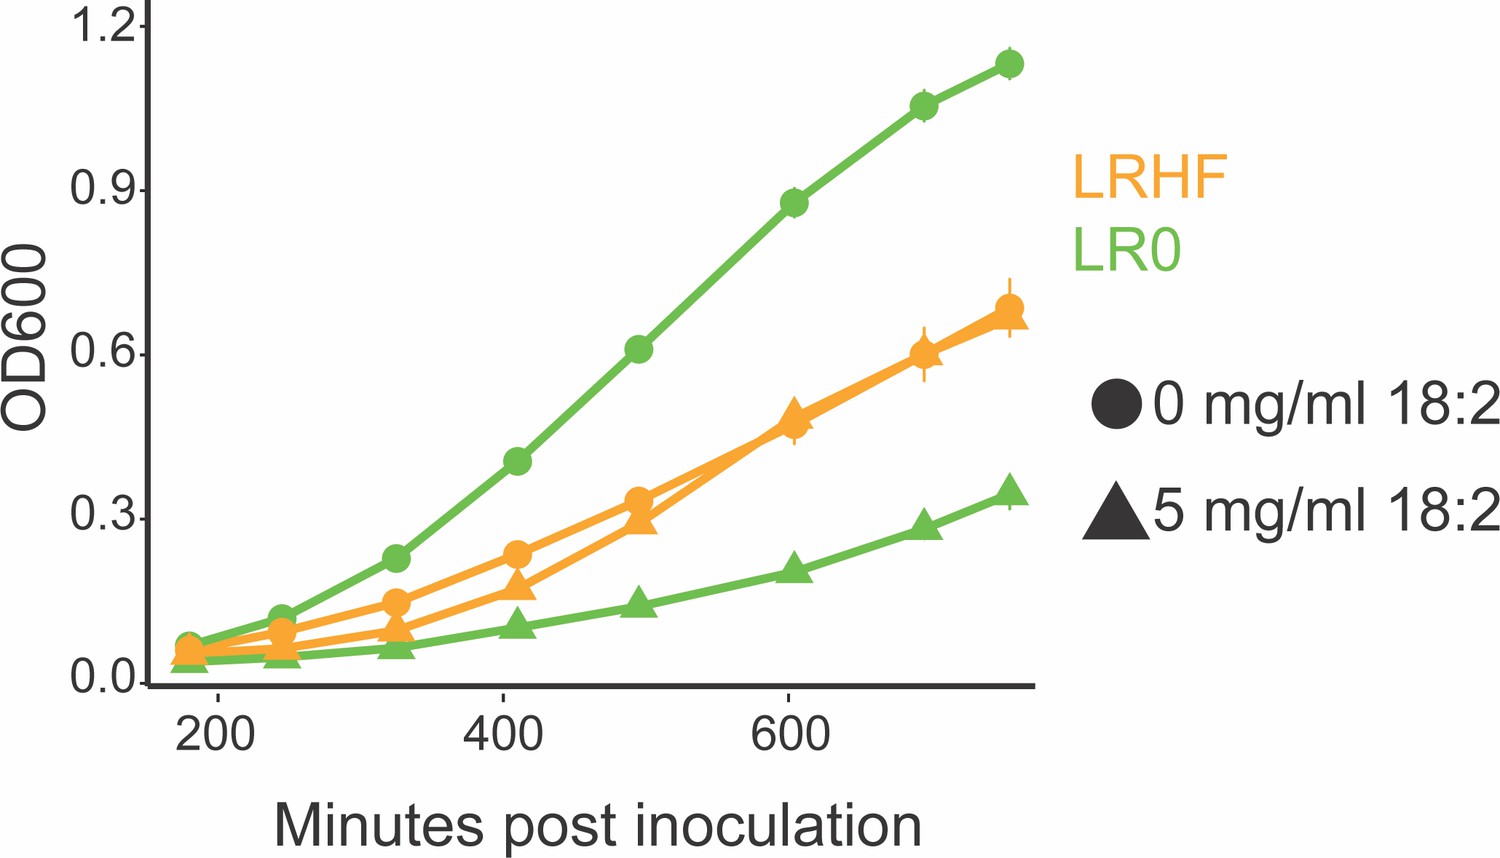
An HF diet isolated L. reuteri is resistant to 18:2.
Growth curve of L. reuteri isolates from mice on the LF SBO diet (LR0) and from the HF SBO diet (LRHF). Both strains were isolated from the same cohort of mice on the SBO diets for six weeks. Data points are shown in triplicate technical replication with standard deviations.
Tables
Table 1
High frequency mutations in L. reuteri in vitro evolved populations.
https://doi.org/10.7554/eLife.32581.011| Gene | Function | LR1 | LR2 | LR3 | LR4 | LR5 |
|---|---|---|---|---|---|---|
| FabT (5)* | Fatty acid biosynthesis | 71% NS | 99% IT | 98% NS | 76% U | 81% NS |
| EpsD (2)* | Exopolysaccharide synthesis | 76% FS | 99% NS | |||
| EpsC | Exopolysaccharide synthesis | 86% NS | ||||
| FIG005986 HD family hydrolase | Hydrolase | 77% NS | ||||
| FIG00745602 hypothetical protein | Transmembrane protein | 99% PS | ||||
| Ammonium transporter | Ammonium transporter | 67% U |
-
*(#) indicates number of distinct mutations across the populations. The percent of the population with a mutation in the named gene is shown. Variants at frequency greater than 60% are shown. NS = nonsynonymous; IT = internal truncation; U = intergenic upstream; PS = premature stop; FS = frameshift. See also Figure 3—figure supplements 1 and 2 and Supplementary Files 3 and 5.
Table 2
High frequency mutations in L. johnsonii in vitro evolved populations.
https://doi.org/10.7554/eLife.32581.012| Gene | Function | LJ2 | LJ3 | LJ4 | LJ5 |
|---|---|---|---|---|---|
| Esterase/lipase | Intracellular esterase/lipase | 88% NS | |||
| Putative membrane protein (2)* | Transmembrane protein | 100% NS | 100% FS | 100% NS | |
| Lipase/esterase | Intracellular esterase/lipase | 99% NS | 93% NS | ||
| KefA | Small-conductance mechanosensitive channel | 62% DEL | |||
| LafA | Glycosyltransferase | 100% NS | |||
| NrdI (2)* | Ribonucleotide reduction | 100% NS | 100% NS | ||
| TetR family transcriptional regulator | Membrane structure | >60% PS |
-
Data are presented as in Table 1. NS = nonsynonymous; FS = frameshift; DEL = in frame deletion; PS = premature stop. The insertion in TetR in LR4 was not properly called by GATK; the frequency is estimated. See also Figure 3—figure supplements 1 and 2 and Supplementary file 4 and 6.
Table 3
Nonsynonymous mutations in genes with known function in LRHF.
https://doi.org/10.7554/eLife.32581.020| Gene | Functional group | Mutation type |
|---|---|---|
| Helicase | DNA metabolism | NS |
| N-acetyl-L,L-diaminopimelate aminotransferase | energy metabolism | NS |
| Mrr restriction system protein | DNA metabolism | NS |
| Putative NADPH-quinone reductase | energy metabolism | NS |
| Accessory gene regulator C (sensor histidine kinase) | environmental response | NS |
| Transcriptional regulator, XRE family | environmental response | FS |
| ATPase component BioM of energizing module of biotin ECF transporter | energy metabolism | NS |
| CRISPR-associated protein, Csn1 family | DNA metabolism | NS |
| Transcriptional regulator, XRE family | environmental response | NS |
| Exodeoxyribonuclease VII small subunit | DNA metabolism | NS |
| Type I restriction-modification system, specificity subunit S | DNA metabolism | NS |
| ABC1 family protein | energy metabolism | NS |
| Protein serine/threonine phosphatase PrpC, regulation of stationary phase | energy metabolism | FS |
| Nucleotide sugar synthetase-like protein | DNA metabolism | NS |
| DNA repair protein RecN | DNA metabolism | NS |
| ABC transporter substrate-binding protein | energy metabolism | FS |
| Fructosyltransferase Ftf | membrane | PS |
| Oxidoreductase | energy metabolism | NS |
| Ribonuclease M5 | DNA metabolism | NS |
| Zinc-containing alcohol dehydrogenase; quinone oxidoreductase | energy metabolism | FS |
| DinG family ATP-dependent helicase YoaA | DNA metabolism | NS |
| Aromatic amino acid aminotransferase gamma | energy metabolism | NS |
-
Mutations: NS = nonsynonymous; FS = frameshift; PS = premature stop. See also Figure 4—figure supplement 5 and Supplementary file 3 and 5.
Additional files
-
Supplementary file 1
L. reuteri strains isolated from various hosts.
Host, strain name, country of origin, clade, and site of isolation on the human body (if applicable) are given.
- https://doi.org/10.7554/eLife.32581.021
-
Supplementary file 2
Lactobacilli in vitro population sequencing.
Tab ‘SequencingCoverage’ gives information on the sequencing run, barcode, number of sequences obtained, and estimated genomic coverage. Tab ‘AncestorGenomes’ gives information on the assembled LJ0 and LR0 genomes.
- https://doi.org/10.7554/eLife.32581.022
-
Supplementary file 3
Filtered and unfiltered mutations in the L. reuteri in vitro population and HF diet isolate sequencing data.
Tab ‘Key’ describes the information in the subsequent tabs. Tab ‘All’ shows all variants passing filtering by GATK. Tab ‘Filtered’ shows variants filtered to exclude alleles in genes annotated with ‘mobile element protein’, ‘transposase’, ‘phage’, or ‘RNA’, alleles at less than 10% frequency, and alleles at frequency greater than 0.5 in the aligned ancestor reads against the reference genome. Tab ‘Handchecked’ shows variants passing previous filtering and confirmed manually in IGV. For L. reuteri two additional tabs are included: ‘LRHF only’ shows variants only found in the L. reuteri isolate from a mouse on the HF SBO diet. ‘Populations only’ tab shows variants only found in the in vitro evolution assay. Genomic details are taken from the RAST annotation of the ancestor genome. Other columns are taken from the GATK vcf file. For allele variants falling in intergenic regions, the surrounding genes are listed in HitGene and HitChrom, HitStrand, HitStart, HitEnd, HitDNA, and HitProtein are listed as ‘NA’.
- https://doi.org/10.7554/eLife.32581.023
-
Supplementary file 4
Filtered and unfiltered mutations in the L. johnsonii in vitro population sequencing data.
Tabs and details are the same as for Supplementary file 3.
- https://doi.org/10.7554/eLife.32581.024
-
Supplementary file 5
RAST annotation for the assembled LR0 genome.
- https://doi.org/10.7554/eLife.32581.025
-
Supplementary file 6
RAST annotation for the assembled LJ0 genome.
- https://doi.org/10.7554/eLife.32581.026
-
Transparent reporting form
- https://doi.org/10.7554/eLife.32581.027
Download links
A two-part list of links to download the article, or parts of the article, in various formats.
Downloads (link to download the article as PDF)
Open citations (links to open the citations from this article in various online reference manager services)
Cite this article (links to download the citations from this article in formats compatible with various reference manager tools)
Resilience of small intestinal beneficial bacteria to the toxicity of soybean oil fatty acids
eLife 7:e32581.
https://doi.org/10.7554/eLife.32581


