Variation in natural exposure to anopheles mosquitoes and its effects on malaria transmission
- Centre National de Recherche et de Formation sur le Paludisme, Burkina Faso
- London School of Hygiene and Tropical Medicine, United Kingdom
- Imperial College London, United Kingdom
- Radboud University Medical Center, Netherlands
- University of Lisbon, Portugal
Figures
Figure 1 with 3 supplements

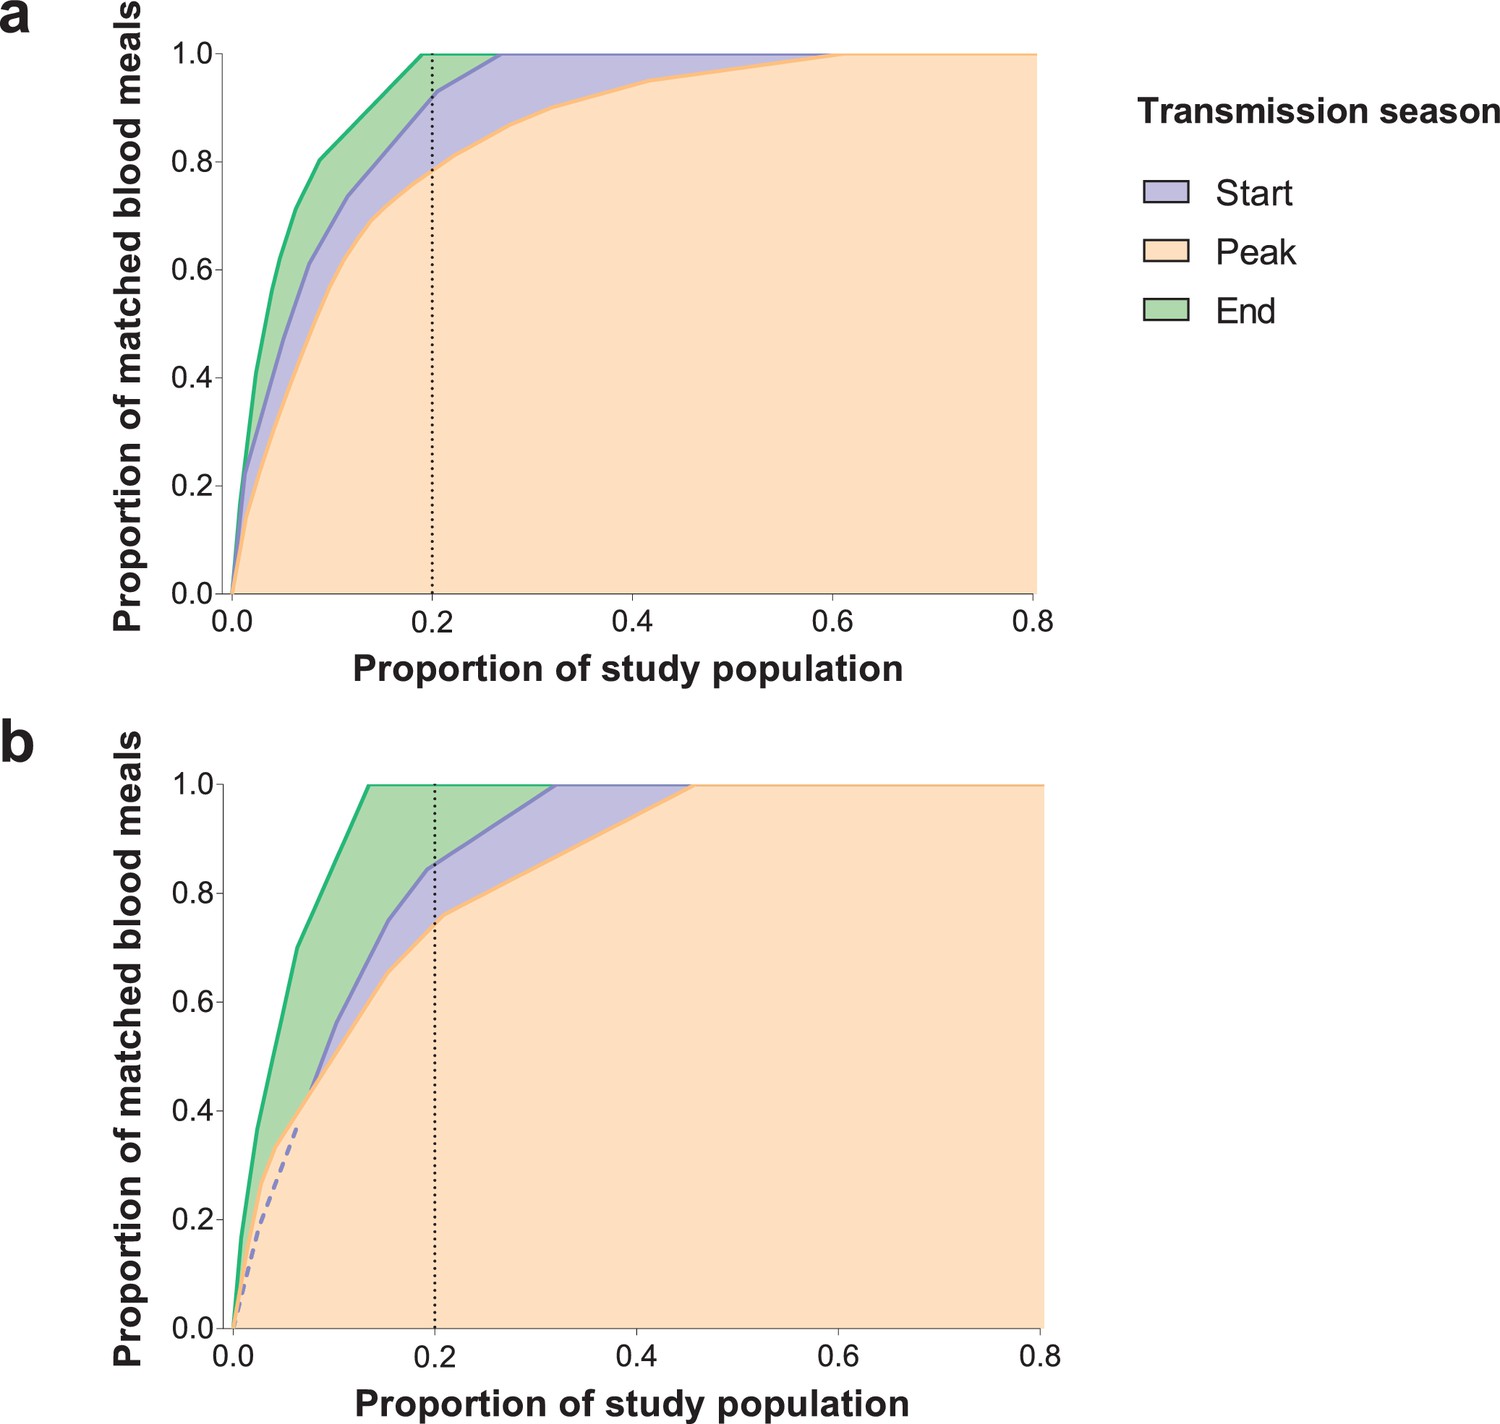
Inter-individual variation in exposure to Anopheles mosquitoes.
In (a) the frequency distributions of mosquito blood meals matched to each study participant are presented for the three different surveys. Data from the peak transmission season are presented as bars; data from the other surveys (non-zero proportions) are presented as coloured circles. In (b) the cumulative proportion of mosquito blood meals (y-axis) matched to study participants (x-axis) sorted by number of mosquito bites received is presented for the different surveys. The points where the dotted vertical line intersects the three curves correspond to the highest proportions of mosquito blood meals linked to 20% of the study population. At the peak of the transmission season, six individuals were absent or only present during one collection day and were not included in this graph. Only singly matched bloodfed mosquitoes linked to individuals living in the same household where they were collected are included in this figure.
-
Figure 1—source data 1
Distribution of mosquito blood meals matched to study participants by survey.
- https://doi.org/10.7554/eLife.32625.004
Figure 1—figure supplement 1
Sensitivity analyses.
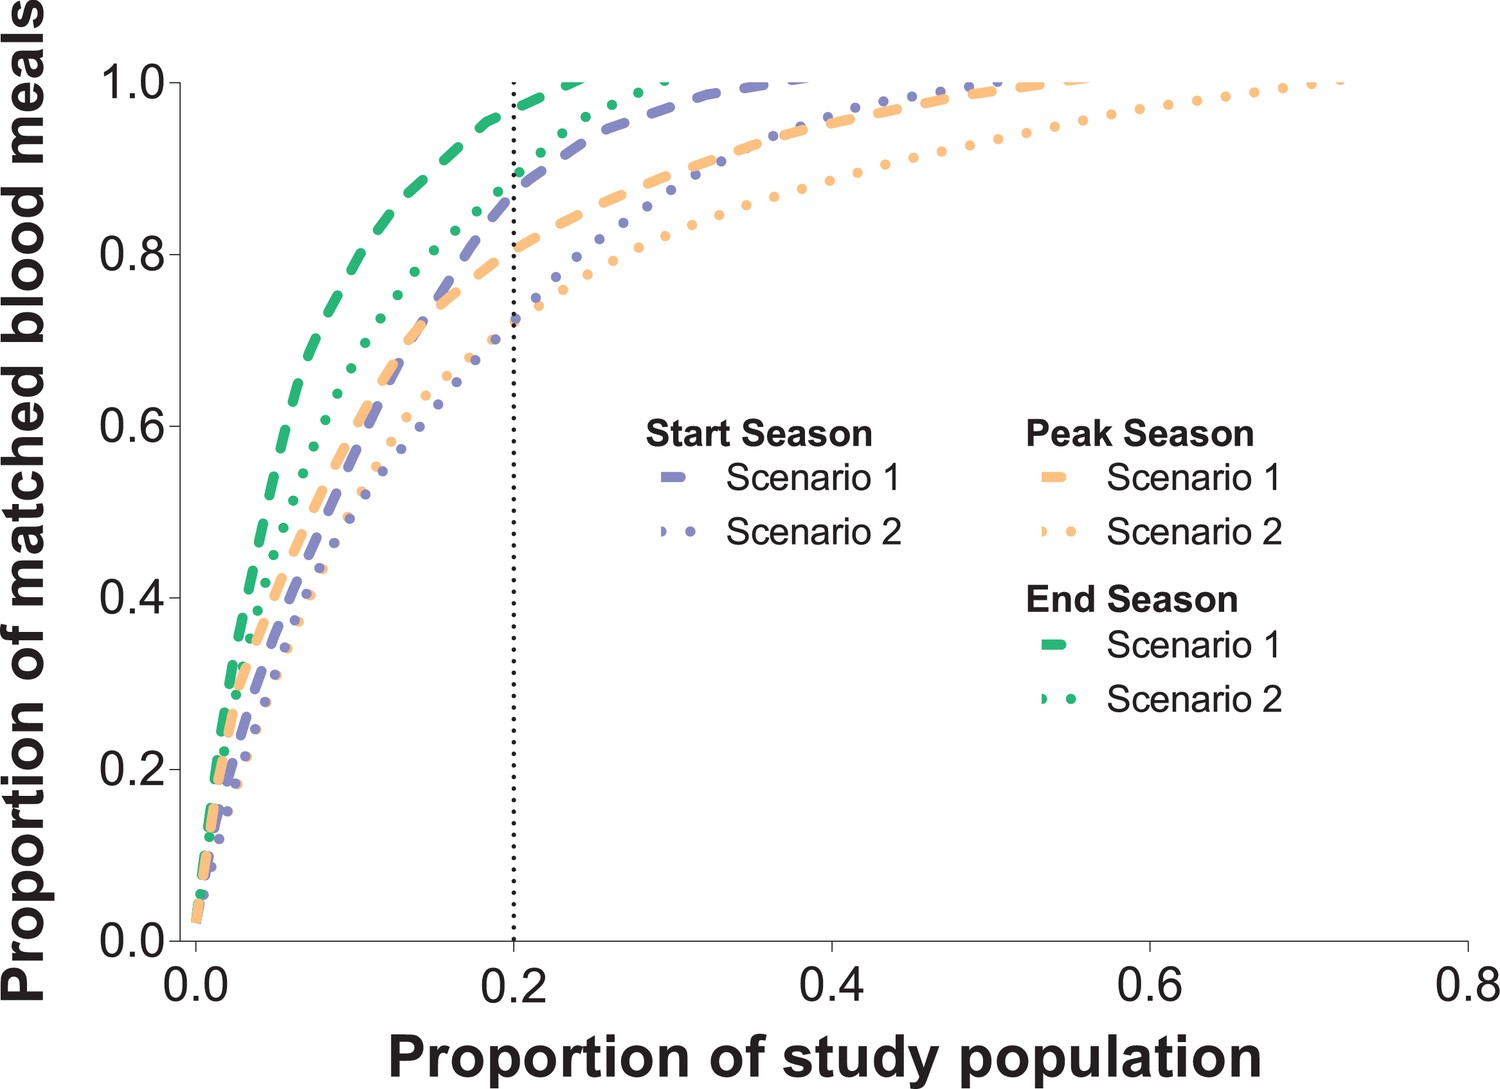
In Figure 1, only singly-matched mosquitoes were included. A total of 153 mosquito blood meals were likely to have at least two human DNA sources. In this graph, two different scenarios were assumed: in Scenario 1, each mosquito blood meal with multiple sources was assigned to the two individuals with most singly-matched meals in each household; in Scenario 2, each blood meal with multiple human DNA sources was assigned to the two individuals with lowest numbers of singly-matched mosquito meals in each household. The cumulative proportion of blood meals (y-axis) matched to study participants (x-axis) sorted by number of mosquito bites received is presented for the three different surveys and two different scenarios. Only individuals present in at least three mosquito collection days were included in this graph.
Figure 1—figure supplement 2
Cumulative proportion of Anopheles species-specific blood meals (y-axes) matched to study participants (x-axes) sorted by number of mosquito bites received.
Only individuals present in at least three mosquito collection days were included in this graph. (a) A. gambiae s. s.; (b) A. coluzzii. Only a few (Huho et al., 2013; Port et al., 1980; Woolhouse et al., 1997; Lloyd-Smith et al., 2005; Gonçalves et al., 2017; Dietz, 1980; Dye and Hasibeder, 1986; Smith et al., 2007; Woolhouse et al., 1991; Barbour, 1978; Bejon et al., 2014; Bejon et al., 2010; Mwakalinga et al., 2016; Kangoye et al., 2016) A. arabiensis mosquitoes were matched to study participants.
Figure 1—figure supplement 3
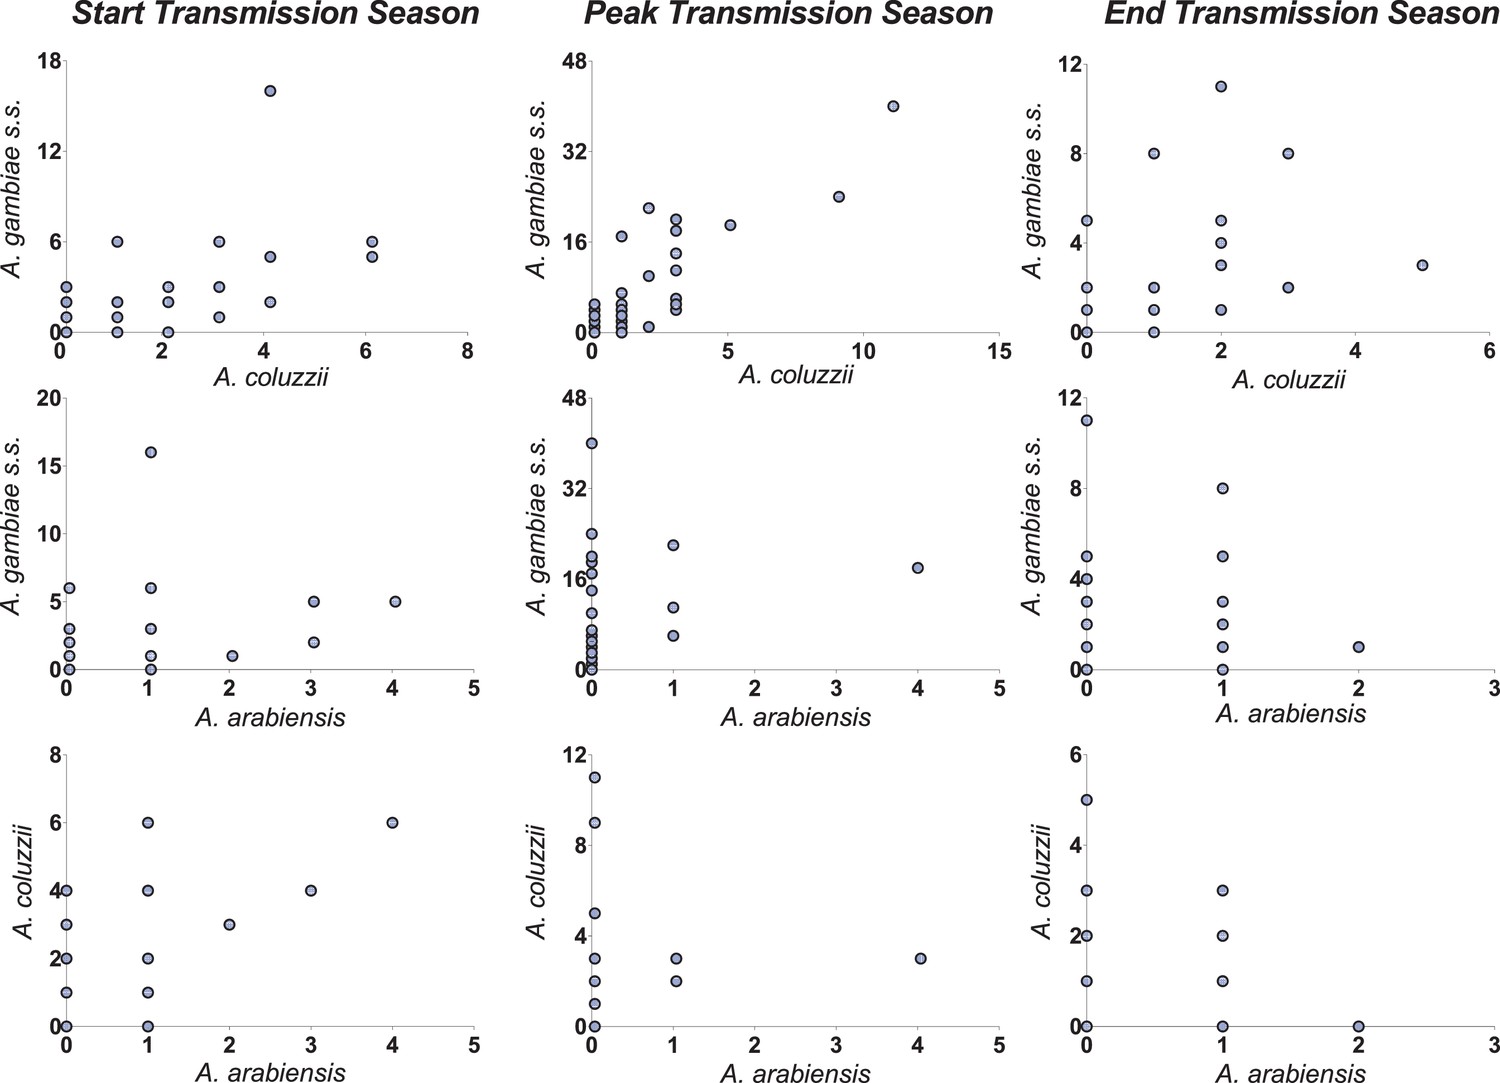
Correlations between vector species-specific numbers of matched blood meals.
Both y- and x-axes represent the number of mosquito blood meals matched to study participants; each circle corresponds to a study participant. Axes limits vary to allow better visualisation of patterns in different surveys.
Figure 2 with 1 supplement
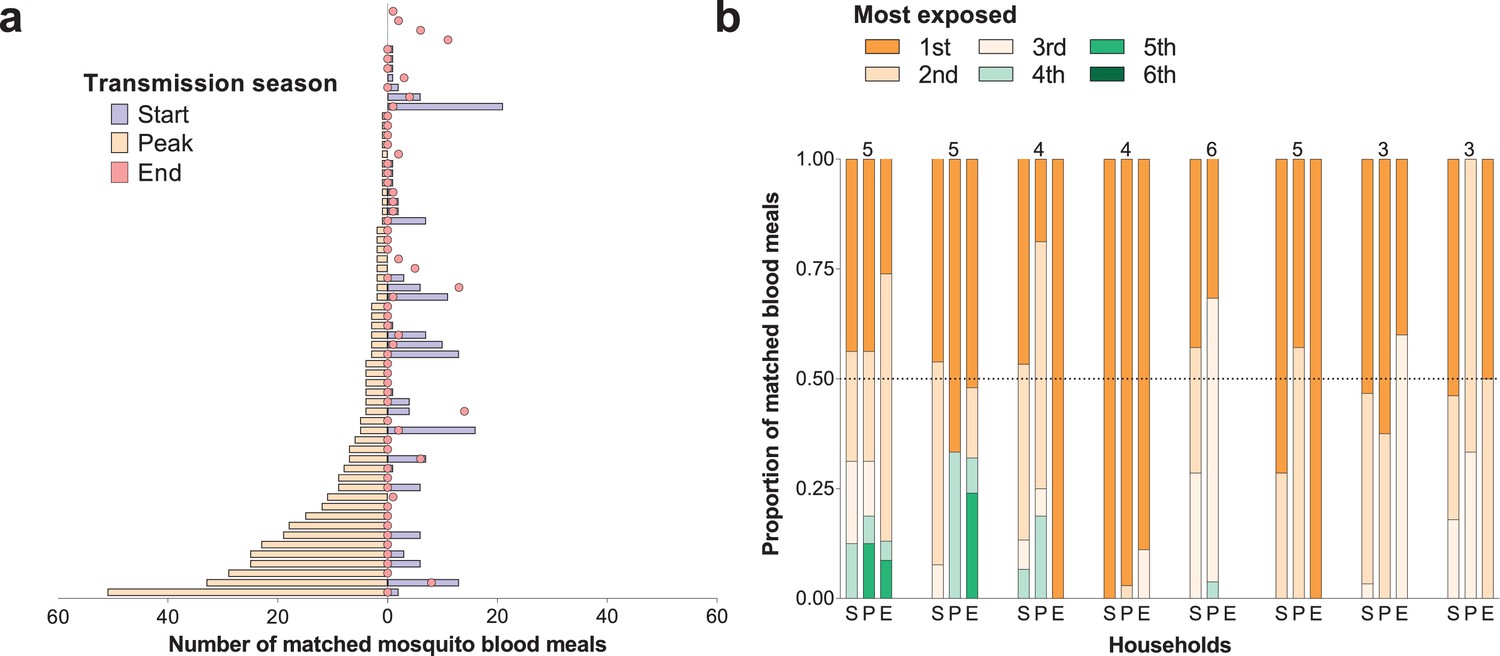
Temporal (a) and within-household (b) variation in exposure to malaria vectors.
In (a) individuals were ranked (y-axis) according to the number of matched mosquito blood meals at the peak of the transmission season. The left and right, symmetrical, x-axes represent the number of mosquito bites each individual received at the peak (orange bars), and at the start (blue bars) and end (red circles) of the transmission season respectively. Only individuals present during at least three collection days per survey in all surveys and matched to at least one blood meal (N = 62) are included in this panel. In (b) each of the three columns corresponds to a different survey (S, Start of transmission season; P, Peak of transmission season; E, End of transmission season) for a select number of households. Individuals in the same household are denoted by different colours, which are consistent in the different surveys. The proportions of matched blood meals linked to each individual by household and survey are on the y-axis; only the eight households with at least five matched mosquitoes at the start of the transmission season and three or more study participants are shown. The numbers of individuals living in the households are shown above the columns.
Figure 2—figure supplement 1
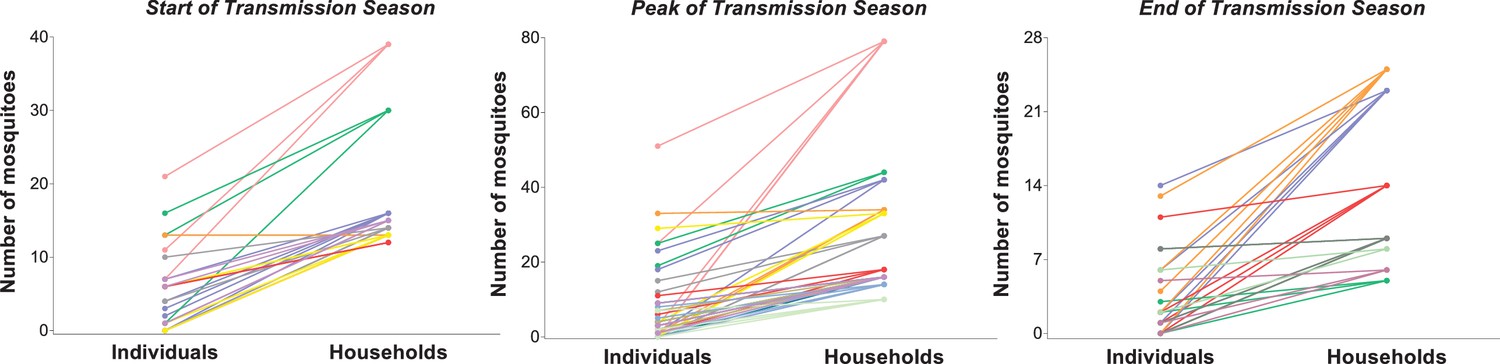
Relationship between household- and individual-level exposures to Anopheles mosquitoes.
The y-axis represents the number of mosquito blood meals linked to each study participant (left column) and the total number of blood meals matched to individuals living in each study household (right column). In each panel, individuals living in the same household are represented by circles of the same colour and linked to their household. Only houses with at least 10 (start and peak of transmission season) or 5 (end of transmission season) matched mosquitoes are included in this graph; in all other houses, all individuals had five mosquito bites or fewer at the start or peak of the wet season, and three or fewer bites at the end of the transmission season.
Figure 3
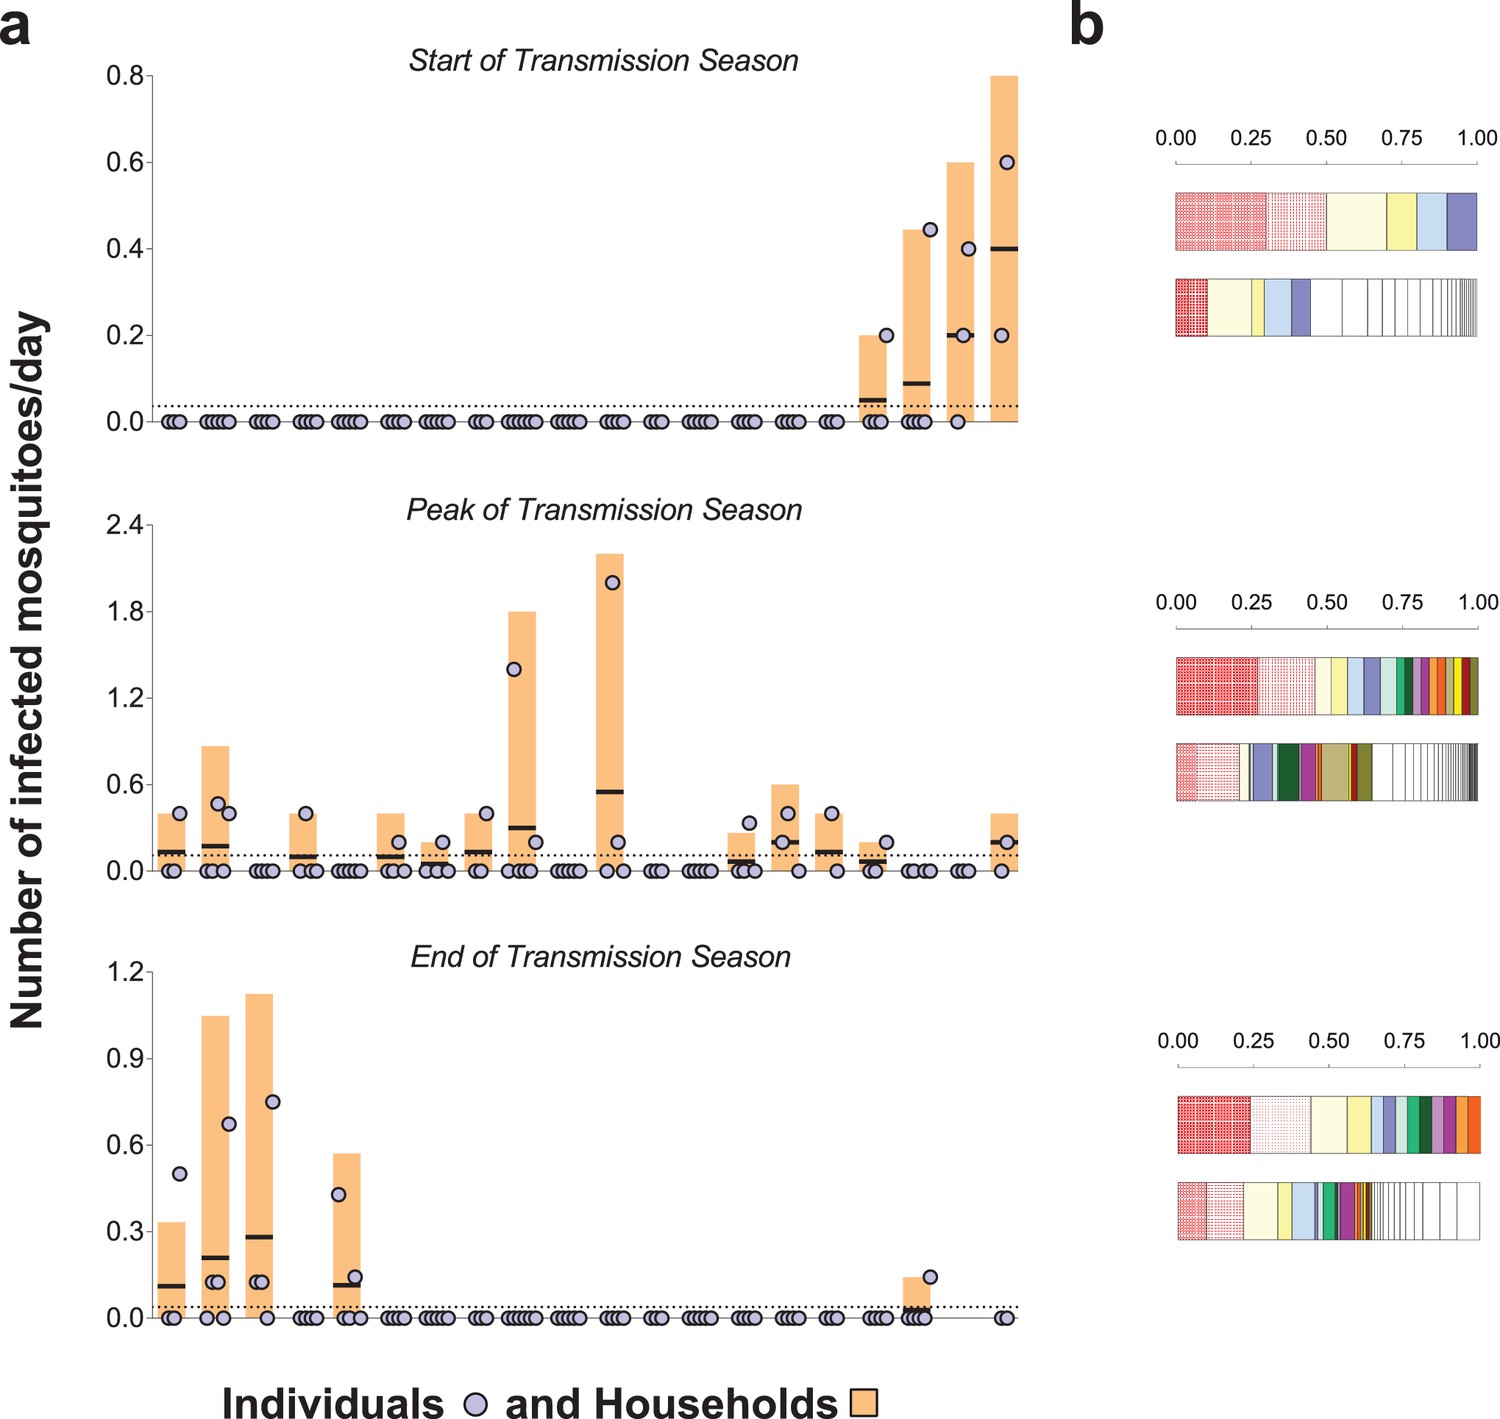
Rates of exposure to potentially infective mosquito bites (i.e., bites from mosquitoes with malaria parasites detected in their head-thoraces).
(a) and their association with total mosquito exposure (b). In (a) blue circles represent study participants; individuals living in the same study house are presented together (orange bars). Y-axes show (i) the numbers of falciparum-positive mosquito bites per individual per day (blue circles), (ii) the total number of falciparum-positive fed mosquitoes collected in each house per collection day (orange bars), and (iii) the number of falciparum-positive fed mosquitoes collected in each house per individual resident in the house per collection day (black horizontal lines in orange bars); y-axes’ limits vary to improve visualization. Horizontal dotted lines represent the average of iii over all houses. Only the 20 houses included in all three surveys are represented in this figure. In the three graphs, houses were ordered according to the number of infected fed mosquitoes collected at the start of the transmission season. In (b) in each pair of bars, each colour represents an individual: the top bar represents individuals matched to infected mosquitoes; the bottom bar, individuals matched to mosquitoes regardless of sporozoite status. Individuals who were only matched to uninfected mosquitoes are represented by white segments. The horizontal axes represent proportions of blood meals. Multiple source meals are not included in panel b.
Figure 4
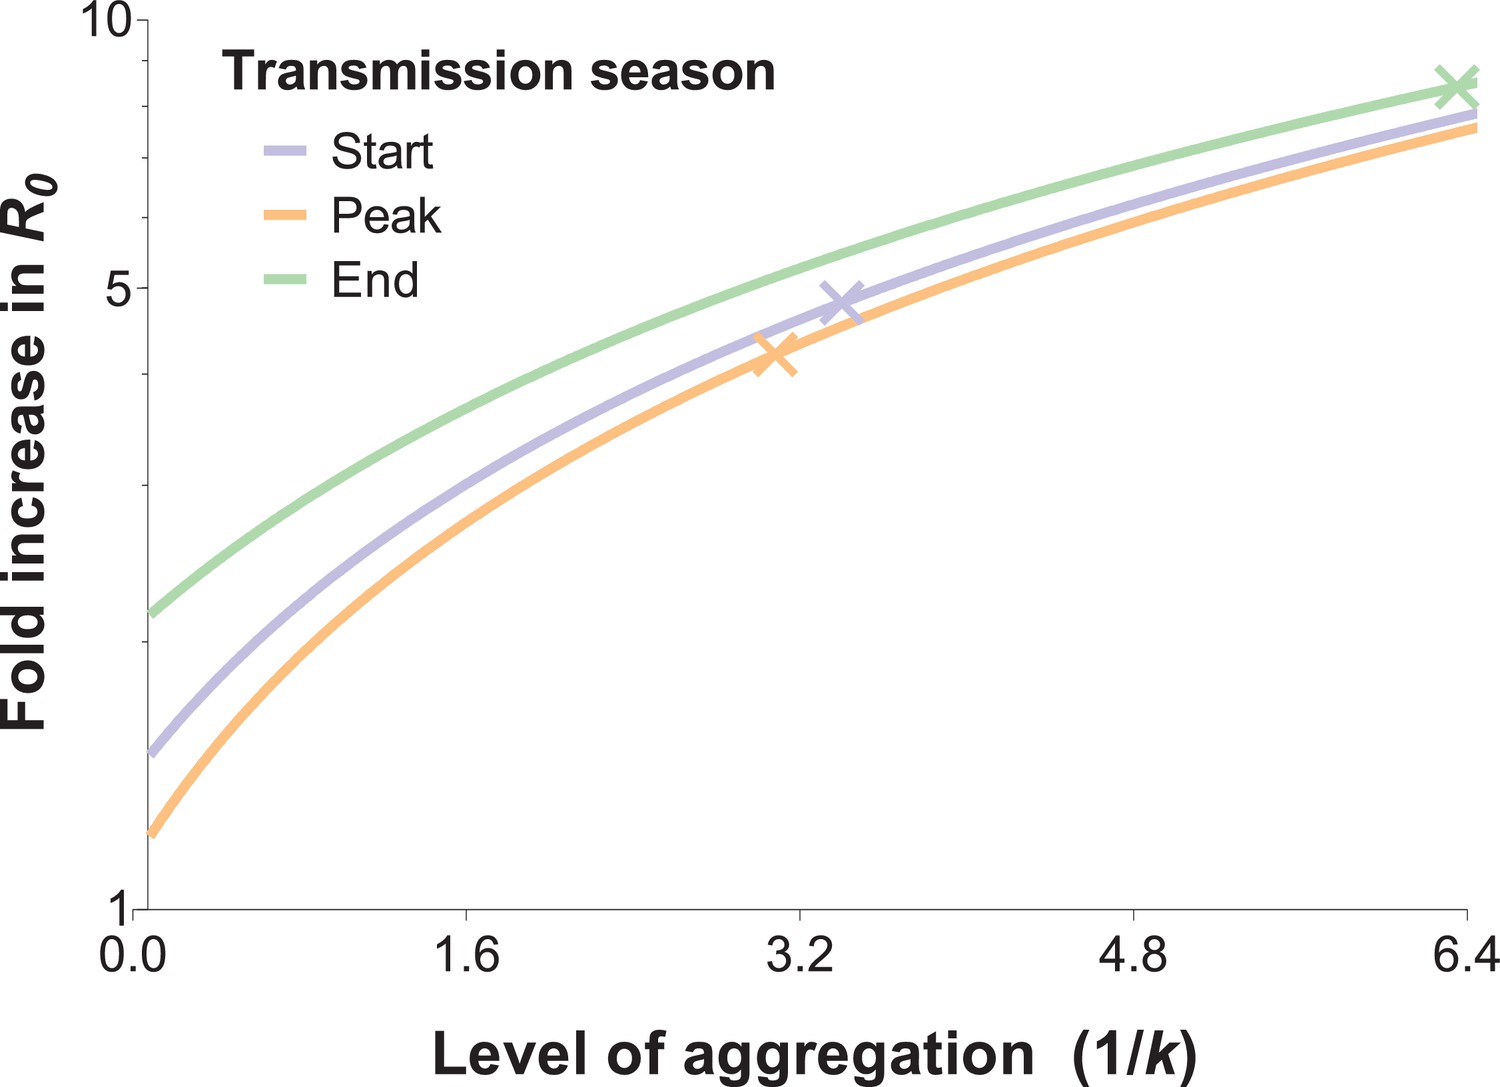
The relationship between the fold increase in R0 and the level of aggregation in mosquito bites.
This relation depends on the mean mosquito biting rate (see below), and the different curves represent the shape of this effect for different mosquito exposure levels: blue, orange and green lines correspond to settings where host-vector contact rates (mean numbers of matched mosquito bites) are similar to those observed at the start, peak and end of the transmission season, respectively. Aggregation level increases along with the inverse of the aggregation parameter k from the negative binomial distribution, where k can be calculated as the squared mean number of mosquito bites (μ2) divided by the variance in bite number (σ2) minus the mean, that is . R0 is inflated by the factor (1 + α) whereby α = ; in other words, α is the squared coefficient of variation (Smith et al., 2007). In the special case whereby bites are perfectly homogenous, the coefficient of variation is zero, and the standard formulation for R0 is regained (Woolhouse et al., 1991; Barbour, 1978). The fold increases in R0 for the levels of aggregation observed in our surveys are represented by the coloured crossed-lines.
Tables
Table 1
Study surveys
https://doi.org/10.7554/eLife.32625.002| First survey | Second survey | Third survey | |
|---|---|---|---|
| Start Date | October, 2013 | June, 2014 | September, 2014 |
| Number of sampling days | 54 | 20 | 20 |
| Timing | End of transmission season | Start of transmission season | Peak of transmission season |
| Number of households | 35* | 20 | 20 |
| Number of participants | 127 | 81 | 77 |
| N (%) | N (%) | N (%) | |
| Age categories† | |||
| <5 years | 20 (15.9) | 12 (14.8) | 12 (15.6) |
| 5–15 years | 62 (49.2) | 39 (48.2) | 37 (48.0) |
| >15 years | 44 (34.9) | 30 (37.0) | 28 (36.4) |
| Gender | |||
| Male | 41 (32.5) | 22 (27.2) | 21 (27.3) |
| Female | 85 (67.5) | 59 (72.8) | 56 (72.7) |
| Prevalence of falciparum parasites | 99 (79.2) | - | - |
| Prevalence of falciparum gametocytes | 79 (64.2) | - | - |
| Number of bloodfed mosquitoes collected | 190 | 325 | 620 |
-
*Demographic information not available for individuals living in 5/40 households (first survey only);
†Age at enrolment (first survey).
-
Parasite prevalence was determined by 18S qPCR; gametocyte prevalence by Pfs25 mRNA qRT-PCR.
Table 2
Prevalence of mosquito infection, determined by PCR performed using mosquitoes’ head-thoraces, by blood meal source (A) and mosquito species (B), and results of mixed effects logistic model on mosquito infection status (C).
https://doi.org/10.7554/eLife.32625.010| A | Prevalence of mosquito infection by blood meal source | |||
| Singly-matched, % (n/N) | Non-matched % (n/N) | Multiple human sources, % (n/N) | ||
| Timing (Transmission Season) | ||||
| Start | 6.2 (10/160) | 4.5 (2/44) | 3.3 (3/91) | |
| Peak | 9.9 (37/375) | 3.3 (2/61) | 0 (0/41) | |
| End | 23.1 (25/108) | 25.0 (7/28) | 21.1 (4/19) | |
| B | Prevalence of mosquito infection by mosquito species* | |||
| A. gambiae s. s., % (n/N) | A. coluzzii, % (n/N) | A. arabiensis, % (n/N) | ||
| Timing (Transmission Season) | ||||
| Start | 4.9 (5/101) | 3.8 (4/106) | 9.7 (3/31) | |
| Peak | 9.3 (36/386) | 2.5 (3/118) | 12.5 (1/8) | |
| End | 31.4 (27/86) | 15.4 (8/52) | 0 (0/11) | |
| C | Mixed effects logistic model on infection status* | |||
| Odds ratio (95% CI) | P-value | |||
| Mosquito species | ||||
| A. gambiae s. s. | Reference | |||
| A. coluzzii | 0.41 (0.22–0.76) | 0.005 | ||
| A. arabiensis | 0.60 (0.19–1.84) | 0.37 | ||
| Timing | ||||
| (Transmission Season) | ||||
| End | Reference | |||
| Start | 0.20 (0.09–0.45) | <0.001 | ||
| Peak | 0.22 (0.11–0.44) | <0.001 | ||
-
*Only mosquitoes with amplified human DNA were included in these calculations
Additional files
-
Transparent reporting form
- https://doi.org/10.7554/eLife.32625.013
Download links
A two-part list of links to download the article, or parts of the article, in various formats.
Downloads (link to download the article as PDF)
Open citations (links to open the citations from this article in various online reference manager services)
Cite this article (links to download the citations from this article in formats compatible with various reference manager tools)
Variation in natural exposure to anopheles mosquitoes and its effects on malaria transmission
eLife 7:e32625.
https://doi.org/10.7554/eLife.32625


