Hypocretin underlies the evolution of sleep loss in the Mexican cavefish
- Florida Atlantic University, United States
- California Institute of Technology, United States
- Carnegie Institution for Science, United States
Figures
Figure 1 with 3 supplements
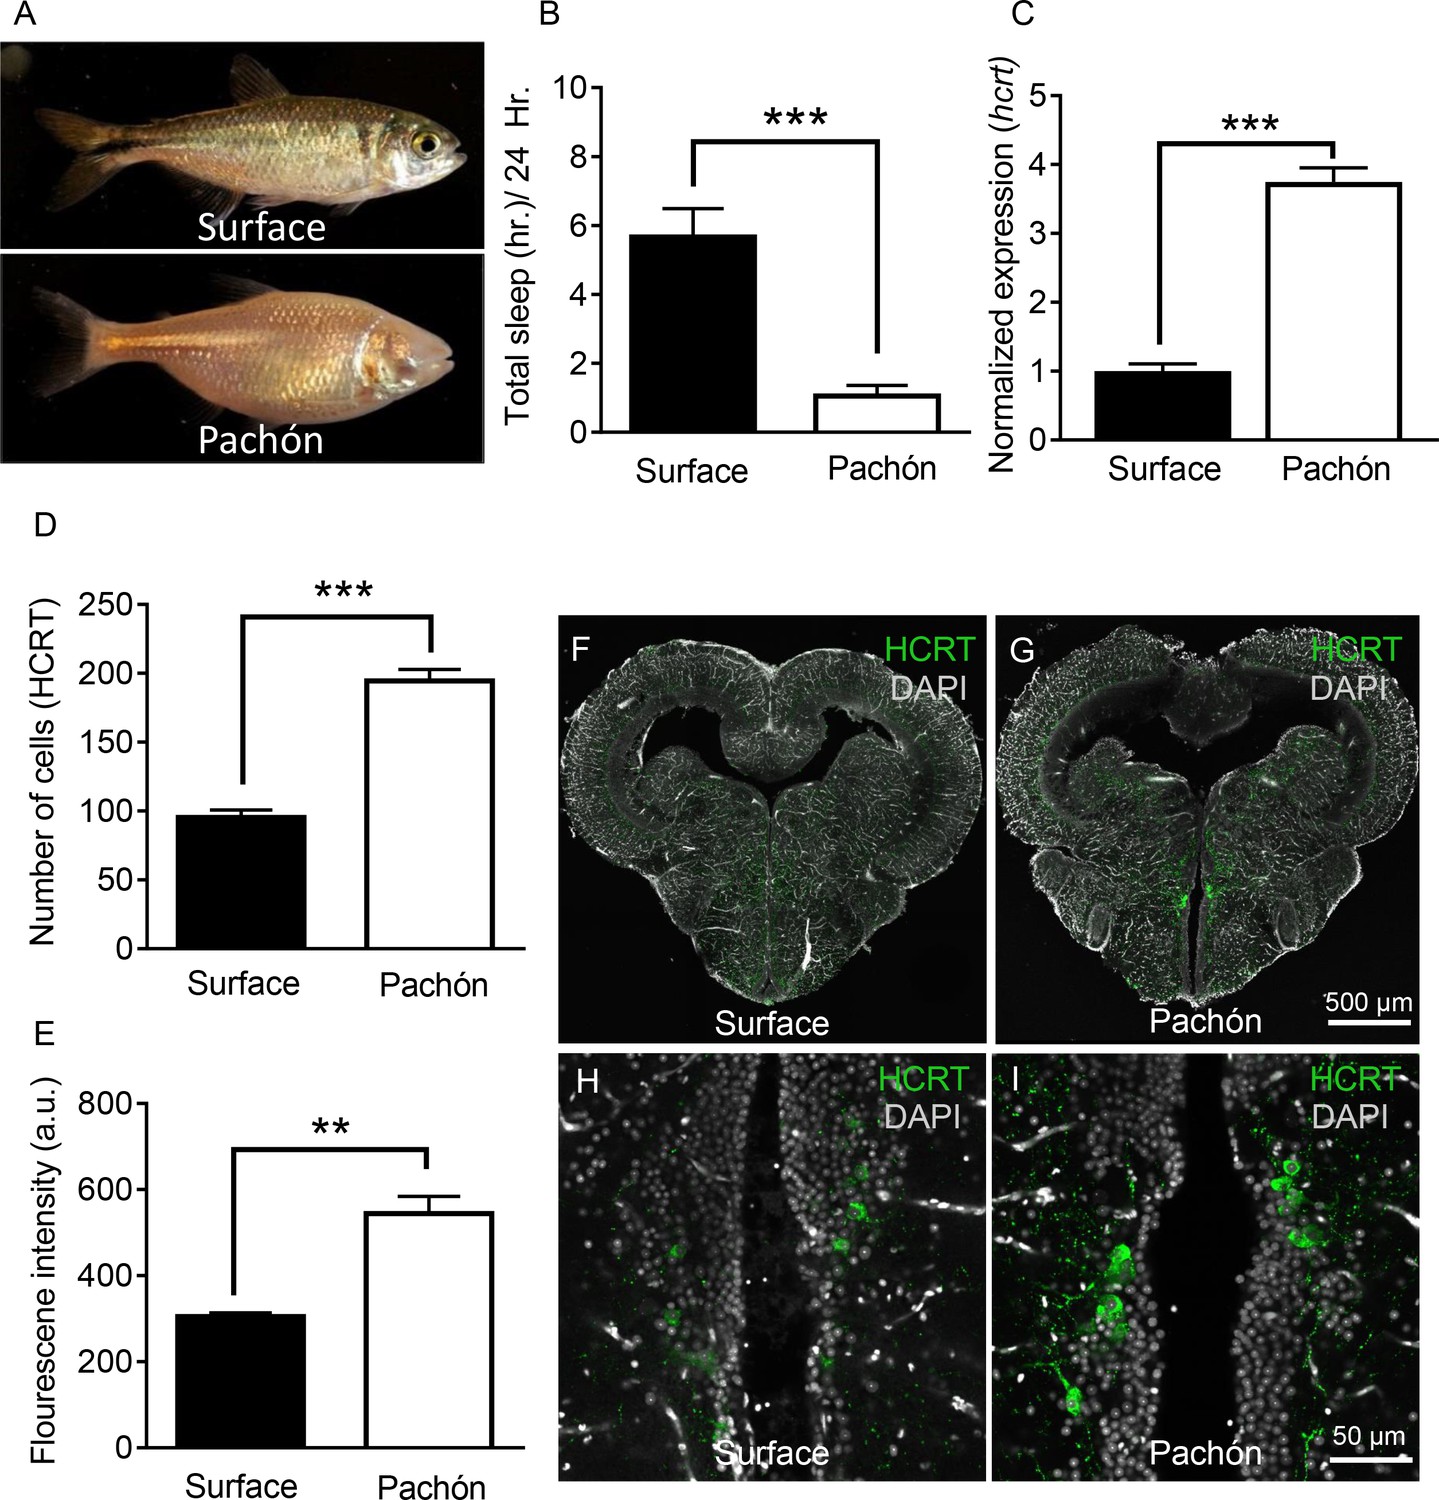
Hypocretin transcript and peptide levels are elevated in Pachón cavefish.
(A) Representative images of surface fish and Pachón cavefish (B) Sleep duration is significantly reduced in Pachón cavefish compared to surface morph (Unpaired t-test, t = 5.56, n = 26, p<0.0001). (C) Expression of hcrt normalized by GAPDH in adult whole-brain extracts is significantly enhanced in Pachón cavefish compared to surface fish (Unpaired t-test, t = 11.15, n = 8, p<0.0001). (D) HCRT neuropeptide signal is significantly increased in Pachón cavefish compared to surface fish (Unpaired t-test, t = 5.94, n = 8, p<0.001). E. The number of HCRT-positive cells in the hypothalamus is significantly increased in cavefish compared to surface fish (Unpaired t-test, t = 9.984, n = 8, p<0.0001). (F–I) Representative 2 μm confocal images from coronal slices of surface fish or Pachón brains immunostained with anti-HCRT (green) and DAPI (white) (F) Surface whole brain coronal slice. (G) Pachón whole brain coronal slice. (H) Surface fish dorsal hypothalamus containing HCRT positive cells (I) Pachón cavefish dorsal hypothalamus containing HCRT neurons in view. Scale bar denotes 500 μm (F,G); 50 μm (H,I).
-
Figure 1—source data 1
Hypocretin transcript and peptide levels are elevated in Pachón cavefish.
- https://doi.org/10.7554/eLife.32637.006
Figure 1—figure supplement 1
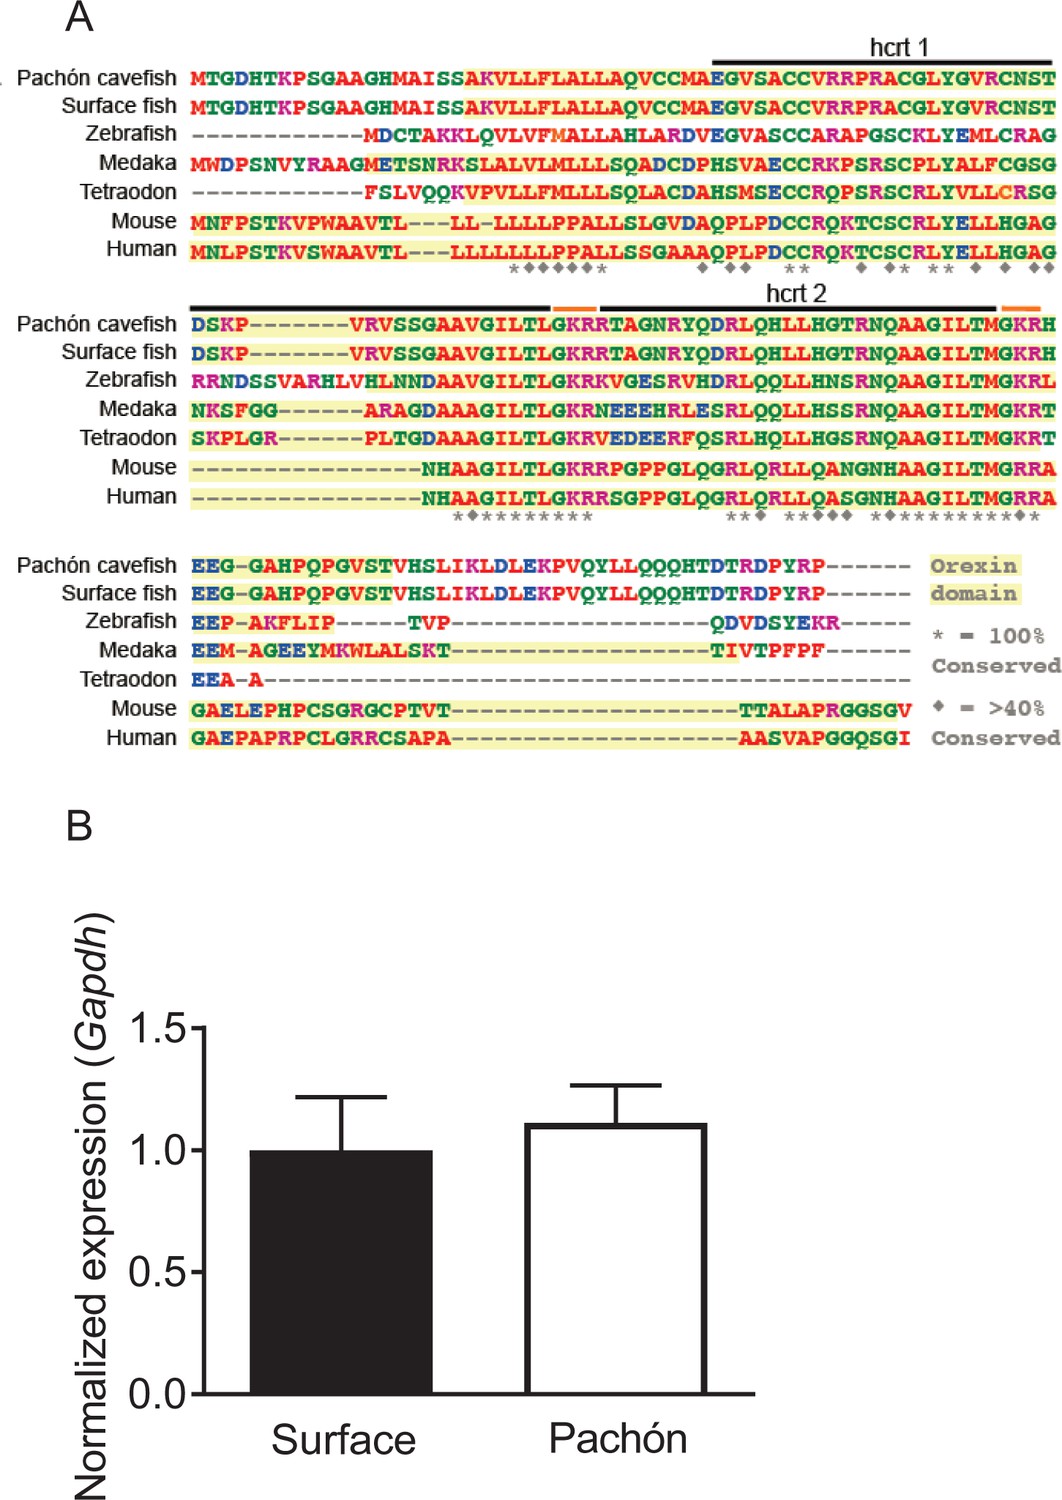
HCRT sequence is identical between surface fish and Pachón cavefish.
(A) Sequence alignment for HCRT in A. mexicanus reveals a homology of 35–48% percent identity compared to other fish species including zebrafish and medaka, and a 35% percent identity conserved compared to mammalian HCRT. (B) Housekeeping gene used for all q-PCR experiments are not significantly altered between Surface and Cavefish (Unpaired t-test, p=0.972). Expression was normalized to Surface fish.
-
Figure 1—figure supplement 1—source data 1
Quantification of qPCR housekeeping genes and fluorescent intensity between surface and cavefish.
This source file includes quantification of qPCR differences for the housekeeping gene Gadph (Figure 1—figure supplement 1B) and comparison of fluorescence intensity between surface and Pachón fry (Figure 1—figure supplement 3C).
- https://doi.org/10.7554/eLife.32637.007
Figure 1—figure supplement 2
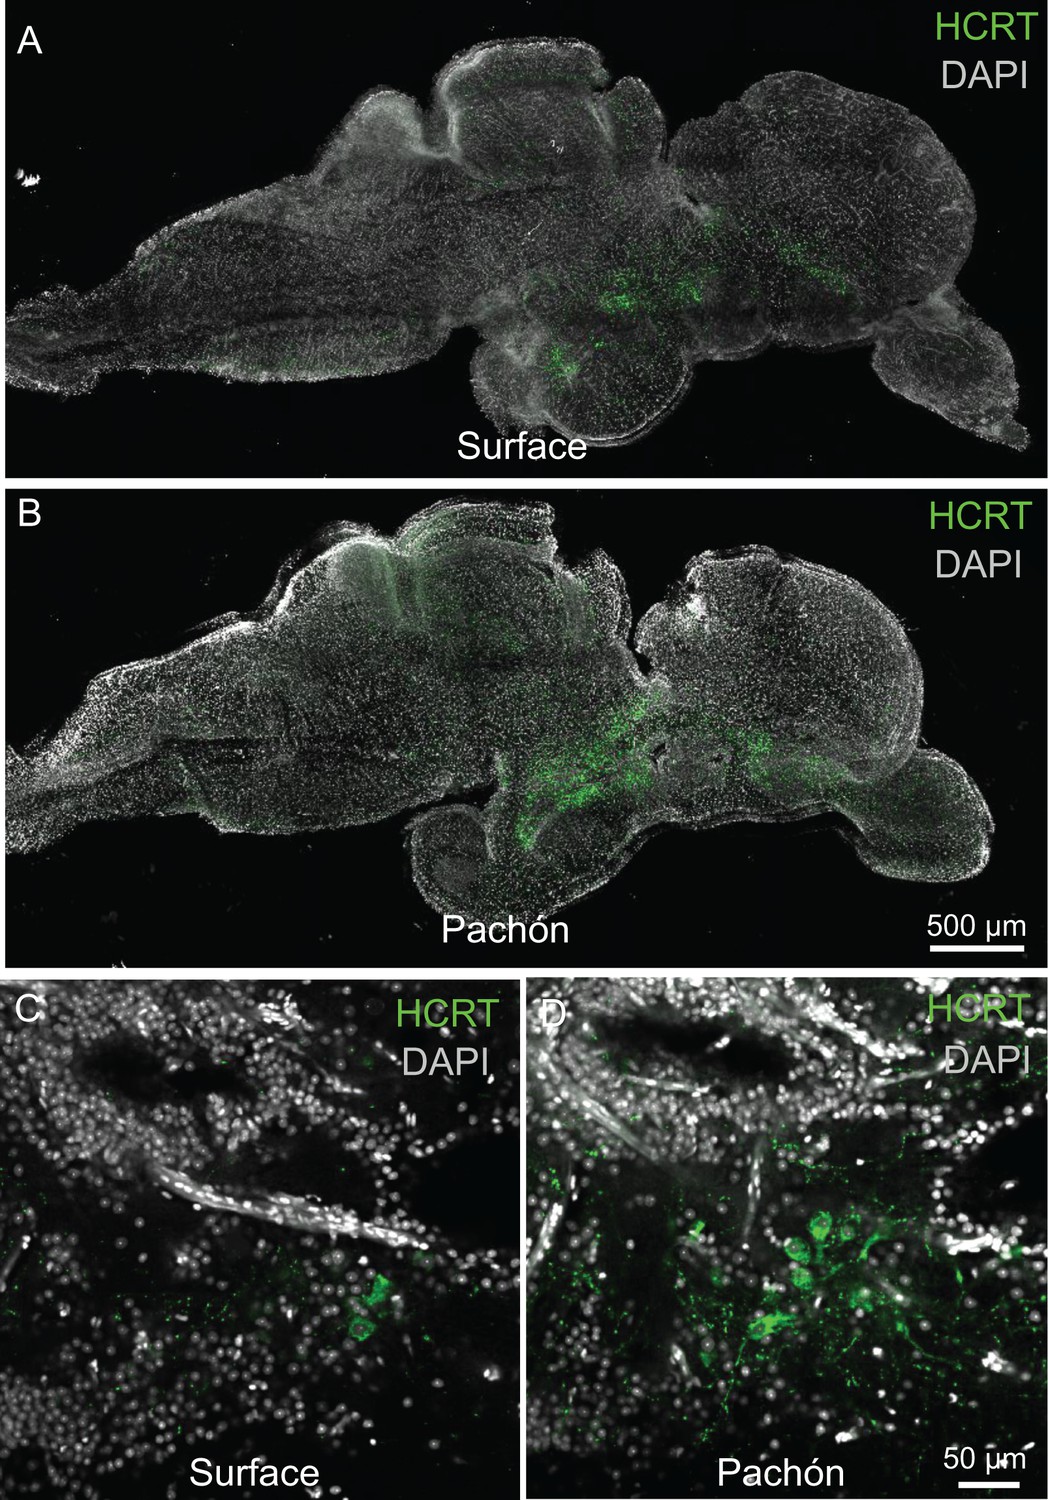
HCRT peptide levels are increased in Pachón cavefish.
(A) Surface fish whole brain from sagittal 2 μm confocal slice (B) Pachón cavefish whole brain sagittal 2 μm confocal slice. (C) Surface fish hypothamus sagittal 2 μm confocal slice. (D) Pachón cavefish hypothalmus 2 μm confocal slice.
Figure 1—figure supplement 3
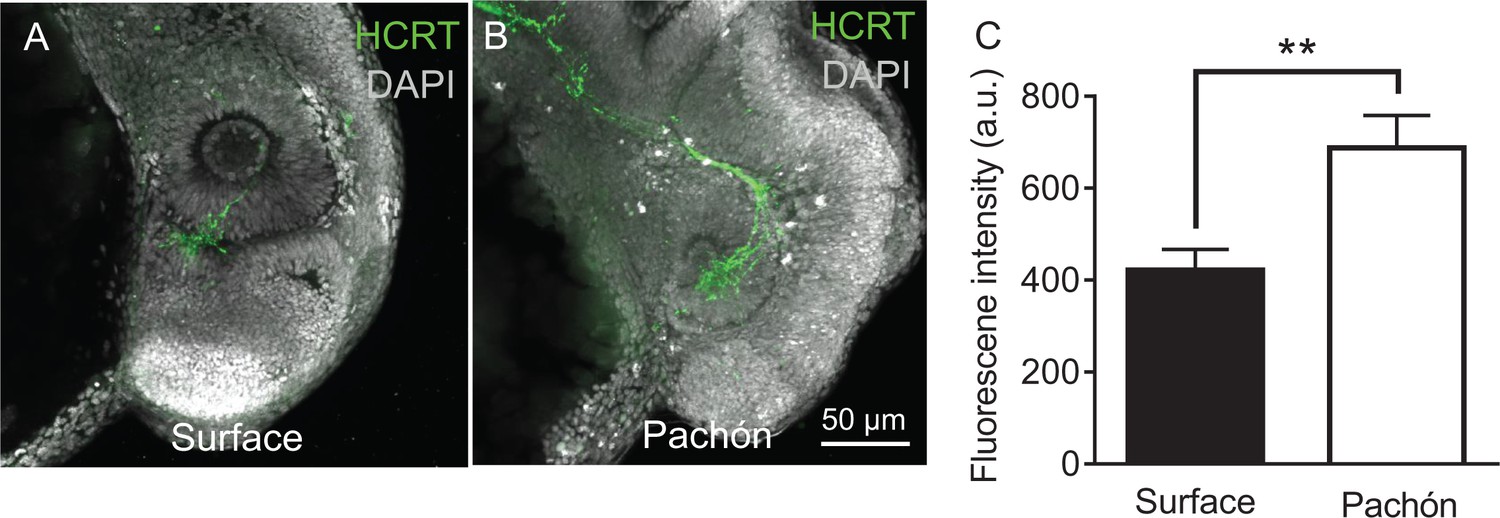
Hypocretin levels are increased in early development in Pachón cavefish.
(A) Five days post fertilization whole-mount surface fish immunostained with anti-HCRT (green) and DAPI (white). (B) Whole mount four dpf Pachón cavefish immunostained with anti-HCRT (Green) and DAPI (white). (C) HCRT neuropeptide levels are significantly increased in five dpf Pachón larvae compared to surface (Unpaired t-test, t = 3.17, df = 10, p<0.01).
Figure 2
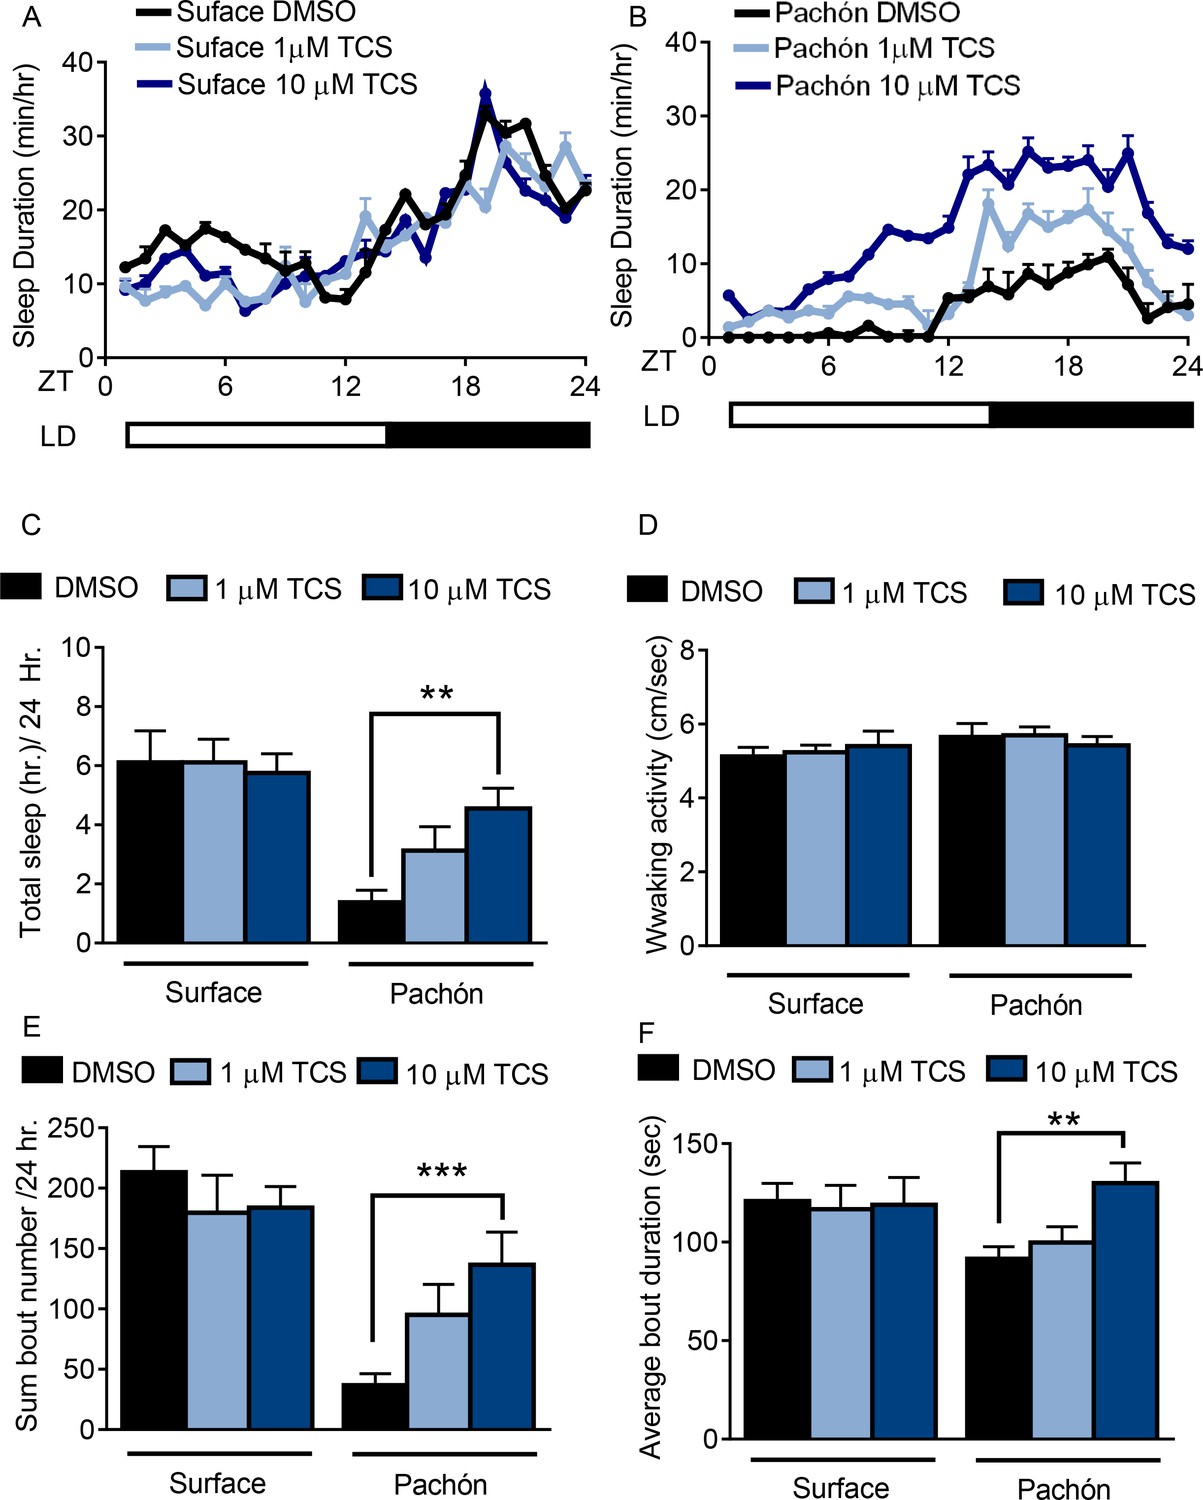
Pharmacological inhibition of HCRT Receptor two promotes sleep in Pachón cavefish.
(A,B) Twenty-four hour sleep profile in surface fish (A) Pachón cavefish (B) treated with DMSO (black), 1 μm TCS (light blue) or 10 μm TCS (dark blue). (C) TCS treatment does not affect total sleep duration in surface fish (1 μM p>0.999, n = 12, 10 uM P>0.941, n = 12). Pachón cavefish teated with 1 μM TCS trended towards increased sleep (p>0.178, n = 12) while treatment with 10 μM significantly increased sleep (p<0.01, n = 13; F(1, 73)=25.00,) compared to control treated fish. (D) Waking activity was not significantly altered in surface fish or cavefish or in response to drug treatment, 2-way ANOVA, (F(1, 73)=2.73, p>0.103, n = 79) (E) Treatment with TCS did not affect average sleep bout duration in surface fish (1 μM TCS, p>0.430, n = 12; 10 μM TCS, p>0.518, n = 12) Treatment of Pachón cavefish with 1 μM TCS trended towards increased bout duration, p>0.051, n = 12, while 10 μM TCS treatment significantly increased bout duration in Pachón cavefish, (p<0.01, n = 13; F(1, 73)=47.42). (F) TCS treatment did not affect total sleep bout number in surface fish 1 μM TCS, p>0.976, n = 12; 10 μM TCS, p>0.998, n = 12). In Pachón cavefish, treatment with 1 μM TCS did not affect sleep bout number (p>0.828, n = 12). Treatment with 10 μM TCS significantly increased bout duration in Pachón cavefish,(p<0.001, n = 13; 2-way ANOVA, F(1, 68)=3.309).
-
Figure 2—source data 1
Pharmacological inhibition of HCRT Receptor two promotes sleep in Pachón cavefish.
- https://doi.org/10.7554/eLife.32637.009
Figure 3 with 2 supplements

Panel of pharmacological HCRT antagonists reveals wake-promoting role of HCRT in juvenile cavefish.
(A) Two SORAs and one DORA were used to inhibit binding of HCRT to its receptor. (B) Total sleep is not significantly altered in surface fish with the treatment of HCRT antagonists (TCS, p=0.814, n = 18; Suvorexant, p=0.865, n = 18; EMPA, p=0.972, n = 19). Pachón cavefish significantly increased total sleep in response to HCRT antagonists (TCS, p=0.004, n = 18; Suvorexant, p=0.032, n = 19, EMPA, p=0.027, n = 18; 2-way ANOVA, F(1, 135)=43.70, p<0.0001). (B) Waking activity was not significantly altered in any fish or in response to drug treatment, Surface TCS, p=0.996, n = 18; Suvorexant, p=0.925, n = 18; EMPA, p=0.816, n = 19; Pachón, TCS, p=0.980, n = 18; Suvorexant, p>0.999, n = 19; EMPA, p=0.917, n = 18; 2-way ANOVA, (F(1, 135)=7.21, p=0.008) (C) The total number of sleep bouts over 24 hr of drug treatment did not significantly change in surface fish (TCS, p=0.814, n = 18; Suvorexant, p=0.865, n = 18; EMPA, p=0.972, n = 19). Total sleep bouts were significantly increased in Pachón cavefish with TCS, p=0.002, n = 18; and EMPA, p=0.041, n = 18, Suvorexant trended towards significance, p=0.071, n = 19 (2-way ANOVA, F(1, 135)=45.27, p<0.0001). (D) Average sleep bout length was not significantly different in Surface fish treated with HCRT antagonists (TCS, p=0.822, n = 18; Suvorexant, p=0.805, n = 18; EMPA, p=0.236, n = 19). Pachón cavefish significantly increased their average sleep bout lengths with TCS, p=0.039, N = 18; and with Suvorexant, p=0.009, n = 19. EMPA trended towards significance, p=0.078, n = 18 (2-way ANOVA, F(1, 135)=14.06, p=0.0003).
-
Figure 3—source data 1
Panel of pharmacological HCRT antagonists reveals wake-promoting role of HCRT in juvenile cavefish.
- https://doi.org/10.7554/eLife.32637.013
Figure 3—figure supplement 1
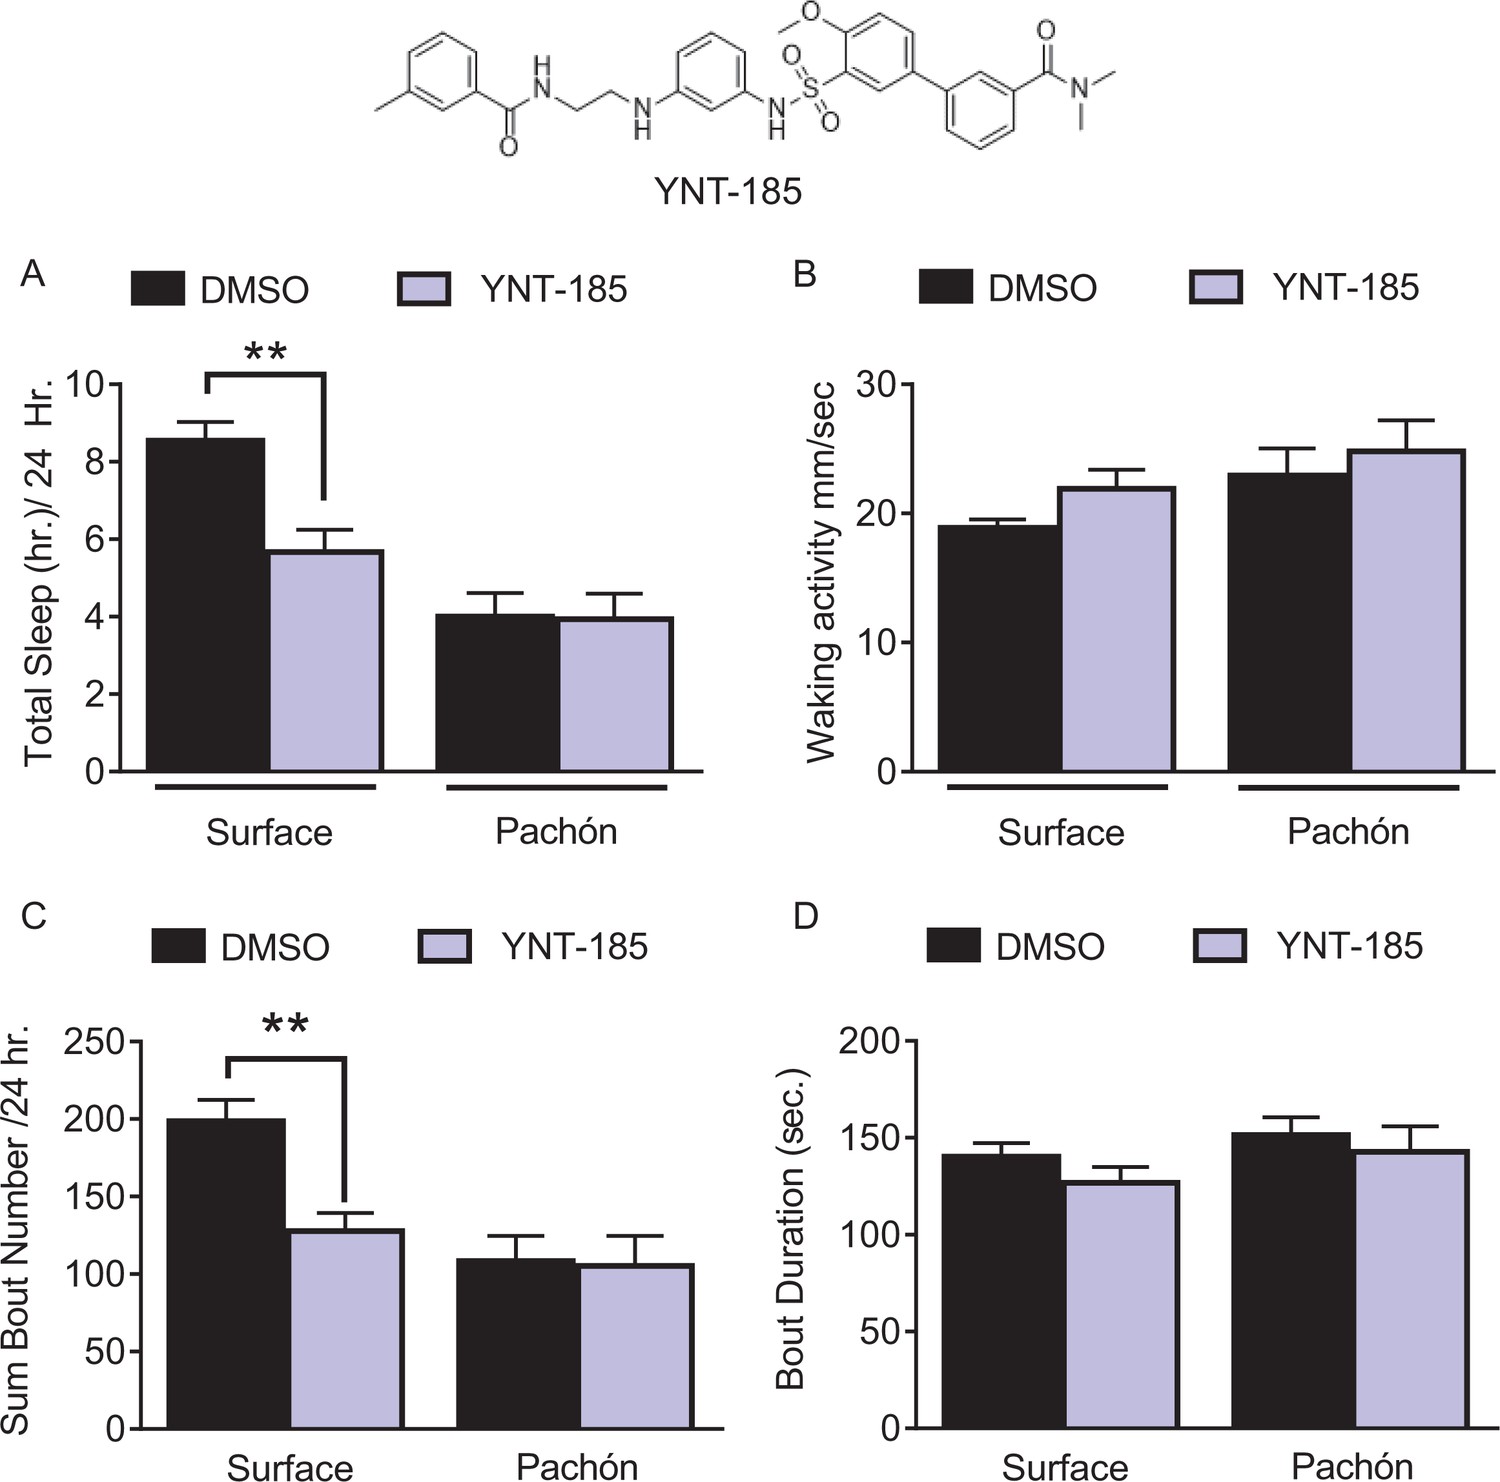
HCRT agonist partially alters sleep behavior in juvenile surface fish, but not Pachón cavefish.
(A) Total sleep was significantly reduced in surface fish (p=0.001, n = 26) while there was no effect with YNT-185 treatment in Pachón cavefish (p=0.997, n = 16; 2-way ANOVA, F(1,77)=25.81, p<0001). (B) Waking activity was not significantly altered between surface fish (p=0.228, n = 26) or Pachon cavefish (p=0.716, n = 16) or with treatment of YNT-185 among either treatment groups (2-way ANOVA, F(1,77)=0.133, p=0.715). (C) Total sleep bouts were significantly reduced in surface fish with YNT-185 treatment (p=0.0005, n = 26). However, there was no alteration in sleep bouts in Pachón cavefish (p=0.989, n = 16; 2-way ANOVA, F(1,77)=14.78, p=0.0002). (D) Average Sleep bout duration was not significantly changed in either surface fish (p=0.391, n = 26) or in Pachón cavefish (p=0.820, n = 16; 2-way ANOVA, F(1,77)=2.06, p=0.155).
-
Figure 3—figure supplement 1—source data 1
Inhibition of HCRT signaling increases sleep in larval cavefish.
This source file includes analysis of 1 um and 10 um TCS treatment on total sleep duration in surface fish and Pachón cavefish (Figure 3—figure supplement 1B).
- https://doi.org/10.7554/eLife.32637.014
Figure 3—figure supplement 2
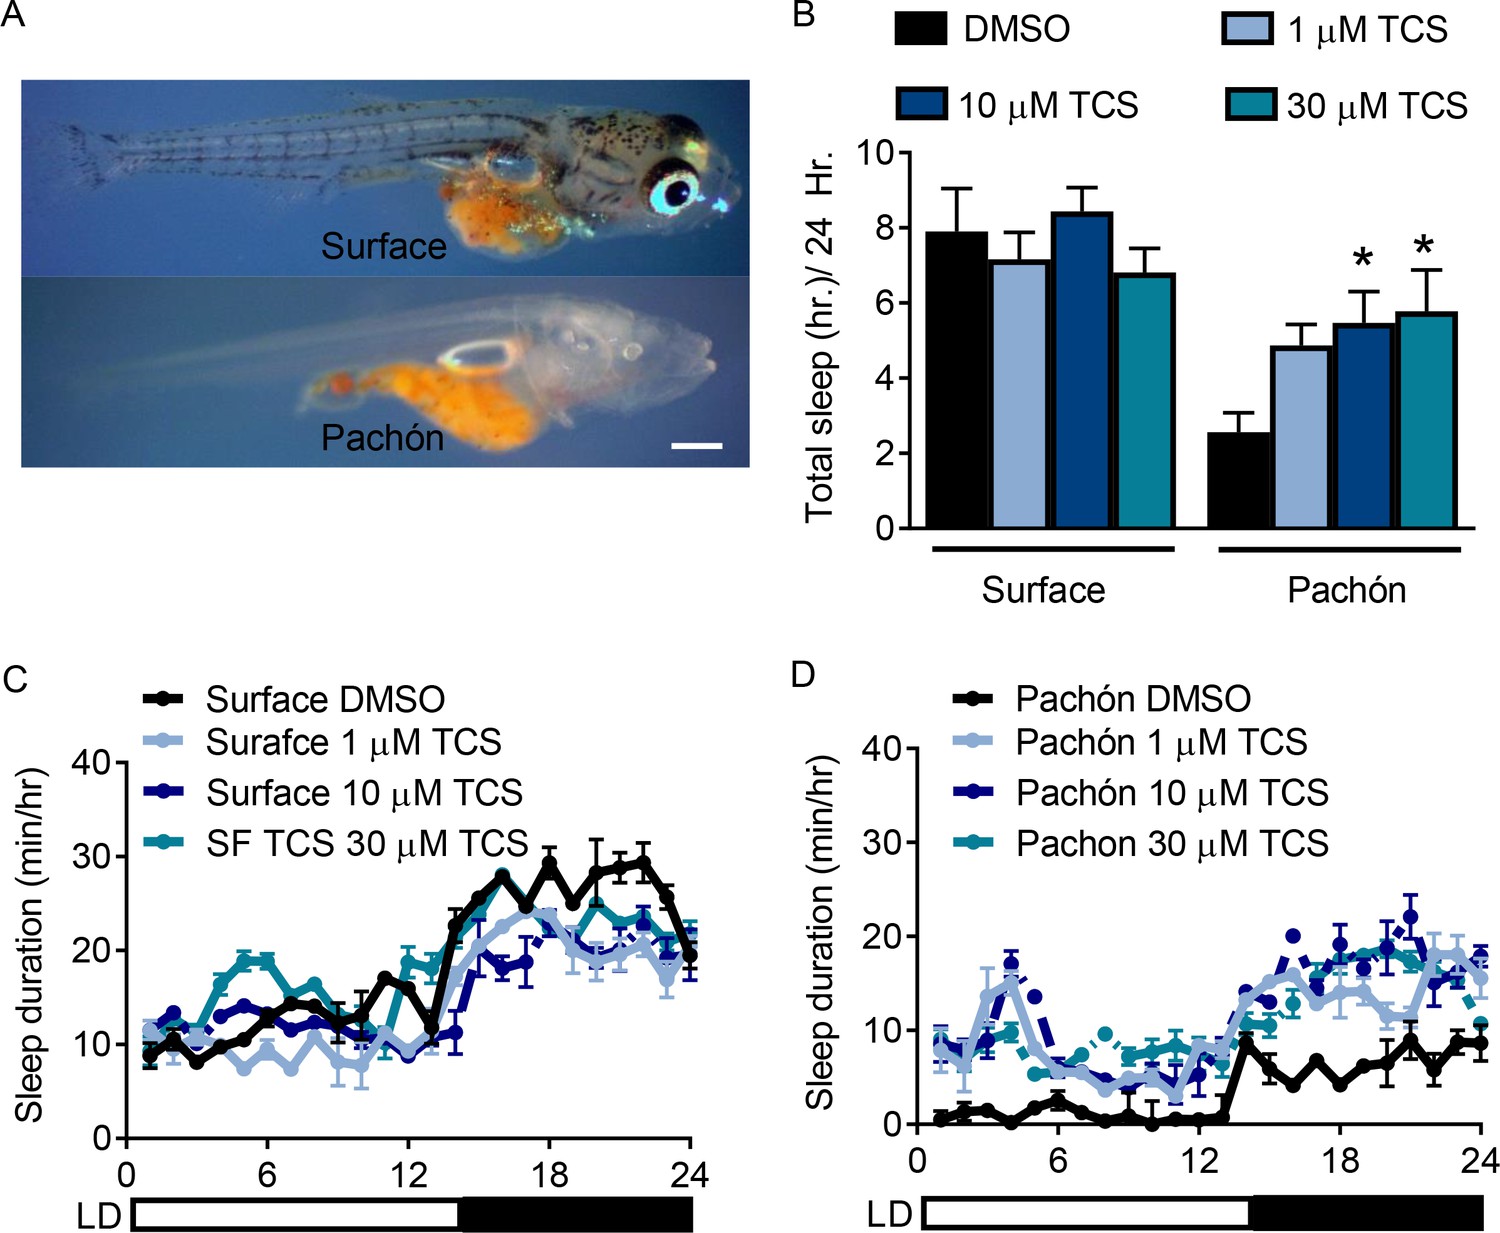
HCRTR2 blockade selectively increases sleep in Pachón cavefish.
(A) Representative images of surface (top) and Pachón (bottom) fish at 25 dpf. (B) TCS treatment did not affect sleep duration in surface fish (1 µM, P=0.782, n=18, 10 µM P=0.891, 30 µM, P=0.791 n=18) while Pachón cavefish increased total sleep duration in response to 10 and 30 µM TCS treatment (1 µM, P>0.116, n=17; 10 µM, P<0.031, 30 µM, P=0.02 n=18, 2-way ANOVA, F(2,88)=12.178). C-D. Twenty-four hour sleep profiles of surface fish (C) and Pachón cavefish (D).
-
Figure 3—figure supplement 2—source data 2
HCRT agonist partially alters sleep behavior in juvenile surface fish, but not Pachón cavefish.
This source data file includes quantification of the effects of the HCRT agonist YNT-185 on total sleep duration (Figure 3—figure supplement 2A), waking activity (Figure 3—figure supplement 2B), total bout number (Figure 3—figure supplement 2C), and average bout duration (Figure 3—figure supplement 2D).
- https://doi.org/10.7554/eLife.32637.015
Figure 4 with 1 supplement
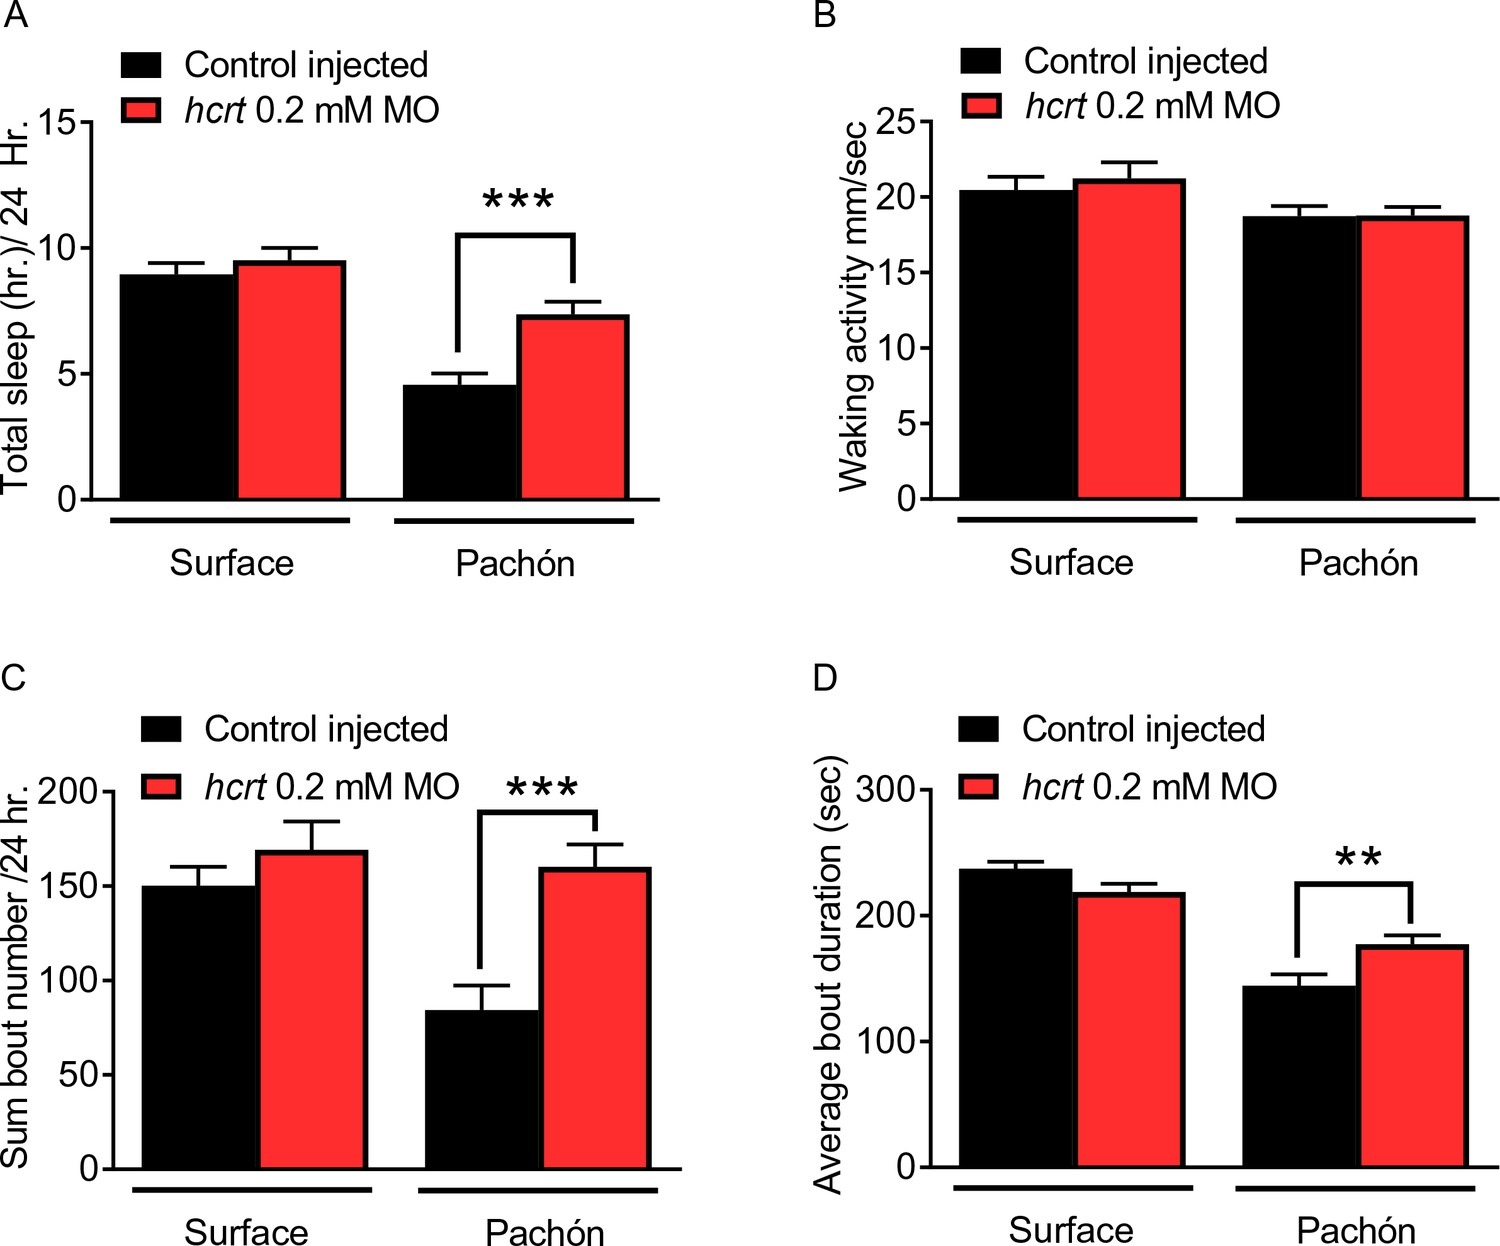
Transient knockdown of hcrt increases sleep in four dpf cavefish.
(A) Morpholino knock-down of hcrt does not alter total sleep in surface fish, p=0.640, n = 34, while in cavefish total sleep time was significantly increased with hcrt knock-down, p=0.0002, n = 40; 2-way ANOVA, F(1,133)=45.82, p<0.0001 (B) Waking activity was not significantly altered in either surface fish (p=0.343, n = 34) or Pachón cavefish (p=0.084, n = 40; 2-way ANOVA, F(1, 133)=5.807). (C) Total number of sleep bouts in surface fish was not significantly different from injected controls, p=0.459, n = 34. While in Pachón cavefish, total sleep bouts over 24 hr was significantly increased in hcrt MO fish compared to control fish (p=0.0004, n = 40; 2-way ANOVA, F(1,133)=8.295, p=0.004). (D) Average sleep bout duration was not different between controls and hcrt MO injected surface fish (p=0.081, n = 34). There was a significant increase in average bout duration In Pachón hcrt MO injected fish compared to their respective controls (p=0.004, n = 40; 2-way ANOVA, F(1,133)=13.61, p=0.0003).
-
Figure 4—source data 1
Transient knockdown of hcrt increases sleep in 4 days post fertilization cavefish.
- https://doi.org/10.7554/eLife.32637.017
Figure 4—figure supplement 1
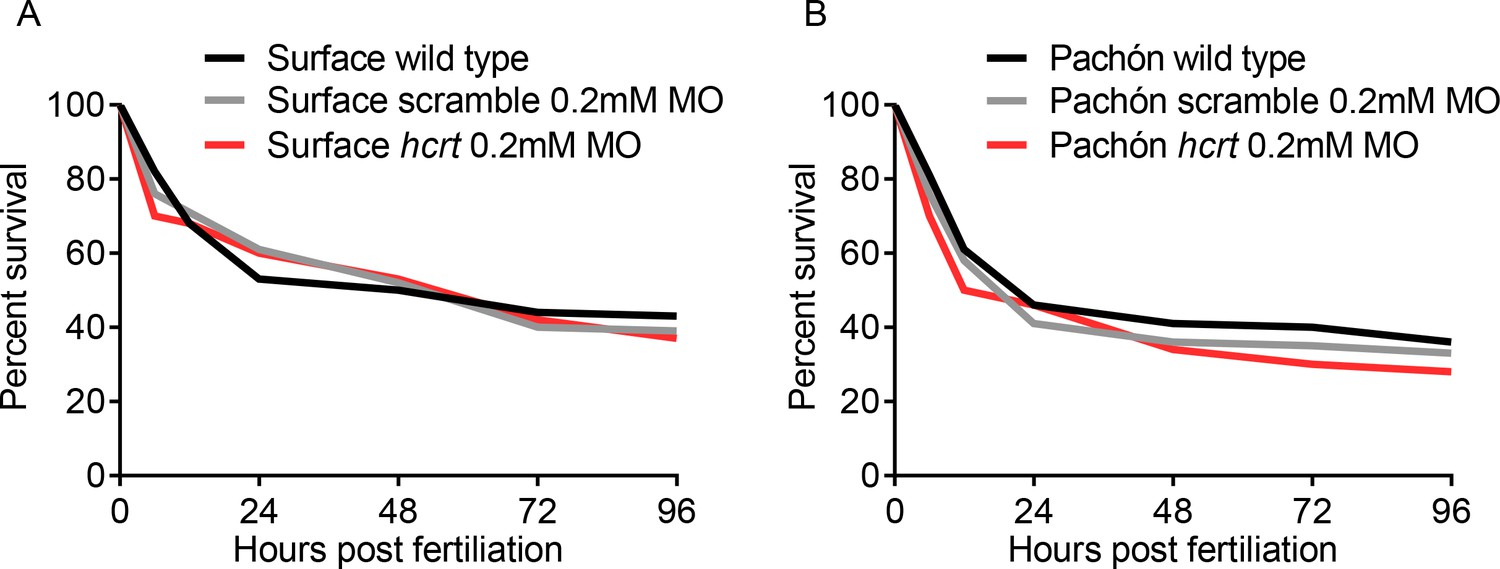
Morpholino injections do not affect survival in development.
(A) No significant difference in surface fish survival from embryo injection to 96 hr post fertilization (Kruskall-Wallis, p=0.719, Dunn’s post test, Wild Type vs. Scramble MO, p=0.862, Scramble MO vs. hcrt MO, p=0.701). (B) Pachón fish survival from embryo injection compared to controls up to 96 hr post fertilization (Kruskall-Wallis, p=0.429, Dunn’s post test, Wild Type vs. Scramble MO, p=0.299, Scramble MO vs. hcrt MO, p=0.206).
-
Figure 4—figure supplement 1—source data 1
The effect of morpholino injection on survival in surface fish and cavefish.
This source file includes data analysis quantifying the effects of morpholino injection on survival in surface fish (Figure 4—figure supplement 1A), and Pachón cavefish; Figure 4—figure supplement 1B over the first 96 hr post fertilization.
- https://doi.org/10.7554/eLife.32637.019
Figure 5 with 1 supplement
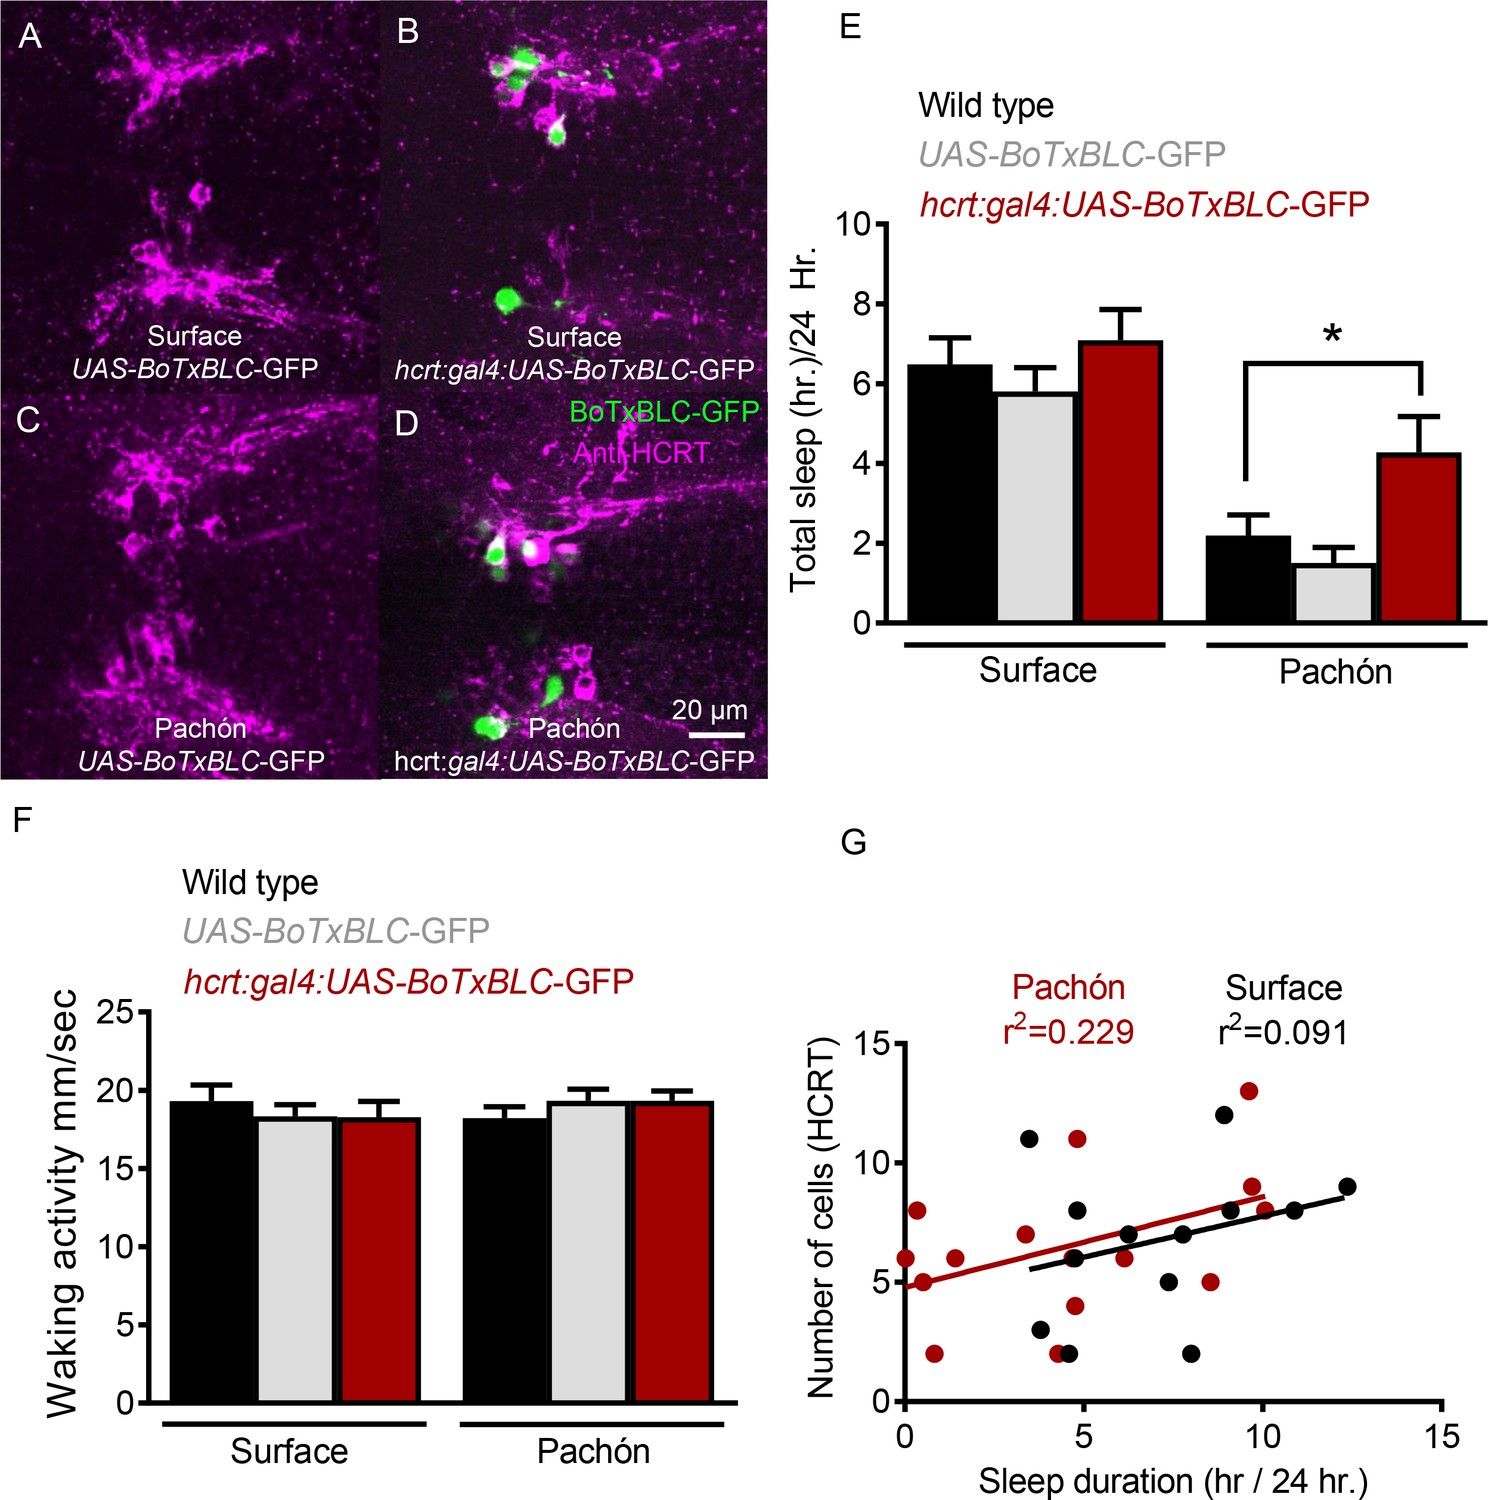
Genetic silencing of subsets of HCRT neurons selectively increases sleep in Pachón cavefish.
(A) Surface UAS-BoTx-BLC-GFP (B) Surface hcrt:GAL4-UAS-BoTx-BLC-GFP (C) Pachón UAS-BoTx-BLC-GFP (D) Pachón hcrt:GAL4-UAS-BoTx-BLC-GFP (E) Neuronal silencing of HCRT cells did not alter total sleep duration in surface fish (Wild Type*UAS-BoTx-BLC-GFP, p=0.989, n = 23; UAS-BoTx-BLC-GFP* hcrt:GAL4-UAS-BoTx-BLC-GFP, p=0.713, n = 14). Pachón cavefish increased their total sleep when HCRT cells were silenced (Wild Type*UAS-BoTx-BLC-GFP, p=0.667, n = 21; UAS-BoTx-BLC-GFP* hcrt:GAL4-UAS-BoTx-BLC-GFP, p=0.0426, n = 15; 2-way ANOVA, F(1,91)=65.68, p<0.0001). (F) Waking activity was not altered in either Surface or Pachón cavefish with neuronal silencing of HCRT (Surface fish Wild Type*UAS-BoTx-BLC-GFP, p=0.616, n = 23; UAS-BoTx-BLC-GFP* hcrt:GAL4-UAS-BoTx-BLC-GFP, p=0.642, n = 14; Pachón Wild Type*UAS-BoTx-BLC-GFP, p=0.587 n = 21; UAS-BoTx-BLC-GFP* hcrt:GAL4-UAS-BoTx-BLC-GFP, p=0.612, n = 15; 2-way ANOVA, F(1,91)=0.206, p=0.650). (G) Regression analysis revealed there was a subtle trend of increased sleep with more HCRT neurons silenced as quantified with GFP signal (R2 = 0.091, p=0.314, n = 14). The same regression analysis in Pachón cavefish revealed a much more robust correlation to increased sleep in more silenced HCRT cells (R2 = 0.229, p=0.0871, N = 15).
-
Figure 5—source data 1
Genetic silencing of subsets of HCRT neurons selectively increases sleep in Pachón cavefish.
- https://doi.org/10.7554/eLife.32637.022
Figure 5—figure supplement 1
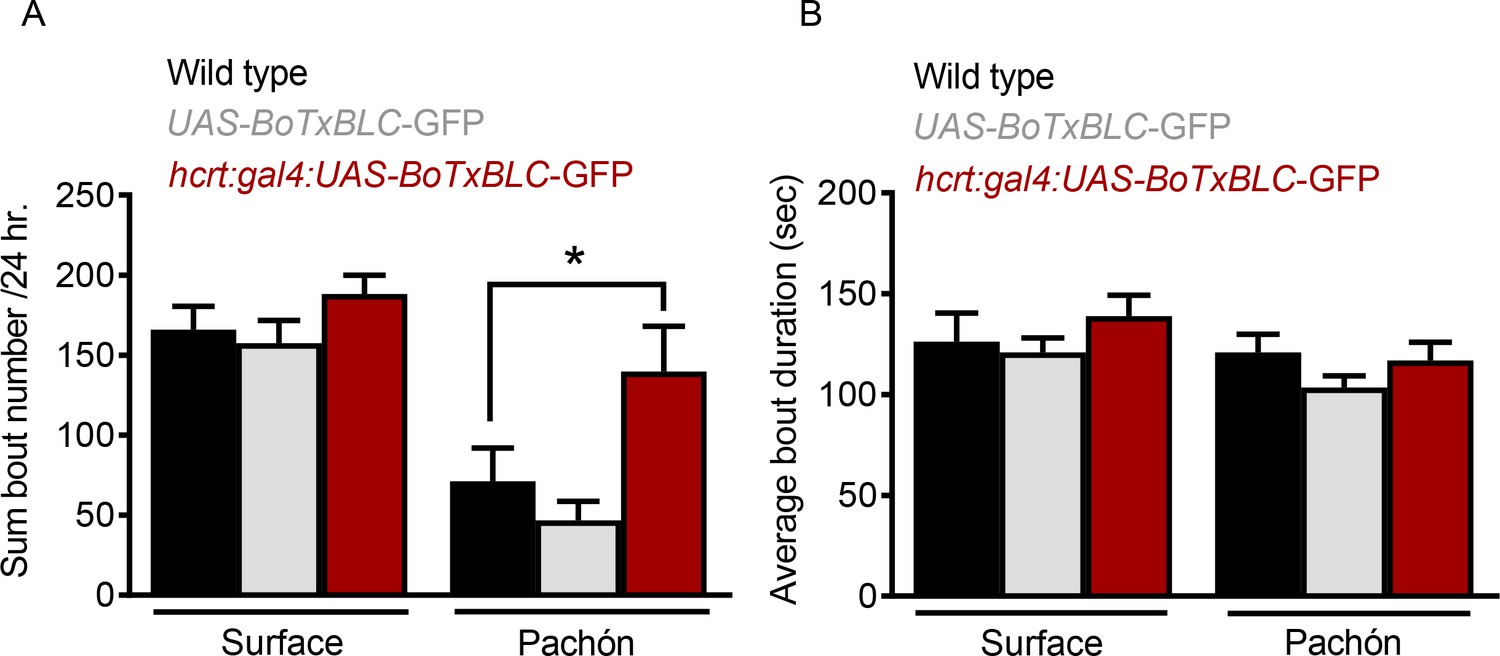
Genetic silencing of subsets of HCRT alters sleep architecture in Pachón cavefish.
(A) Total sleep bouts were not significantly altered in surface fish when HCRT cells were silenced (Wild Type*UAS-BoTx-BLC-GFP, p=0.561, n = 23; UAS-BoTx-BLC-GFP* hcrt:GAL4-UAS-BoTx-BLC-GFP, p=0.636, n = 14). When HCRT cell were silenced in Pachón cavefish there was a significant increase in their total number of sleep bouts (Wild Type*UAS-BoTx-BLC-GFP, p=0.561, n = 21; UAS-BoTx-BLC-GFP* hcrt:GAL4-UAS-BoTx-BLC-GFP, p=0.031, n = 15; 2-way ANOVA, F(1,91)=32.43, p<0.0001). (B) Sleep bout duration was not changed in either Surface fish or Pachon cavefish when HCRT neurons were silenced (Surface Wild Type*UAS-BoTx-BLC-GFP, p>0.999, n = 21; Surface UAS-BoTx-BLC-GFP* hcrt:GAL4-UAS-BoTx-BLC-GFP, p=0.743, n = 15; Pachón Wild Type*UAS-BoTx-BLC-GFP, p=0.401, n = 21; Pachón UAS-BoTx-BLC-GFP* hcrt:GAL4-UAS-BoTx-BLC-GFP, p>0.999, n = 15;2-way ANOVA, F(1,91)=3.886, p=0.052).
-
Figure 5—figure supplement 1—source data 1
Genetic silencing of subsets of HCRT alters sleep architecture in Pachón cavefish.
This source file contains analysis of total bout number (Figure 5—figure supplement 1A), and bout duration (Figure 5—figure supplement 1B) in fish with genetically silenced HCRT neurons.
- https://doi.org/10.7554/eLife.32637.023
Figure 6
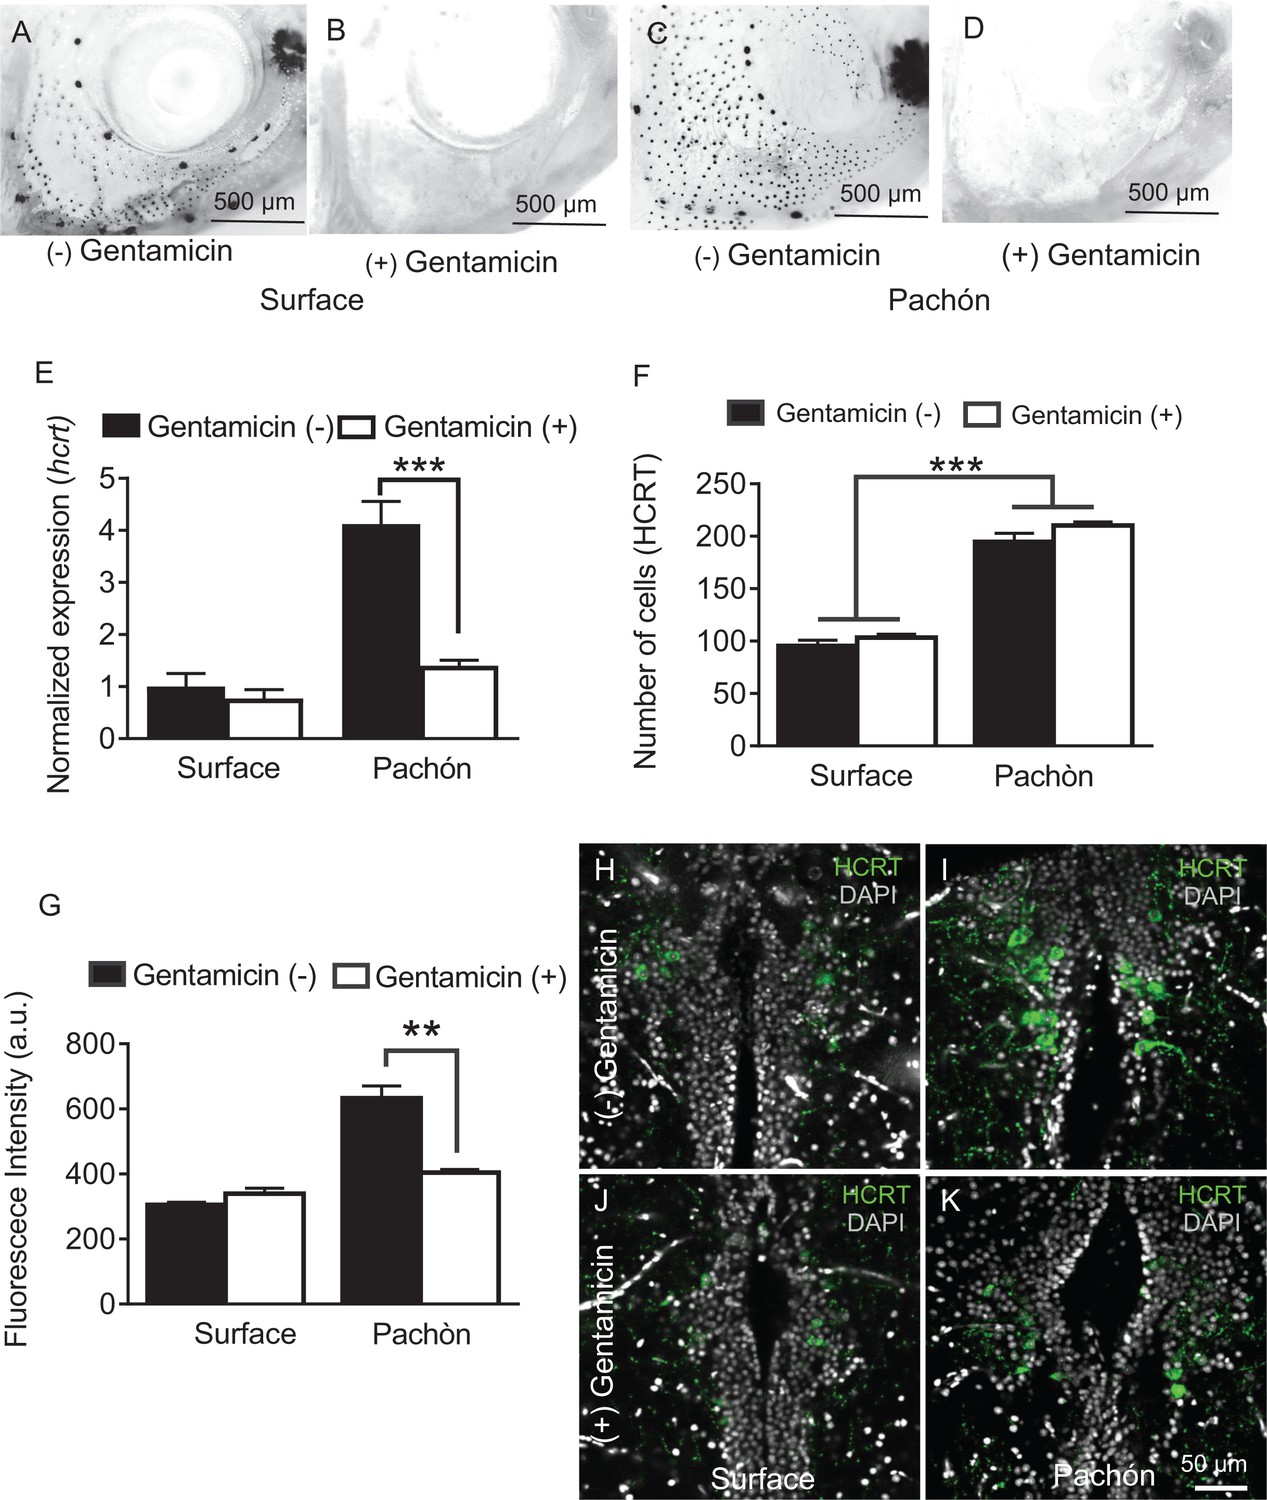
Chemical ablation of mechanosensory lateral line reduces HCRT levels in Pachón cavefish.
(A-D). Photomicrographs of surface fish cranial regions stained with DASPEI to reveal lateral line mechanosensory neuromasts. Treatment with gentamicin ablates lateral line neuromasts in surface fish (B) and Pachón cavefish (D) (E) Gentamicin treatment has no significant effect on hcrt expression in surface fish (p>0.635, n = 8) while in Pachón cavefish gentamicin treatment significantly reduces hcrt expression, restoring surface-like levels. (Pachón treated vs. untreated, p<0.0001; Pachón treated vs. surface untreated, p>0.635, n = 8, F(1,28)=21.28). (F) Fluorescent intensity per hypothalamic HCRT-cell was not altered with gentamicin treatment in surface fish, p=0.590, n = 4. In Pachón cavefish, HCRT neuropeptide levels are significantly lower following gentamicin treatment (p<0.0001, n = 4; 2-way ANOVA, F (1, 13)=0.0001 G. Gentamicin treatment has no effect on total number of HCRT cell number in either surface or Pachón cavefish (p>0.494, n = 8, F (1, 13C)=0.4967). (H–K) Representative 2 μm confocal images of the dorsal hypothalamic region in surface fish and Pachón cavefish immunostained with HCRT (green) and DAPI (white) (H) Surface control (I) Pachón control (J) Surface gentamicin K. Pachón gentamicin. Scale bar = 50 μm.
-
Figure 6—source data 1
Chemical ablation of mechanosensory lateral line reduces HCRT levels in Pachón cavefish.
- https://doi.org/10.7554/eLife.32637.025
Figure 7
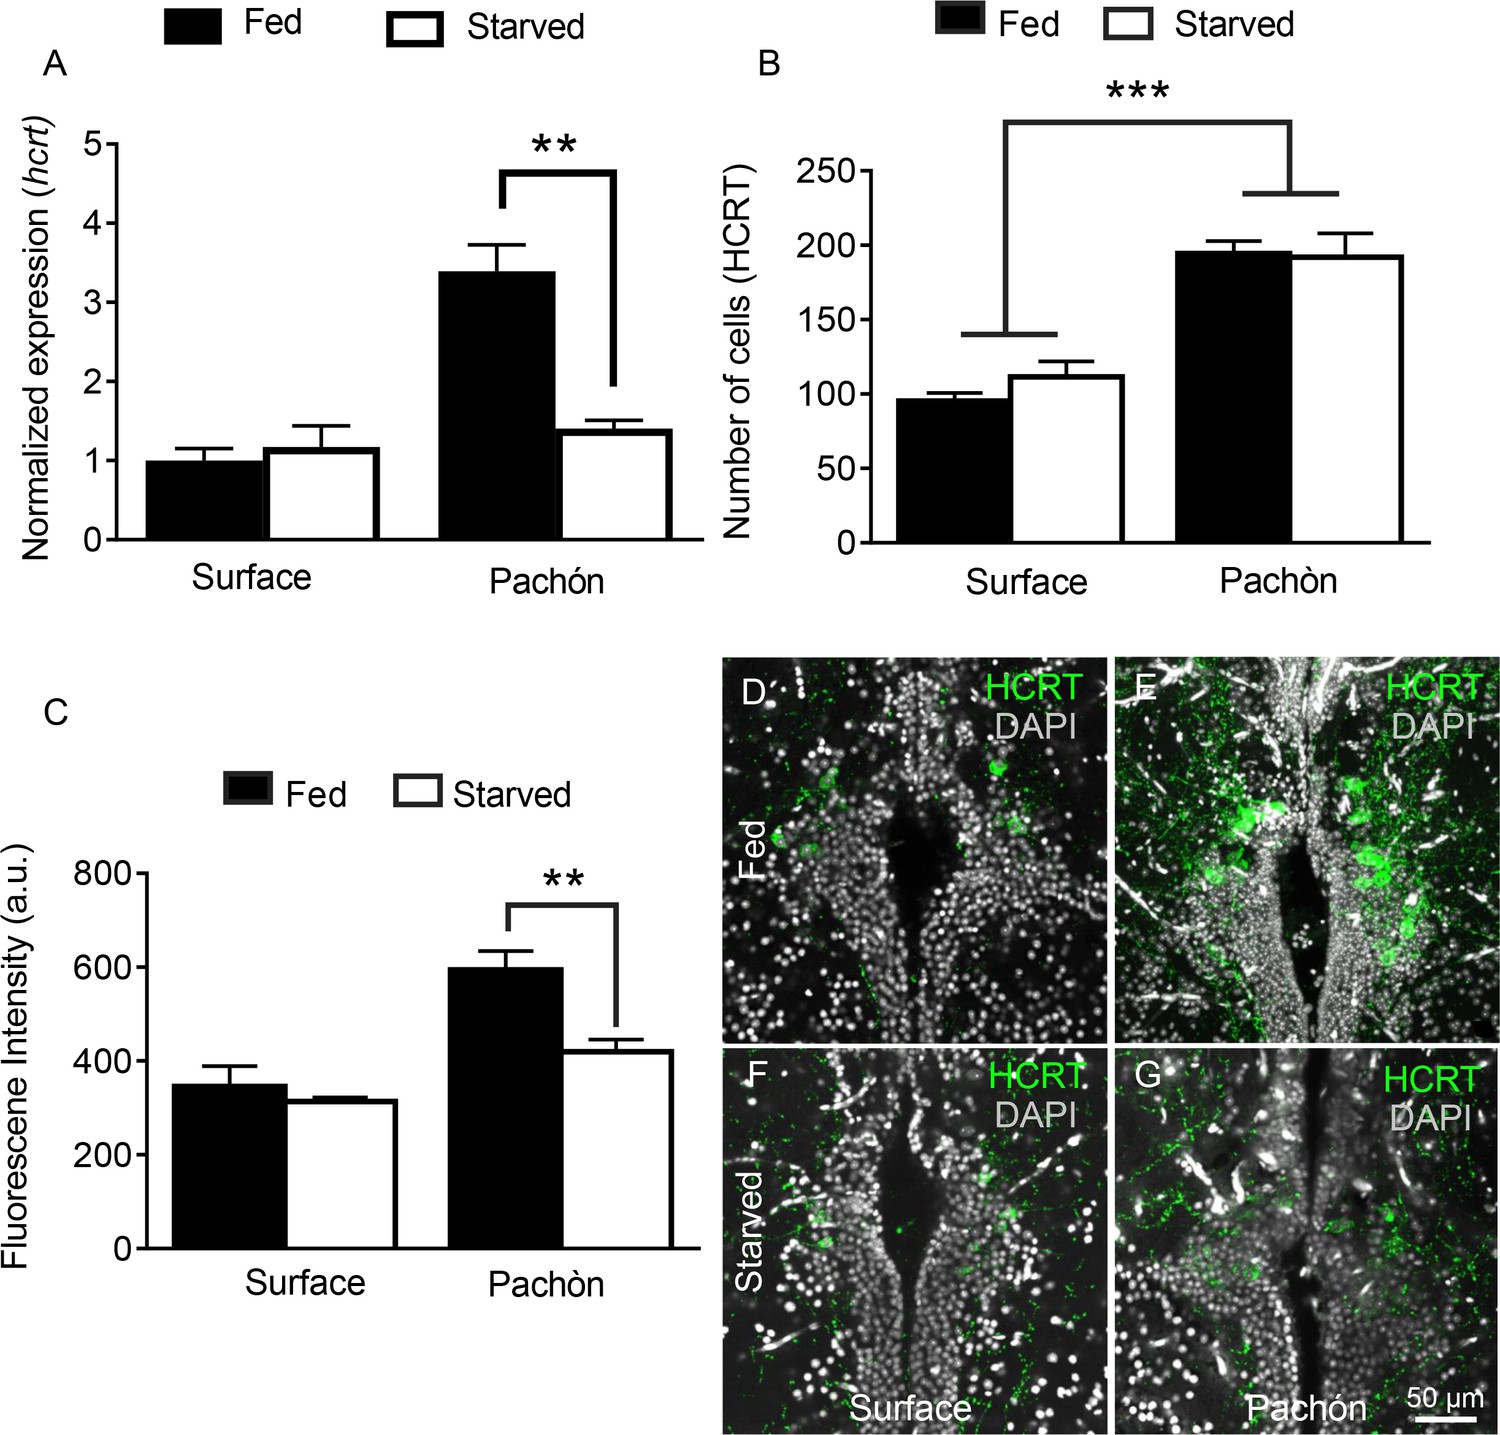
Starvation selectively inhibits HCRT levels in cavefish.
(A) Starvation does not affect hcrt expression in surface fish (p>0.832, n = 4) while hcrt expression is significantly reduced in Pachón cavefish (p >0.001, n = 4, 2-way ANOVA, F(1,13)=13.54)) (B) Fluorescent intensity in HCRT cells was not affected by 30 days starvation in surface fish (p>0.788, n = 4). In Pachón cavefish, HCRT neuropeptide was significantly reduced following starvation (p<0.004, n = 4, 2-way ANOVA, F(1,12)=10.17)) (C) Starvation has no significant effect on total number of HCRT-positive cells in either surface or Pachón cavefish (Surface, p=0.452, n = 4; Pachón, p>0.979, n = 4, 2-way ANOVA, F(1,11)=3.65)) (D) Surface control (E) Pachón control (F) Surface starved (G) Pachón Starved. Scale bar = 50 μm.
-
Figure 7—source data 1
Starvation selectively inhibits HCRT levels in cavefish.
- https://doi.org/10.7554/eLife.32637.027
Additional files
-
Transparent reporting form
- https://doi.org/10.7554/eLife.32637.028
Download links
A two-part list of links to download the article, or parts of the article, in various formats.
Downloads (link to download the article as PDF)
Open citations (links to open the citations from this article in various online reference manager services)
Cite this article (links to download the citations from this article in formats compatible with various reference manager tools)
Hypocretin underlies the evolution of sleep loss in the Mexican cavefish
eLife 7:e32637.
https://doi.org/10.7554/eLife.32637


