AMPK signaling to acetyl-CoA carboxylase is required for fasting- and cold-induced appetite but not thermogenesis
- University of Melbourne, Australia
- St. Vincent’s Institute of Medical Research, Australia
- McMaster University, Canada
- Monash University, Australia
- Australian Catholic University, Australia
Figures
Figure 1
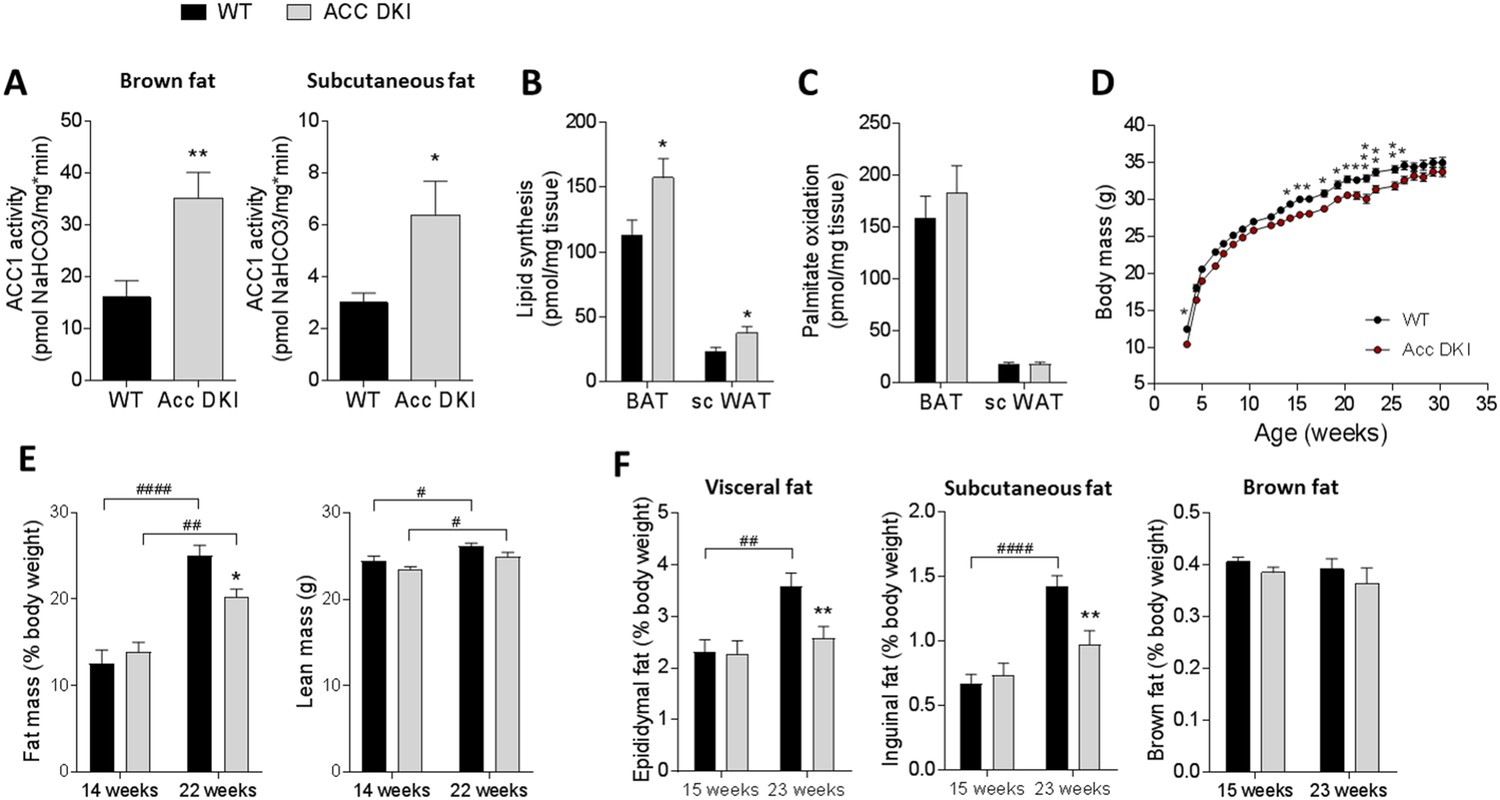
Inhibition of ACC1 Ser79ACC2 Ser212 phosphorylation increases adipose tissue lipid synthesis, but does not promote adiposity.
(A) ACC1 activity in brown fat and subcutaneous fat of 12–15 week old male mice (n = 9). (B) Incorporation of [3H]acetate into the total tissue lipid fraction in brown fat and subcutaneous fat as a measure of de novo lipogenesis (n = 6). (C) Palmitate oxidation in brown and subcutaneous fat explants ex vivo (n = 13–15). (D) Weight curves of male wild-type and ACC DKI mice on a chow diet (n = 14). (E) Assessment of body composition by NMR scanning showing percentage of fat mass and total lean mass (n = 7–10). (F) Epididymal, inguinal subcutaneous and brown fat pad weights expressed as percentage of total body weight in male mice at indicated ages (n = 8–15). All data were derived from mice housed at an environmental temperature of 18–20°C. Data are expressed as means ± s.e.m. (A)-(C) *p<0.05, **p<0.01 represent differences between genotypes in the specified tissue type as determined by unpaired t-test, two-tailed. (D) *p<0.05, **p<0.01, ***p<0.001 genotype differences at a given time point determined by 2-way repeated measures ANOVA with Bonferroni post-hoc test. (E)-(F) **p<0.01 differences between genotypes within an age group; p<0.05, p<0.01, p<0.0001 differences between age groups for a given genotype as determined by 2-way ANOVA with Bonferroni post hoc test.
-
Figure 1—source data 1
Sample size, mean and s.e.m. and statistical calculations are presented.
- https://doi.org/10.7554/eLife.32656.003
Figure 2 with 2 supplements

Metabolic parameters of wild-type and ACC DKI male mice exposed to various temperatures.
(A–C) Energy expenditure, (D–F) cumulative food intake and (G–I) respiratory exchange ratio (RER) in 10–14 week old, ad libitum fed, wild-type and ACC DKI male mice after 72 hr of exposure to indicated temperatures (n = 8). (A, B, D, E, G, H) Hourly averages of metabolic parameters of mice exposed to 14°C and 28°C. Black horizontal bars represent the dark period in a 12 hr light/dark cycle (7am-7pm). *p<0.05, **p<0.01, ***p<0.001, ****p<0.0001 represent differences between genotypes for a given time point as determined by 2-way repeated measures ANOVA with Bonferroni post-hoc test. (C, F, I) 12 hr averages of at least two consecutive day and night cycles of metabolic parameters of mice exposed to indicated temperatures. *p<0.05, ****p<0.0001 differences between genotypes within a temperature group and; # p<0.05, p<0.0001 differences between parameters for a given genotype at different temperatures as determined by 2-way ANOVA with Bonferroni post-hoc test. (J) mRNA expression profile in brown fat of mice exposed to 14°C for 72 hr (n = 12). *p<0.05, **p<0.01 genotype difference in mRNA expression for a given gene as determined by unpaired t-test, two-tailed. (K) Percentage body weight change of wild-type and ACC DKI mice exposed to various temperatures for 72 hr. *p<0.05 represents differences between genotypes and p<0.001, p<0.0001 represent differences in body weight loss at different temperatures as determined by 2-way ANOVA and Bonferroni post-hoc test. All data are presented as mean ± s.e.m.
-
Figure 2—source data 1
Sample size, mean and s.e.m. and statistical calculations are presented.
- https://doi.org/10.7554/eLife.32656.010
Figure 2—figure supplement 1
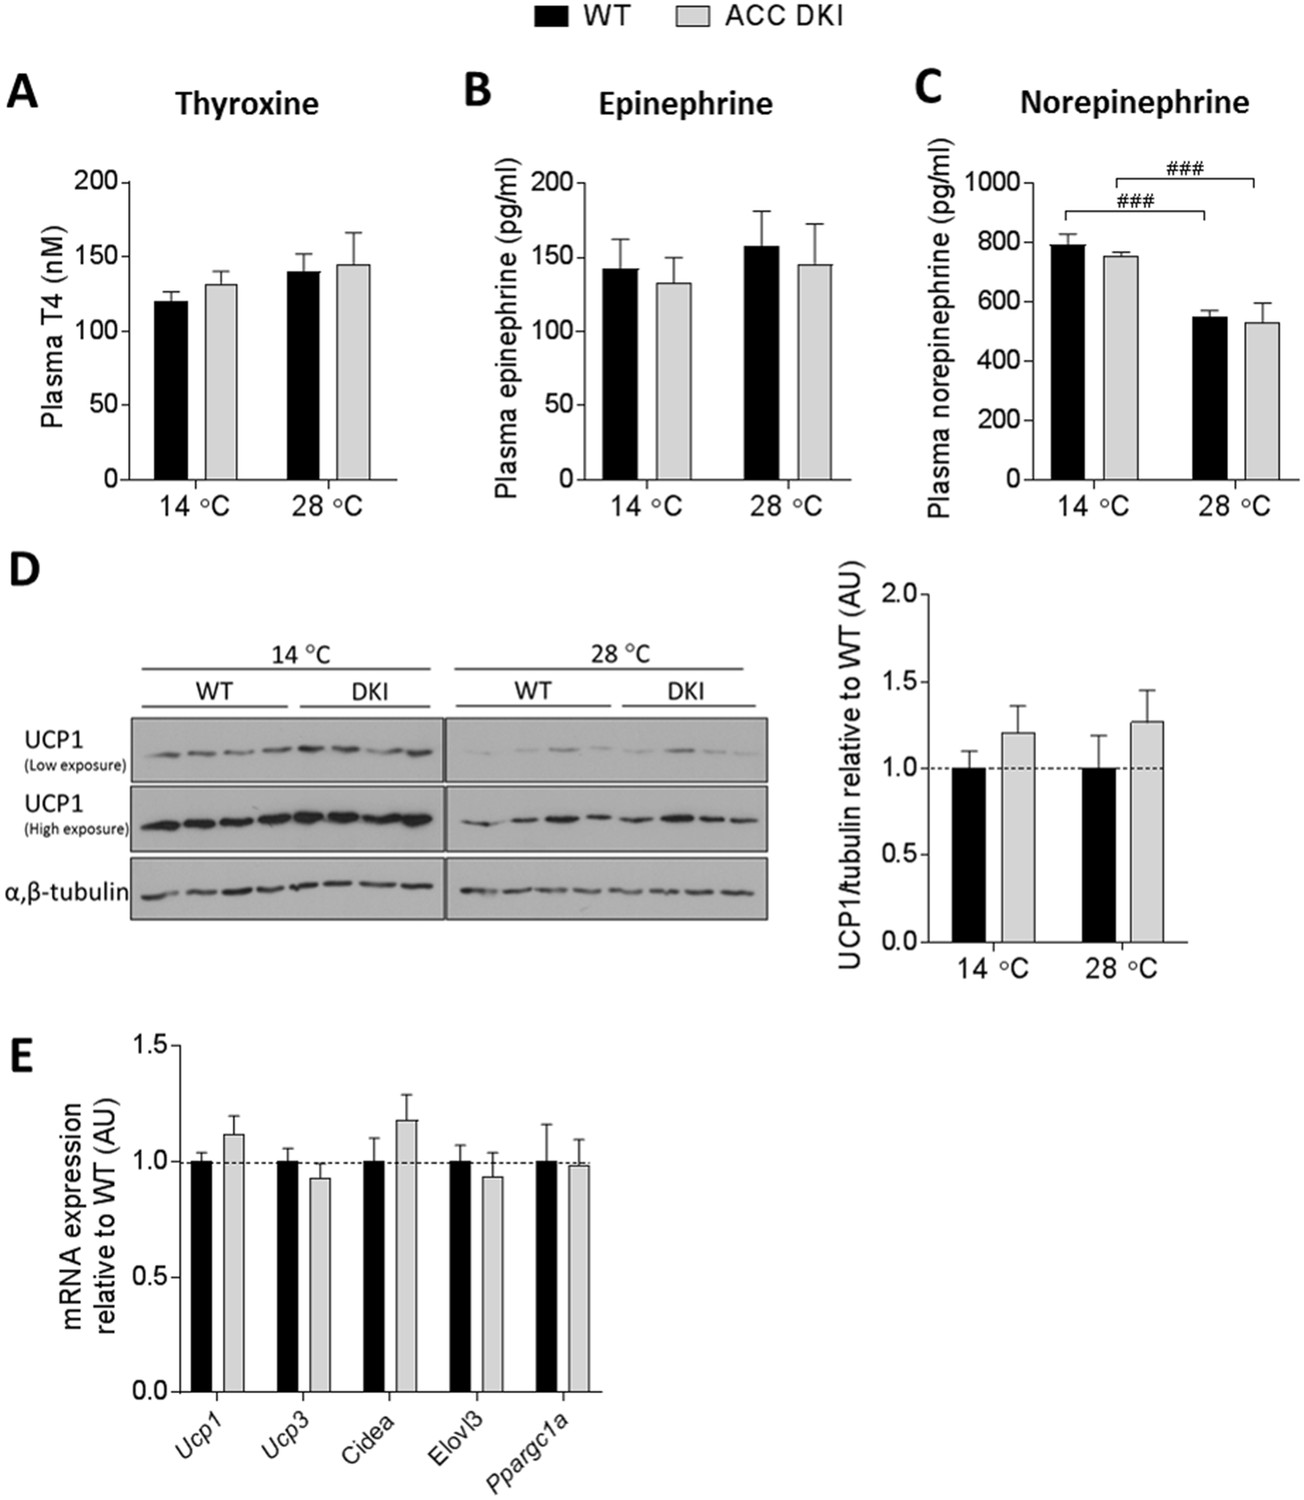
Inhibition of ACC Ser79/Ser212 phosphorylation has no effect on thermogenic capacity.
(A) Plasma thyroxine, (B) plasma epinephrine and (C) plasma norepinephrine concentrations in WT and ACC DKI mice exposed to 14°C or 28°C for 72 hr (n = 7–24 for thyroxine, n = 7–8 for epinephrine and norepinephrine). p<0.001 temperature effect as determined by 2-way ANOVA with Bonferroni post-hoc test. (D) UCP1 protein abundance in brown fat of mice after 72 hr exposure to indicated temperatures (n = 8). Bar graph represents quantification of UCP1 protein normalized to the tubulin signal from the same lysate. Values relative to wild-type at a given temperature are shown. Brown fat lysates from mice exposed to 14°C and 28°C were run on separate gels, but transferred onto the same membrane for immunoblotting. Data were analyzed by unpaired t-test, two-tailed. (E) mRNA expression profile in brown fat of mice exposed to 14°C for 72 hr (n = 12). Data were analyzed by unpaired t-test, two-tailed. All data are presented as mean ± s.e.m.
-
Figure 2—figure supplement 1—source data 1
Sample size, mean and s.e.m.
and statistical calculations are presented for Figure 2—figure supplement 1.
- https://doi.org/10.7554/eLife.32656.006
-
Figure 2—figure supplement 1—source data 2
Western blots are presented for Figure 2—figure supplement 1.
- https://doi.org/10.7554/eLife.32656.007
Figure 2—figure supplement 2
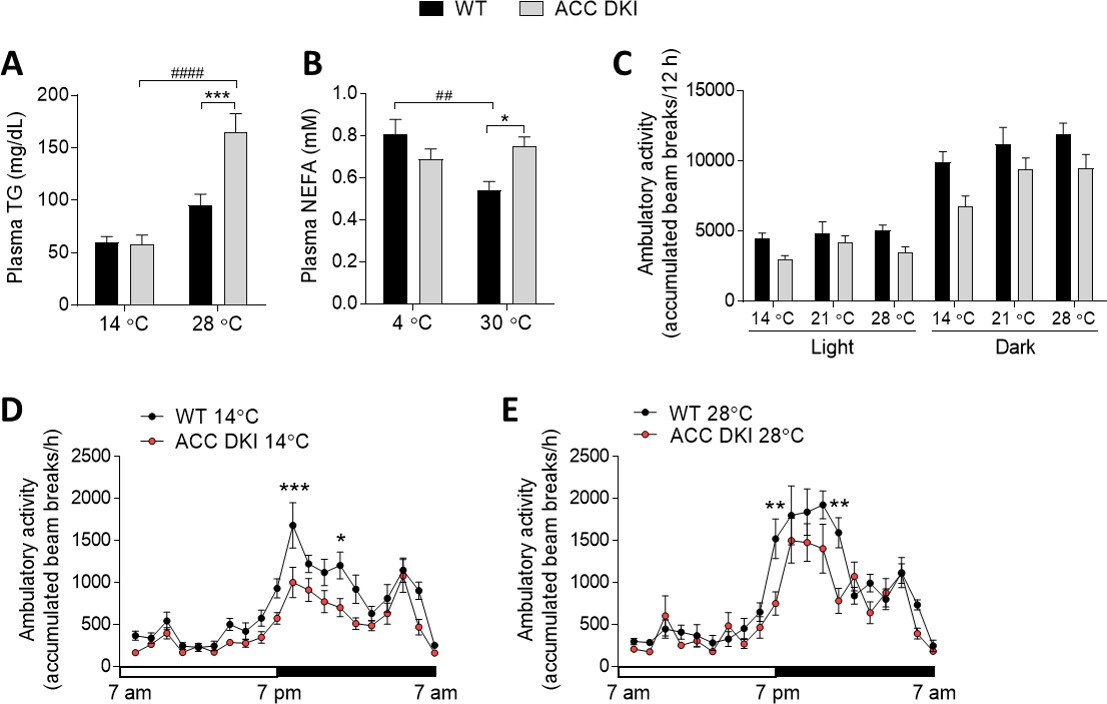
Plasma lipid concentrations and ambulatory activity of WT and ACC DKI mice exposed to various temperatures.
(A) Plasma triglyceride (TG) concentrations in mice housed at indicated temperatures for 72 hr (n = 9–10). (B) Plasma non-esterified fatty acid (NEFA) concentration after acute (3 hr) exposure to indicated temperatures (n = 15–18). (C–E) Cumulative ambulatory activity of ad libitum fed, wild-type and ACC DKI male mice after 72 hr of exposure to indicated temperatures (n = 8). 12 hr averages (C) and cumulative hourly averages (D and E) are shown. (A)-(C) were analyzed by 2-way ANOVA with Bonferroni post hoc test whereby *p<0.05, ***p<0.001 represent genotype differences within a given temperature group and p<0.01, p<0.0001 show the temperature effect on blood lipid concentrations for a given genotype. (D) and (E) were analyzed by 2-way repeated measures ANOVA and Bonferroni post hoc test with *p<0.05, **p<0.01, ***p<0.001 representing genotype differences in activity levels at a given time point. All data are presented as mean ± s.e.m.
-
Figure 2—figure supplement 2—source data 1
Sample size, mean and s.e.m.
and statistical calculations are presented for Figure 2—figure supplement 2.
- https://doi.org/10.7554/eLife.32656.009
Figure 3 with 2 supplements
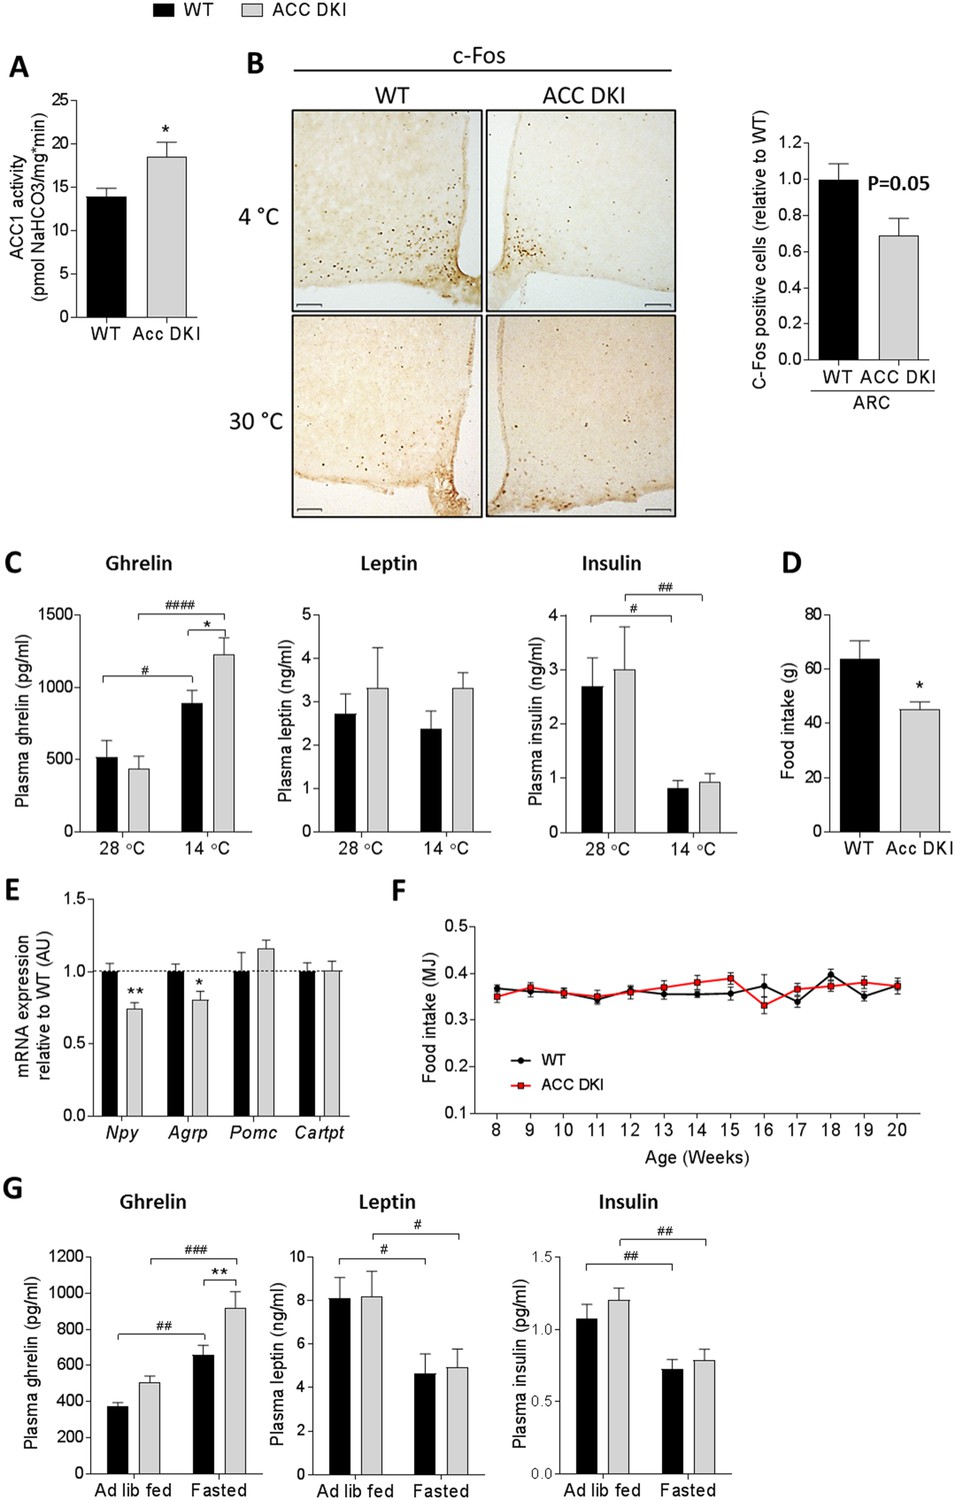
ACC DKI mice have reduced food intake in response to metabolic stress.
(A) ACC1 enzyme activity in hypothalamus of fasted mice (n = 6). (B) c-Fos immunohistochemistry in hypothalamus cross sections of mice acutely (90 min) exposed to indicated temperatures. Images are showing c-Fos staining in the arcuate nucleus. Bar graph represents quantification of c-Fos immunoreactivity in the arcuate nucleus, expressed as number of c-Fos positive cells within a defined region relative to wild-type (n = 4 mice/group). Scale bars = 100 μm. (C) Plasma hormone concentrations after exposure to indicated temperatures for 72 hr (n = 11–12 for ghrelin, n = 8 for insulin and leptin). (D) Food intake after overnight fast and 5 hr refeed (n = 8). (E). mRNA expression of neuropeptides in the hypothalamus of overnight fasted mice (n = 8). (F) Weekly ad libitum food intake in male mice from 8 to 20 weeks of age (n = 8–10). (G) Plasma hormone concentrations in ad libitum fed and overnight fasted mice (n = 15-29 for ghrelin, n = 8 for leptin, n = 12–13 for insulin). Data are expressed as means ± s.e.m. (A), (B), (D) and (E) were analyzed by unpaired t-test, two-tailed with *p<0.05, **p<0.01 representing differences between genotypes. (C) and (G) were analyzed by 2-way ANOVA with Bonferroni post-hoc test with *p<0.05 representing differences between genotypes at a given temperature and p<0.05, p<0.01, p<0.0001 are differences between hormone levels at different temperatures (C) or feeding states (G) for a given genotype as determined by 2-way ANOVA with Bonferroni post-hoc test. (F) Data were analyzed by 2-way repeated measures ANOVA and Bonferroni post-hoc test. All data are presented as mean ± s.e.m.
-
Figure 3—source data 1
Sample size, mean and s.e.m. and statistical calculations are presented.
- https://doi.org/10.7554/eLife.32656.016
Figure 3—figure supplement 1
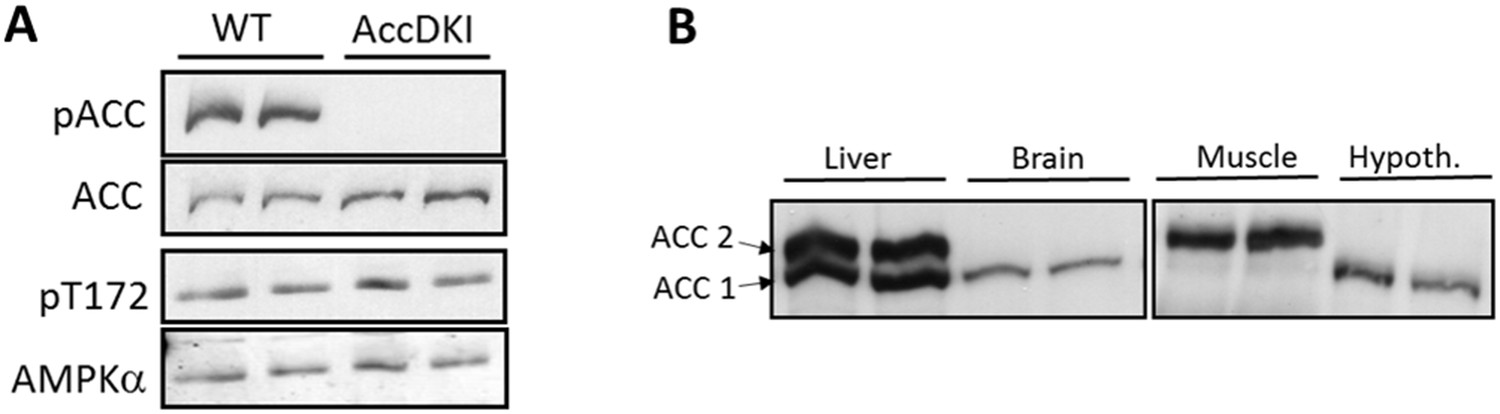
Expression and phosphorylation of ACC in mouse hypothalamus tissue.
(A) Western blot of ACC Ser79/Ser212 and AMPK Thr172 phosphorylation in hypothalamus of wild-type and ACC DKI mice. Blots for pACC/ACC and pThr172/AMPKα were derived from the same lysates run on separate gels. (B) ACC1 and ACC2 protein abundance in liver, skeletal muscle, hypothalamus and whole brain tissue of wild-type mice. Tissue lysates for liver/brain and skeletal muscle/hypothalamus were run on separate gels and transferred onto the same membrane for incubation with streptavidin-HRP.
-
Figure 3—figure supplement 1—source data 1
Western blots are presented for Figure 3—figure supplement 1.
- https://doi.org/10.7554/eLife.32656.013
Figure 3—figure supplement 2
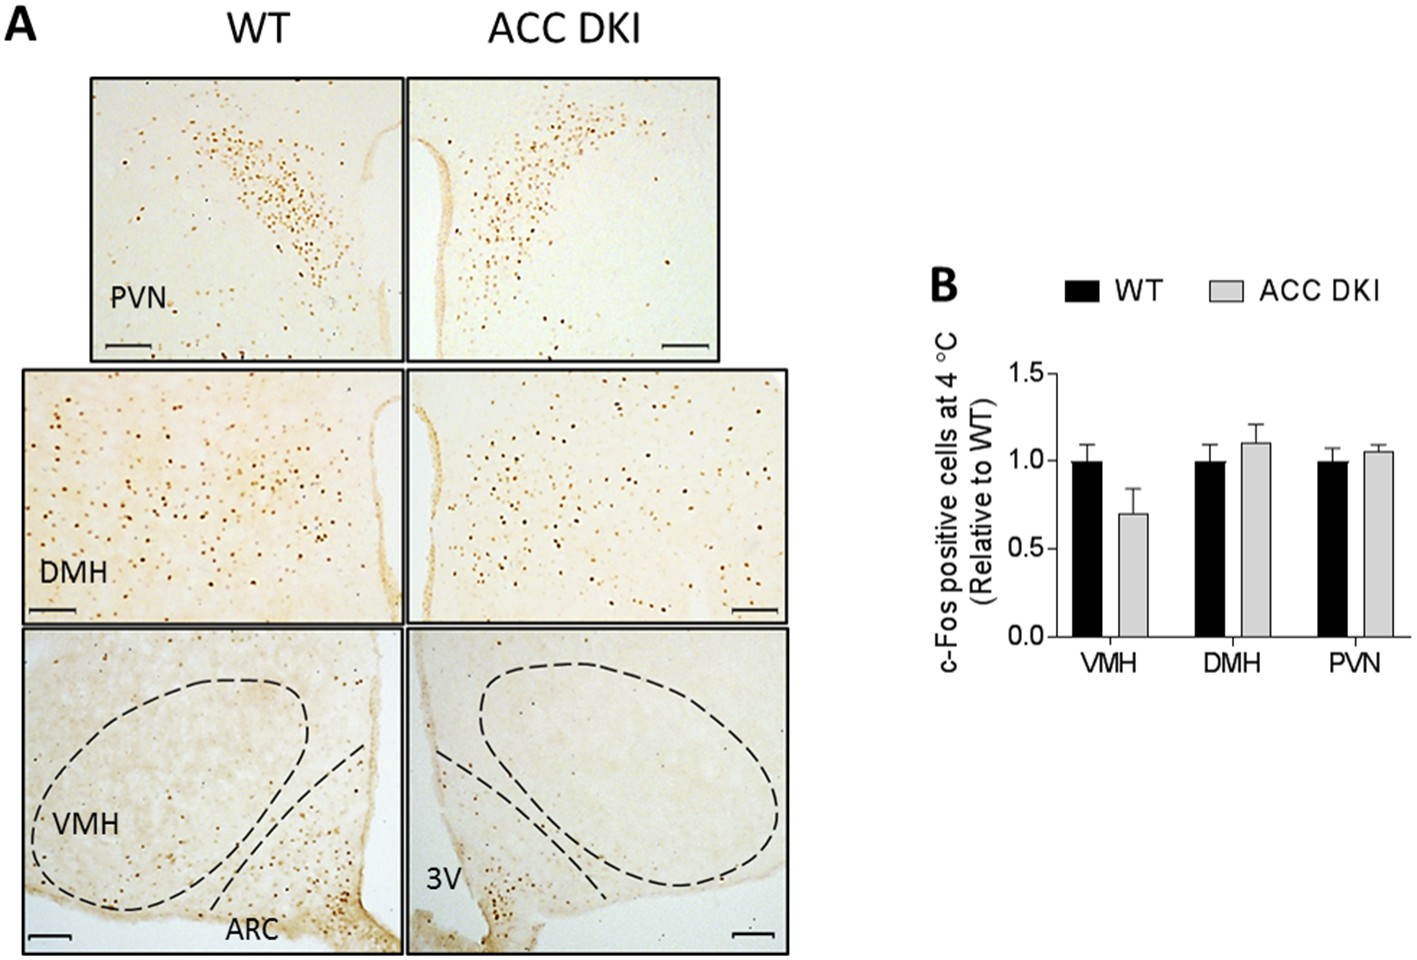
c-Fos immunohistochemistry in hypothalamus cross sections of mice acutely exposed to 4°C.
(A) Images show the paraventricular nucleus (PVN), dorsomedial hypothalamus (DMH), ventromedial hypothalamus (VMH) and arcuate nucleus (ARC) in hypothalamus cross sections of wild-type and ACC DKI mice acutely (90 min) exposed to 4°C. Dashed lines mark the ARC and VMH; Scale bars = 100 μm. 3V, third ventricle. (B) Quantification of c-Fos immunoreactivity expressed as number of c-Fos positive nuclei within a defined region relative to wild type (n = 4 mice/group). Data were analyzed by unpaired t-test, two-tailed and expressed as mean ± s.e.m.
-
Figure 3—figure supplement 2—source data 1
Sample size, mean and s.e.m.
and statistical calculations are presented for Figure 3—figure supplement 2.
- https://doi.org/10.7554/eLife.32656.015
Figure 4 with 1 supplement
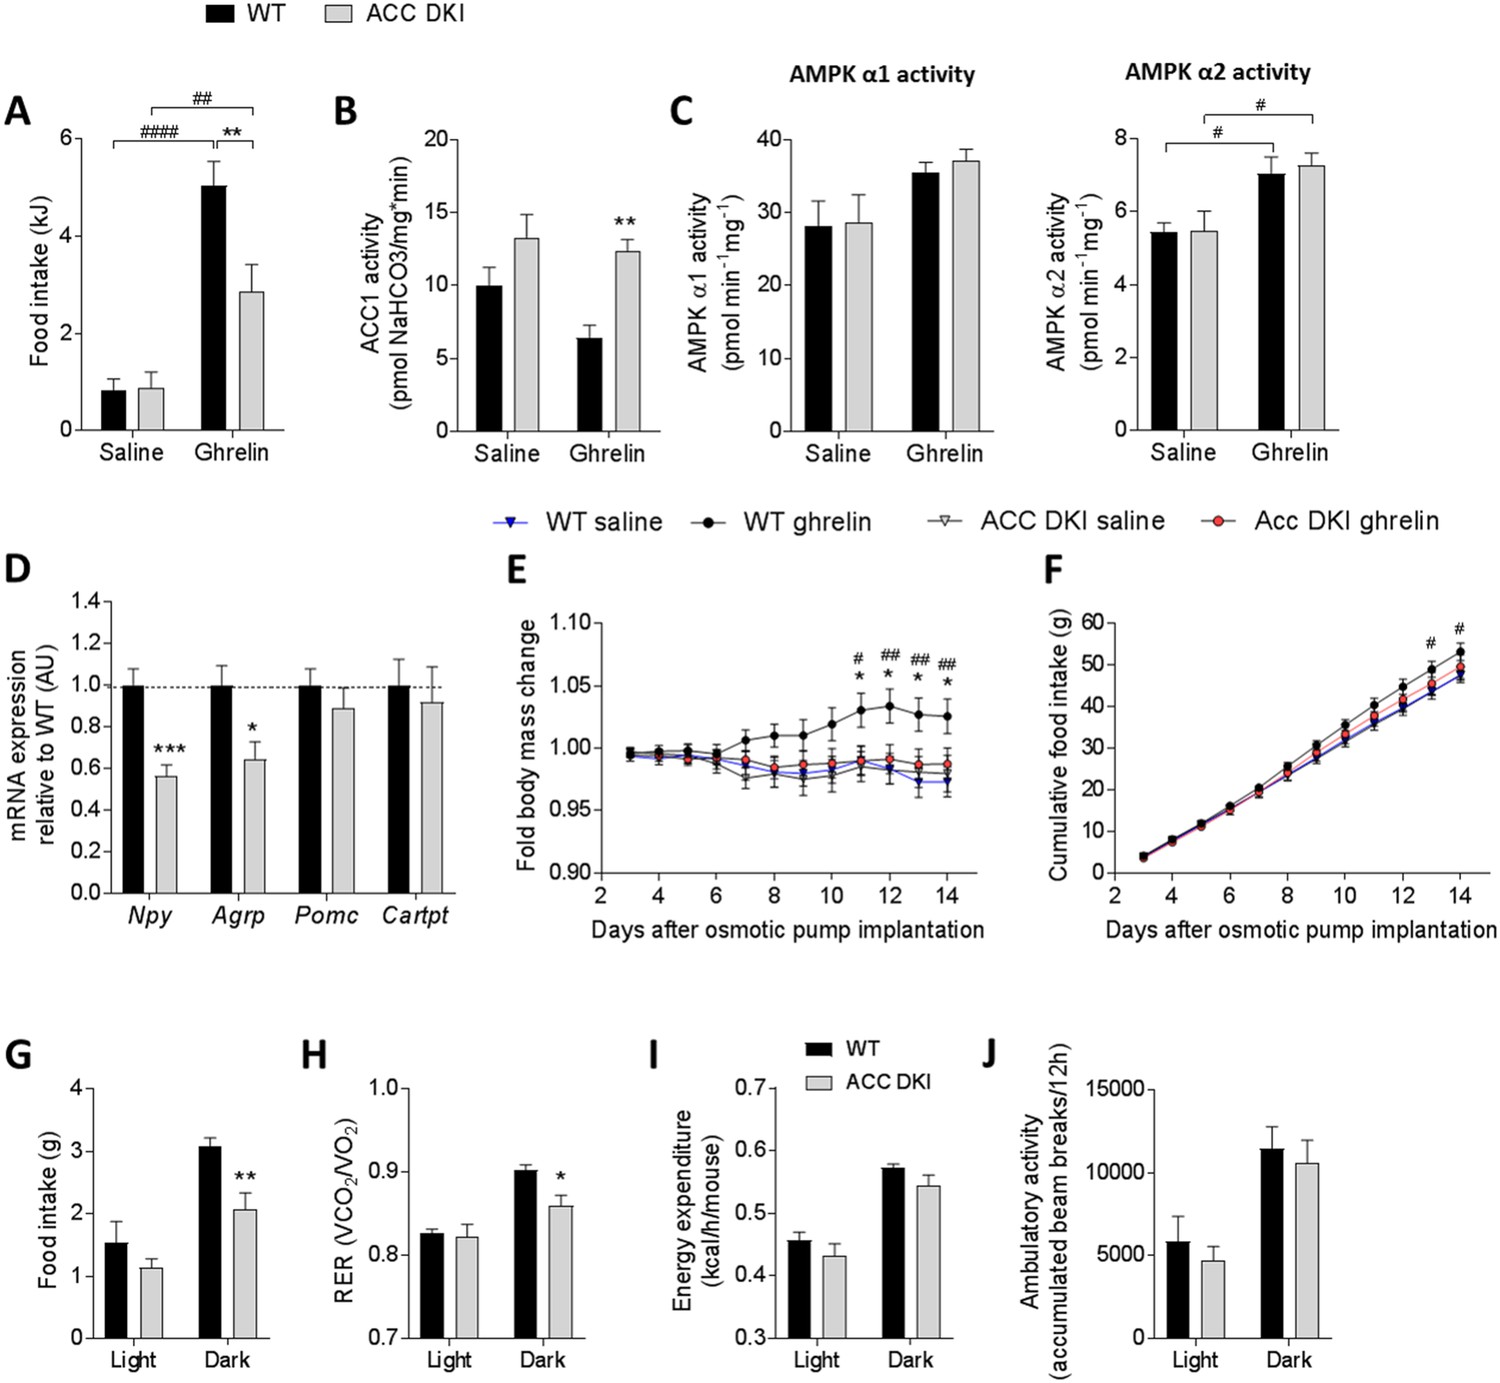
Ghrelin-induced food intake and hypothalamic signaling is reduced in ACC DKI mice.
(A) Food intake (n = 19–20), (B) hypothalamic ACC1 activity (n = 4–5) and (C), hypothalamic AMPK α1 and AMPKα2 activities (n = 4–5) in wild-type and ACC DKI mice after intraperitoneal injection with saline or ghrelin (1 μg/g body weight). (D) Relative mRNA expression of neuropeptides after intraperitoneal injection with ghrelin (1 μg/g body weight) (n = 5–9). (E) Change in body mass and (F) cumulative food intake during 14 days of saline or ghrelin treatment (30 μg/day/mouse) using osmotic minipumps (n = 8). (G) Food intake, (H) respiratory exchange ratio, (I) energy expenditure and (J) ambulatory activity in ghrelin-treated mice on day 14 after osmotic pumps implantation (n = 4–8 mice). (A)-(C) were analyzed by 2-way ANOVA with Bonferroni post-hoc test with **p<0.01 representing differences between genotypes and p<0.01, p<0.0001 showing differences in food intake or enzyme activity at saline versus ghrelin treatment. (D) Data were analyzed by unpaired t-test, two tailed with *p<0.05, ***p<0.001 showing genotype differences in mRNA expression for a given gene. (E) and (F) were analyzed by 2-way repeated measures ANOVA with Bonferroni post-hoc test with *p<0.05, **p<0.01 showing genotype differences in ghrelin-injected mice and p<0.05, p<0.01 showing differences between body mass or food intake in wild-type mice with saline or ghrelin treatment at a given time point. (H)-(J) were analyzed by 2-way repeated measures ANOVA with Bonferroni post-hoc test with *p<0.05, **p<0.01 representing genotype differences in metabolic parameters within the dark cycle. All data are presented as mean ± s.e.m.
-
Figure 4—source data 1
Sample size, mean and s.e.m. and statistical calculations are presented.
- https://doi.org/10.7554/eLife.32656.020
Figure 4—figure supplement 1
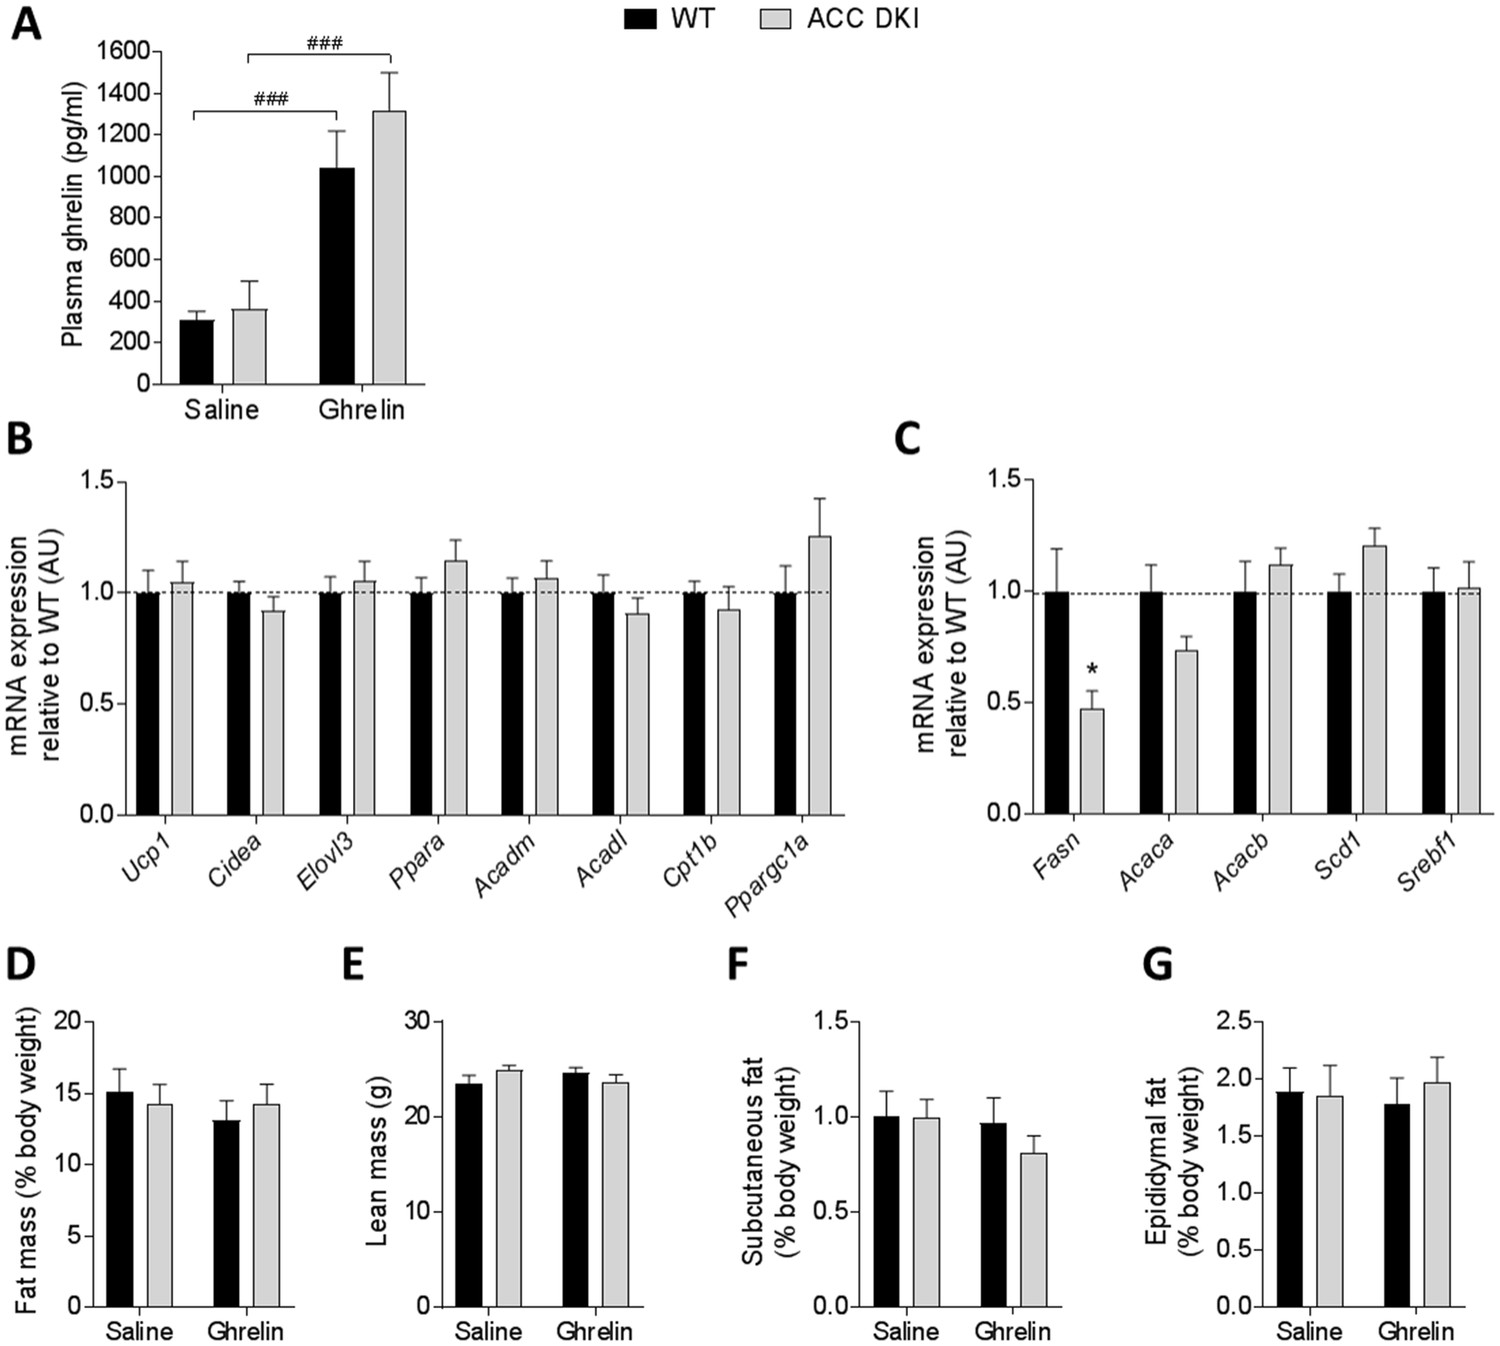
Effect of long-term ghrelin treatment on adipose tissue gene expression and adiposity in wild type and ACC DKI mice.
(A) Plasma ghrelin concentrations in mice 1 hr after intraperitoneal injection with saline or ghrelin (n = 7–14). (B) mRNA expression in brown adipose tissue and (C) mRNA expression in subcutaneous adipose tissue in mice treated with ghrelin for 14 days using osmotic minipumps (n = 8). *p<0.05 as determined by unpaired t-test, two-tailed. (D) percentage of fat mass, (E) total lean mass and (F) subcutaneous and (G) epididymal fat pads expressed as percentage of body weight in male mice after saline or ghrelin delivery for 14 days using osmotic minipumps (n = 8). Data were analyzed by 2-way ANOVA and Bonferroni post-hoc test. All data are presented as mean ± s.e.m.
-
Figure 4—figure supplement 1—source data 1
Sample size, mean and s.e.m.
and statistical calculations are presented for Figure 4—figure supplement 1.
- https://doi.org/10.7554/eLife.32656.019
Figure 5
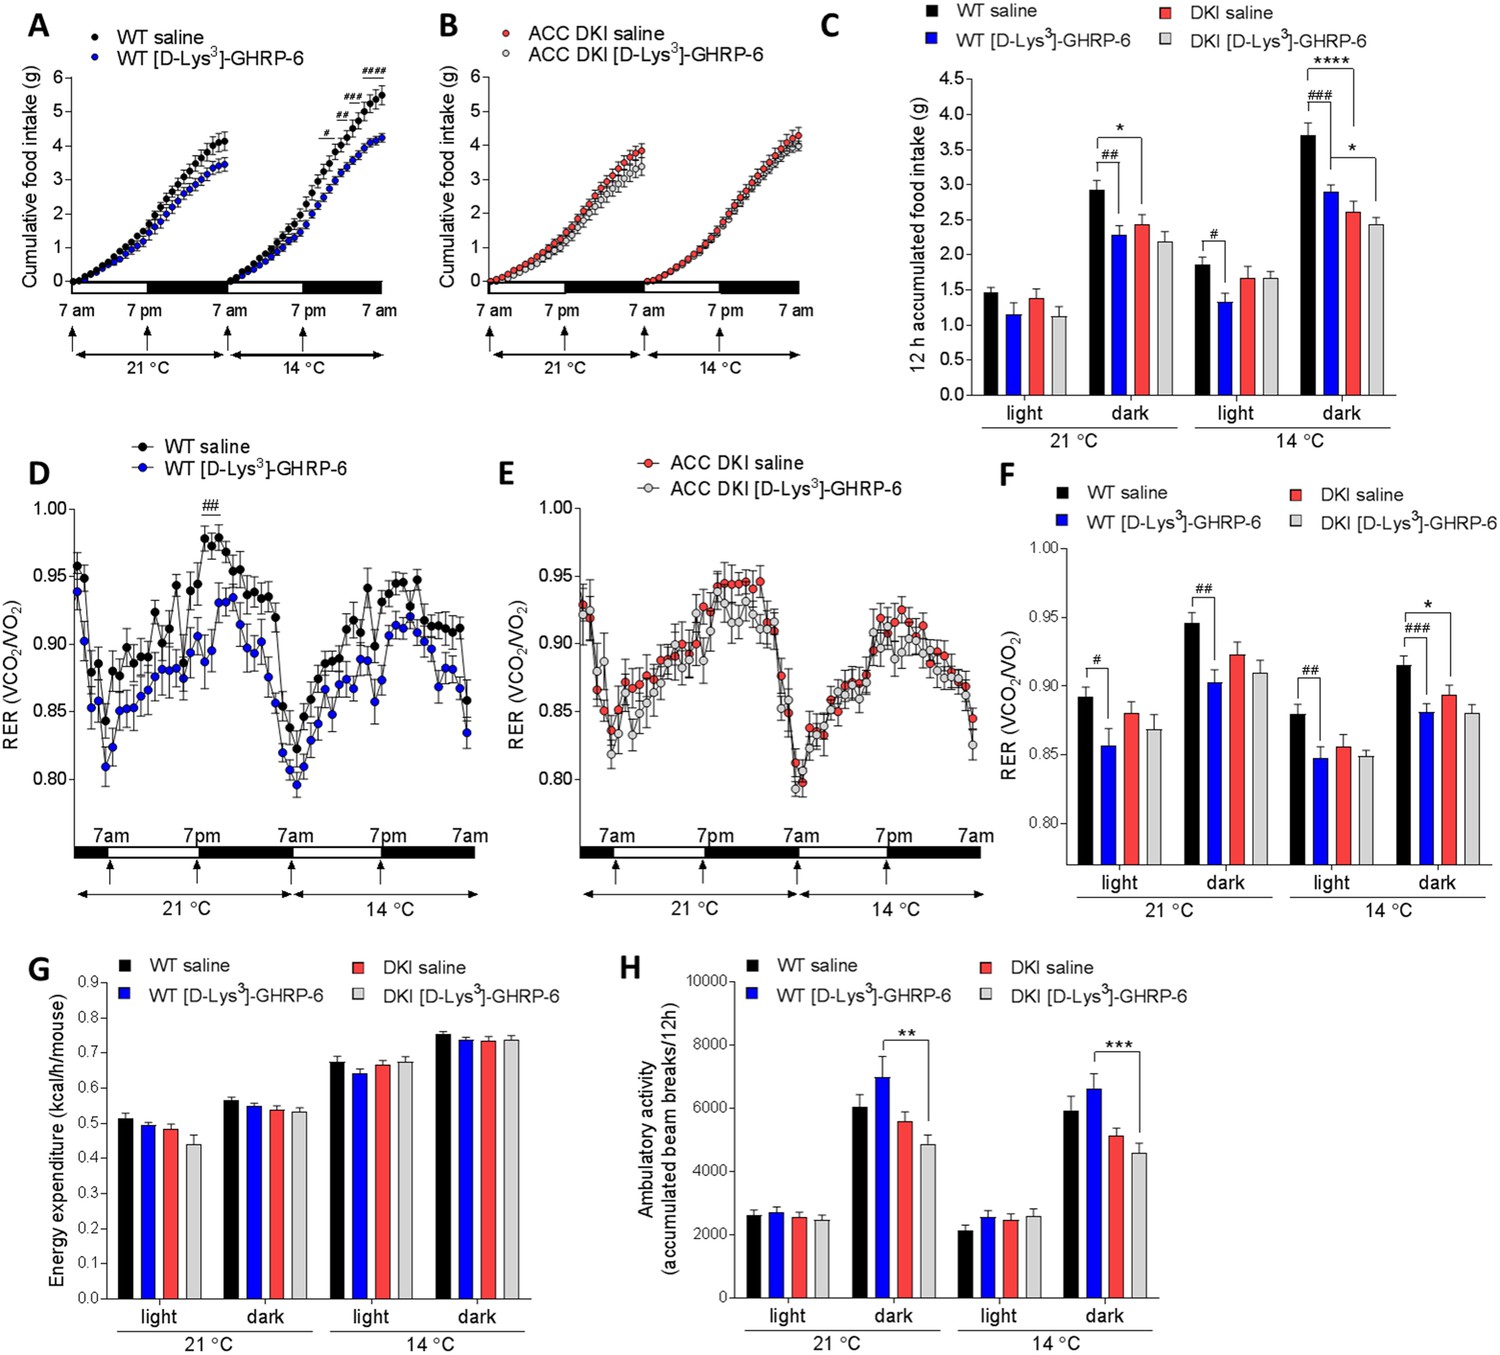
Inhibition of ghrelin signaling reduces food intake and respiratory exchange ratio in wild-type but not ACC DKI mice.
(A–C) Cumulative food intake, (D–F) respiratory exchange ratio (RER), (G) energy expenditure and (H) ambulatory activity in wild-type and ACC DKI mice at indicated temperatures after daily intraperitoneal injections with [D-Lys3]-GHRP-6 (6.7 μmol/kg, at onset of light and dark cycle). (A, B, D, E) Hourly averages of metabolic parameters of wild-type and ACC DKI mice (n = 12). Black horizontal bars represent the dark period in a 12 hr light/dark cycle (7am-7pm). p<0.05, p<0.01, p<0.001, p<0.0001 represent differences food intake or RER in saline vs [D-Lys3]-GHRP-6 injected mice as determined by 2-way repeated measures ANOVA with Bonferroni post-hoc test. (C, F, G, H) 12 hr averages of metabolic parameters. *p<0.05, **p<0.01, ***p<0.001, ****p<0.0001 represents differences between genotypes within a given light cycle and temperature exposure and p<0.05, p<0.01, p<0.001 are differences between saline and [D-Lys3]-GHRP-6 treatments within the dark or light phase for a given genotype, as determined by 2-way repeated measures ANOVA with Bonferroni post-hoc test. All data are presented as mean ± s.e.m.
-
Figure 5—source data 1
Sample size, mean and s.e.m. and statistical calculations are presented.
- https://doi.org/10.7554/eLife.32656.022
Figure 6
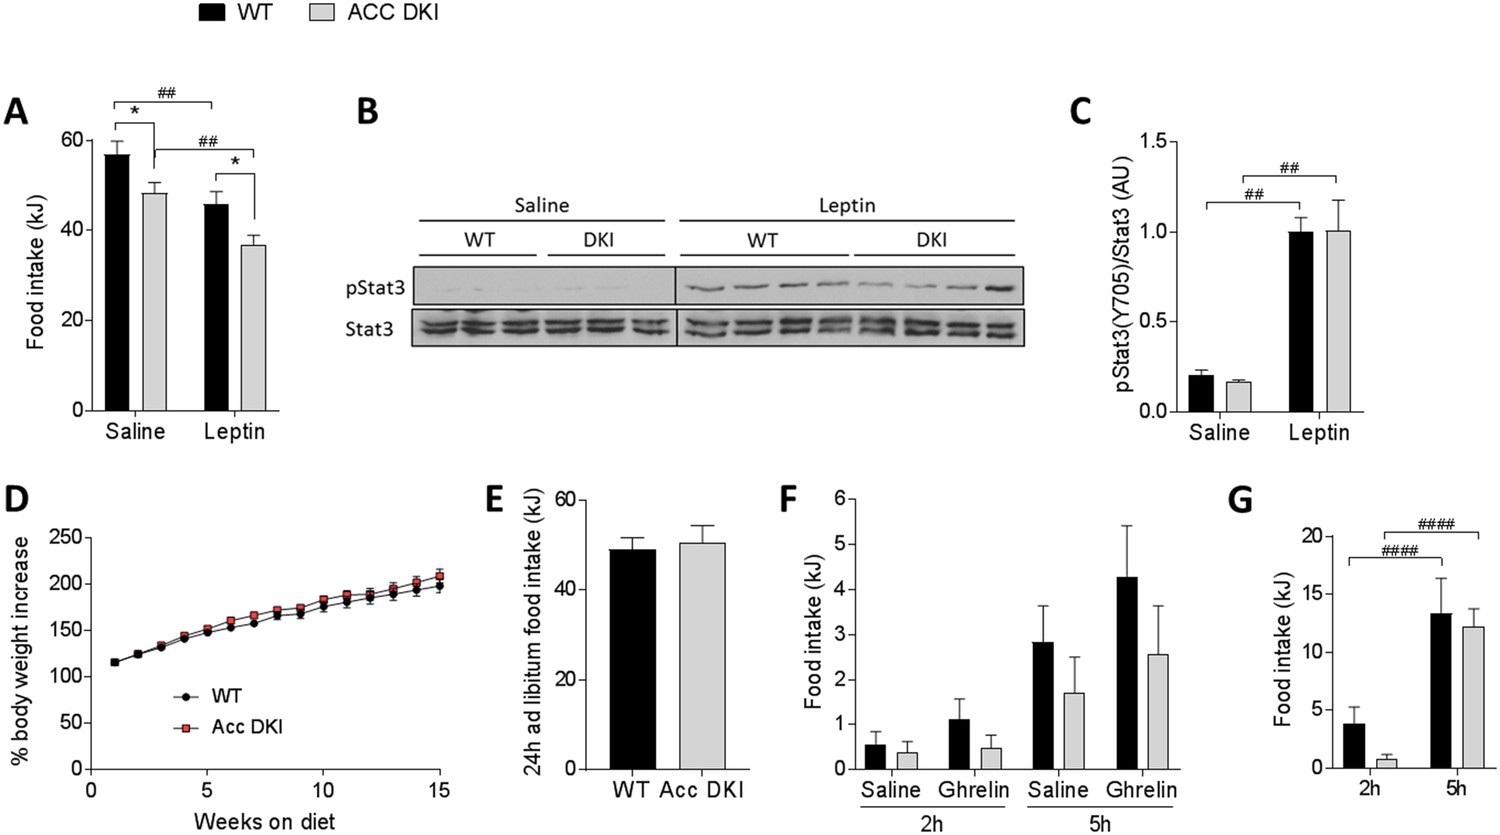
Effect of exogenous leptin administration and high-fat feeding on food intake in ACC DKI mice.
(A) 24 hr food intake after intraperitoneal injection with saline or leptin (1 μg/g body weight) twice daily at the onset of the dark and light cycle (n = 8); *p<0.05 genotype differences, p<0.01 treatment effect as determined by 2-way repeated measures ANOVA with Bonferroni post-hoc test. (B) Hypothalamic STAT3 phosphorylation (pTyr705) 45 min after intraperitoneal injection with saline or leptin (1 μg/g body weight). Lysates from saline- and leptin-injected mice were run on separate gels, but transferred onto the same membrane for immunoblotting. STAT3 blots were cropped to remove non-specific signals from higher molecular weight proteins in the lysate. (C) Quantification of STAT3 phosphorylation normalized to STAT3 total protein signal from the same membrane (n = 3 saline-injected mice, n = 8–9 leptin-injected mice); p<0.01 represents treatment effect as determined by 2-way ANOVA with Bonferroni post-hoc test. (D) Body mass increase of wild-type and ACC DKI mice during 15 weeks of high-fat feeding (n = 9); data were analyzed by 2-way repeated measures ANOVA with Bonferroni post-hoc test. (E) Average 24 hr food intake measured over four consecutive days (n = 5); data were analyzed by unpaired t-test, two-tailed. (F) Accumulated food intake at 2 hr and 5 hr after intraperitoneal injection with saline or ghrelin (1 μg/g body weight) (n = 9) and (G) accumulated food intake at 2 hr and 5 hr after overnight (16 hr) fast (n = 9); data were analyzed by 2-way repeated measures ANOVA with Bonferroni post-hoc test; p<0.0001 showing differences in food intake at different time points after re-feeding. All data are presented as mean ± s.e.m.
-
Figure 6—source data 1
Sample size, mean and s.e.m. and statistical calculations are presented.
- https://doi.org/10.7554/eLife.32656.024
-
Figure 6—source data 2
Western blots are presented for Figure 6.
- https://doi.org/10.7554/eLife.32656.025
Tables
Key resources table
| Reagent type (species) or resource | Designation | Source or reference | Identifiers | Additional information |
|---|---|---|---|---|
| Gene (Mus musculus) | Acaca | NA | MGI:108451; Ensembl:ENSMUSG00000020532 | |
| Gene (Mus musculus) | Acacb | NA | MGI:2140940; Ensembl:ENSMUSG00000042010 | |
| Genetic reagent (Mus Musculus, males) | ACC DKI | doi: 10.1038/nm.3372 | MGI:5780965; MGI:5780967 | C57BL/6-Acacatm1.1Grst, C57BL/6-Acacbtm1.1Grst; maintained in B.E. Kemp laboratory |
| Antibody | anti-pSTAT3 (Tyr705) (rabbit monoclonal) | Cell Signaling | 9145 | 1:1000 in PBST |
| Antibody | anti-STAT3 (mouse monoclonal) | Cell Signaling | 9139 | 1:3000 in PBST |
| Antibody | anti-pACC (ACC1 Ser79/ACC2 Ser212) (rabbit polyclonal) | Cell Signaling | 3661 | 1:1000 in PBST |
| Antibody | anti-AMPK panα (rabbit monoclonal) | Cell Signaling | 5831 | 1:2000 in PBST |
| Antibody | anti-α,β tubulin (rabbit polyclonal) | Cell Signaling | 2148 | 1:5000 in PBST |
| Antibody | anti-AMPKα (Thr172) (rabbit monoclonal) | Cell Signaling | 2535 | 1:1000 in PBST |
| Antibody | anti-UCP1 (rabbit polyclonal) | Alpha Diagnostic | UCP11-A | 1:1000 in PBST |
| Antibody | anti-ACC1 (sheep polyclonal) | doi: 10.1038/nm.3372 | 1:50 in PBS (conjugated to Protein A agarose); against CDEPSPLAKTLELNQ (rat Acc1 (1–15 Cys15); G. Hardie laboratory (University of Dundee) | |
| Antibody | anti-c-Fos (rabbit polyclonal) | Millipore | ABE457 | 1:1000 in PBS (0.2% Triton X-100, 0.1% BSA, 2% normal swine serum) |
| Antibody | anti-AMPK α1 (rabbit polyclonal) | doi: 10.1016/j.chembiol.2008.10.005. | 1 μg in PBS (conjugated to Protein A agarose); against CARHTLDELNPQKSKHQG-COOH (AMPK α1 (373–390 Cys373); B.E. Kemp laboratory | |
| Antibody | anti-AMPK α2 (rabbit polyclonal) | doi: 10.1016/j.chembiol.2008.10.005. | 1 μg in PBS (conjugated to Protein A agarose); against CMDDSAMHIPPALKPH-NH2) (AMPK α2 (351–366 Cys351); B.E. Kemp laboratory | |
| Antibody | anti-rabbit immunoglobulin (swine polyclonal, biotinylated) | Dako | E0353 | 1: 500 in PBS (0.2% Triton X-100,0.1% BSA, 2% normal swine serum) |
| Antibody | anti-rabbit immunoglobulin (goat polyclonal, HRP-conjugated) | Dako | P0448 | 1:3000 in PBST |
| Peptide, recombinant protein | Murine leptin | Lonza (Australia); Peprotech (Rocky Hill, NJ) | 450–31 | 1 μg/g body weight in saline |
| Peptide, recombinant protein | n-octanoylated murine ghrelin | Purar Chemicals | 1 μg/g body weight in saline (acute);30 μg/mouse at 0.5 μl/h in saline (osmotic pumps) | |
| Commercial assay or kit | Rat/mouse ghrelin ELISA kit | Millipore | EZRGRA-90K | |
| Commercial assay or kit | Mouse leptin ELISA kit | Millipore | EZML-82K | |
| Commercial assay or kit | Mouse insulin ELISA kit | Mercodia | 10-1247-01 | |
| Commercial assay or kit | Thyroxine (T4) ELISA Kit | Invitrogen | EIAT4C | |
| Commercial assay or kit | Epinephrine/norepinephrine ELISA kit | Abnova | KA3767 | |
| Commercial assay or kit | NEFA C kit | Wako | 279–75401 | |
| Commercial assay or kit | LabAssay Triglyceride kit | Wako | 290–63701 | |
| Chemical compound, drug | [D-Lys3]-GHRP-6 | Abcam | ab141148 | 6.7 μmol/kg in saline |
Additional files
-
Supplementary file 1
Table 1: List of TaqMan Gene Expression Assays used for qRT-PCR.
Assays were purchased from Applied Biosystems and consist of a pair of unlabeled PCR primers and a TaqMan probe with a FAM dye label.
- https://doi.org/10.7554/eLife.32656.026
-
Transparent reporting form
- https://doi.org/10.7554/eLife.32656.027
Download links
A two-part list of links to download the article, or parts of the article, in various formats.
Downloads (link to download the article as PDF)
Open citations (links to open the citations from this article in various online reference manager services)
Cite this article (links to download the citations from this article in formats compatible with various reference manager tools)
AMPK signaling to acetyl-CoA carboxylase is required for fasting- and cold-induced appetite but not thermogenesis
eLife 7:e32656.
https://doi.org/10.7554/eLife.32656


