A switch in transcription and cell fate governs the onset of an epigenetically-deregulated tumor in Drosophila
- ETH Zürich, Switzerland
- Swiss Institute of Bioinformatics, Switzerland
- University of Basel, Switzerland
Figures
Figure 1 with 4 supplements
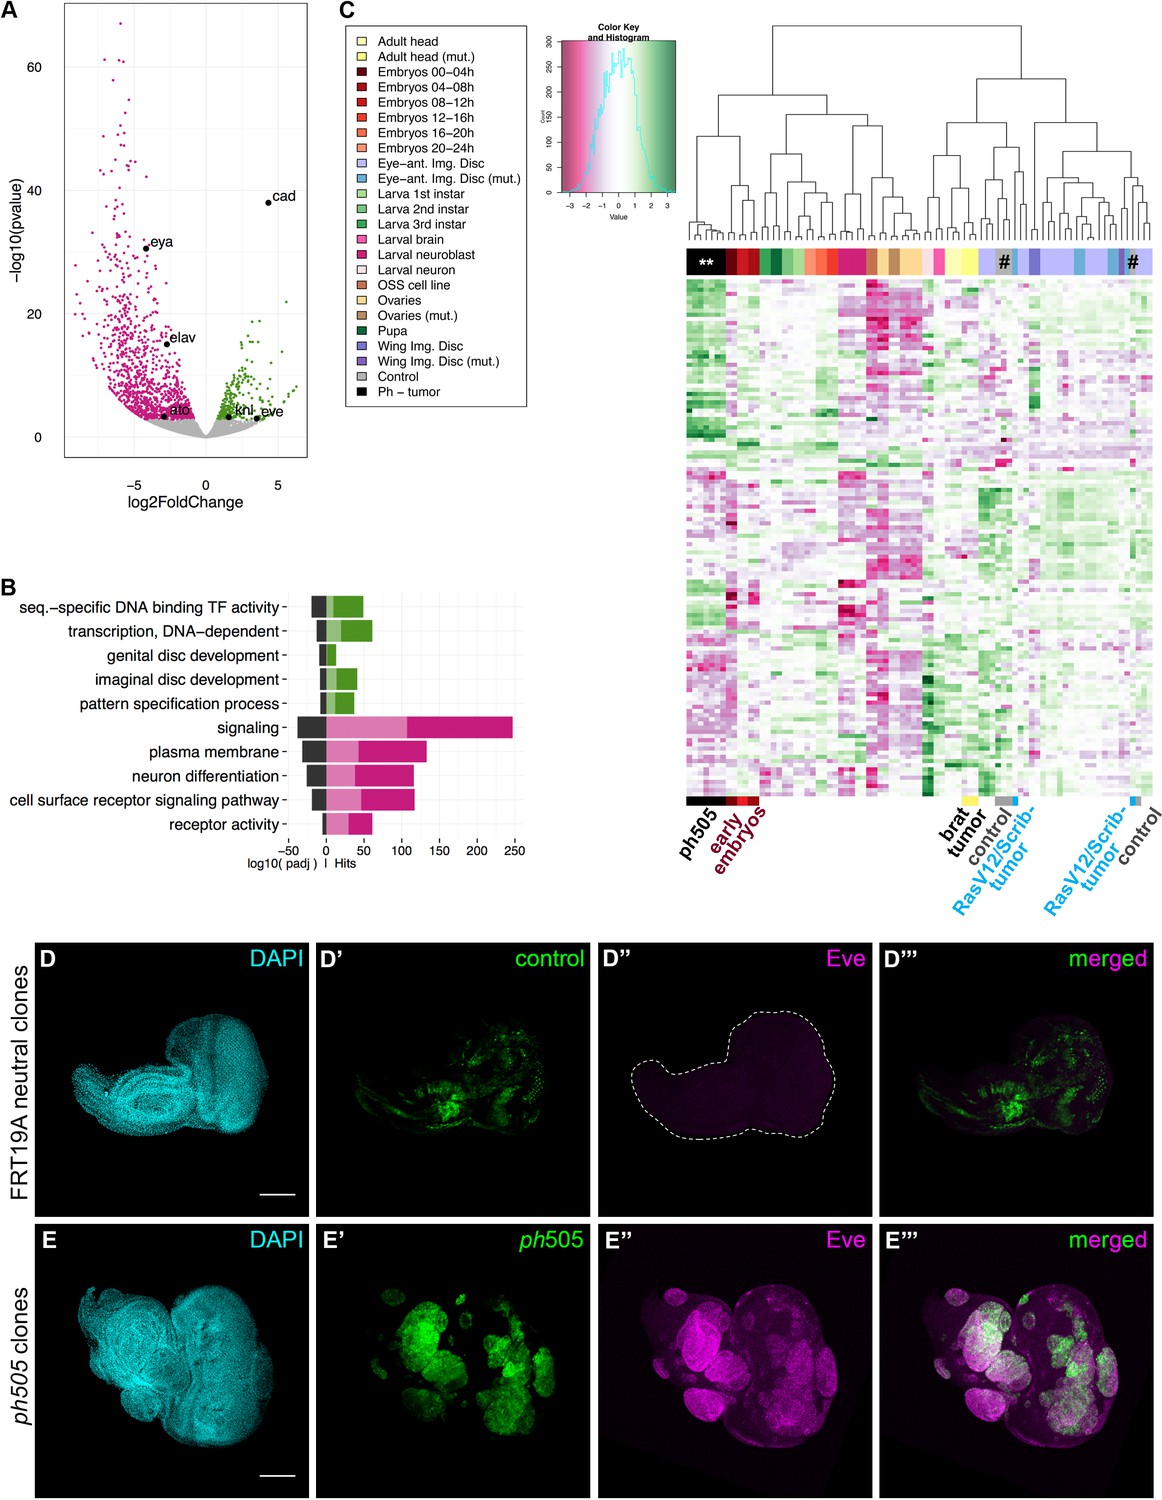
Gene expression analysis of ph505-tumor cells reveals loss of cell identity and acquisition of an embryonic-TF signature.
RNA-sequencing was performed in FACS-sorted ph505 tissue samples. Gene expression in tumor cells (GFP+) was compared with surrounding wild-type cells (GFP-) from the same pool of eye-antennal tissues. Volcano plot in (A) shows 1337 differentially expressed genes: 1062 genes are downregulated (pink) and 275 are upregulated (green) (padj ≤0.01, Benjamini). Names of 6 genes are provided in the volcano plot: cad, eve, kni, eya, elav, ato. Representation of selected Gene Ontology (GO) terms that were found enriched (for details please check Figure 1—source data 2) (B). Green/Pink light bars correspond to the expected number of genes for each category, Green/Pink dark bars correspond to the number of observed hits in our analysis. Black bars correspond to the log10(padj). Pink, downregulated genes; green, upregulated genes. Heatmap and respective dendogram obtained for clustering analysis with 83 samples (Figure 1—sources data 3 and 4) (C), showing tumor samples clustering together with early embryos. ph505-tumor samples in black (**), control samples (#) in grey and other tumor samples (brat- and RASV12/Scrib- tumors) are highlighted below the clustering. Embryonic transcription factor Even-skipped (Eve) is not detected in FRT neutral clones (D) but is ectopically expressed in ph505 clones (E). Scale bar corresponds to 100 µm. All microscope images are a maximum intensity projection of all z-stacks acquired for the tissue (DAPI, cyan; GFP MARCM clones, green; antibody staining, magenta). See also Figure 1—figure supplements 1–4 and Figure 1—source datas 1–4.
-
Figure 1—source data 1
List of differentially expressed genes.
- https://doi.org/10.7554/eLife.32697.008
-
Figure 1—source data 2
Gene Ontology (GO) analysis.
- https://doi.org/10.7554/eLife.32697.009
-
Figure 1—source data 3
Information relative to samples used for clustering (83 samples).
- https://doi.org/10.7554/eLife.32697.010
-
Figure 1—source data 4
List of genes used for hierarchical clustering analysis.
- https://doi.org/10.7554/eLife.32697.011
-
Figure 1—source data 5
List of Genotypes.
- https://doi.org/10.7554/eLife.32697.012
Figure 1—figure supplement 1
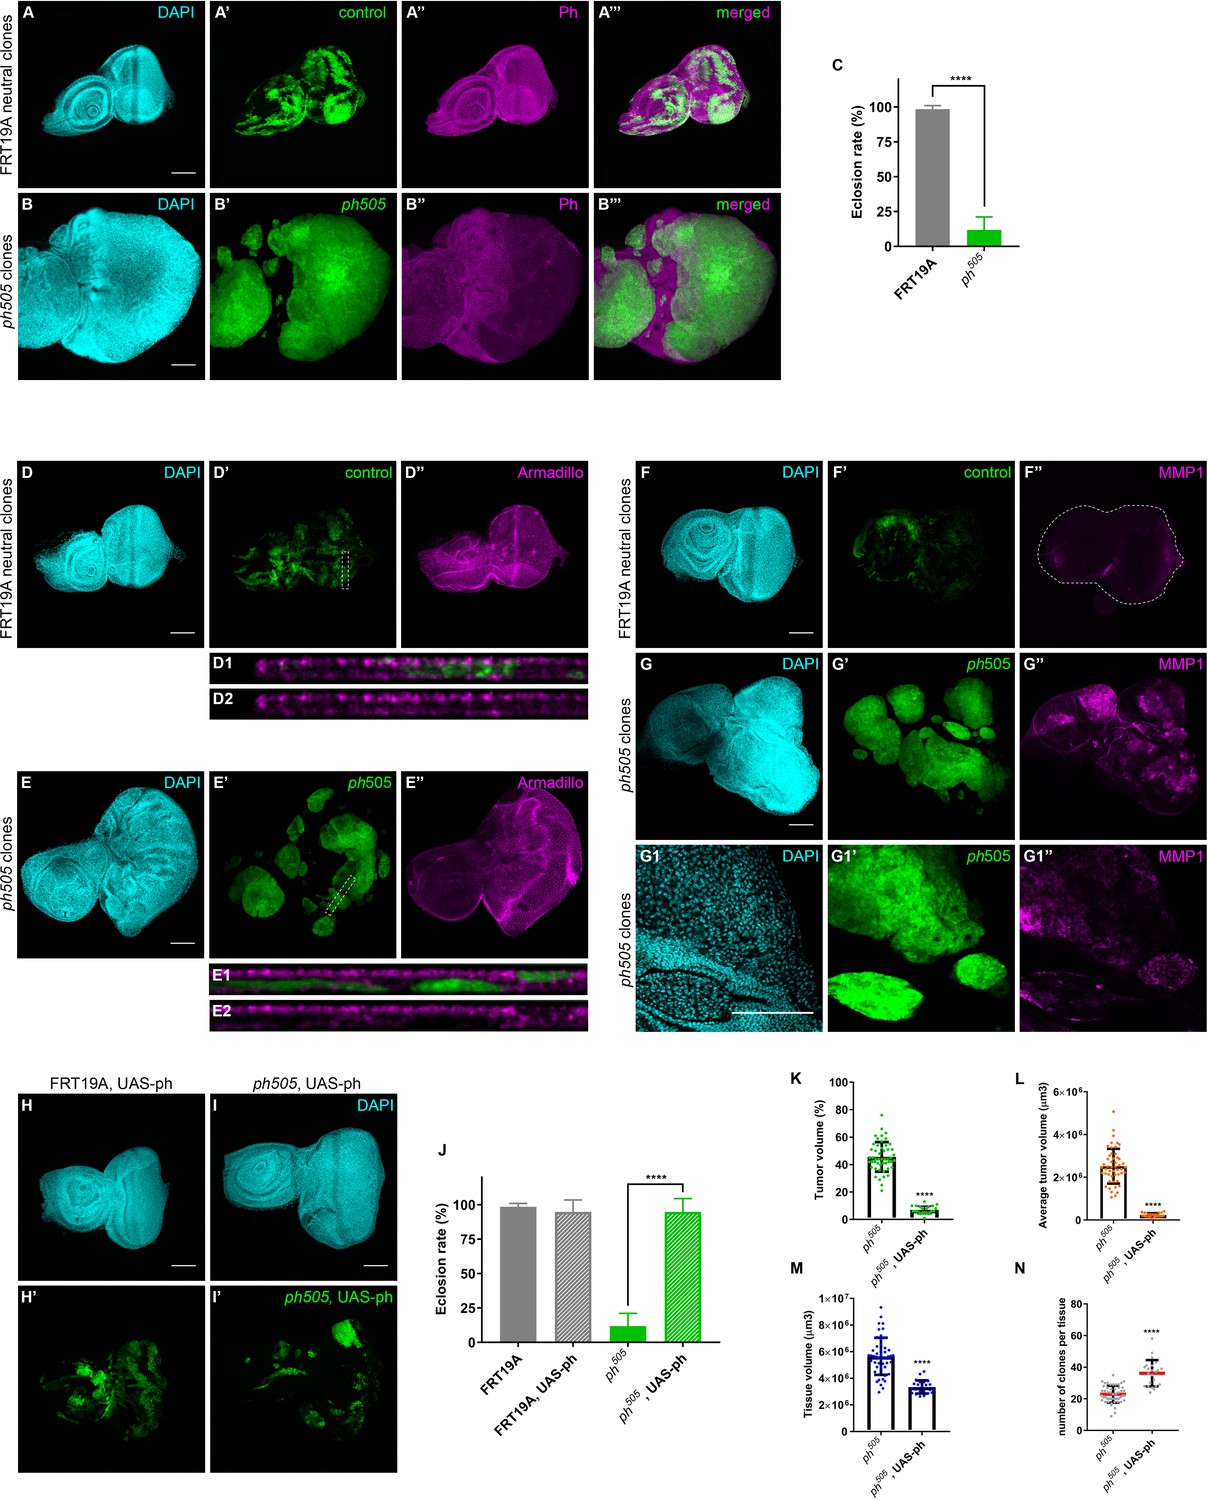
Neoplastic growth of ph mutant clones in eye-antennal imaginal discs can be rescued by wt ph co-expression.
Mitotic clones were generated by using eyFlp/FRT and MARCM systems, allowing for generation of GFP-labeled clones within eye-antennal imaginal discs. Ph expression in FRT19A control (A–A’’’) and in ph505 (B–B’’’) eye-antennal imaginal discs, showing a mutant clone specific reduction of Ph (B’–B’’). Eclosion rate for FRT19A and ph505 larvae (C). Armadillo (Arm) adherent junction normal protein expression in eye-antennal discs bearing neutral clones D–D’’. Loss of Arm is observed specifically in tumor clones (E–E’’). Dashed rectangles (D’ and E’) show the position of the Z-cross section in D1-D2 and E1-E2, respectively. Matrix metalloproteinase 1 (MMP1) expression in eye-antennal tissues is shown in F–F’’). MMP1 is recurrently expressed in neoplastic context, and its ectopic expression is specifically observed in tumor clones (G–G’’ and one middle Z-section at higher magnification G1–G1’’). Eye-antennal discs expressing UAS-ph in the context of FRT19A neutral clones (H–H’) and in ph505 mutant background (I–I’). Expression of UAS-ph per se does not change eclosion rate in a FRT19A neutral clones background (J). Eclosion rate for all conditions is shown (J). Number of larvae analyzed (J): FRT19A N = 163; FRT19A, UAS-ph N = 137; ph505 N = 784; ph505, UAS-ph N = 48. Rescue of phenotype by ectopic expression of ph is shown (J–K). Percentage of tumor volume (K), average tumor volume (L), tissue size (M) and number of clones per tissue (N) in ph505 and ph505, UAS-ph conditions. Percentage of tumor volume is the sum of the volume of all GFP+ clones in a tissue divided by the tissue size (volume of DAPI). Number of tissues analyzed (K–N): ph505 N = 50; ph505, UAS-ph N = 23. Scale bar corresponds to 100 µm. All microscope images are a maximum intensity projection of all z-stacks acquired for the tissue, except where otherwise stated (DAPI, cyan; GFP MARCM clones, green; antibody staining, magenta). Data (C, J–N) are represented as mean ± SD. Statistics: ****p<0.0001.
Figure 1—figure supplement 2
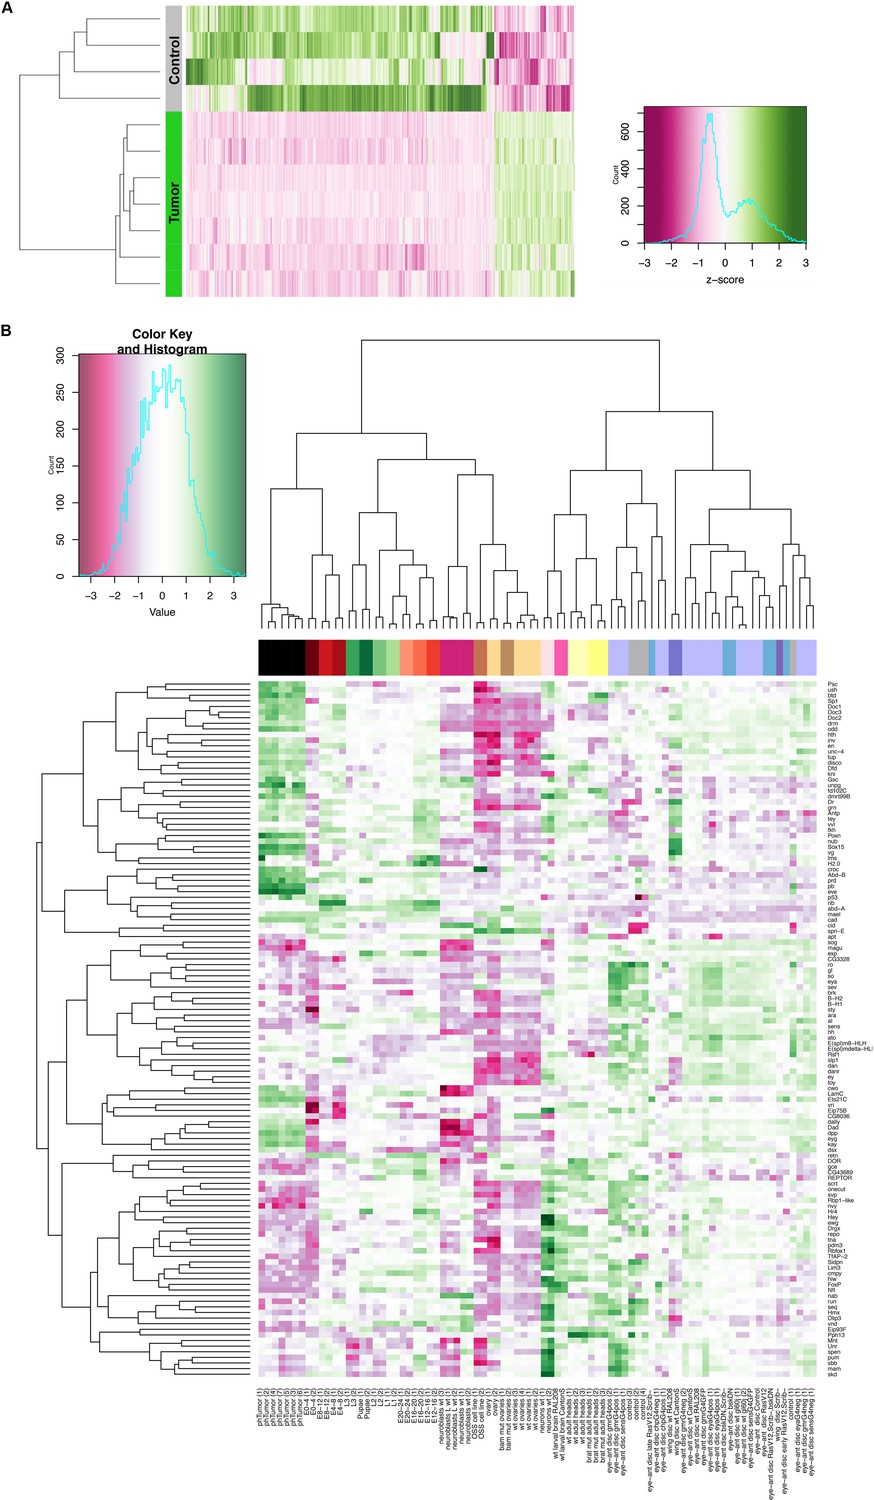
Gene expression analysis of ph505-tumor cells reveals loss of cell identity and acquisition of an embryonic-TF signature.
Heatmap of normalized expression levels of 1337 differentially expressed genes across tumor and control samples (A). A total of 1337 genes are differentially expressed in tumor samples in comparison to control cells (p adj. <0.01). Clustering analysis (represented with a dendogram) shows a clear separation between the seven tumor samples and four control samples analyzed. (B) Heatmap and respective dendograms obtained from clustering analysis of other samples by using the TF-signature of ph505-tumors. Details regarding sample and gene names are provided in the heatmap. See also Figure 1—source datas 1, 3 and 4.
Figure 1—figure supplement 3
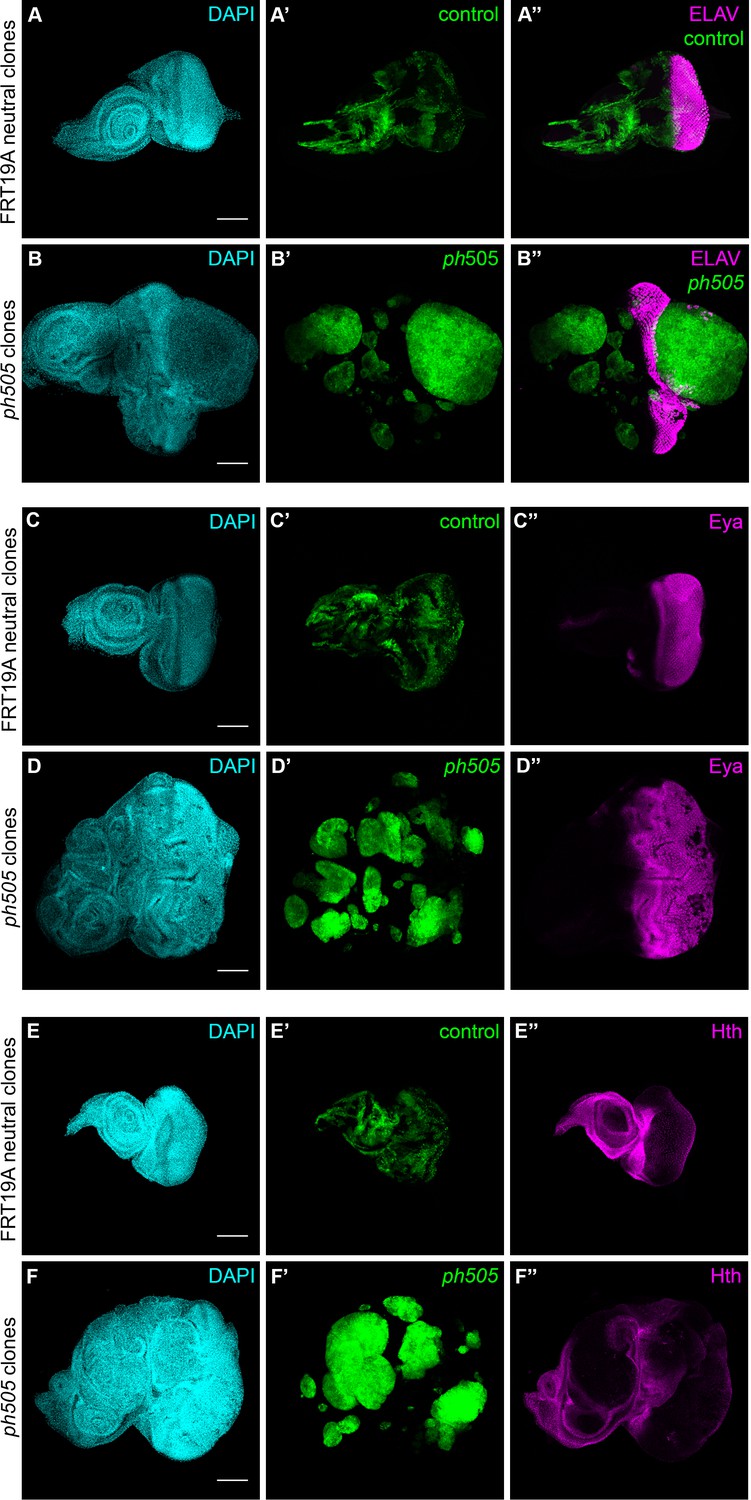
ph505-tumor cells do not express differentiation markers.
Normal pattern (A) expression of ELAV retinal cell marker is interrupted in ph505 clones (B). Eyes absent (Eya) and Homothorax (Hth) protein expression in FRT neutral (C, E) and ph505 (D, F) clones. Scale bar corresponds to 100 µm. All microscope images are a maximum intensity projection of all z-stacks acquired for the tissue (DAPI, cyan; GFP MARCM clones, green; antibody staining, magenta).
Figure 1—figure supplement 4
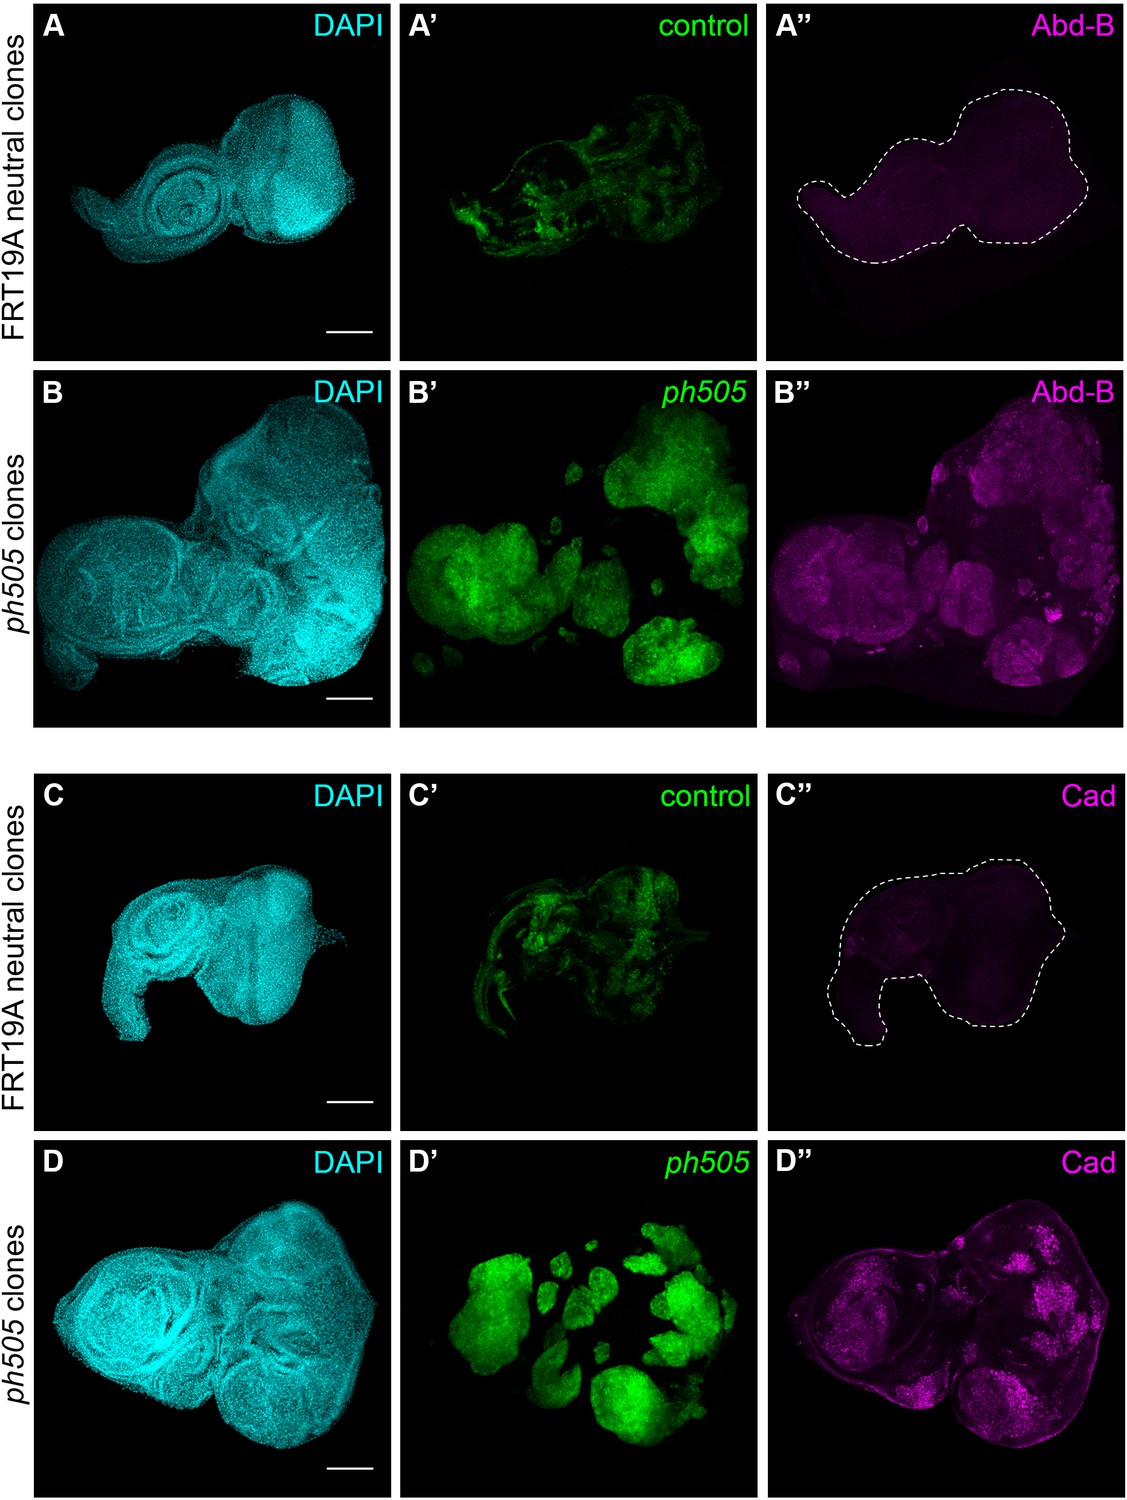
ph505-tumor cells ectopically express embryonic transcription factors.
Embryonic TF Abdominal-B (Abd-B) and Caudal (Cad) are ectopically expressed in ph505 clones (B–D) in comparison to FRT19A control tissues (A–C). Scale bar corresponds to 100 µm. All microscope images are a maximum intensity projection of all z-stacks acquired for the tissue (DAPI, cyan; GFP MARCM clones, green; antibody staining, magenta).
Figure 2 with 2 supplements
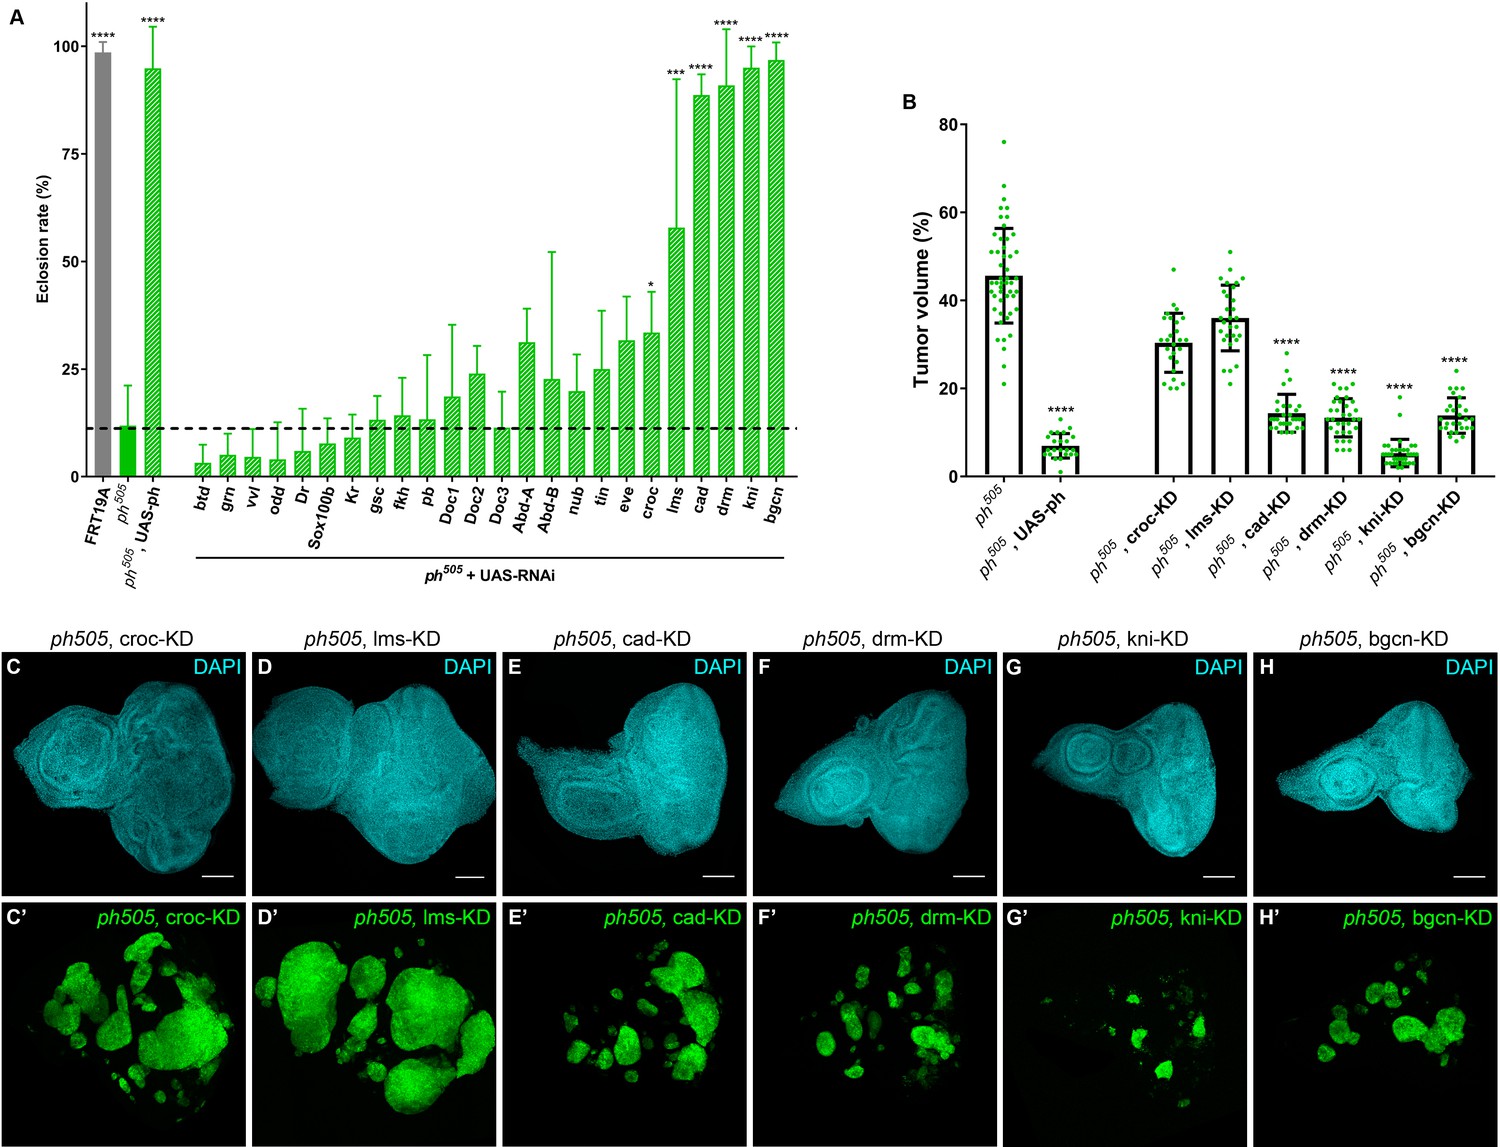
KD of embryonic TFs in ph505-tumors can increase the viability of the flies and reduce tumor volume.
Eclosion rates (%) for FRT19A control, ph505 and for specific KD in ph505 background (ph505 +UAS RNAi). Fly stocks carrying RNAi constructs were used for the KD of 24 TFs upregulated in ph505-tumor cells (A). Dashed line represents the mean eclosion rate for ph505 larvae. Number of larvae analyzed: FRT19A N = 163; ph505 N = 784; ph505, UAS-ph N = 48; for each TF-KD in ph505 background: btd- N = 329, grn- N = 256, vvl- N = 250, odd- N = 108, Dr- N = 96, Sox100b- N = 304, Kr- N = 309, gsc- N = 177, fkh- N = 231,pb- N = 110, Doc1- N = 337, Doc2- N = 128, Doc3- N = 297, AbdA- N = 119, AbdB- N = 129, nub- N = 216, tin- N = 54, eve- N-117, croc- N = 355, lms- N = 58, cad- N = 137, drm- N116, kni- N = 340, bgcn- N = 158. Targets whose KD induced a significantly different eclosion rate compared with ph505 were further characterized at the tumor volume level (B). Number of tissues analyzed per condition: ph505 N = 50; ph505, UAS-ph N = 23; ph505, croc-KD N = 26; ph505, lms-KD N = 29; ph505, cad-KD N = 30; ph505, drm-KD N = 33; ph505, kni-KD N = 35; ph505, bgcn-KD N = 28. Percentage of tumor volume is significantly reduced in 4 out of 6 perturbations compared with ph505 alone (46%): 14% in ph505, cad-KD; 13% in ph505, drm-KD; 5% in ph505, kni-KD; and 14% in ph505, bgcn-KD. ph505, UAS-ph condition leads to reduction of tumor volume to 7% and is shown here as a control of the rescue phenotype. Examples of eye-antennal imaginal discs from six different genotypes used for quantification of tumor volume (C–H). Scale bar corresponds to 100 µm. All microscope images are a maximum intensity projection of all z-stacks acquired for the tissue (DAPI, cyan; GFP MARCM clones, green). Data (A–B) are represented as mean ± SD. Statistics: ****p<0.0001; ***p<0.001; *p<0.05. See also Figure 2—figure supplement 1 and 2.
Figure 2—figure supplement 1
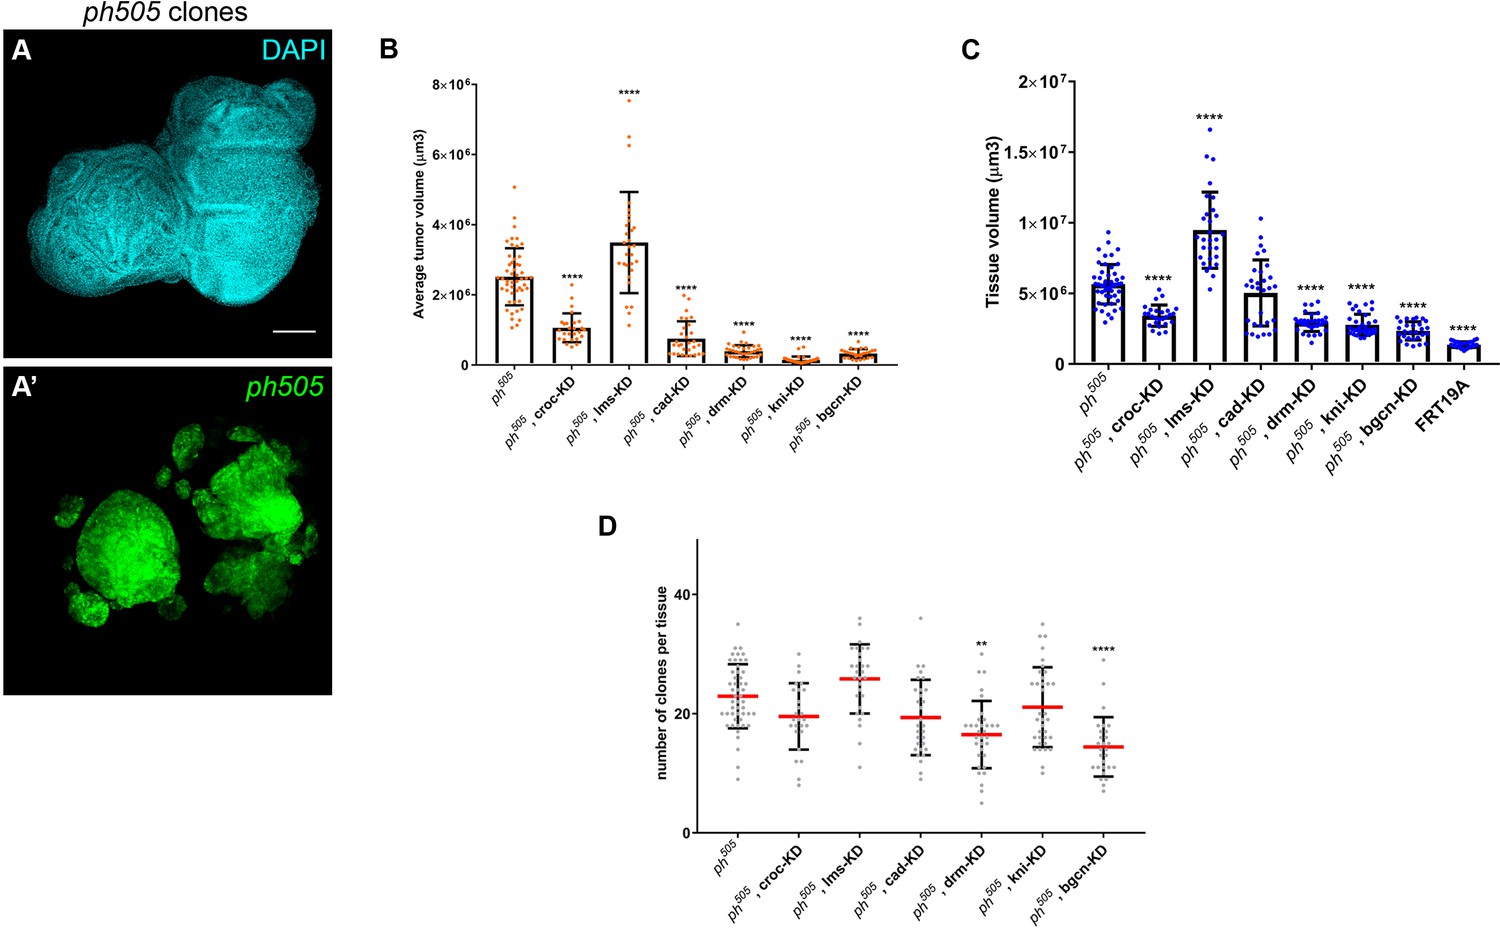
KD of embryonic TFs in ph505-tumors can increase the viability of the flies and reduce tumor volume.
Example of eye-antennal imaginal disc carrying ph505 cells used for quantification of tumor volume (A). Average tumor volume (µm3) (B), tissue volume (µm3) (C) and number of clones per tissue (D) for the 6 RNAi perturbations in a ph505 background are presented. Number of tissues analyzed per condition (B–D): ph505 N = 50; ph505, croc-KD N = 26; ph505, lms-KD N = 29; ph505, cad-KD N = 30; ph505, drm-KD N = 33; ph505, kni-KD N = 35; ph505, bgcn-KD N = 28. In (C) FRT19A neutral clones tissue size is also included (N = 32). Scale bar corresponds to 100 µm. All microscope images are a maximum intensity projection of all z-stacks acquired for the tissue (DAPI, cyan; GFP MARCM clones, green). Data (B–D) are represented as mean ± SD. Statistics: ****p<0.0001; **p<0.01.
Figure 2—figure supplement 2
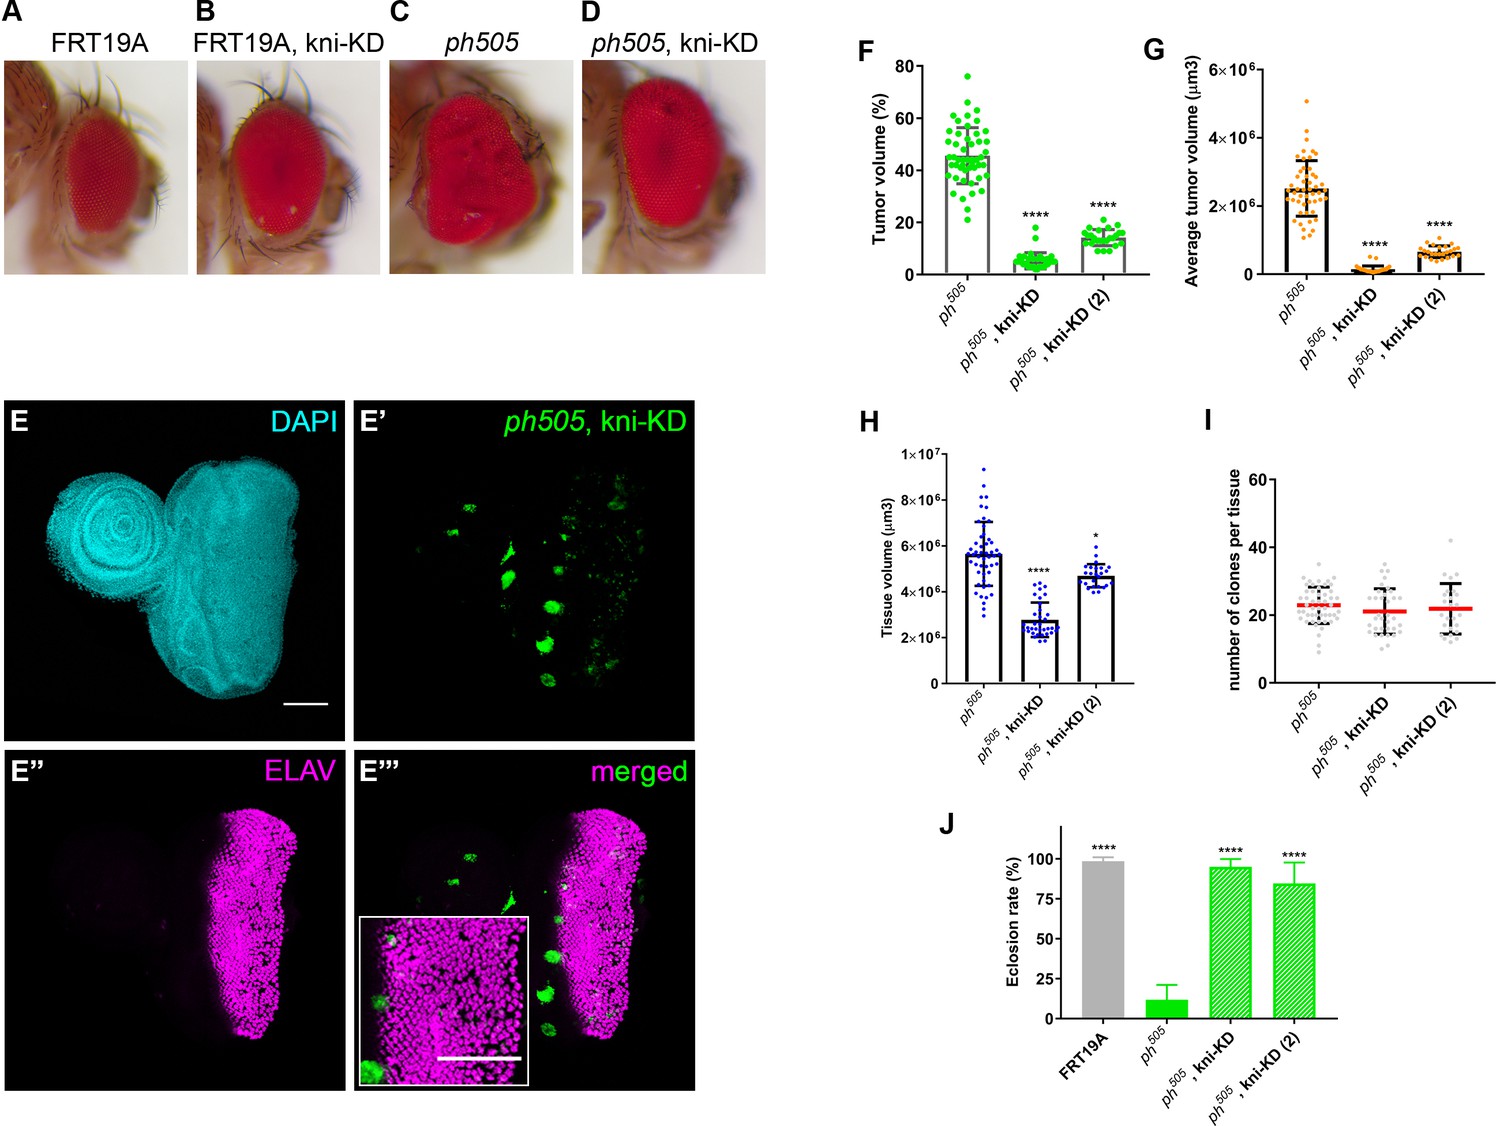
KD of embryonic TFs in ph505-tumors can increase the viability of the flies and reduce tumor volume.
Representative adult eyes of 4 different genotypes: FRT19A neutral clones (A), FRT19A, kni-KD (B), ph505 (C) and ph505, kni-KD (D). ELAV protein expression in ph505, kni-KD tissues (E). Higher magnification inset is shown in E’’’. Percentage of tumor volume (F), average tumor volume (µm3) (G), tissue volume (µm3) (H) and number of clones per tissue (I) for the KD of knirps with two different RNAi constructs in a ph505 background. Number of tissues analyzed per condition (F–I): ph505 N = 50; ph505, kni-KD N = 35, ph505, kni-KD(2) N = 25. Reduction of tumor volume to 5% and 14% for ph505, kni-KD-(1) and -(2), respectively. Eclosion rate of ph505, kni-KD (J). Number of larvae analyzed: FRT19A N = 163; ph505 N = 784; ph505, kni-KD N = 340, ph505, kni-KD(2) N = 112. Scale bar corresponds to 100 µm. All microscope images are a maximum intensity projection of all z-stacks acquired for the tissue (DAPI, cyan; GFP MARCM clones, green, antibody staining, magenta). Data (F–J) are represented as mean ± SD. Statistics: ****p<0.0001; *p<0.05.
Figure 3 with 1 supplement
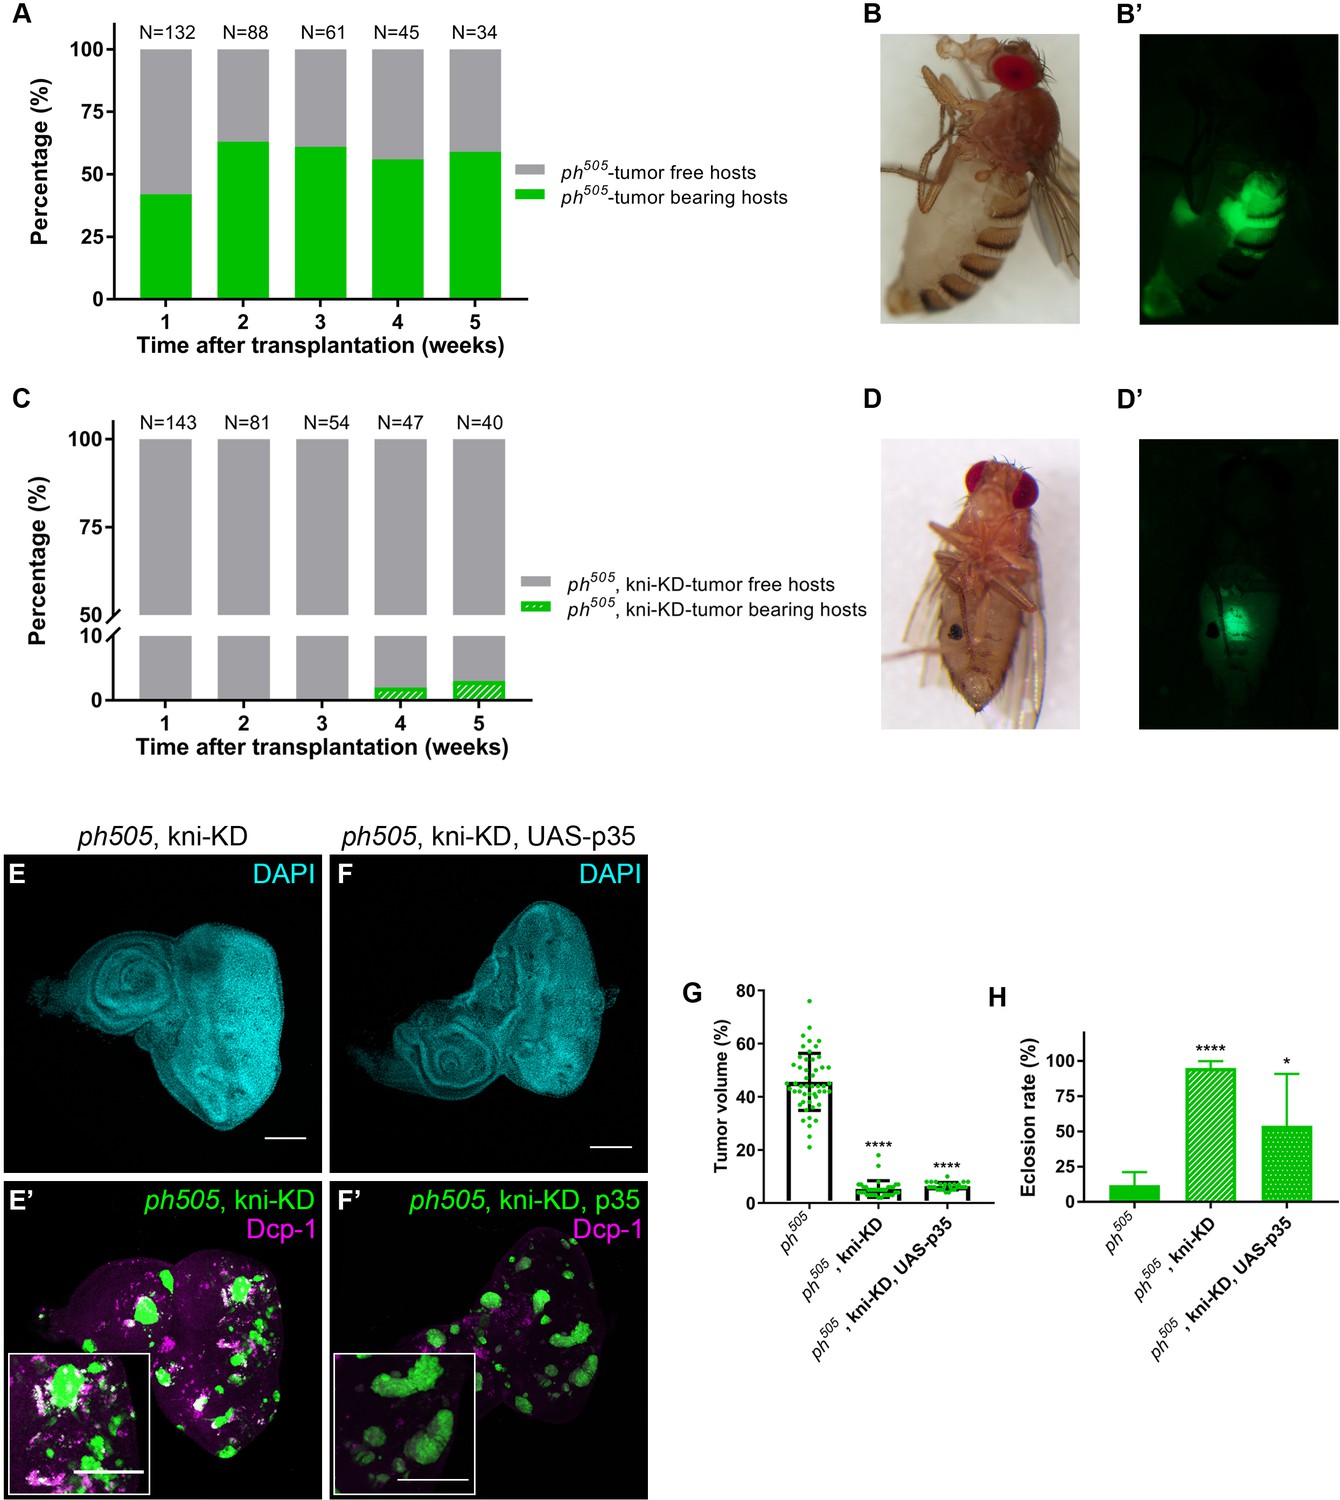
kni-KD in ph505-tumors has anti-oncogenic effects Percentage of ph505 tumor-bearing hosts over time ranges from 40–60% (A).
Female host shows abdominal tumor growth one week after transplantation (B–B’). Percentage of ph505, kni-KD tumor-bearing hosts is shown over time and ranges from 0% to 3% (C). One single host with a tumor was observed on week 4 (C). Brightfield (D) and fluorescence images (D’) of the tumor-bearing host on day 35. ‘N’ represents the total number of hosts analyzed per time point. Green bars represent the percentage of hosts with visible tumors, while grey bars represent the percentage of hosts without tumors. Levels of apoptosis (Dcp-1) are shown for ph505, kni-KD (E–E’) and ph505, kni-KD, UAS-p35 (F–F’). Higher magnification insets are shown in E’ and F’. Percentage of tumor volume (G). Number of tissues analyzed per condition: ph505 N = 50; ph505, kni-KD N = 35; ph505, kni-KD, UAS-p35 N = 27. Percentage of tumor volume is significantly reduced in the two conditions compared with ph505 alone (46%): 5% in ph505, kni-KD; and 6% in ph505, kni-KD, UAS-p35. Eclosion rate for same conditions (H). Number of larvae analyzed: ph505 N = 784; ph505, kni-KD N = 340; ph505, kni-KD, UAS-p35 N = 48. Scale bar corresponds to 100 µm. All microscope images are a maximum intensity projection of all z-stacks acquired for the tissue (DAPI, cyan; GFP MARCM clones, green). Data (G–H) are represented as mean ± SD. Statistics: ****p<0.0001; *p<0.05. See also Figure 3—figure supplements 1
Figure 3—figure supplement 1
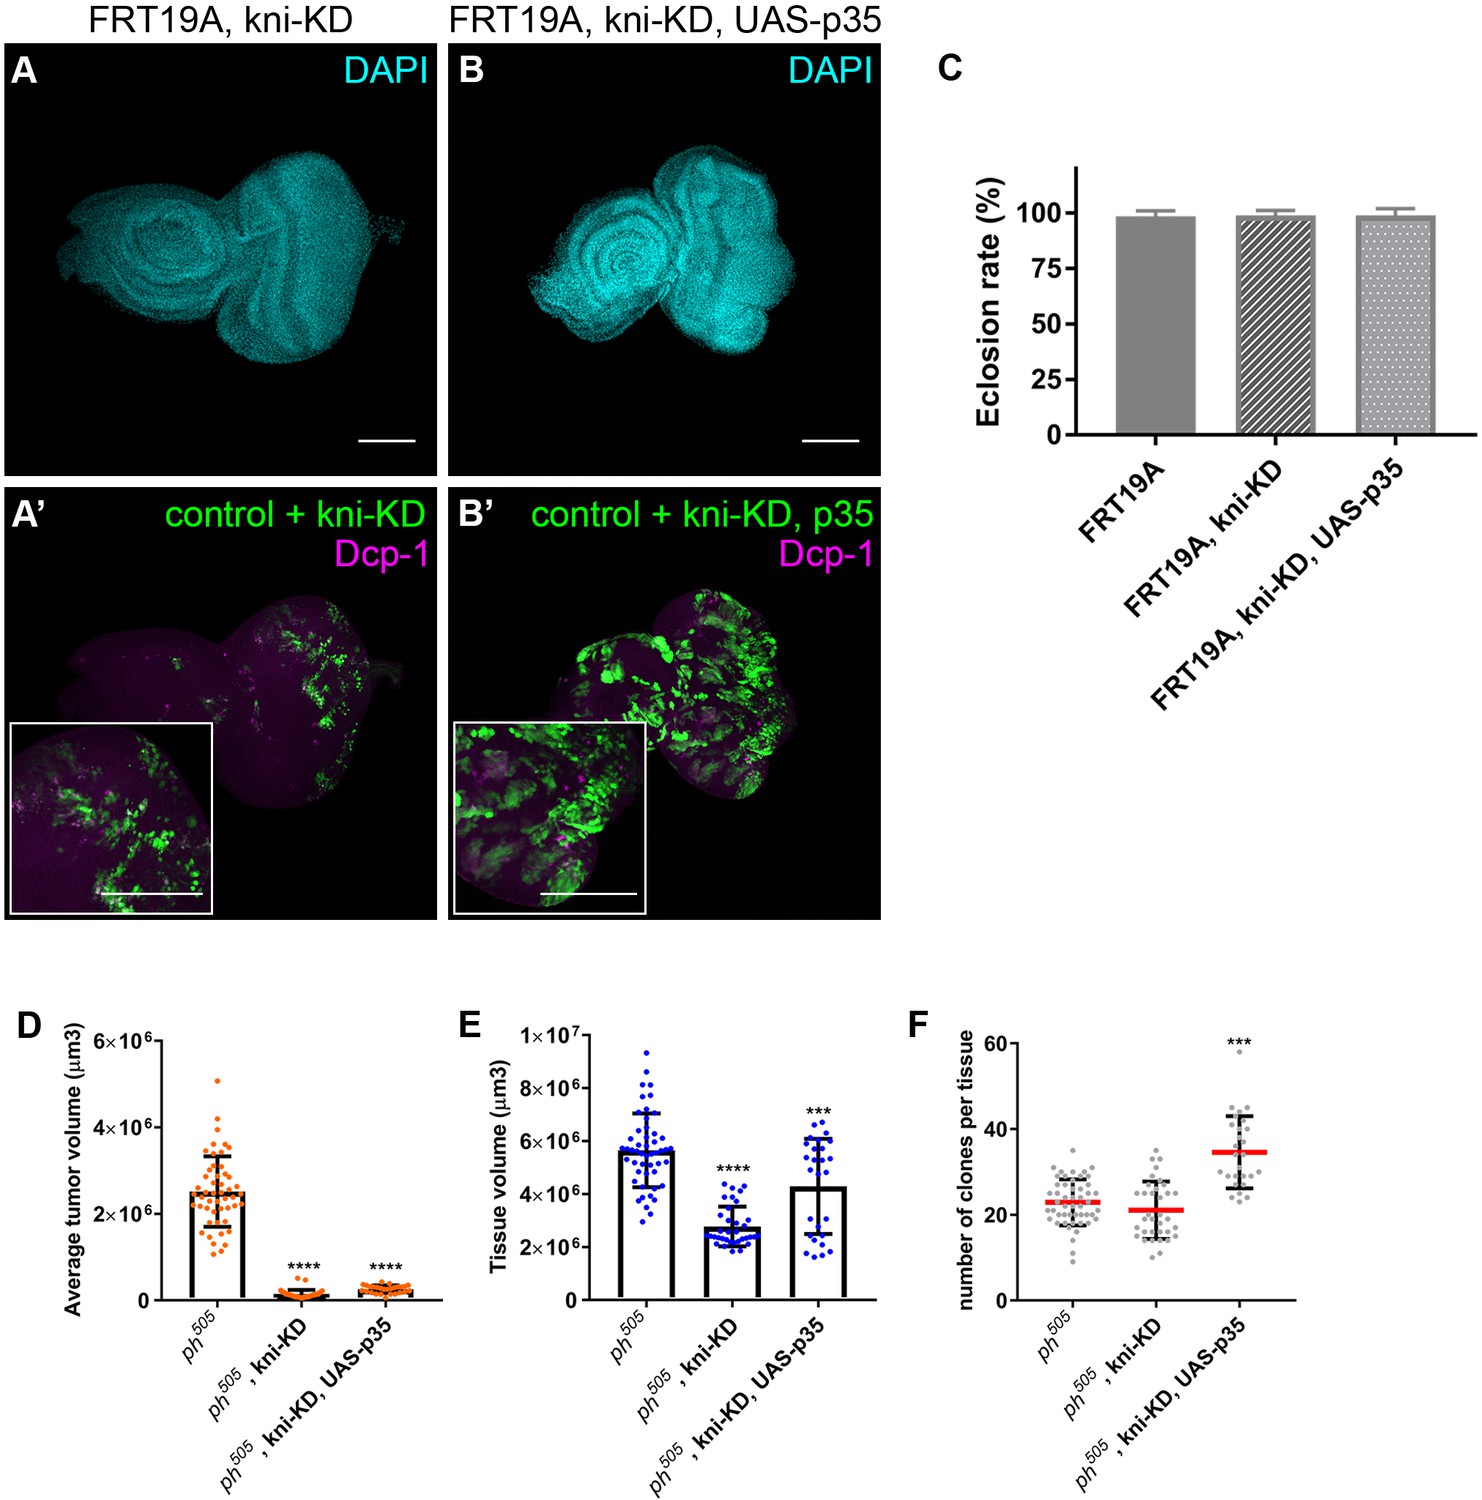
kni-KD in ph505-tumors has anti-oncogenic effects.
Levels of apoptosis (Dcp-1) are shown for FRT19A, kni-KD (A–A’) and FRT19A, kni-KD, UAS-p35 (B–B’). Higher magnification insets are shown in A’ and B’. Eclosion rates for the same conditions (C). Number of larvae analyzed: FRT19A N = 163; FRT19A, kni-KD N = 219; FRT19A, kni-KD, UAS-p35 N = 75. Average tumor volume (µm3) (D), tissue volume (µm3) (E) and number of clones per tissue (F) for the blockage of apoptosis (via UAS-p35) in ph505, kni-kD clones. Number of tissues analyzed per condition (D–F): ph505 N = 50; ph505, kni-KD N = 35; ph505, kni-KD, UAS-p35 N = 27. Scale bar corresponds to 100 µm. All microscope images are a maximum intensity projection of all z-stacks acquired for the tissue (DAPI, cyan; GFP MARCM clones, green; antibody staining, magenta). Data (C–F) are represented as mean ± SD. Statistics: ****p<0.0001, ***p<0.001.
Figure 4
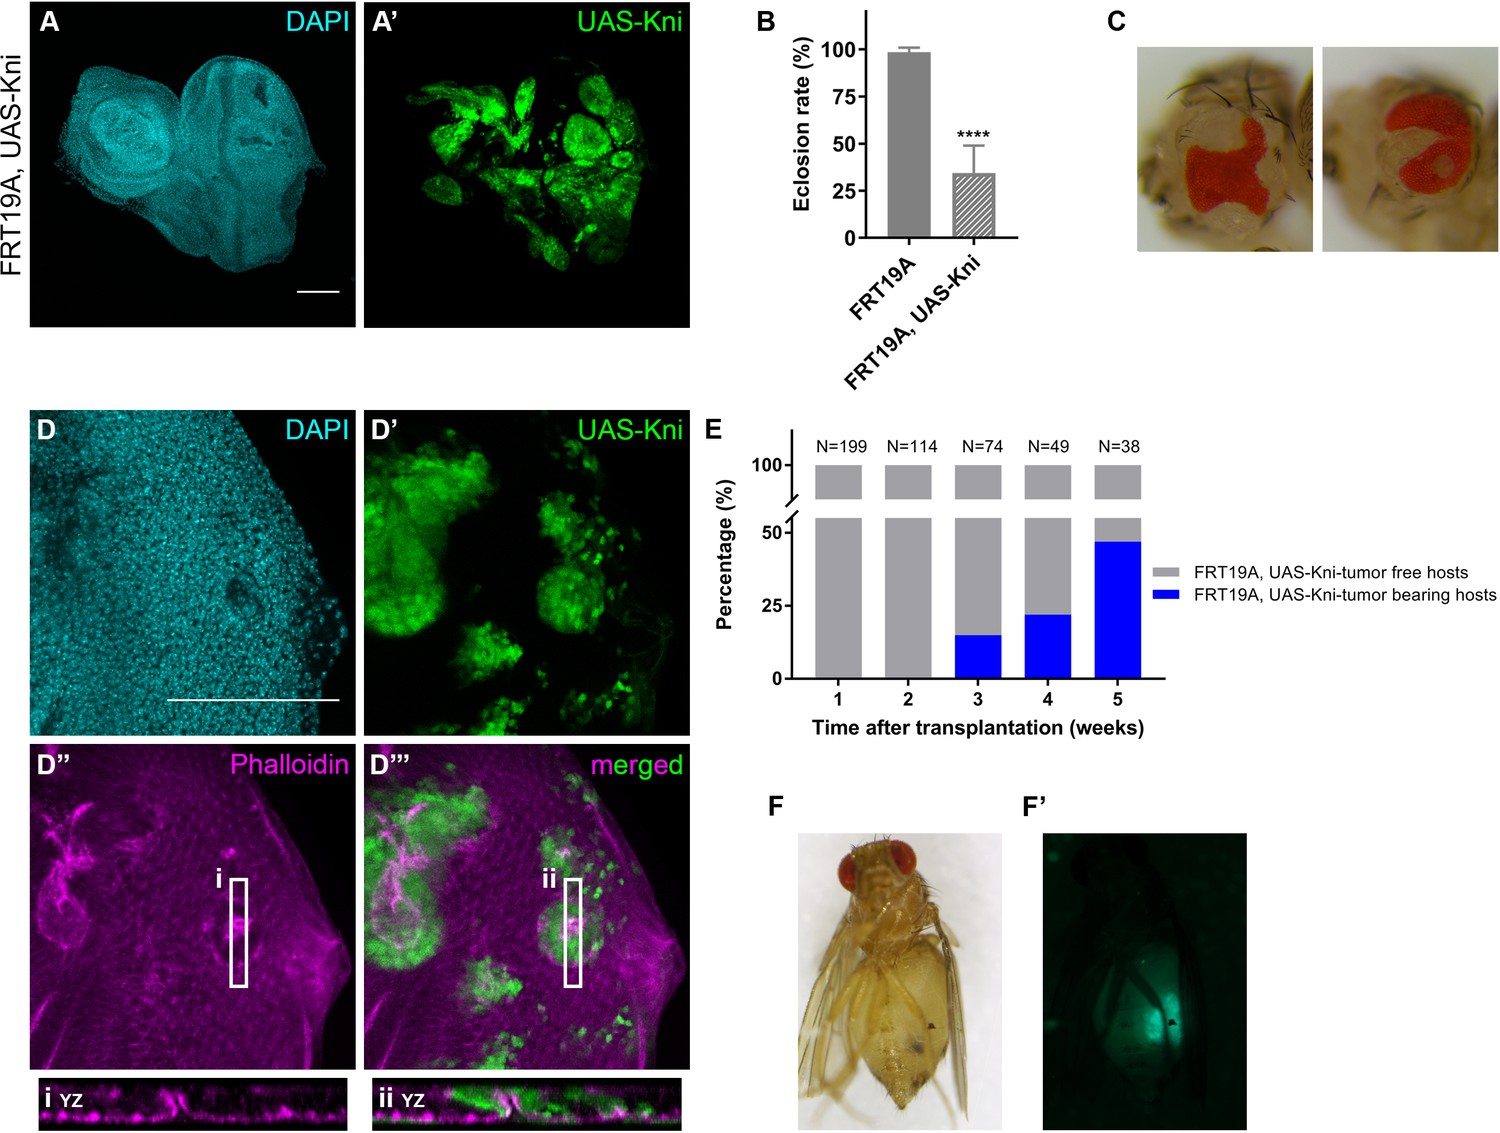
Knirps misexpression induces cyst formation in imaginal discs and is sufficient to drive tumorigenesis.
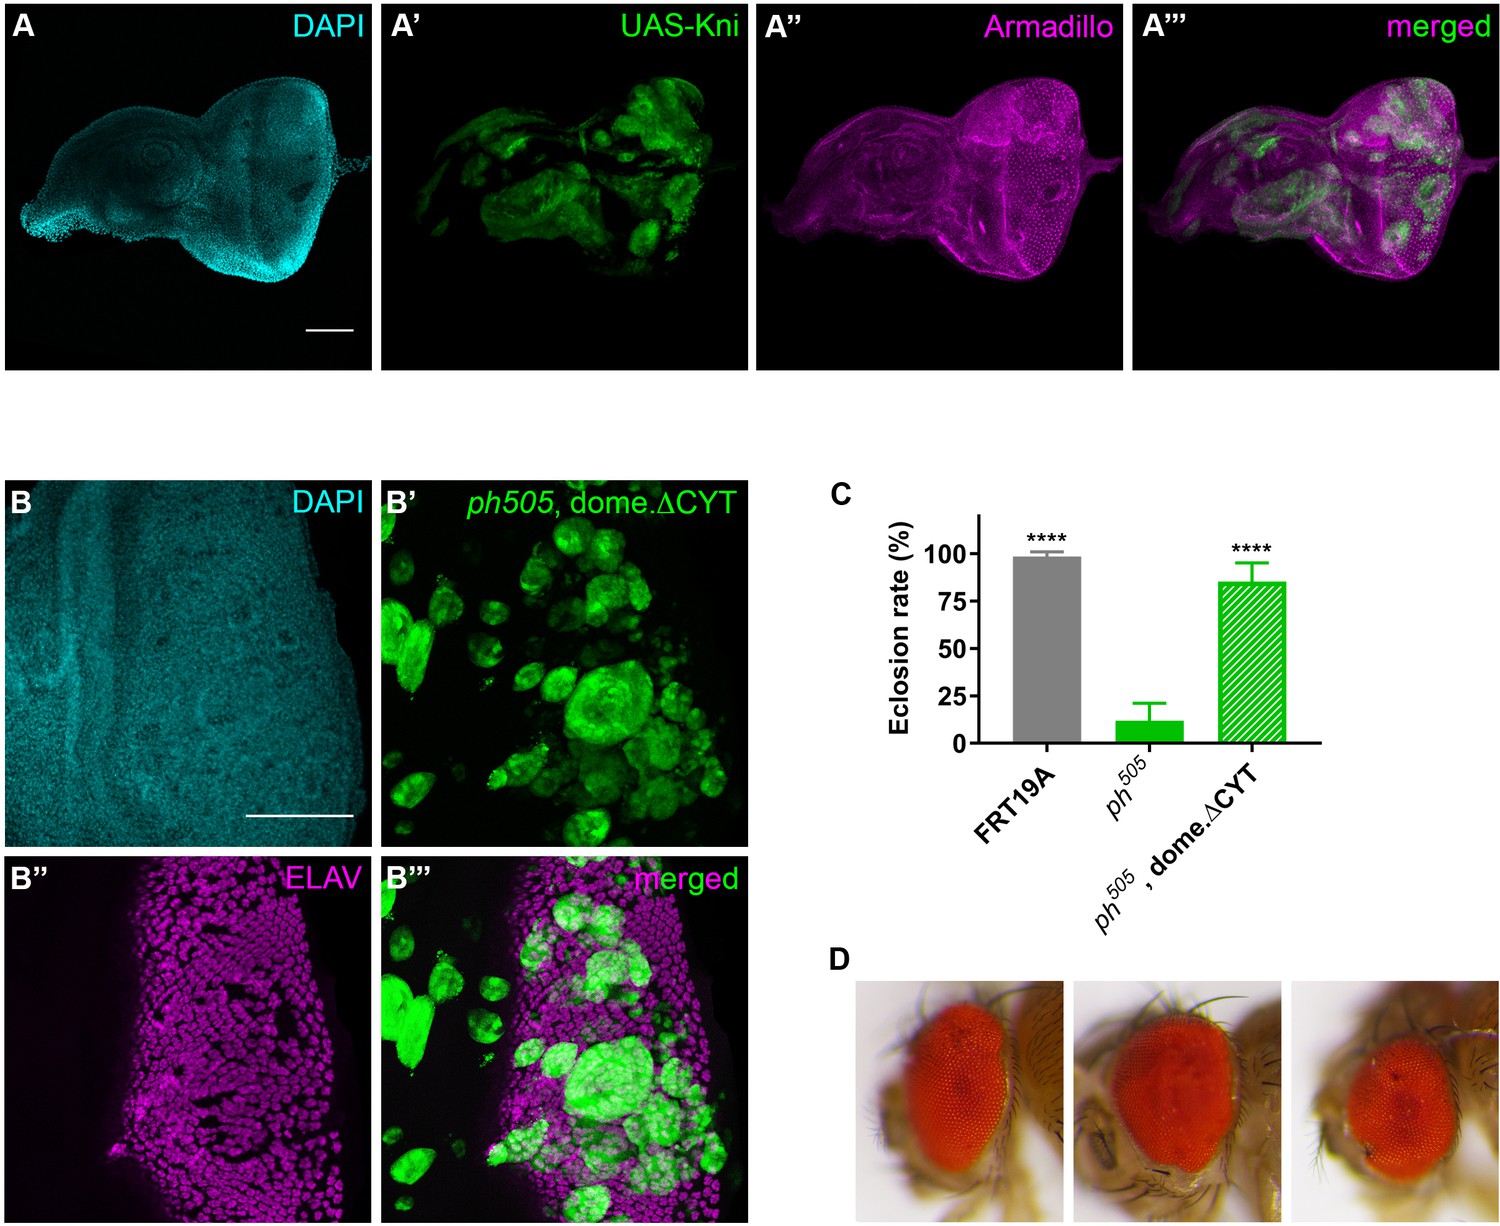
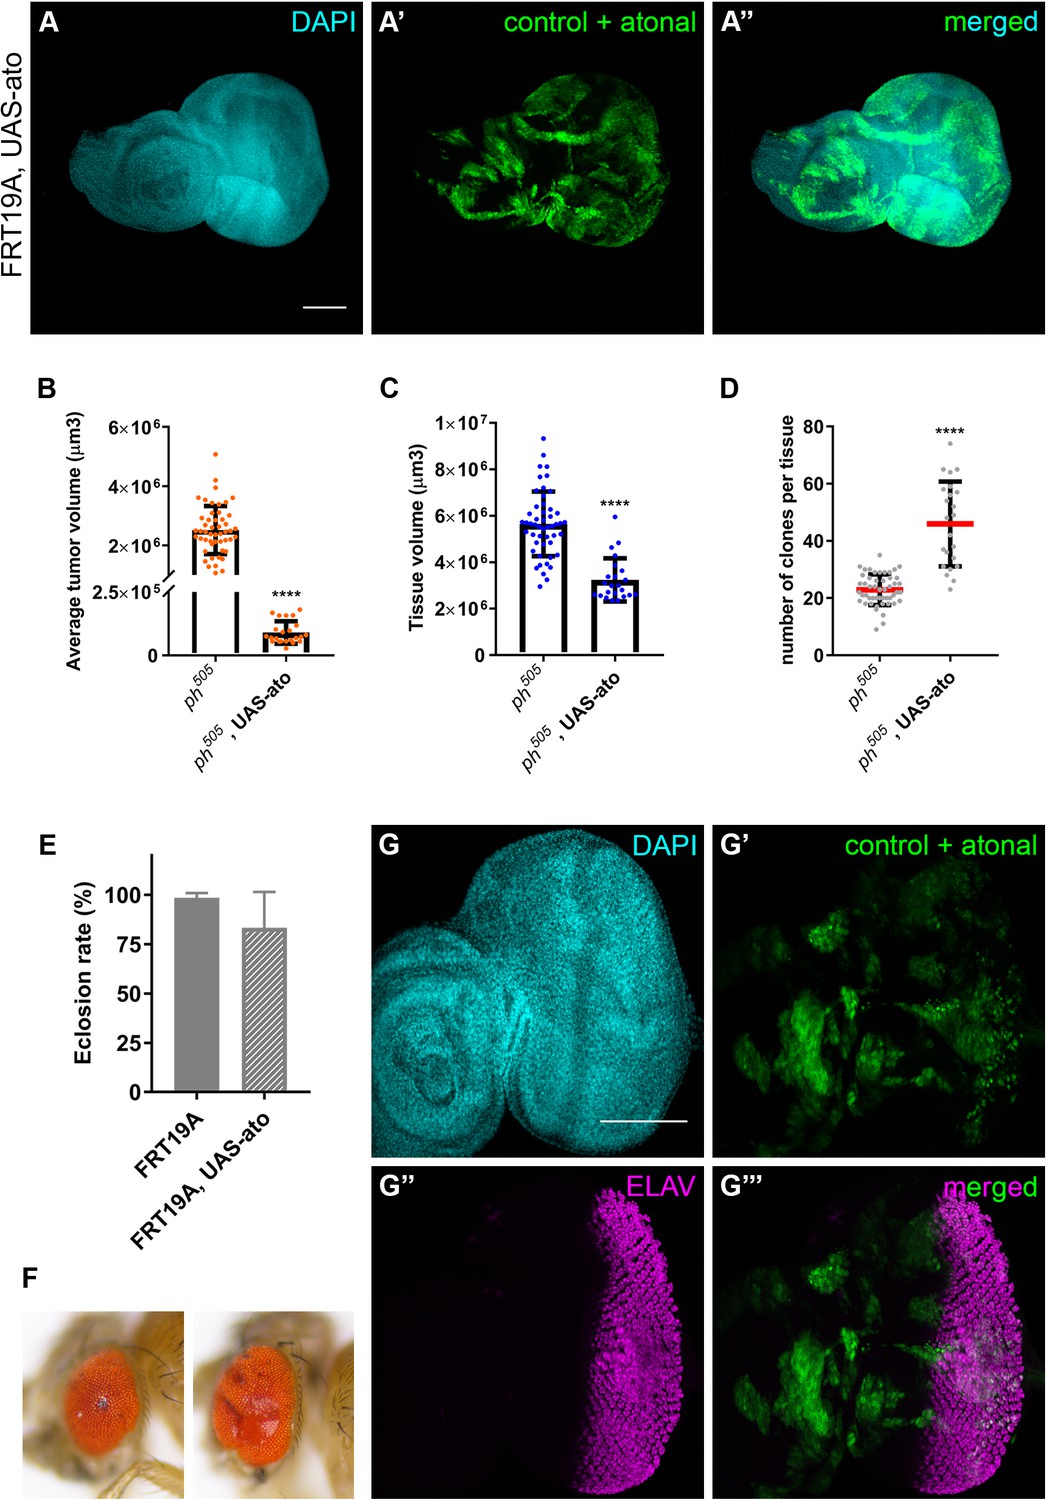
Ectopic expression of knirps in eye-antennal imaginal discs shows a distinct pattern of clones (A–A’). Eclosion rate (B) for FRT19A and FRT19A, UAS-Kni. Ectopic expression of kni in these particular tissues compromises the viability of the flies. Number of larvae analyzed: FRT19A N = 163; FRT19A, UAS-Kni N = 441. Ectopic expression of knirps in eye-antennal discs compromises normal eye development as assessed by adult eye structures (C). Formation of cysts in tissues carrying ectopic expression of kni (D–D’), highlighted by middle sections (five middle Z-stacks) with Phalloidin staining (D’’). Insets (i and ii) for orthogonal views (YZ) are shown and cutting plane is depicted in (D’’–D’’’). Assays of transplantation were performed with tissues carrying ectopic expression of kni (E). Tumor-bearing hosts were observed 3 weeks after transplantation (<25% of hosts). In week 5, almost 50% of the hosts that survived carried GFP+-tumor tissue. Blue bars represent the percentage of hosts with tumors, while grey bars show percentage of hosts without tumor. Tumor-bearing host on week five is shown in (F) and tumor fluorescence in (F’). Scale bar corresponds to 100 µm. All microscope images are a maximum intensity projection of all z-stacks acquired for the tissue, except where otherwise stated (DAPI, cyan; GFP MARCM clones, green; antibody staining, magenta). Data (B) are represented as mean ± SD. Statistics: ****p<0.0001. See also Figure 5—figure supplement 1.
Figure 5 with 1 supplement
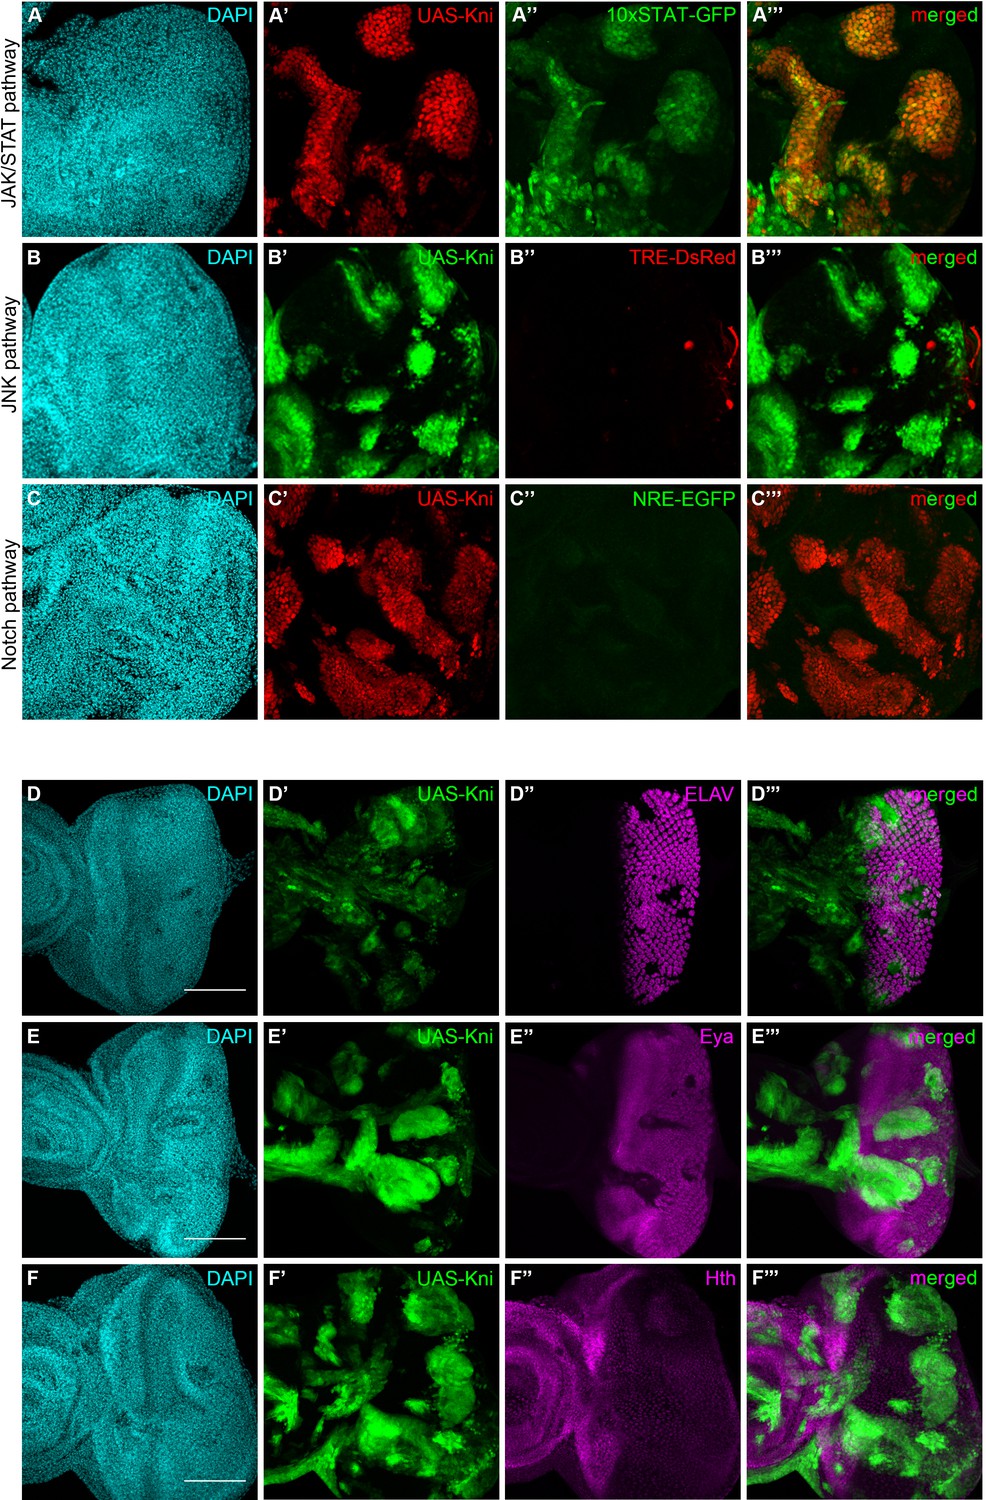
Knirps misexpression induces JAK/STAT activation and compromises differentiation.
Activity of JAK/STAT, JNK and Notch signaling pathways in the context of kni-ectopic expression in eye-antennal discs was assessed by evaluating the expression of the respective activity reporters: 10x STAT-GFP (A, RFP MARCM clones in red, JAK/STAT reporter in green), TRE-DsRed (B, GFP MARCM clones in green, JNK reporter in red) and NRE-EGFP (C, RFP MARCM clones in red, Notch reporter in green). Ectopic expression of STAT is specifically observed in kni cyst-like clones (A’–A’’’). JNK and Notch pathways are not ectopically activated in UAS-Kni clones. Differentiation of eye progenitors is compromised as observed by ELAV and Eya protein expression (D–E). Normal ELAV and Eya protein expression is interrupted in the presence of Kni ectopic clones, particularly in cysts (D’’’ and E’’’), without ectopic expression of Hth (F). Scale bar corresponds to 100 µm. All microscope images are a maximum intensity projection of all z-stacks acquired for the tissue (DAPI, cyan; GFP MARCM clones, green, unless otherwise stated; antibody staining, magenta). See also Figure 5—figure supplement 1.
Figure 5—figure supplement 1
Knirps misexpression induces JAK/STAT activation and compromises differentiation.
Disruption of Armadillo protein expression is observed in UAS-Kni expressing clones (A). ELAV protein expression is interrupted in ph505, dome.∆CYT (blockage of JAK/STAT pathway in ph505 background) clones (B). These particular larvae have also an increased eclosion rate in comparison to ph505-tumors (C). Number of larvae analyzed: FRT19A N = 163; ph505 N = 784; ph505, dome.∆CYT N = 290. Eye structures from adults carrying ph505, dome.∆CYT genotypes (D). Scale bar corresponds to 100 µm. All microscope images are a maximum intensity projection of all z-stacks acquired for the tissue (DAPI, cyan; GFP MARCM clones, green; antibody staining, magenta). Data (C) are represented as mean ± SD. Statistics: ****p<0.0001.
Figure 6 with 2 supplements
Overexpression of pro-neural TF in ph505-clones suppresses tumor phenotype.
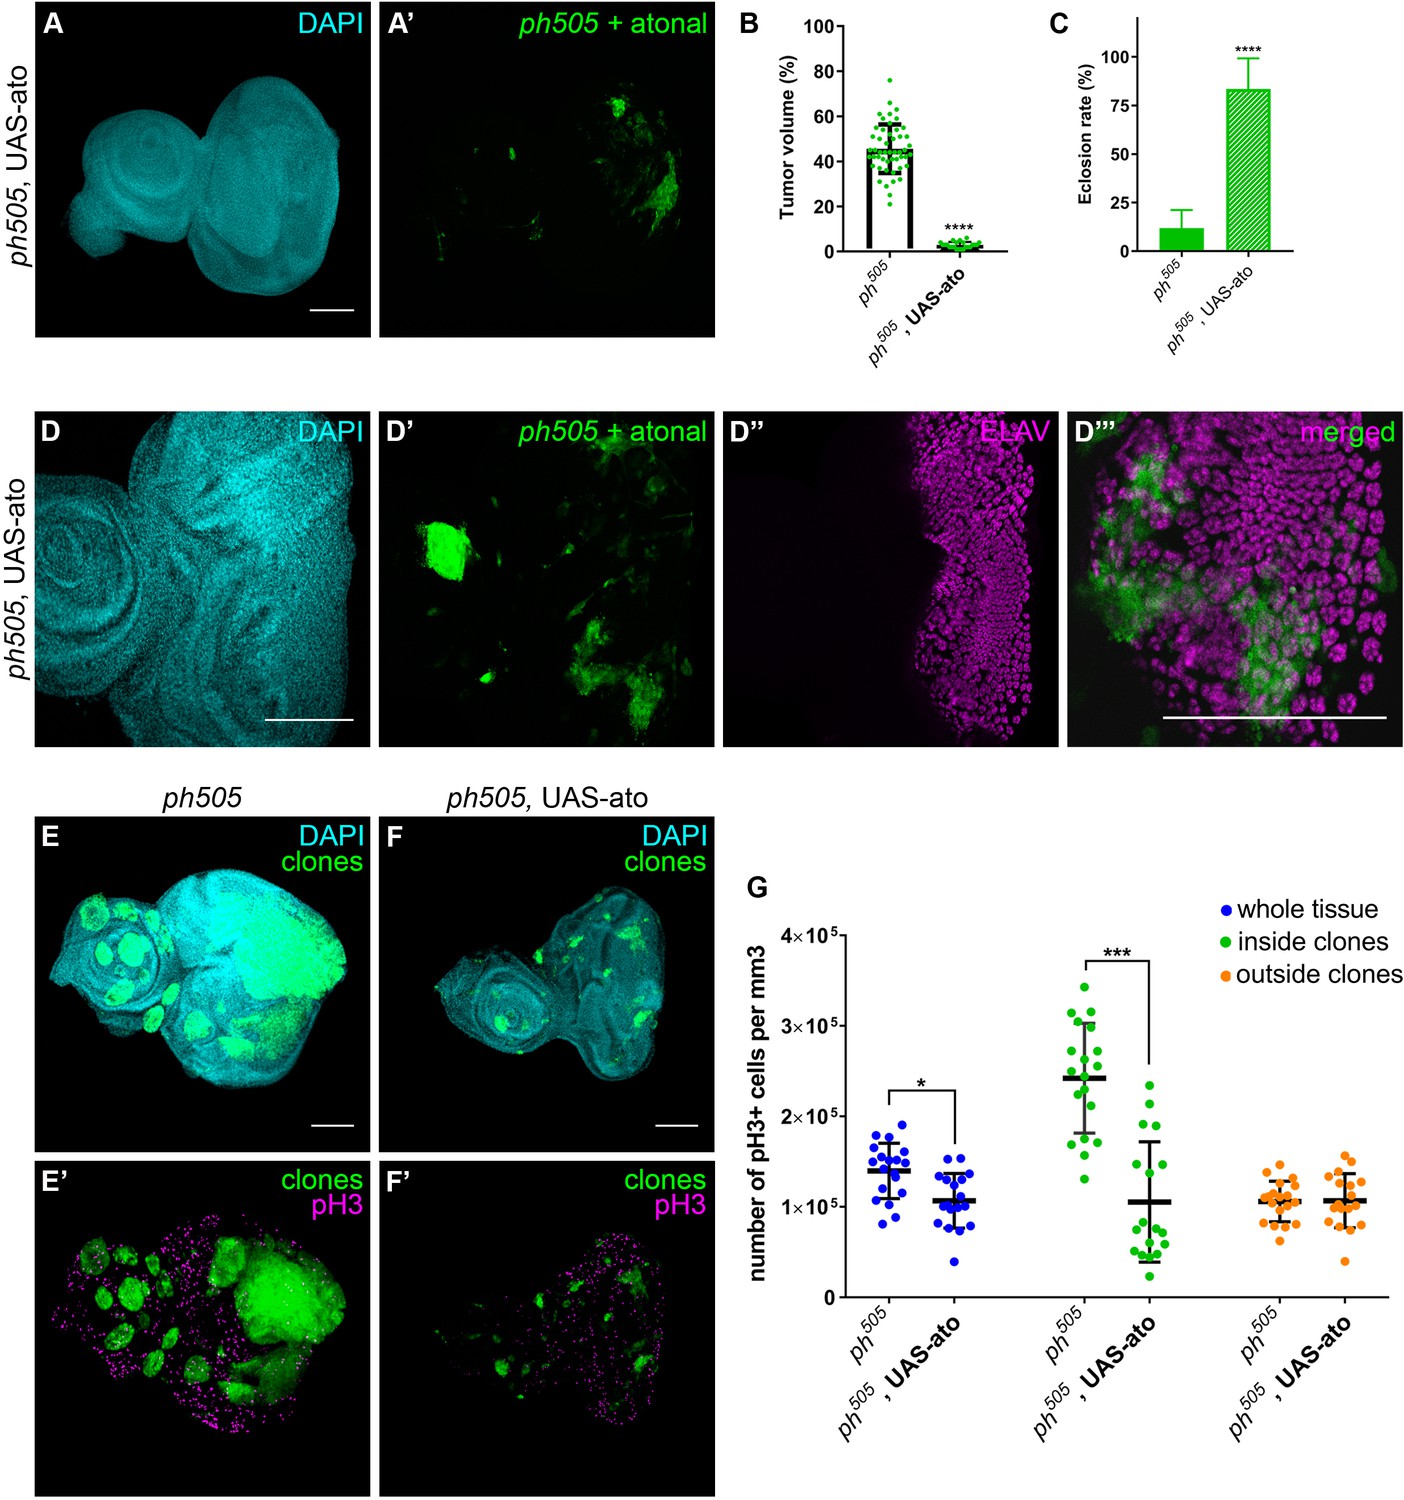
Forcing differentiation of ph505 cells by ectopically expressing pro-neural TF atonal leads to a reduction of tumor volume (A–B). Number of tissues analyzed: ph505 N = 50; ph505, UAS-ato N = 23. On average, tumor volume is reduced to 3% of the eye-antennal imaginal disc volume (B). Eclosion rate of larvae of ph505, UAS-ato genotype is increased and comparable to FRT19A neutral clones’ genotype (C). Number of larvae analyzed: ph505 N = 784; ph505, UAS-ato N = 95. ELAV protein expression in ph505 clones expressing UAS-ato (D). Proliferation levels (phospho-histone H3, pH3) upon overexpressing ato in ph505-cells (E–F). Quantitative analysis of pH3+ cell numbers in ph505 and ph505, UAS-ato (G). These values were normalized to the respective volumes, such as ‘whole tissue’ data was normalized to the total tissue volume, ‘inside clones’ normalized to volume taken by GFP+ clones and ‘outside clones’ normalized to the volume of tissue that is GFP-. Number of tissues analyzed: ph505 N = 19; ph505, UAS-ato N = 18. Scale bar corresponds to 100 µm. All microscope images are a maximum intensity projection of all z-stacks acquired for the tissue (DAPI, cyan; GFP MARCM clones, green; antibody staining, magenta). Data (B–C, G) are represented as mean ± SD. Statistics: ****p<0.0001, ***p<0.001, *p<0.05. See also Figure 6—figure supplements 1–2.
Figure 6—figure supplement 1
Overexpression of pro-neural TF in ph505-clones suppresses tumor phenotype.
Ectopic expression of pro-neural TF atonal in FRT19A neutral clones (A). Average tumor volume (µm3) (B), tissue volume (µm3) (C) and number of clones per tissue (D) for the ectopic expression of ato in a ph505 background. Number of tissues analyzed per condition (B–D): ph505 N = 50; ph505, UAS-ato N = 95. Eclosion rate of larvae carrying FRT19A, UAS-ato (E). Number of larvae analyzed: FRT19A N = 163; FRT19A, UAS-ato N = 87. Examples of eye adult structures of ectopic expression of ato in ph505 background (F). ELAV protein expression in FRT19A, UAS-ato tissues (G). Scale bar corresponds to 100 µm. All microscope images are a maximum intensity projection of all z-stacks acquired for the tissue (DAPI, cyan; GFP MARCM clones, green; antibody staining, magenta). Data (B–E) are represented as mean ± SD. Statistics: ****p<0.0001.
Figure 6—figure supplement 2
Overexpression of pro-neural TF in ph505-clones prevents cells from proliferating.
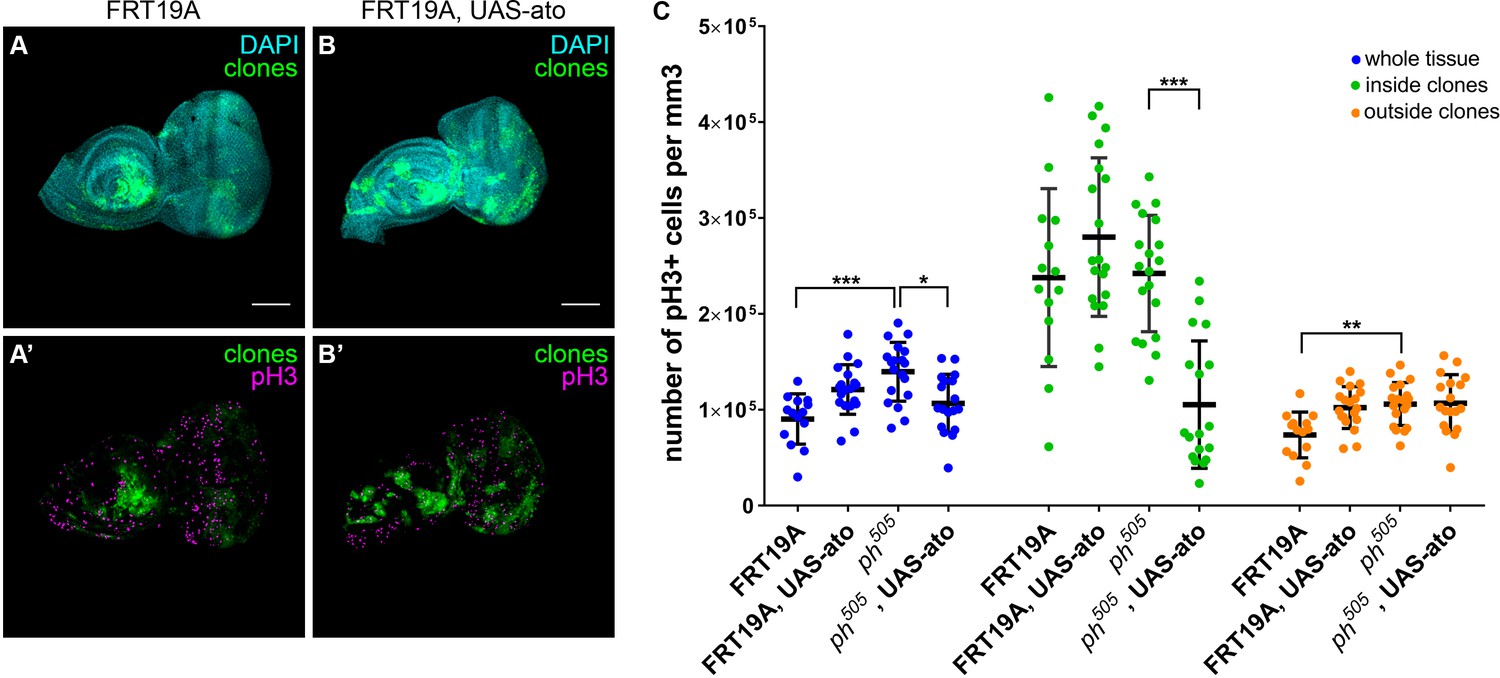
Proliferation levels (phospho-histone H3, pH3) upon overexpressing ato in control tissues (A–B). Quantitative analysis of pH3+ cell numbers in FRT19A; FRT19A, UAS-ato; ph505 and ph505, UAS-ato (C). These values were normalized to the respective volumes, such as ‘whole tissue’ data was normalized to the total tissue volume, ‘inside clones’ normalized to volume taken by GFP+ clones and ‘outside clones’ normalized to the volume of tissue that is GFP-. Number of tissues analyzed: FRT19A N = 14, FRT19A, UAS-ato N = 19; ph505 N = 19; ph505, UAS-ato N = 18. Scale bar corresponds to 100 µm. All microscope images are a maximum intensity projection of all z-stacks acquired for the tissue (DAPI, cyan; GFP MARCM clones, green; antibody staining, magenta). Data (C) are represented as mean ± SD. Statistics: ***p<0.001, **p<0.01, *p<0.05.
Author response image 1
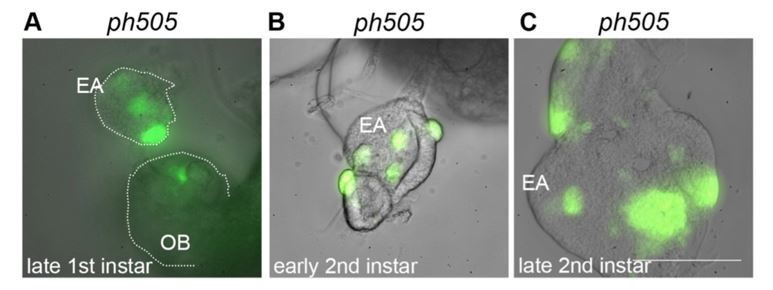
Eye-antennal imaginal discs from different developmental stages carrying ph505-clones (A-C).
Mutant cells are GFP labeled and present in late first instar EA discs (A). Pictures were taken with the same objective in a wide-field microscope (scale bar = 100μm). EA, eye-antennal imaginal disc. OB, optic lobe.
Author response image 2
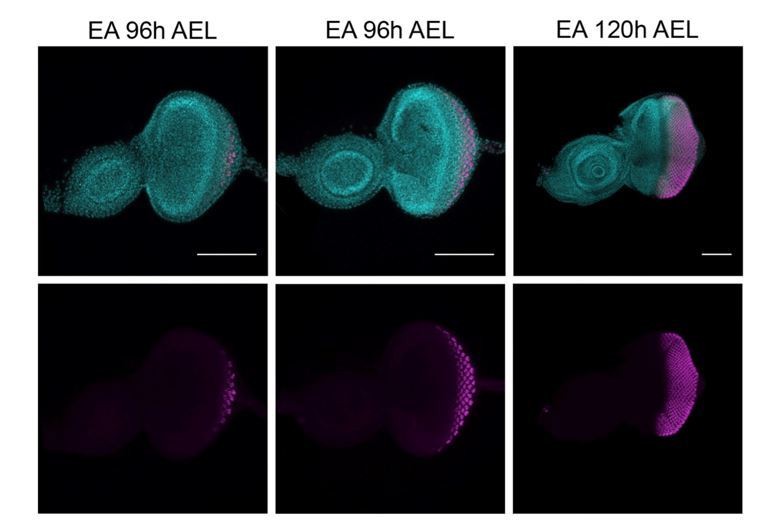
Expression of ELAV (magenta) in developing eye-antennal imaginal discs (EA), 96h and 120h after egg laying (AEL).
White arrows, morphogenetic furrow. DAPI, cyan; magenta, ELAV staining. Scale bar 100μm.
Author response image 3
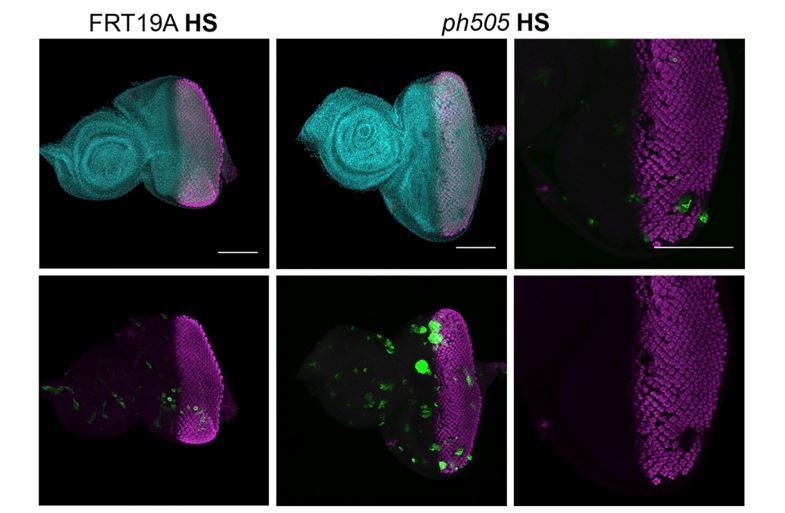
Expression of ELAV in mitotic clones generated 96h AEL.
Heat shock (HS) experiments were performed at 96h AEL (90min, 37ºC). Control experiments were done with FRT19A neutral clones (left side, GFP clones), where clones are very small at 6 days AEL, and with normal expression of ELAV. Mutant clones (GFP clones, central panel) were generated and some EA showed defects in ELAV patterning, as depicted in higher magnification in the panel on the right (white dashed arrow). Scale bar 100μm.
Author response image 4
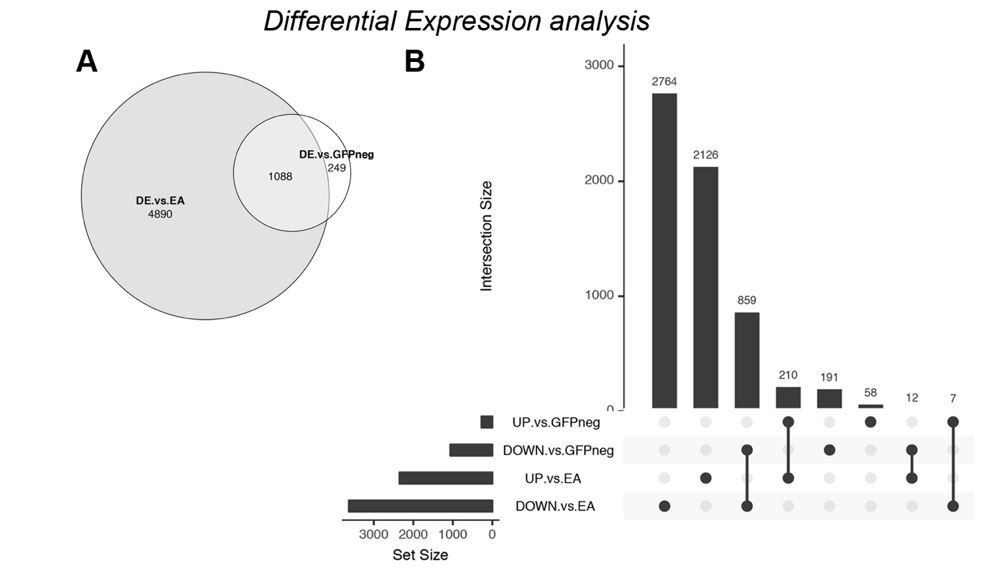
Differential Expression analysis – comparison of ph505-tumor cells (GFP+) with wildtype EA discs.
(A) Venn diagram showing the overlap (1088 DE genes) between the previous analysis (DE vs. GFP-) and the new analysis (DE vs. EA). (B) UpSet intersection diagram shows detail information about overlaps of down- and upregulated genes across two approaches of DE analysis. Some genes are exclusively found in some approaches (as 2764 genes are DOWN-reg in a GFP+ tumor vs. wt EA), while others are commonly found across analysis (as e.g. 859 DOWN- in both differential expression analysis). Common genes found across different approaches are depicted with connection line between the 2 fractions.
Author response image 5
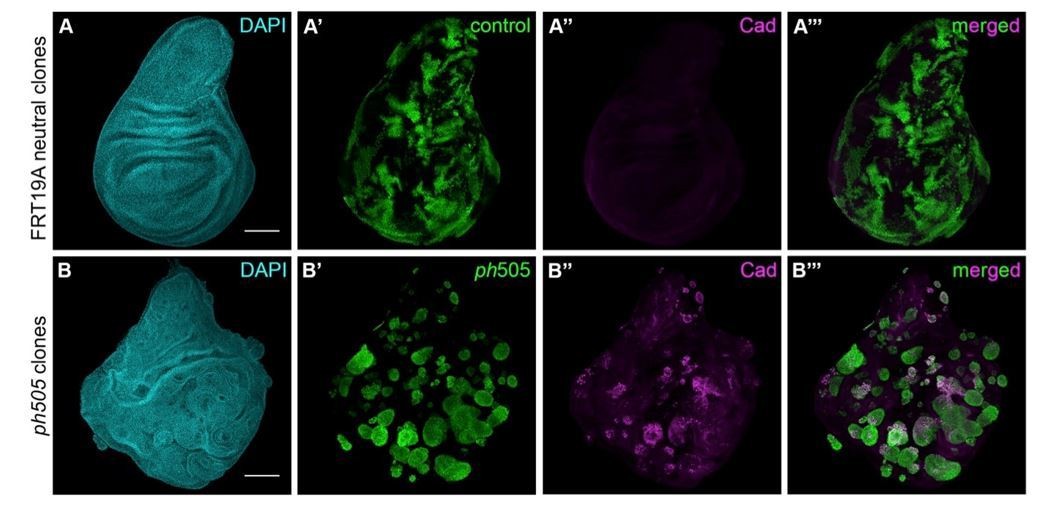
Generation of ph505 mutant clones in wing imaginal discs.
(A) Control clones generated with FRT19A blank and UbxFlp present notchy-shape (A’) and do not express Caudal (A’’). (B) ph505 clones generated in wing imaginal discs, similarly to what was observed in eye-antennal imaginal discs, have round shape (B’) and ectopically express the embryonic TF Caudal (Cad, B’’-B’’’). Scale bar 100μm.
Author response image 6
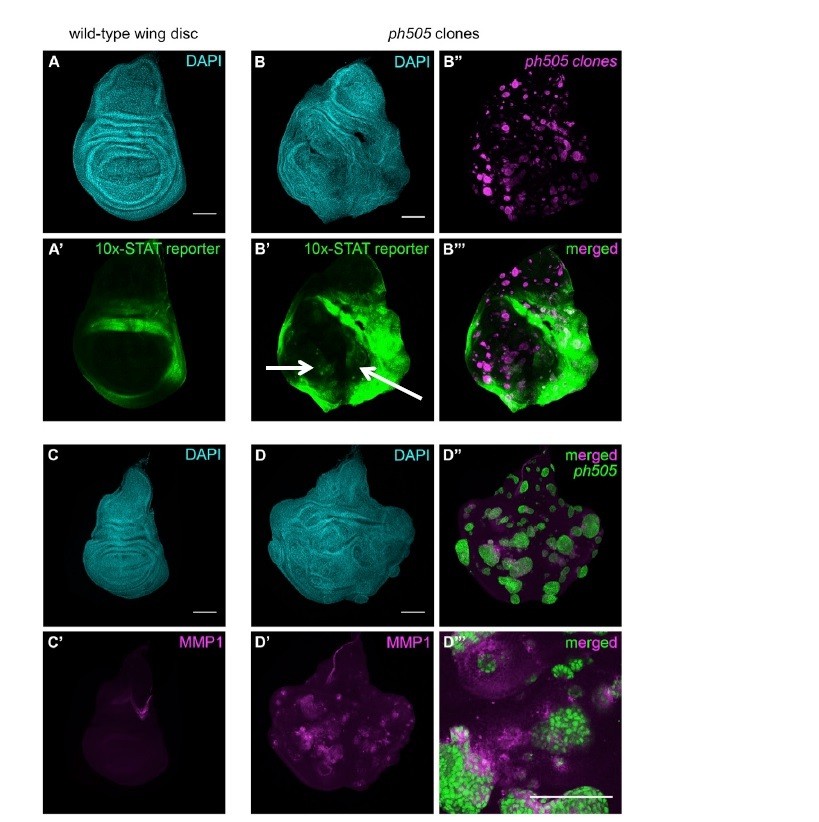
JAK/STAT and JNK (MMP1) pathway activation in ph505 clones in wing imaginal discs.
(A) Expression of the 10x-STAT reporter in wild-type wing imaginal disc. (B) ph505 clones generated in wing imaginal discs show ectopic expression of the reporter inside the pouch (B’-B’’’). (C) MMP1 expression in wild-type wing imaginal disc. Ectopic expression of MMP1, a target of JNK, in ph505 clones (D). Inset (D’’’) showing non-autonomous expression of MMP1, suggestive of a role for JNK in non-autonomous effect of these clones. Scale bar 100μm.
Author response image 7

Quantitative analysis of tissue volume occupied by ELAV+ cells.
Number of tissues used for quantification analysis (using Imaris): FRT19A N=12; ph505 N=19). Trend of increase in absolute volume of ELAV+ inside tissues carrying ph505-tumor clones is observed, in comparison with FRT19A (in blue). This trend is enhanced and significantly different when looking specifically at volumes outside of clones and thus GFP- (in purple). Blue bars – total volume of ELAV+ per tissue. Purple bars – fraction of ELAV+ that does not overlap with GFP, and thus fraction ‘outside of clones’. * = p<0.05.
Tables
Key resources table
| Reagent type (species) or resource | Designation | Source or reference | Identifiers | Additional information |
|---|---|---|---|---|
| genetic reagent (D. melanogaster) | OregonR (host flies) | Bloomington Drosophila Stock Center | BL25211 | |
| genetic reagent (D. melanogaster) | w[1118] (host flies) | Bloomington Drosophila Stock Center | BL5905 | |
| genetic reagent (D. melanogaster) | yw, FRT19A | Bloomington Drosophila Stock Center | BL1744 | |
| genetic reagent (D. melanogaster) | FRT19A, ph505/FM7 act-GFP | A.-M. Martinez | ph505 | |
| genetic reagent (D. melanogaster) | w, tubGal80, FRT19A; eyFlp5, Act5C > y +> Gal4, UAS-GFP.S56T | T. Xu | 19A Tester | |
| genetic reagent (D. melanogaster) | P{w[+mC]=tubP-GAL80}LL1, w* P{ry[+t7.2]=ey FLP.N}2P{ry[+t7.2]=neoFRT}19A | Bloomington Drosophila Stock Center | BL42717 | |
| genetic reagent (D. melanogaster) | w[1118]; P{w[+mC]=GAL4-Act5C(FRT.CD2).P}S, P{w[+mC]=UAS RFP.W}3/TM3 | Bloomington Drosophila Stock Center | BL30558 | |
| genetic reagent (D. melanogaster) | w; UAS-dome∆CYT | J. Hombría | dome∆CYT | |
| genetic reagent (D. melanogaster) | UAS-ph L7 (#3) | F. Maschat | UAS-ph | |
| genetic reagent (D. melanogaster) | w; UAS-p35 | S. Kurata | UAS-p35 | |
| genetic reagent (D. melanogaster) | UAS-Kni/Cyo | M. Affolter | UAS-Kni | |
| genetic reagent (D. melanogaster) | UAS-ato (#2) | G. Mardon | UAS-ato | |
| genetic reagent (D. melanogaster) | w1118;; P{NRE-EGFP.S}1 | Bloomington Drosophila Stock Center | BL30728 (Notch reporter, NRE-GFP on #3) | |
| genetic reagent (D. melanogaster) | w;;TRE-DsRed | Chatterjee & Bohmann 2012 | JNK reporter | |
| genetic reagent (D. melanogaster) | w[1118]; P{w[+mC]=10XStat92E-GFP}2 | Bloomington Drosophila Stock Center | BL26198 (JAK/STAT reporter) | |
| genetic reagent (D. melanogaster) | RNAi of Kni: y(Abate-Shen, 2002) sc[*] v(Abate-Shen, 2002); P{y[+t7.7] v[+t1.8]=TRiP.HMS01184}attP2 | Bloomington Drosophila Stock Center | Trip BL34705 (kni-KD) | |
| genetic reagent (D. melanogaster) | RNAi of Kni: y(Abate-Shen, 2002) v(Abate-Shen, 2002); P{y[+t7.7] v[+t1.8]=TRiP.JF02544}attP2 | Bloomington Drosophila Stock Center | Trip BL27259 (kni-KD (2)) | |
| genetic reagent (D. melanogaster) | RNAi of Abd-A: y(Abate-Shen, 2002) v(Abate-Shen, 2002); P{y[+t7.7] v[+t1.8]=TRiP.JF03167}attP2 | Bloomington Drosophila Stock Center | Trip BL28739 (Abd-A-KD) | |
| genetic reagent (D. melanogaster) | RNAi of lms: y(Abate-Shen, 2002) sc[*] v(Abate-Shen, 2002); P{y[+t7.7] v[+t1.8]=TRiP.HMS02709}attP2/TM3, Sb(Abate-Shen, 2002) | Bloomington Drosophila Stock Center | Trip BL43995 (lms-KD) | |
| genetic reagent (D. melanogaster) | RNAi of gsc: y(Abate-Shen, 2002) sc[*] v(Abate-Shen, 2002); P{y[+t7.7] v[+t1.8]=TRiP.HMC02397}attP2 | Bloomington Drosophila Stock Center | Trip BL50894 (gsc-KD) | |
| genetic reagent (D. melanogaster) | RNAi of cad: y(Abate-Shen, 2002) sc[*] v(Abate-Shen, 2002); P{y[+t7.7] v[+t1.8]=TRiP.HMC04863}attP40 | Bloomington Drosophila Stock Center | Trip BL57546 (cad-KD) | |
| genetic reagent (D. melanogaster) | RNAi of bgcn: y(Abate-Shen, 2002) sc[*] v(Abate-Shen, 2002); P{y[+t7.7] v[+t1.8]=TRiP .GL00596}attP40 | Bloomington Drosophila Stock Center | Trip BL36636 (bgcn-KD) | |
| genetic reagent (D. melanogaster) | RNAi of Sox100b: y(Abate-Shen, 2002) sc[*] v(Abate-Shen, 2002); P{y[+t7.7] v[+t1.8]=TRiP.GLV21021}attP2 | Bloomington Drosophila Stock Center | Trip BL35656 (Sox100b-KD) | |
| genetic reagent (D. melanogaster) | RNAi of btd: y(Abate-Shen, 2002) v(Abate-Shen, 2002); P{y[+t7.7] v[+t1.8]=TRiP.JF03389}attP2 | Bloomington Drosophila Stock Center | Trip BL29453 (btd-KD) | |
| genetic reagent (D. melanogaster) | RNAi of eve: y(Abate-Shen, 2002) v(Abate-Shen, 2002); P{y[+t7.7] v[+t1.8]=TRiP.JF03161}attP2 | Bloomington Drosophila Stock Center | Trip BL28734 (eve-KD) | |
| genetic reagent (D. melanogaster) | RNAi of tin: y(Abate-Shen, 2002) v(Abate-Shen, 2002); P{y[+t7.7] v[+t1.8]=TRiP.HMC03064}attP2 | Bloomington Drosophila Stock Center | Trip BL50663 (tin-KD) | |
| genetic reagent (D. melanogaster) | RNAi of Dr: y(Abate-Shen, 2002) v(Abate-Shen, 2002); P{y[+t7.7] v[+t1.8]=TRiP.HMC03402}attP2 | Bloomington Drosophila Stock Center | Trip BL51830 (Dr-KD) | |
| genetic reagent (D. melanogaster) | RNAi of nub: y(Abate-Shen, 2002) v(Abate-Shen, 2002); P{y[+t7.7] v[+t1.8]=TRiP.HMC03992}attP2 | Bloomington Drosophila Stock Center | Trip BL55305 (nub-KD) | |
| genetic reagent (D. melanogaster) | RNAi of fkh: y(Abate-Shen, 2002) sc[*] v(Abate-Shen, 2002); P{y[+t7.7] v[+t1.8]=TRiP.HMS01103}attP2 | Bloomington Drosophila Stock Center | Trip BL33760 (fkh-KD) | |
| genetic reagent (D. melanogaster) | RNAi of Abd-B: y(Abate-Shen, 2002) v(Abate-Shen, 2002); P{y[+t7.7] v[+t1.8]=TRiP.JF02309}attP2 | Bloomington Drosophila Stock Center | Trip BL26746 (Abd-B-KD) | |
| genetic reagent (D. melanogaster) | RNAi of pb: y(Abate-Shen, 2002) v(Abate-Shen, 2002); P{y[+t7.7] v[+t1.8]=TRiP.HMC03065}attP2 | Bloomington Drosophila Stock Center | Trip BL50664 (pb-KD) | |
| genetic reagent (D. melanogaster) | RNAi of grn: y(Abate-Shen, 2002) sc[*] v(Abate-Shen, 2002); P{y[+t7.7] v[+t1.8]=TRiP.HMS01085}attP2 | Bloomington Drosophila Stock Center | Trip BL33746 (grn-KD) | |
| genetic reagent (D. melanogaster) | RNAi of odd: y(Abate-Shen, 2002) sc[*] v(Abate-Shen, 2002); P{y[+t7.7] v[+t1.8]=TRiP.HMS01315}attP2/TM3, Sb(Abate-Shen, 2002) | Bloomington Drosophila Stock Center | Trip BL34328 (odd-KD) | |
| genetic reagent (D. melanogaster) | RNAi of croc: y(Abate-Shen, 2002) sc[*] v(Abate-Shen, 2002); P{y[+t7.7] v[+t1.8]=TRiP.HMS01122}attP2 | Bloomington Drosophila Stock Center | Trip BL34647 (croc-KD) | |
| genetic reagent (D. melanogaster) | RNAi of drm: y(Abate-Shen, 2002) v(Abate-Shen, 2002); P{y[+t7.7] v[+t1.8]=TRiP.HMJ02120}attP40 | Bloomington Drosophila Stock Center | Trip BL42548 (drm-KD) | |
| genetic reagent (D. melanogaster) | RNAi of Doc2: y(Abate-Shen, 2002) sc[*] v(Abate-Shen, 2002); P{y[+t7.7] v[+t1.8]=TRiP.HMS02804}attP2 | Bloomington Drosophila Stock Center | Trip BL44087 (Doc2-KD) | |
| genetic reagent (D. melanogaster) | RNAi of Doc3: y(Abate-Shen, 2002) v(Abate-Shen, 2002); P{y[+t7.7] v[+t1.8]=TRiP.JF02223}attP2 | Bloomington Drosophila Stock Center | Trip BL31932 (Doc3-KD) | |
| genetic reagent (D. melanogaster) | RNAi of vvl: y(Abate-Shen, 2002) v(Abate-Shen, 2002); P{y[+t7.7] v[+t1.8]=TRiP.JF02126}attP2 | Bloomington Drosophila Stock Center | Trip BL26228 (vvl-KD) | |
| genetic reagent (D. melanogaster) | RNAi of Doc1: y(Abate-Shen, 2002) v(Abate-Shen, 2002); P{y[+t7.7] v[+t1.8]=TRiP.JF02222}attP2 | Bloomington Drosophila Stock Center | Trip BL31931 (Doc1-KD) | |
| genetic reagent (D. melanogaster) | RNAi of Kr: y(Abate-Shen, 2002) v(Abate-Shen, 2002); P{y[+t7.7] v[+t1.8]=TRiP.JF02745}attP2 | Bloomington Drosophila Stock Center | Trip BL27666 (Kr-KD) | |
| antibody | Ph (rabbit) | R. Paro Lab | N/A | (1:100) |
| antibody | Arm (mouse) | DSHB | N27A1 | (1:5) |
| antibody | MMP1 (mouse) | DSHB | 5H7B11 | (1:300) |
| antibody | ELAV (rat) | DSHB | 7E8A10 | (1:30) |
| antibody | Eya (mouse) | DSHB | eya10H6 | (1:500) |
| antibody | Hth (goat) | H. Sun | dG20, Santa Cruz | (1:100) |
| antibody | Eve (mouse) | DSHB | Eve 3C10 | (1:100) |
| antibody | Cad (rabbit) | P. Macdonald Lab | #1 | (1:500) |
| antibody | Abd-B (mouse) | DSHB | N/A | (1:10) |
| antibody | Dcp-1 (rabbit) | Cell Signaling | 9578S | (1:200) |
| antibody | Phalloidin Alexa 633 | Life Technologies | A22284 | (1:400) |
| antibody | phospho-Histone H3, Ser 10 (pH3, rabbit) | Millipore | 06–570 | (1:200) |
| antibody | Alexa 568- or 594 secondaries | Life Technologies | A-11036, A11031, A-11077, A-11058 | (1:500) |
| commercial assay or kit | PicoPure RNA Isolation Kit | Thermo Fisher | KIT0204 | |
| commercial assay or kit | RNase-Free DNase Set | Qiagen | #79254 | |
| commercial assay or kit | Quant-iT RiboGreen RNA Assay Kit | Thermo Fisher | R11490 | |
| chemical compound, drug | Collagenase | Sigma | C1639 | |
| software, algorithm | iRegulon | Janky et al. (2014) | http://iregulon.aertslab.org | |
| software, algorithm | Trimmomatic | Bolger et al. (2014) | http://www.usadellab.org/cms/?page=trimmomatic | |
| software, algorithm | FastQC | FastQC A Quality Control tool for High Throughput Sequence Data (v0.11.2) | www.bioinformatics.babraham.ac.uk/projects/fastqc/ | |
| software, algorithm | STAR | Dobin et al. (2013) | https://github.com/alexdobin/STAR | |
| software, algorithm | Picard Tools | Picard tools (version 1.121) | www.broadinstitute.github.io/picard/ | |
| software, algorithm | HTSeq | Anders et al. (2015) | http://www-huber.embl.de/HTSeq/doc/overview.html# | |
| software, algorithm | DESeq2 | Love et al. (2014) | https://bioconductor.org/packages/release/bioc/html/DESeq2.html | |
| software, algorithm | WEB-based GEne SeT AnaLysis Toolkit | Wang et al., 2013 | WebGestalt: www.webgestalt.org | |
| software, algorithm | Ilastik | Sommer, 2011 | http://ilastik.org | |
| software, algorithm | Matlab | MATLAB 2016b, The MathWorks Inc., Natick, MA | https://ch.mathworks.com/products/matlab.html | |
| software, algorithm | Imaris | Imaris v 8.4.1 (Build 41809 for x64), Bitplane AG | http://www.bitplane.com/imaris/imaris | |
| software, algorithm | GraphPad Prism 7.0 | GraphPad Prism version 7.00 for Windows, GraphPad Software, La Jolla California USA | https://www.graphpad.com/scientific-software/prism/ |
Additional files
-
Transparent reporting form
- https://doi.org/10.7554/eLife.32697.024
Download links
A two-part list of links to download the article, or parts of the article, in various formats.
Downloads (link to download the article as PDF)
Open citations (links to open the citations from this article in various online reference manager services)
Cite this article (links to download the citations from this article in formats compatible with various reference manager tools)
A switch in transcription and cell fate governs the onset of an epigenetically-deregulated tumor in Drosophila
eLife 7:e32697.
https://doi.org/10.7554/eLife.32697


