RNA-dependent RNA targeting by CRISPR-Cas9
- University of California, United States
- Biotechnology and Bioengineering Department, United States
- Howard Hughes Medical Institute, United States
- Lawrence Berkeley National Laboratory, United States
Figures
Figure 1 with 4 supplements
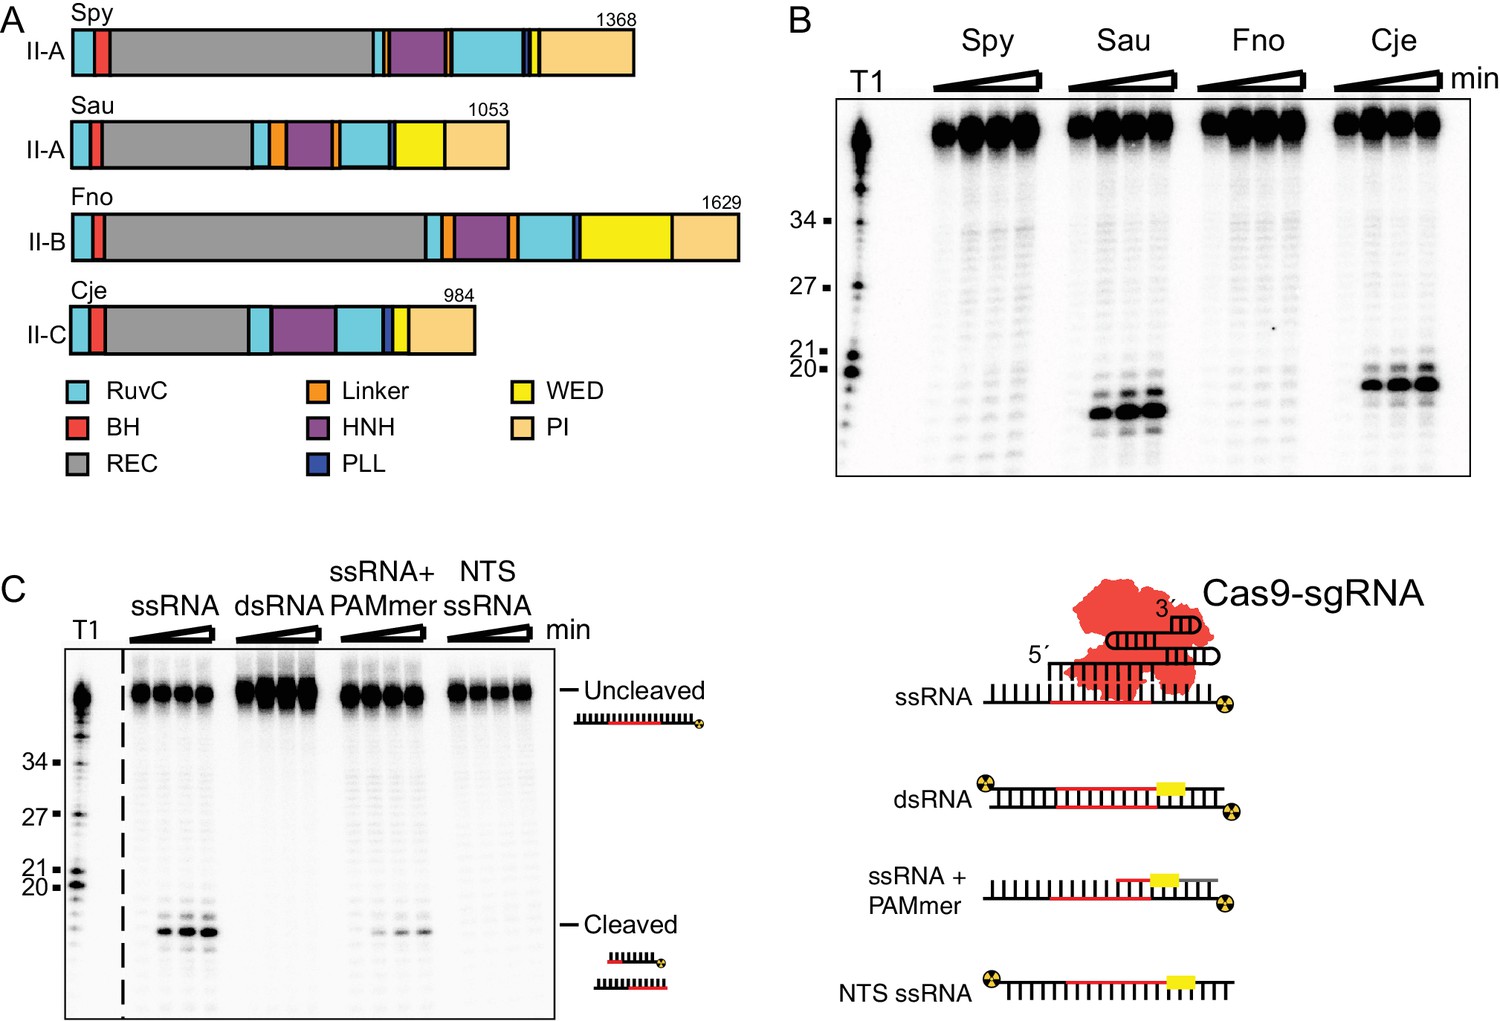
SauCas9 cleaves single-stranded RNA without a PAMmer.
(A) Schematic of Cas9 proteins tested for sgRNA-mediated RNA cleavage. RuvC, RuvC nuclease domain; BH, bridge-helix; REC, recognition domain; HNH, HNH nuclease domain; PLL, phosphate-lock loop; WED, wedge domain; PI, PAM-interacting domain. Adapted from (Nishimasu et al., 2014; 2015; Hirano et al., 2016; Yamada et al., 2017). (B) Representative in vitro cleavage of ssRNA by Cas9-sgRNA RNP complexes of homologs in (A). Radiolabeled pUC target RNA was incubated with Cas9 RNP at 37˚C and time points were taken at 0, 10, 30, and 60 min. Full time course is presented in Figure 1—figure supplement 1B. T1 indicates size markers generated by RNase T1 digestion of ssRNA target. Size in nucleotides is indicated on the left. (C) (Right) In vitro cleavage assay of various RNA substrates (Left). Full time course is presented in Figure 1—figure supplement 3A.
Figure 1—figure supplement 1
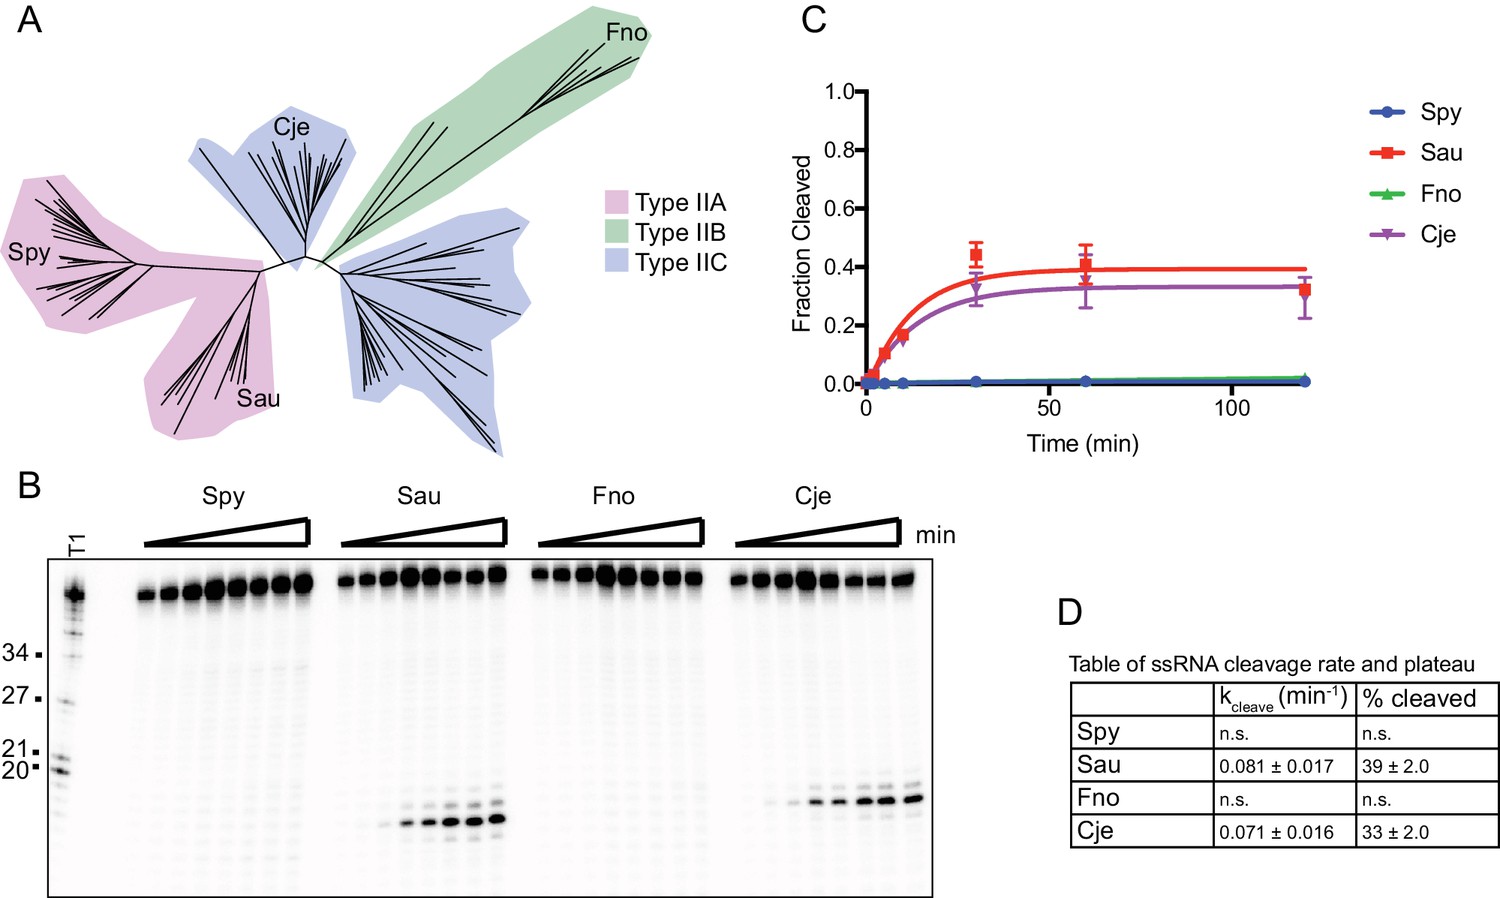
RNA is cleaved by SauCas9 and CjeCas9.
(A) Phylogenetic tree of Cas9 homologs assayed for ssRNA cleavage activity. Tree was generated using homologs gathered from (Chylinski et al., 2014). Only homologs tested for activity are highlighted as leaves on the tree. Clades are colored by Cas9 sub-type. (B) Representative in vitro cleavage gel for ssRNA targeting by various Cas9 homologs in (A). Target used for cleavage was the pUC ssRNA. Time points are 0, 1, 2, 5, 10, 30, 60, and 120 min. T1 RNase digest size fragments are given on the left. (C) Quantification of fraction cleaved in (B). Fit was determined in Prism using a single-exponential decay model. Error bars represent the mean ± S.D. (n = 3). (D) Apparent pseudo-first order fit parameters of the data in (C) where ‘% cleaved’ indicates the fraction of substrate cleaved when the reaction plateaus (mean ± S.D.).
-
Figure 1—figure supplement 1—source data 1
ssRNA cleavage time course for Cas9 homologs.
- https://doi.org/10.7554/eLife.32724.005
Figure 1—figure supplement 2

ssRNA cleavage is similar to canonical dsDNA cleavage by Cas9.
(A) In vitro SauCas9 cleavage assay of ssRNA. Reactions were incubated with wild-type (Wt SauCas9) or catalytically-inactive dSauCas9 (D10A and N580A) in the presence or absence of sgRNA as indicated above the reactions. EDTA was included at 25 mM where applicable. (B) SauCas9 ssRNA cleavage is single-turnover. SauCas9 RNP was incubated with the RNA target in the various ratios indicated. (A and B) Time points are 0, 1, 2, 5, 10, 30, 60, and 120 min. T1 RNase digest size fragments are given on the left. Target used for cleavage was the pUC ssRNA. (C) Graphical representation of ssRNA fraction cleaved of reactions in (B). Fit was determined in Prism using a single-exponential decay model. Error bars represent the mean ± S.D. (n = 3). (D) Mapping of SauCas9 ssRNA cleavage site. Reaction products from a 2 hr incubation of SauCas9 RNP with the pUC ssRNA target were separated on a 15% denaturing PAGE gel with a hydrolysis and T1 digest ladder to determine exact site of the major cleavage product. (E) Diagram of canonical DNA cleavage position and ssRNA cleavage position as determined in (D).
-
Figure 1—figure supplement 2—source data 1
Quantification of multi-turnover cleavage.
- https://doi.org/10.7554/eLife.32724.007
Figure 1—figure supplement 3
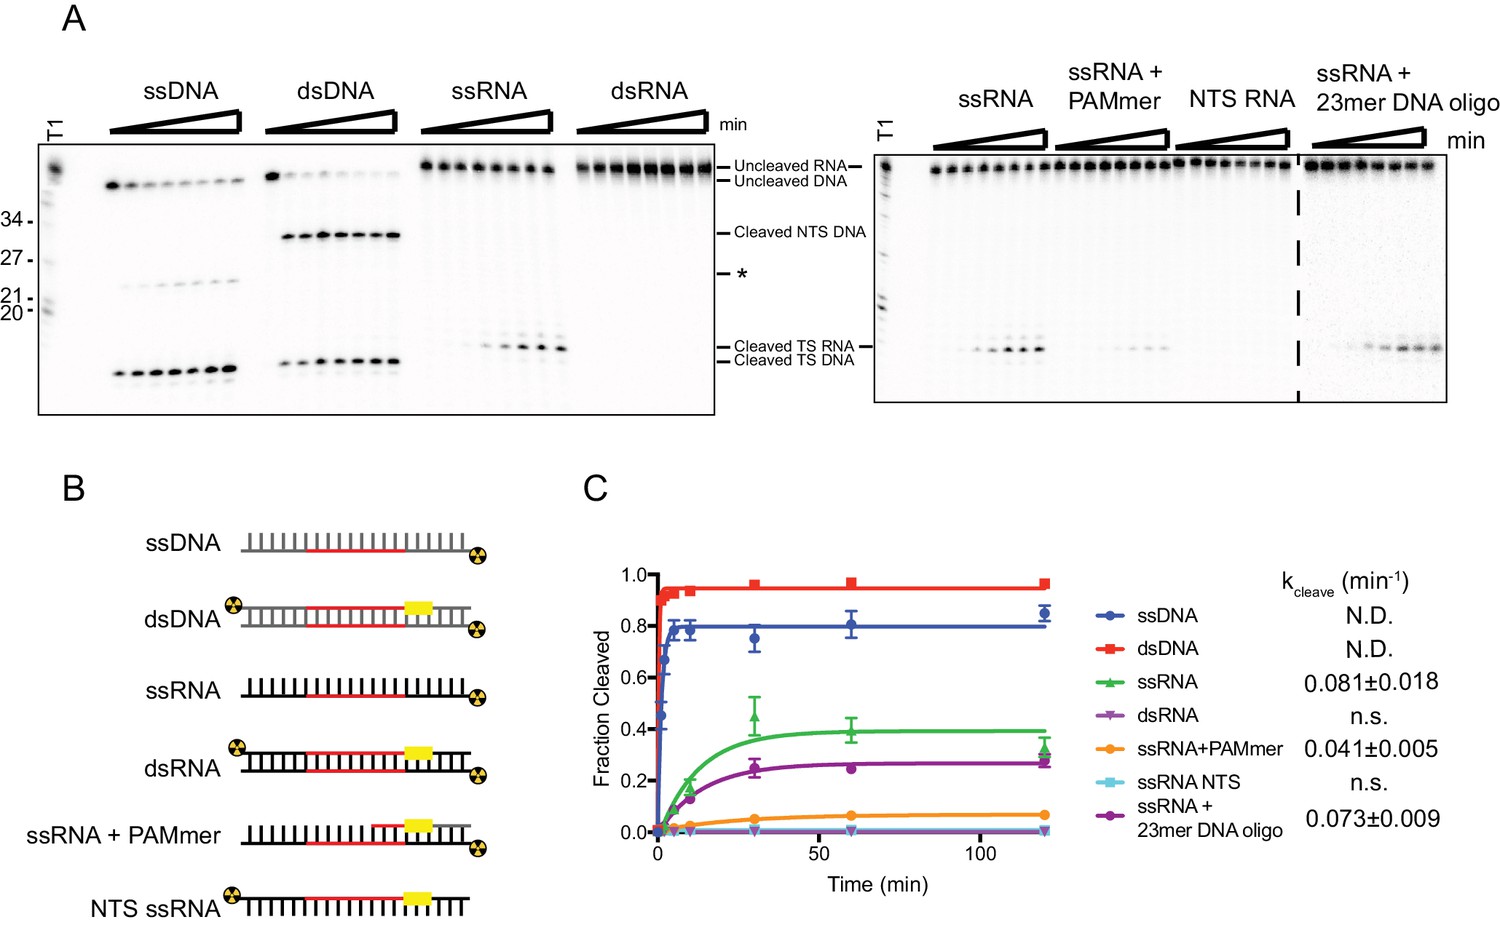
SauCas9 cleavage of different nucleic acid substrates.
(A) Representative cleavage assay of nucleic acid substrates diagramed in (B) by SauCas9. Asterisk denotes an off-target cleavage site. Time points are 0, 1, 2, 5, 10, 30, 60, and 120 min. T1 RNase digest size fragments are given on the left. (C) Quantification of results in (A). Fit was determined in Prism using a single-exponential decay model. Error bars represent the mean ± S.D. (n = 3). Apparent pseudo-first order rate constant (kcleave ± S.D.) is given to the right of the substrate legend. N.D. indicates that an accurate rate cannot be determined due to the reaction reaching completion before the second time point. N.s., not significant.
-
Figure 1—figure supplement 3—source data 1
Quantification of SauCas9 cleavage of nucleic acid substrates.
- https://doi.org/10.7554/eLife.32724.009
Figure 1—figure supplement 4

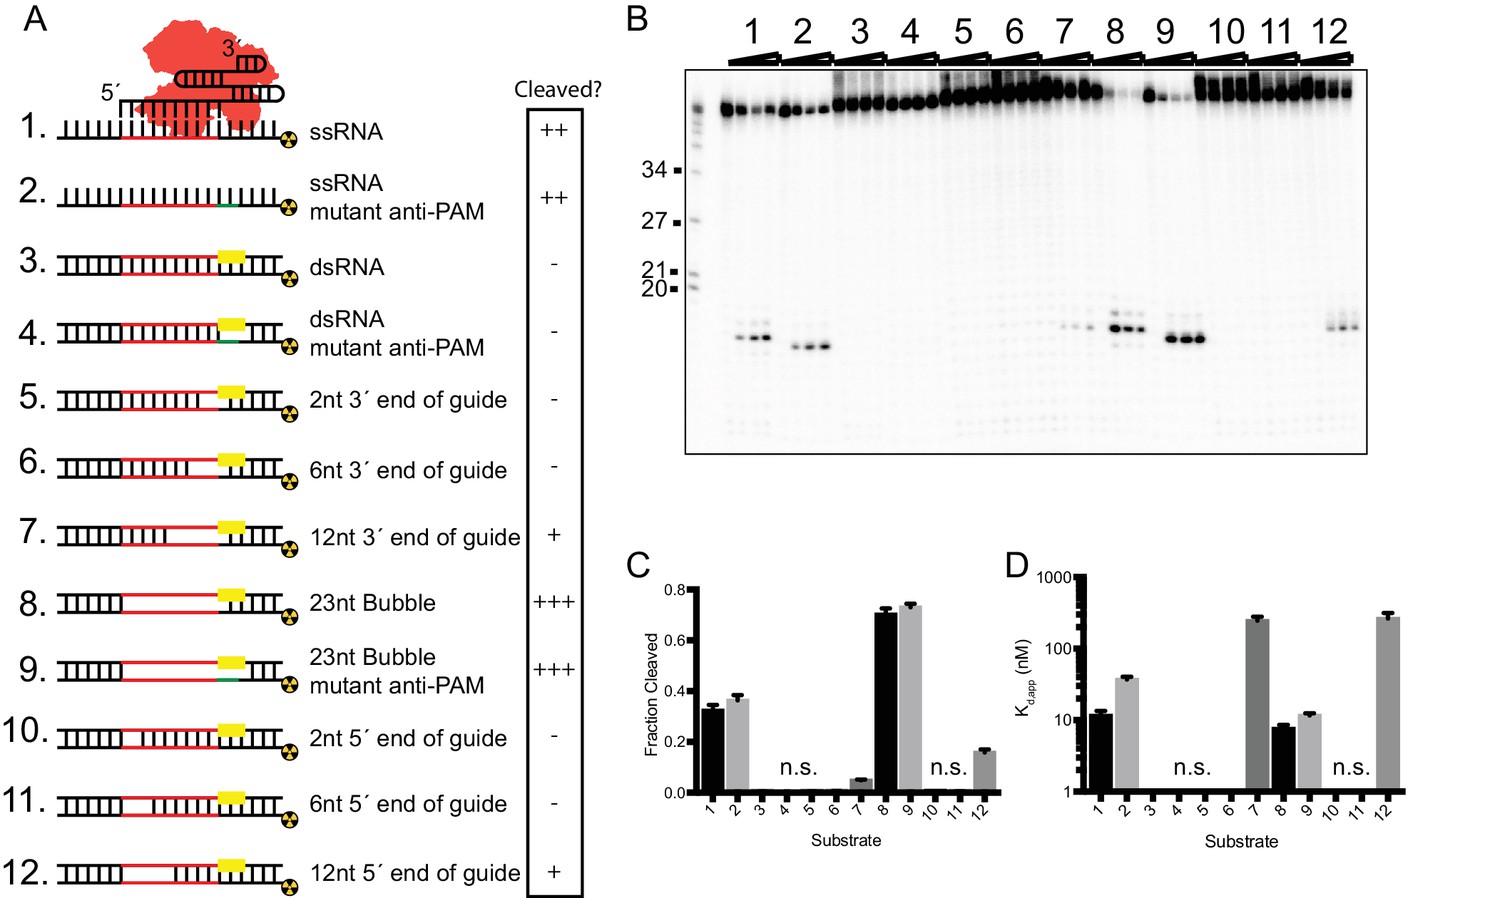
SauCas9 prefers a complementary region of 23nt for binding and cleavage.
(A) Diagram of pUC ssRNA target and regions of complementary for the different length sgRNAs. (B) Representative in vitro cleavage assays using sgRNAs with a complementary region to the target of the indicated lengths. Time points are 0, 1, 2, 5, 10, 30, 60, and 120 min. T1 RNase digest size fragments are given on the left. (C) Quantification of cleavage products from reactions in (B). Length of targeting region of the sgRNA given as n-mer. Fit was determined in Prism using a single-exponential decay model. Error bars represent the mean ± S.D. (n = 3). (D) Filter binding data for dSauCas9 and the structured RNA substrates were fit in Prism using a one-site binding model and the apparent dissociation constant (Kd,app) was determined. Bars represent the mean ± S.D. (n = 3).
-
Figure 1—figure supplement 4—source data 1
Cleavage and binding data for different length guides.
- https://doi.org/10.7554/eLife.32724.011
Figure 2 with 1 supplement
In vitro RNA cleavage is impaired by strong secondary structure.
(A) Schematic representation of structured RNA targets for in vitro cleavage assays. Symbols on right indicate relative level of cleavage activity for each substrate: ‘-”, no cleavage; ‘+”, low cleavage; ‘++”, medium cleavage; ‘+++” high cleavage. (B) Representative cleavage assay of partially-duplexed RNA targets diagrammed in (A). T1 indicates size markers generated by RNase T1 digestion of ssRNA target. Size in nucleotides is indicated on the left. (C and D) Fraction of target cleaved (C) and Kd,app (D) for substrates diagrammed in (A). Fits were determined in Prism using a single-exponential decay and a one-site binding model, respectively. Bars represent mean ± S.D. (n = 3). N.s. denotes no significant cleavage or binding.
-
Figure 2—source data 1
Quantification of cleavage and binding of structured RNA substrates by SauCas9.
- https://doi.org/10.7554/eLife.32724.015
Figure 2—figure supplement 1
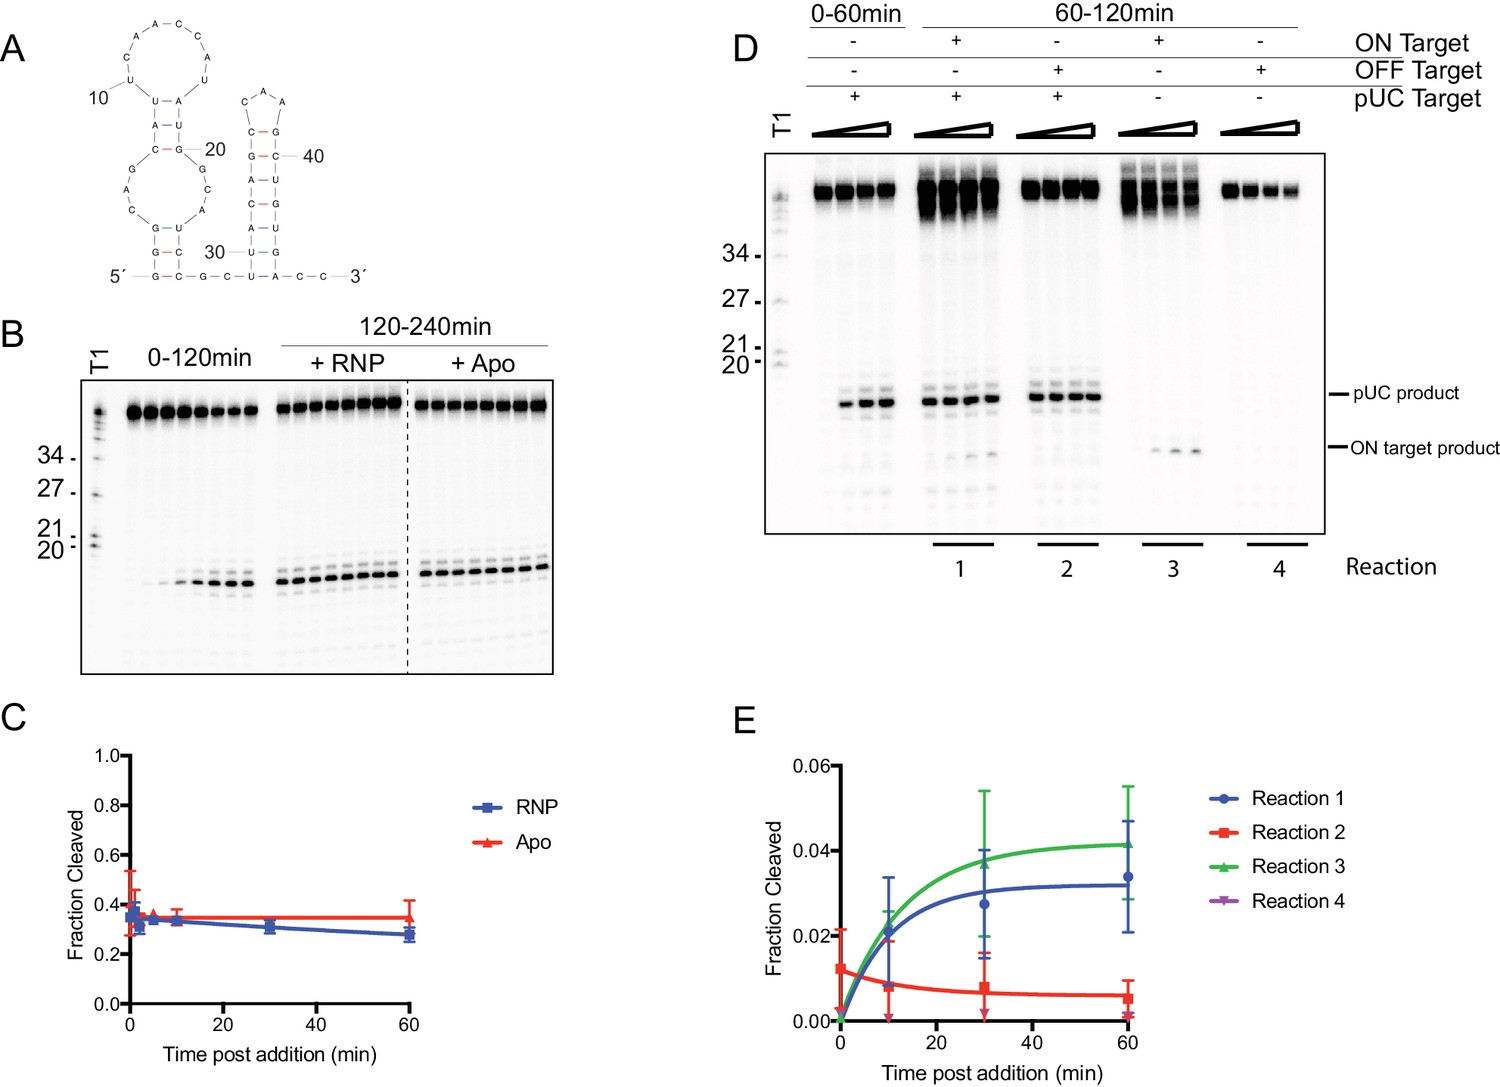
RNA cleavage is limited by the RNA target.
(A) Predicted secondary structure of target RNA used in this study. (B) In vitro cleavage assay of ssRNA with SauCas9 was conducted for 2 hr (time points: 0, 1, 2, 5, 10, 30, 60, 120 min). The reaction was split and SauCas9-sgRNA RNP or apo SauCas9 were added. The reaction was further incubated at 37˚C and additional time points at were taken to check for additional cleavage of the target. Time points were taken at 0, 1, 2, 5, 10, 30, 60, and 120 min post-RNP/apo SauCas9 addition. (C) Fit for data in (B) was determined in Prism using a single-exponential decay model. Error bars represent the mean ± S.D. (n = 3). (D) In vitro cleavage assay of two ssRNA targets added sequentially. After 60 min incubation of SauCas9 with the pUC target, another target containing either the same recognition sequence (ON target – reaction 1) or an unrelated sequence (OFF target – reaction 2) were added to the reaction. Cleavage was assayed for an additional 60 min (time points: 0, 10, 30, 60 min). Reactions containing only the second target (Reactions 3 and 4) were conducted with SauCas9 RNP that was incubated for 60 min at 37˚C prior to addition to the cleavage reaction. (E) Quantification of cleavage of second target in (D) for time points after addition. Fit was determined in Prism using a single-exponential decay model. Error bars represent the mean ± S.D. (n = 3).
-
Figure 2—figure supplement 1—source data 1
Quantification of ssRNA after additional protein and target spike-in.
- https://doi.org/10.7554/eLife.32724.014
Figure 3 with 4 supplements
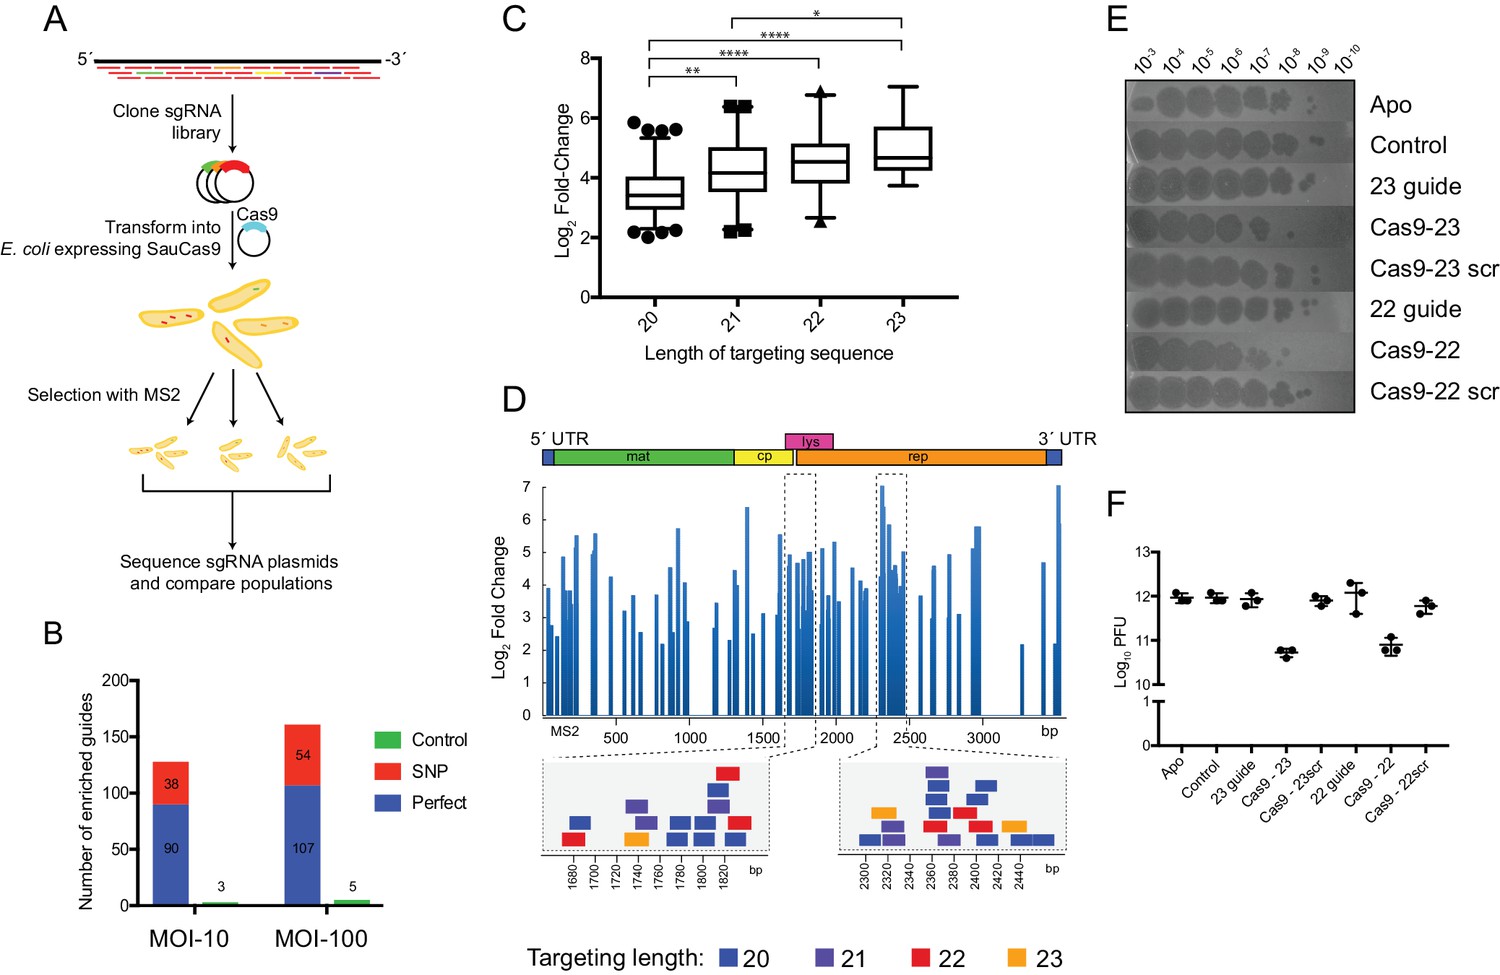
SauCas9 confers in vivo protection against an RNA phage.
(A) Overview of MS2 targeting screen. Guides tiled against the library were cloned into sgRNA expression plasmids and co-transformed into E. coli with a plasmid containing wild-type SauCas9 under inducible control. Plasmids from surviving colonies after MS2 selection were recovered and sequenced. For more detail, see Materials and methods. (B) Number of guides with significant positive enrichment from three biological experiments. SNP, guides with single-nucleotide mismatch. (C) Box and whiskers plot of average log2 fold-change of perfect MS2 guides by length. Whiskers represent 5% and 95% values with outliers graphed as points. *p<0.05, **p<0.01, ****p<0.0001, by one-way ANOVA. (D) (Upper) Log2 fold-change of guides with an FDR-corrected p-value<0.05 mapped to the MS2 genome for MOI-100 treatment. Schematic of MS2 genome is provided above. (Lower) Individual guides mapped to highlighted regions of MS2 genome. Other graphs for MOI-10 and −100 treatments are presented in Figure 3—figure supplement 1. (E) Representative plaque assay of SauCas9 in vivo protection. E. coli containing constructs on the right are spotted with various phage dilutions as indicated. Scr signifies that the targeting portion of the guide has been scrambled to serve as a non-targeting control. (F) Relative plaque forming units (PFU) (mean ± S.D., n = 3) from results in (E). More guides and controls are presented in Figure 3—figure supplement 3.
-
Figure 3—source data 1
List of guides, normalized read counts, enriched guides, fold change distribution and plaque enumeration.
- https://doi.org/10.7554/eLife.32724.025
Figure 3—figure supplement 1
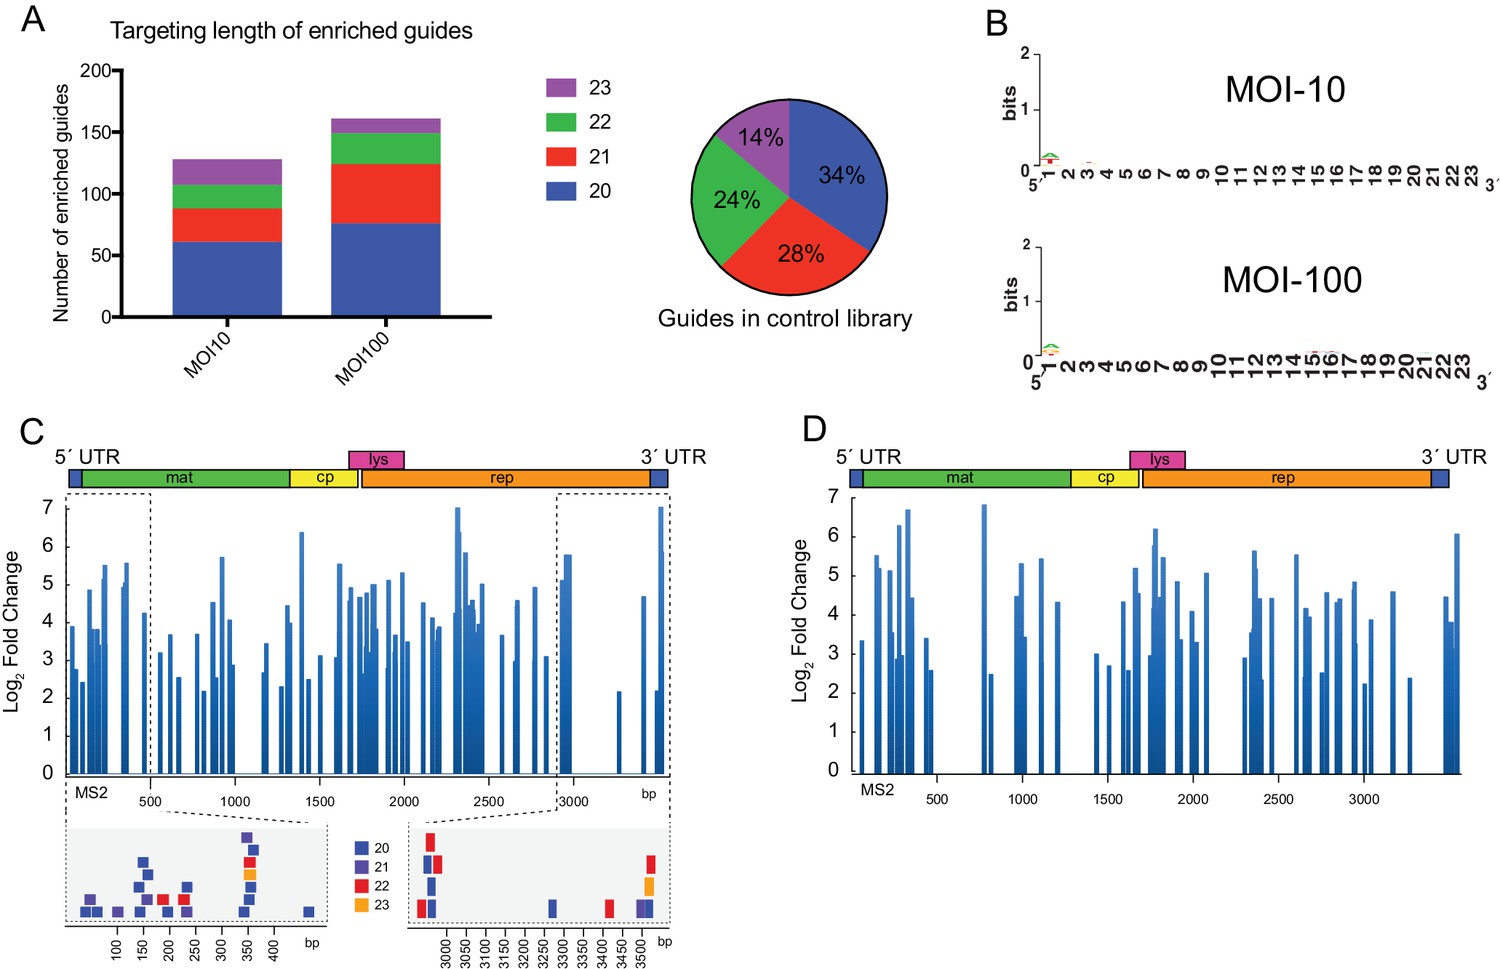
Enriched guides do not display sequence bias and cluster to regions on the MS2 genome.
(A) (Left) Stacked bar graph of positively enriched guides (FDR-adjusted p-value<0.05) for perfectly complementary and single-nucleotide mismatch (SNP) guides for a multiplicities of infection (MOI) of 10 and 100. (Right) Percentages of perfect and SNP guides by length averaged across the control libraries (n = 3). (B) WebLogo (Crooks et al., 2004) representation of positively enriched guides (perfect complementarity, FDR-adjusted p-value<0.05) for MOI-10 (n = 84) and MOI-100 (n = 107). Different length guides were aligned at their 3´ end, which contains the pre-ordered ‘seed’ region (Jiang et al., 2015). (C) (Upper) Log2 fold-change of positively enriched guides (FDR-adjusted p-value<0.05) mapped to the MS2 genome for MOI-100 treatment. Schematic of MS2 genome is provided above. (Lower) Individual guides mapped to highlighted regions of MS2 genome. (D) Log2 fold-change of guides with an FDR-adjusted p-value<0.05 mapped to the MS2 genome for MOI-10 treatment.
-
Figure 3—figure supplement 1—source data 1
Enriched guide length distribution, sequences, and targeting location on MS2 genome.
- https://doi.org/10.7554/eLife.32724.018
Figure 3—figure supplement 2
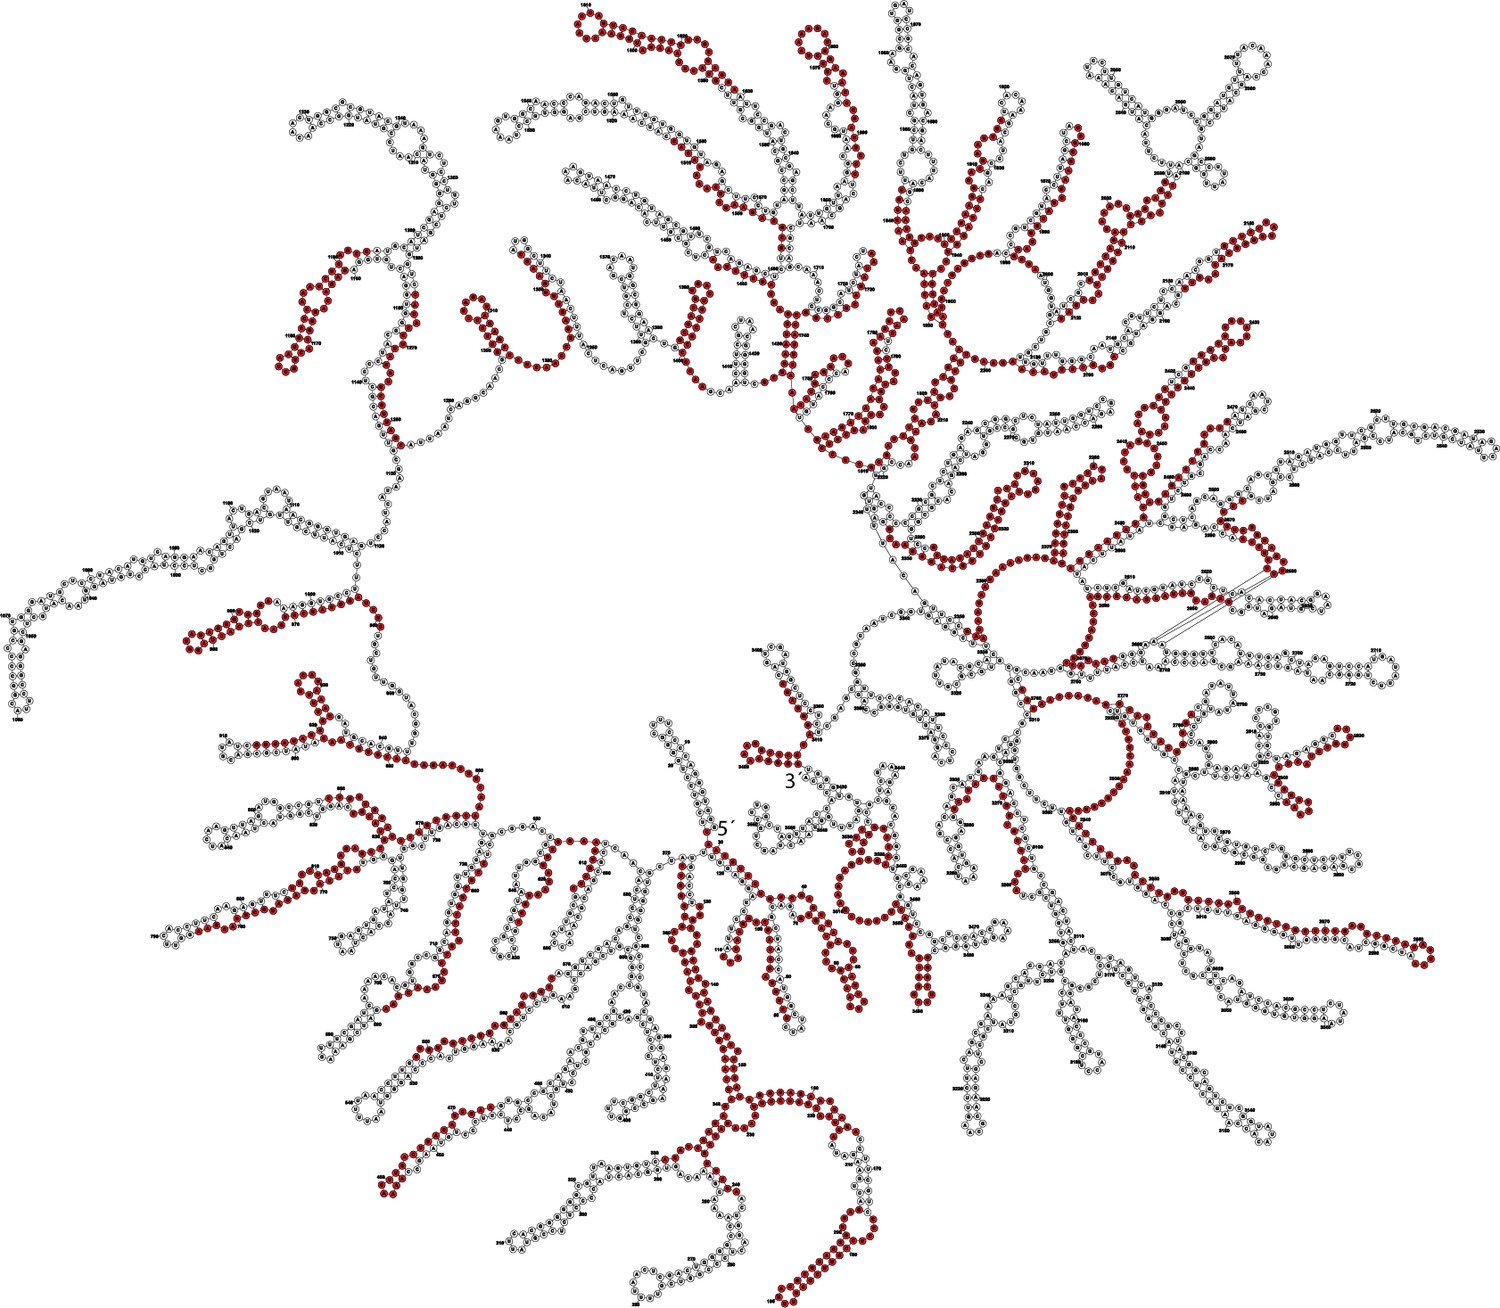
Enriched MS2 targeting guides mapped to MS2 genome structure.
Structure of the MS2 genome inside the viral particle was obtained from a recently published EM structure (Dai et al., 2017) and guides (red) significantly enriched in the MOI-100 treatment (FDR-adjusted p-value<0.05) were mapped to the MS2 genome and subsequently visualized in Forna (Kerpedjiev et al., 2015).
-
Figure 3—figure supplement 2—source data 1
Location of enriched guides from MOI-100 condition mapped to MS2 genome.
- https://doi.org/10.7554/eLife.32724.020
Figure 3—figure supplement 3
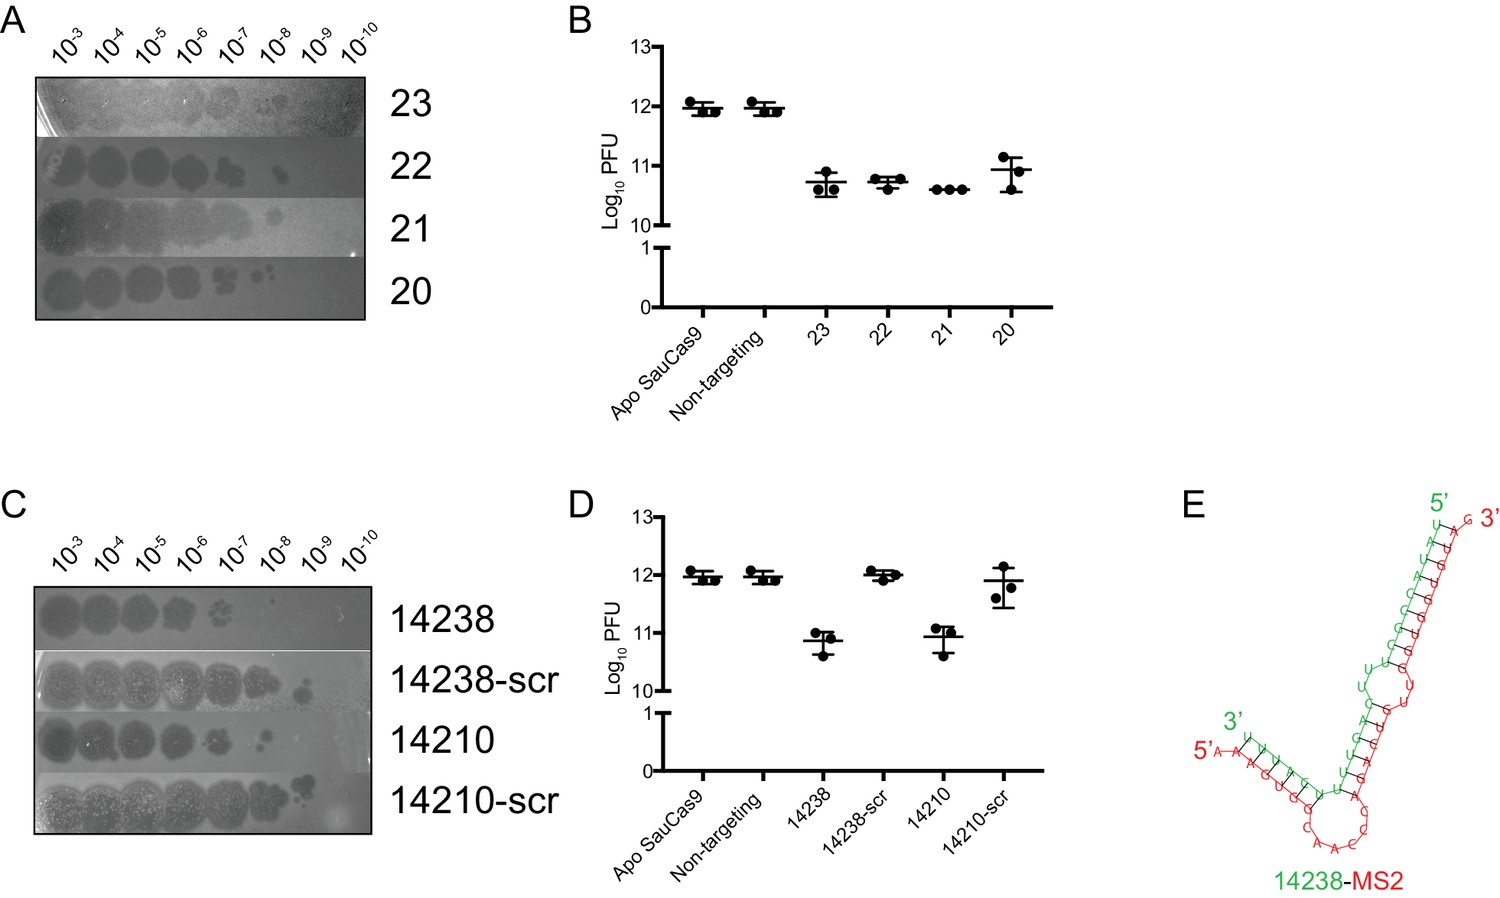
Confirmation that enriched guides from the MS2 screen confer protection against MS2 infection.
(A) Representative plaque assay for lawns of E. coli expressing wtSauCas9 and sgRNA of different length spotted with phage dilutions indicated. Here, the sgRNA with the highest fold-change in both MOI-10 and −100 samples was chosen for each length. The 23-mer sgRNA produces hazy plaques for an unknown reason. All other guides tested, including a different 23-mer sgRNA, produced clear plaques. (B) Quantification of relative plaque forming units (PFU, mean ± S.D., n = 3) from data in (A). (C) Same as in (A). Guides were two ‘control’ guides that were significantly enriched in both MOI-10 and −100 treatments during phage selection. Scrambled (scr) indicates random shuffling of the target sequence to serve as a non-targeting control. Scrambled sequences were verified against the MS2 genome and its reverse-complement to ensure no partial matches. (D) Quantification of relative PFU as in (C). Guides 14238 and 14210 confer ~10 fold protection over their scrambled counterparts. The level of protection is similar to perfectly complementary guides (B, and see Figure 3E and F). (E) Predicted binding of guide 14238 (green) to a fragment of the MS2 genome (red, nts: 1533–1563) using RNAhybrid (Rehmsmeier et al., 2004).
-
Figure 3—figure supplement 3—source data 1
Plaque enumeration for SauCas9-mediated MS2 protection.
- https://doi.org/10.7554/eLife.32724.022
Figure 3—figure supplement 4
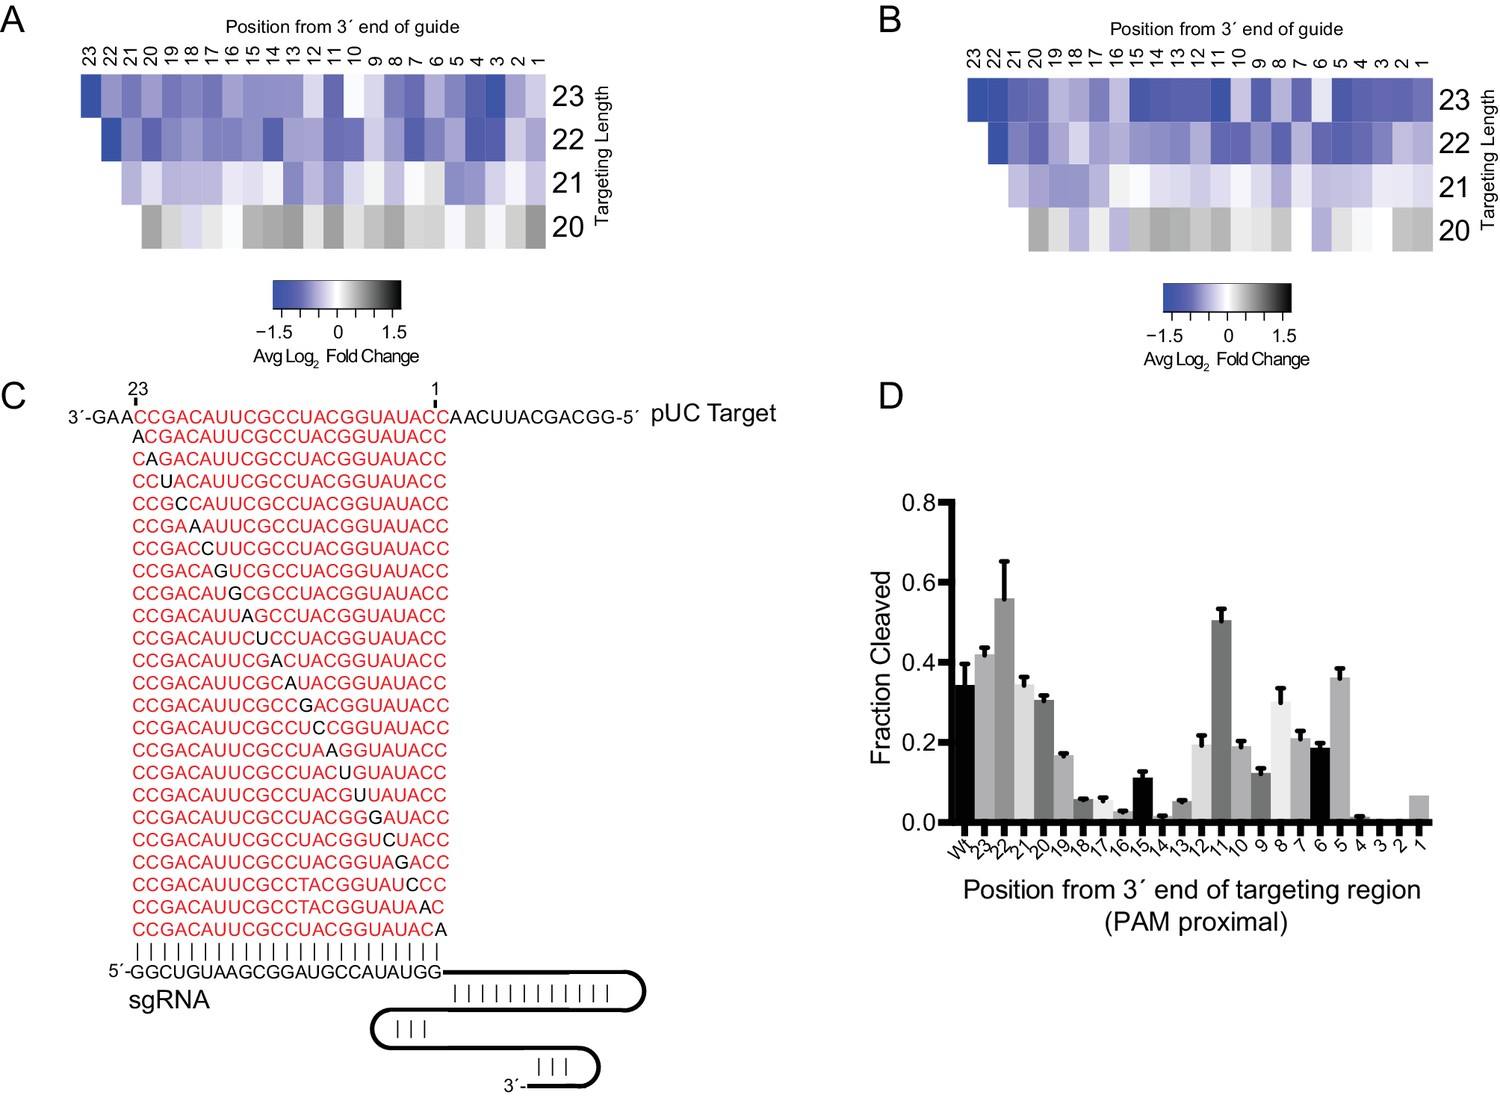
Effect of single-nucleotide mismatches on ssRNA targeting.
(A–B) Heatmap of average log2 fold-change for all single-nucleotide mismatch (SNP) guides in MOI-10 (A) and MOI-100 (B) treatment. Deeper blue represents greater negative selection of guides indicating greater sensitivity to mismatches at that position. While deeper black represents greater positive selection indicating that mismatches at that position are more tolerated. Positions are given as distance from 3´ end of the targeting region of the sgRNA. (C) Diagram of target ssRNAs with SNPs for in vitro cleavage assays. Red highlights the region complementary to the guide while black nucleotides indicate the mismatched base in the targeting region. Numbering of nucleotides is labeled from 1 to 23 to reflect positions in (A) and (B). (D) Quantification of in vitro cleavage assays with mismatched targets in (C). Bars represent the mean ± S.D. (n = 3). ‘Wt’ indicates 23nt of perfect complementarity between the sgRNA and the target.
-
Figure 3—figure supplement 4—source data 1
Heatmaps of single-nucleotide mismatches from MS2 screen and in vitro mismatch cleavage.
- https://doi.org/10.7554/eLife.32724.024
Figure 4 with 1 supplement
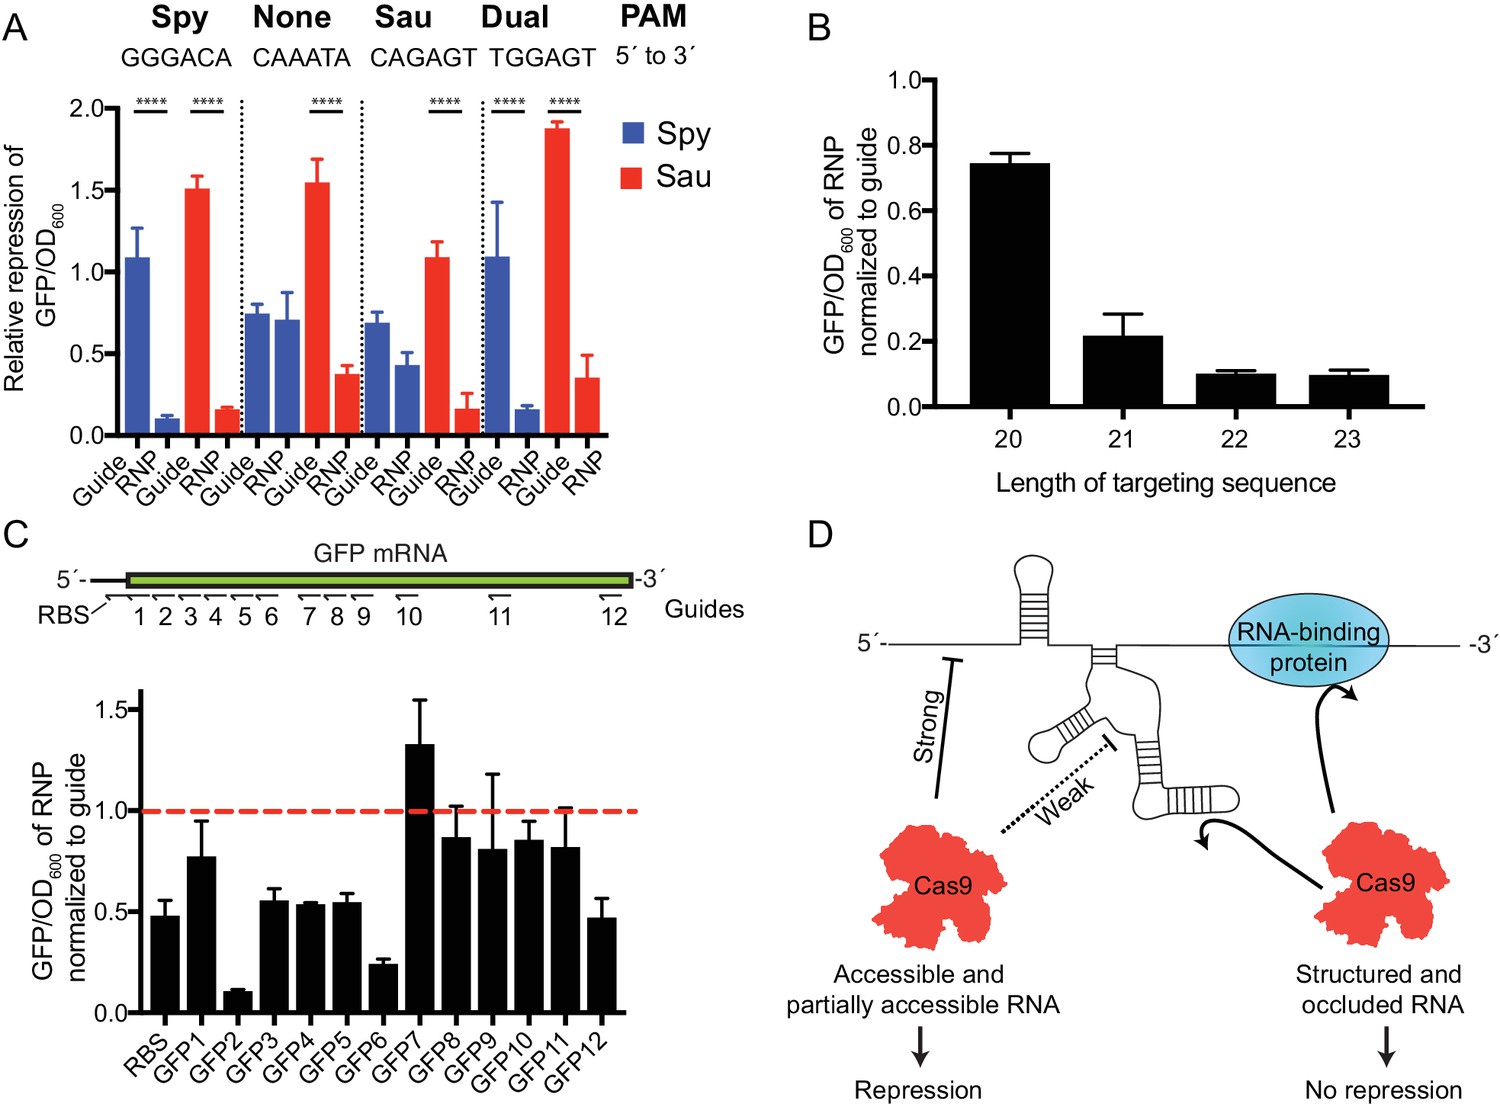
SauCas9 repression of a GFP reporter in vivo.
(A) Comparison of dSpy and dSauCas9 to repress GFP expression on the DNA and RNA level. GFP signal is normalized to OD600 to control for difference in cell density between samples. GFP/OD600 ratios for guide alone and RNP are normalized to values for a non-targeting guide vector and an Apo protein control, respectively. Target sites were chosen to be adjacent to PAM sites for Spy, Sau, both, or neither as indicated. Note: the slight GFP repression observed with dSpyCas9 using the target sequence adjacent to the Sau PAM (CAGAGT) likely results from the ability of SpyCas9 to use an NAG PAM, albeit with reduced efficiency (Hsu et al., 2013). ****p<0.0001 by one-way ANOVA. (B) Relative expression of GFP using guides with different length targeting sequences. Target site here is the GFP2 sequence chosen for its robust targeting activity. (C) (Upper) Diagram of targeting sequences across the GFP mRNA and ribosome-binding site (RBS). (Lower) Relative expression of GFP of SauCas9 RNP normalized to sgRNA alone for targeting sequences across the GFP reporter. Dashed red line indicates that the sgRNA alone is as efficient as the RNP for GFP repression. (A–C) Bars represent mean ± S.D. (n = 3). (D) Model for observed SauCas9 ssRNA targeting activity. We propose that accessible RNA is cleaved or repressed efficiently while structured and protein-bound RNA is not targeted by SauCas9.
-
Figure 4—source data 1
Raw data for PAM dependency, length efficiency, and GFP mRNA tiling for GFP repression assays.
- https://doi.org/10.7554/eLife.32724.029
Figure 4—figure supplement 1
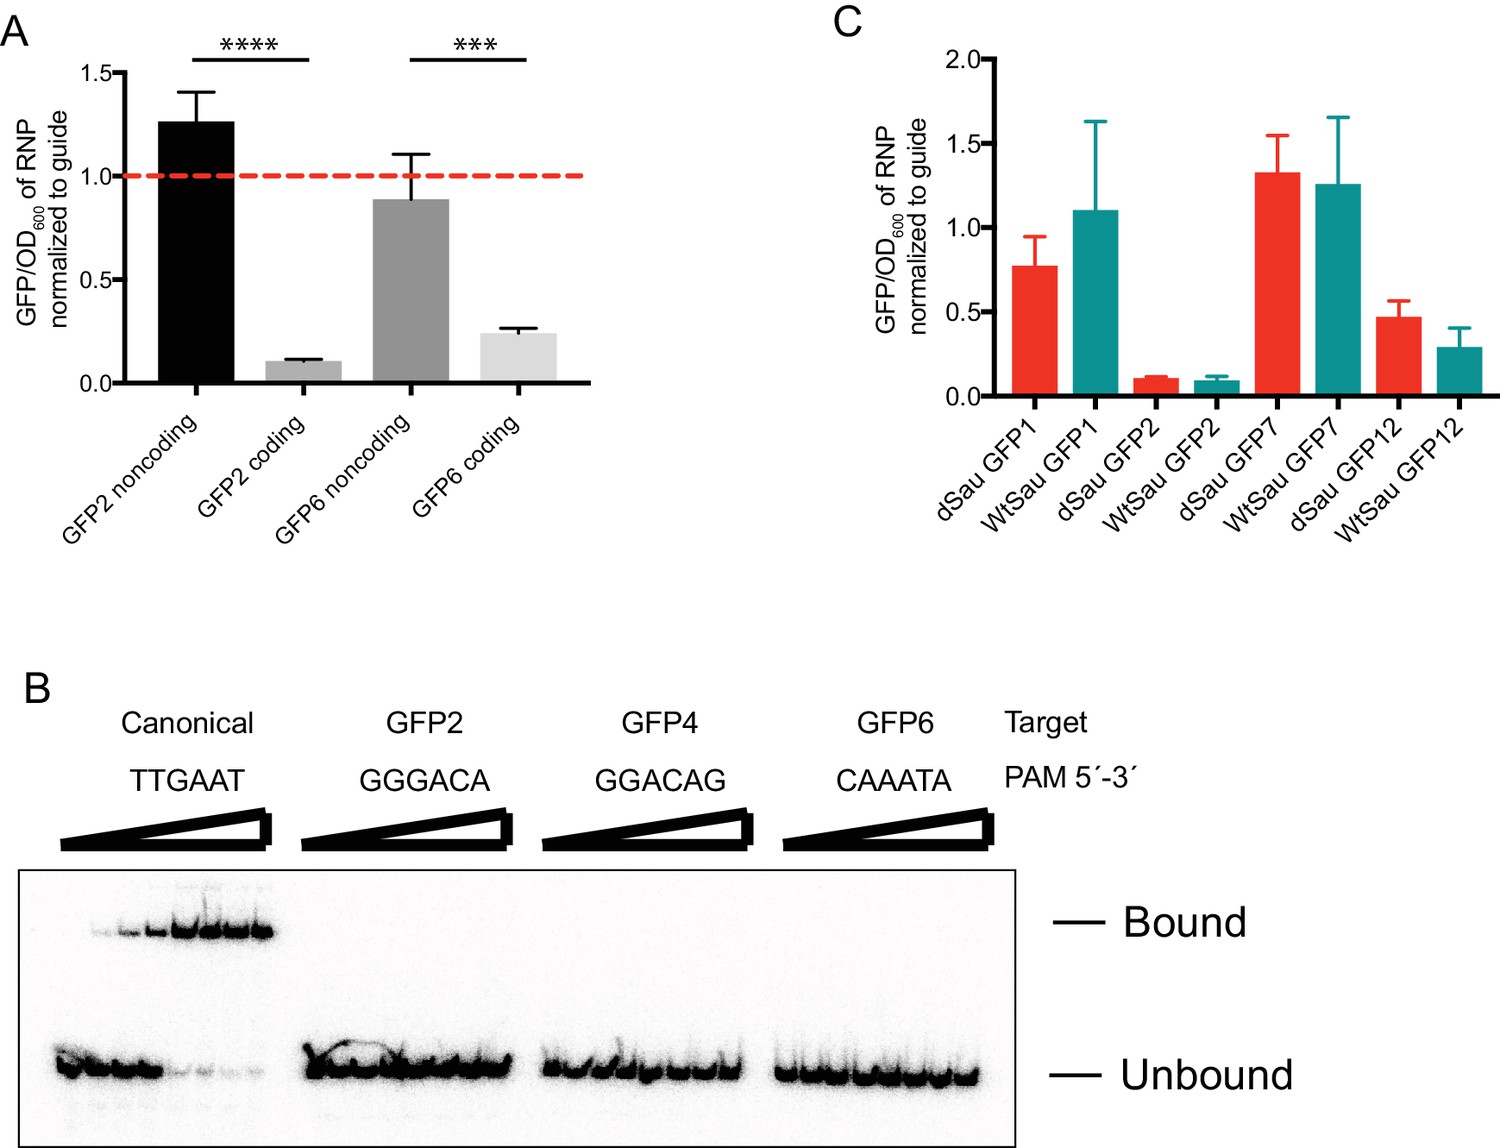
Repression of GFP mRNA.
(A) dSauCas9-sgRNA directed against a GFP mRNA (coding) or antisense (noncoding) sequence. GFP2 and GFP6 refer to guides diagrammed in Figure 4C. Dashed red line indicates that the sgRNA alone is as efficient as the SauCas9 RNP for GFP repression. Bars represent mean ± S.D. (n = 3). ***p<0.001, ****p<0.0001, by one-way ANOVA. (B) Electrophoretic mobility shift assay (EMSA) confirming that dSauCas9 does not bind dsDNA adjacent to non-canonical PAMs. Targeting sequence is identical for all substrates but with varied PAM sequences as indicated for the guides in Figure 4C. Final concentrations of dSauCas9 from left to right: 0, 0.1, 0.5, 1, 5, 10, 50, 100 nM. (C) Comparison of ability of dSau and wtSauCas9 to repress GFP expression in vivo. Bars represent mean ± S.D. (n = 3).
-
Figure 4—figure supplement 1—source data 1
Raw data for GFP repression assays.
- https://doi.org/10.7554/eLife.32724.028
Tables
Key resources table
| Reagent type (species) or resource | Designation | Source or reference | Identifiers | Additional information |
|---|---|---|---|---|
| Strain, strain background (E. coli) | BL21(DE3) | Thermo Fisher | ||
| Strain, strain background (E. coli) | XL1-Blue | QB3-MacroLab | ||
| Strain, strain background (E. coli) | strain with GFP reporter | PMID: 27136077 | ||
| Recombinant DNA reagent | SauCas9 expression vector | this paper | SauCas9 sequence in vector backbone from PMID: 27136077 | |
| Recombinant DNA reagent | His-MBP vector (plasmid - #29706) | addgene | ||
| Recombinant DNA reagent | SauCas9 guide expression vector | this paper | SauCas9 guide scaffold in vector backbone from PMID: 27136077 | |
| Software, algorithm | ImageQuantTL | GE Healthcare | RRID:SCR_014246 | |
| Software, algorithm | Prism7 | GE Healthcare | RRID:SCR_015807 |
Additional files
-
Supplemental file 1
List of sequences used in this study
- https://doi.org/10.7554/eLife.32724.030
-
Transparent reporting form
- https://doi.org/10.7554/eLife.32724.031
Download links
A two-part list of links to download the article, or parts of the article, in various formats.
Downloads (link to download the article as PDF)
Open citations (links to open the citations from this article in various online reference manager services)
Cite this article (links to download the citations from this article in formats compatible with various reference manager tools)
RNA-dependent RNA targeting by CRISPR-Cas9
eLife 7:e32724.
https://doi.org/10.7554/eLife.32724


