Conserved conformational selection mechanism of Hsp70 chaperone-substrate interactions
- University of Toronto, Canada
- Weizmann Institute of Science, Israel
- UPMC Univ. Paris 06, CNRS, PSL Research University, France
- Sorbonne Universités, UPMC Univ. Paris 06, École normale supérieure, CNRS, Laboratoire des Biomolécules, France
- University Avenue, Canada
Figures
Figure 1
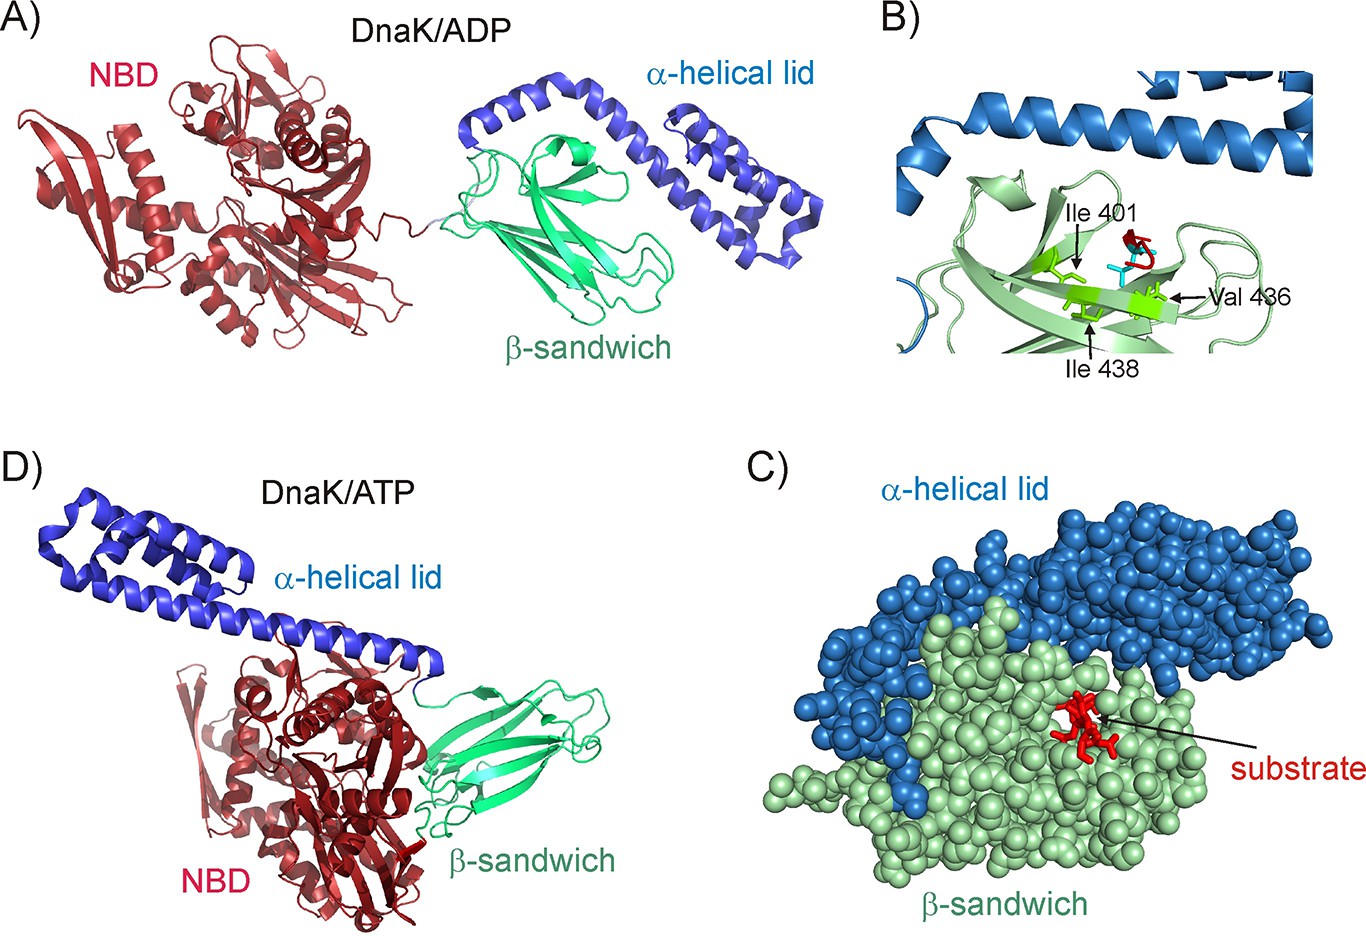
Structure of the E.coli Hsp70 (DnaK) chaperone.
(A) Cartoon representation of the NMR structure of DnaK/ADP (Bertelsen et al., 2009) showing the N-terminal ATPase domain (NBD) and the C-terminal substrate binding domain which consists of a β-sandwich subdomain and an α-helical lid (PDB ID: 2KHO). (B) An enlarged view of the substrate binding cleft showing key hydrophobic residues Ile 401, Val 436 and Ile 438 of DnaK as green sticks forming contacts with the substrate residue that occupies the central binding position (cyan sticks) (PDB ID: 1DKZ) (Zhu et al., 1996). The remainder of the peptide substrate is shown in red. (C) Space filling structure of the substrate binding domain (SBD) with a closed conformation of the helical lid, illustrating the pore that the substrate (red) threads through. (D) The crystal structure of DnaK/ATP in the absence of substrate (Kityk et al., 2012; Qi et al., 2013), showing that upon ATP hydrolysis the α-helical lid becomes docked on the β-sandwich domain concomitant with the undocking of NBD and SBD (PDB ID: 4B9Q).
Figure 2
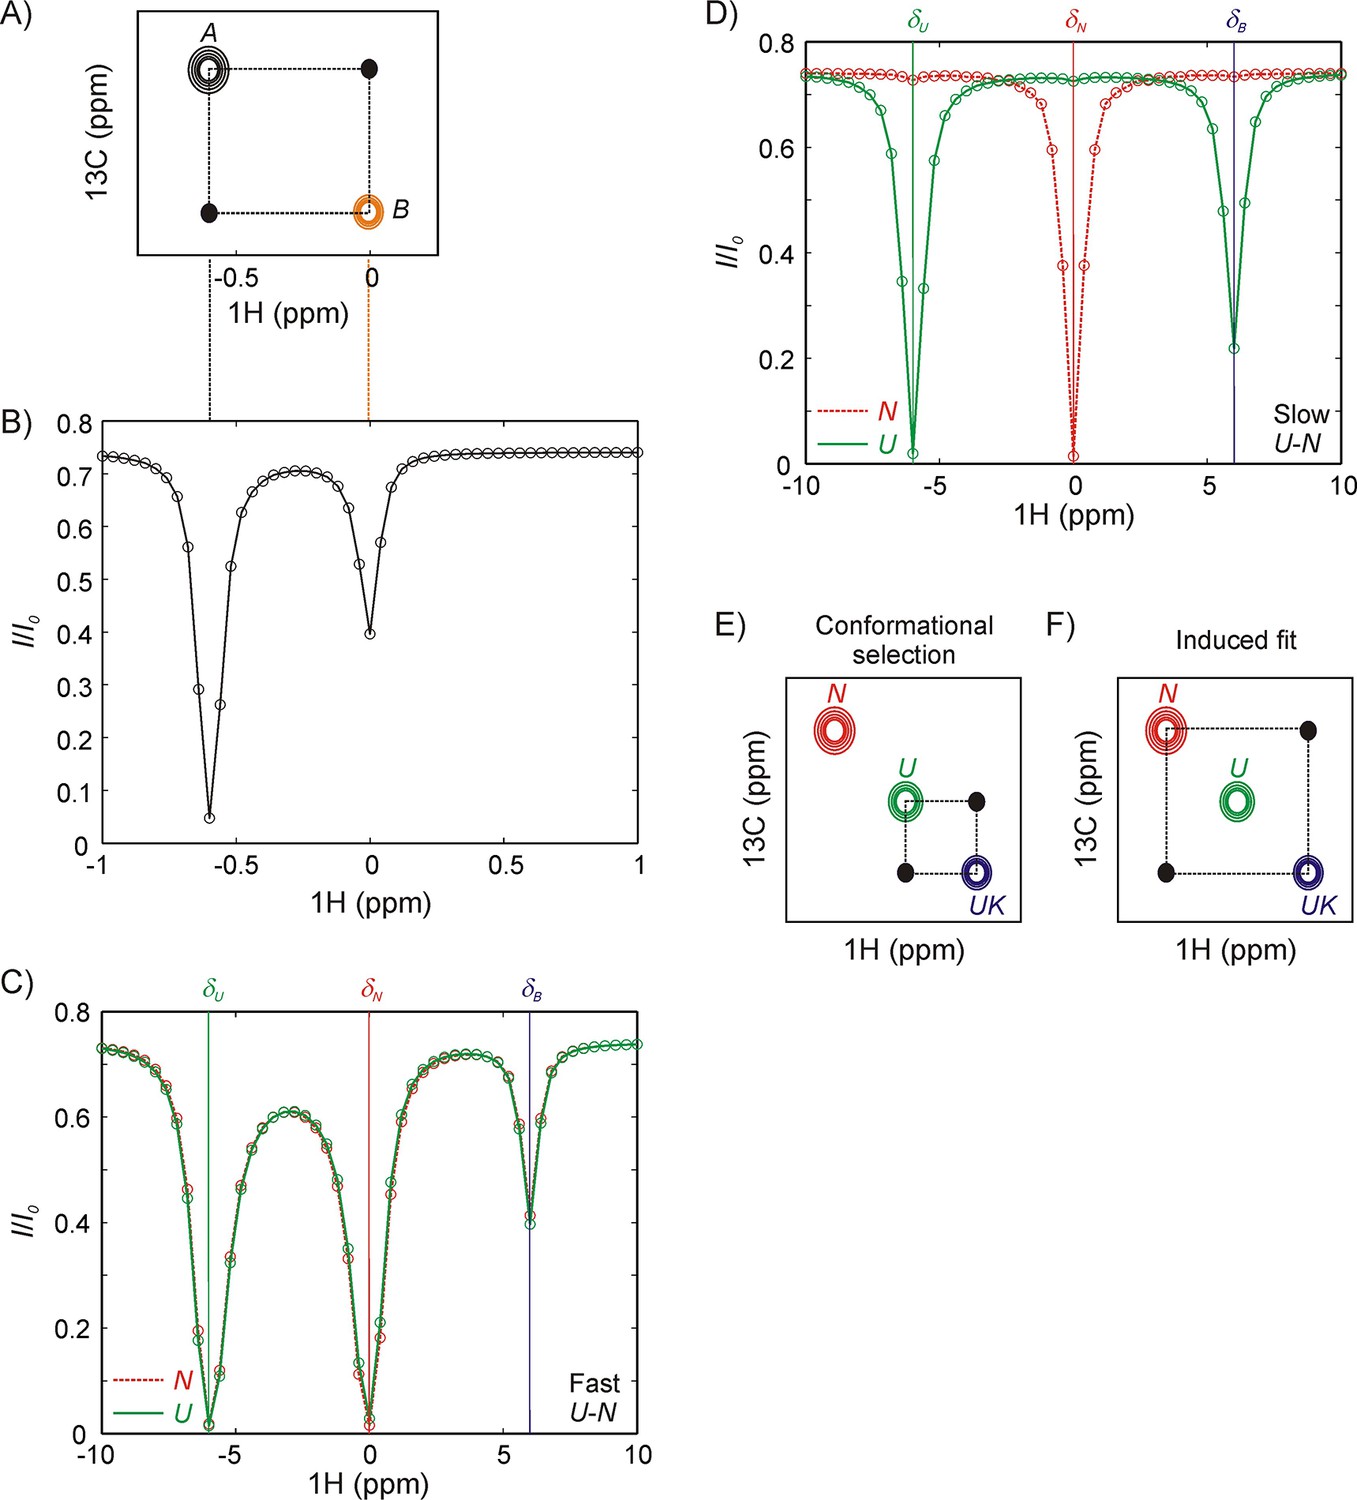
Magnetization transfer and CEST experiments for studies of binding kinetics.
(A) Schematic of a zz-magnetization exchange spectrum showing diagonal peaks derived from magnetization in exchanging states A and B, , as well as cross-peaks (black dots) connecting the two states. (B) Corresponding CEST profile for the exchange reaction in panel A that plots the normalized peak intensity of a spin in state A as a function of the offset at which a weak radiofrequency field is applied. A major dip at the chemical shift of the spin in state A (−0.6 ppm) as well as a minor dip at the corresponding chemical shift in state B (0 ppm), can be observed. Black and orange dashed lines between panels A and B show the correspondence between CEST and zz-exchange experiments via chemical shifts in states A and B. Note, however, that the CEST experiment amplifies the fingerprint of exchange, so that a minor dip for a spin in state B can be observed even if the peak cannot be directly visualized in the spectrum (pB <5%). NMR spin-relaxation methods can distinguish between IF and CS binding pathways so long as N and U conformations interconvert slowly (slower than the binding kinetics). If N and U interconvert rapidly compared to the kinetics of binding (C), any perturbation to the magnetization of the bound state by application of a weak radiofrequency field is rapidly conveyed to N even if binding is only to U, resulting in identical CEST profiles for N (red) and U (green). (D) In contrast, if states N and U interconvert slowly then distinct CEST profiles can be observed for CS and IF binding mechanisms, as shown here for binding to the U state via conformation selection. A prominent minor state dip is observed in the U profile (green) at the position of the bound frequency, δB, corresponding to a flux through the reaction. Because a minor dip is not observed between N and UK (red) the flux through the reaction must be much smaller than via . (E, F) Schematic of 2D planes derived from a 13C-1H magnetization exchange experiment recorded on a system where the binding reaction is described by conformational selection, (E) or induced fit, (F). The U-N interconversion is assumed to be too slow to give rise to detectable cross-peaks in this experiment. Distinct cross-peaks are observed connecting the conformation that directly binds the partner (U in panel E, conformational selection and N in panel F, induced fit).
Figure 3 with 2 supplements

R17* binds DnaK.
Ribbon diagram of the X-ray structure of R17 (PDB ID: 1CUN) (Grum et al., 1999) showing the strongest DnaK binding site in blue with sidechains denoted as sticks. The backbone nitrogen atoms of methyl containing amino acids Ile, Leu, Met and Val are indicated as red spheres; these methyls are used as probes of chaperone binding with the labeling scheme that we employ. (B) Surface representation of the R17 structure, with the Ile and Leu residues of the two DnaK binding sites identified from LIMBO (Van Durme et al., 2009) shown in blue. Met region of the 13C-1H HMQC spectrum recorded on a 250 μM ILVM 13CH3-labeled R17* sample without (C) and with (D) 500 μM DnaK/ATP, 25°C. Assignments of folded (N) and unfolded (U) Met are indicated in red and green, respectively. The peak that appears upon DnaK addition is labeled as ‘Bound’.
Figure 3—figure supplement 1
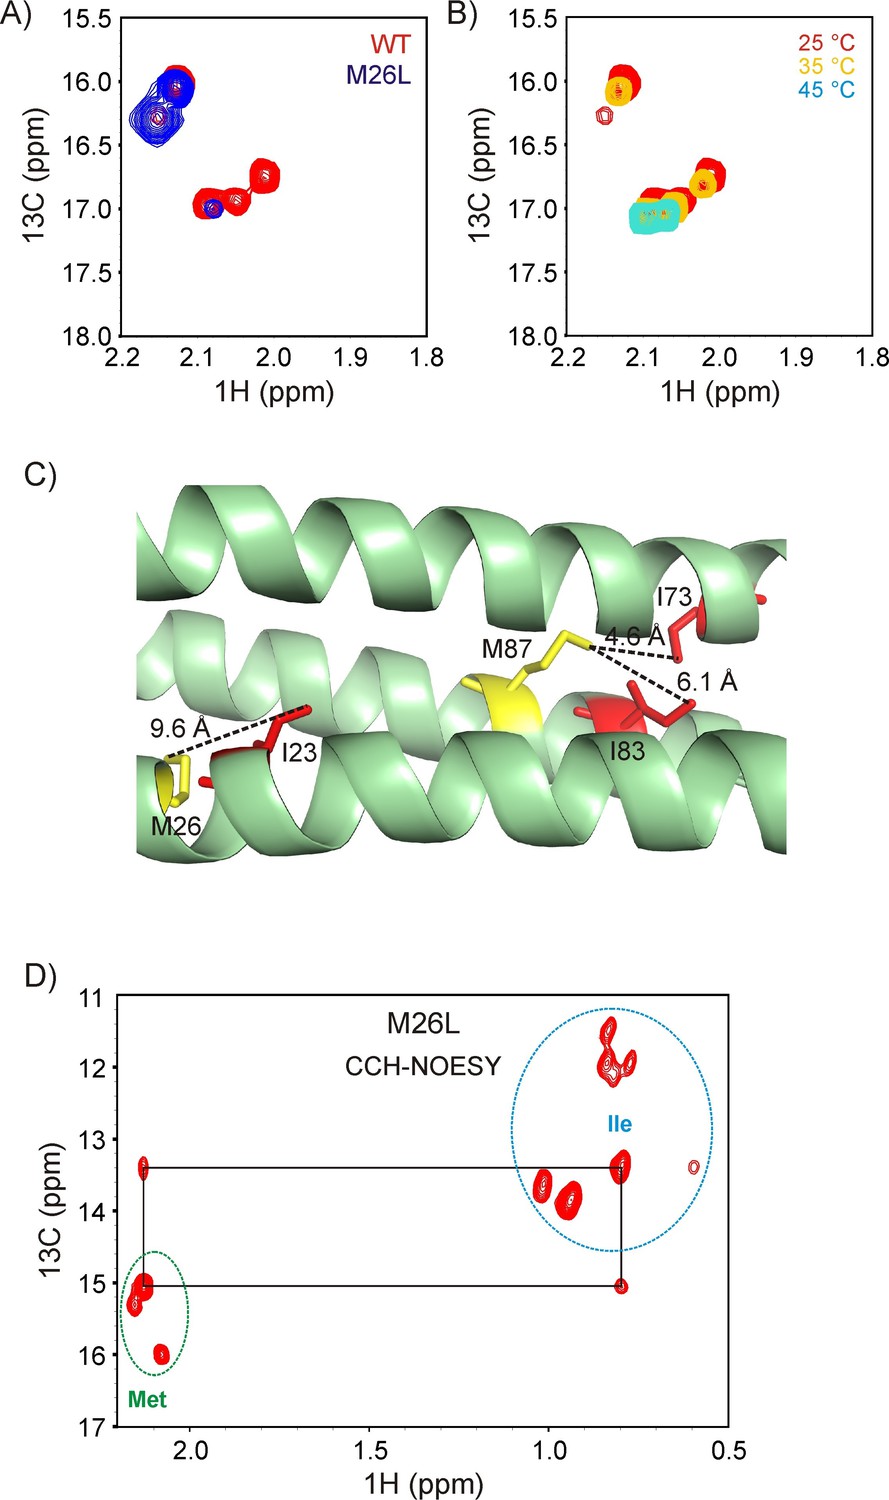
Resonance assignments for R17*.
(A) Overlay of the 13C-1H HMQC Met region of wild-type (wt, red) and M26L R17* (blue). (B) Changes in the Met region of the 13C-1H HMQC spectrum of ILVM-13CH3 R17* with temperature. The peaks that reduce in intensity are native state peaks, while those that remain at high temperature are from the unfolded state. (C) Structure of R17 (PDB ID: 1CUN) (Grum et al., 1999), showing that of the two Met residues, only M87 is proximal to an Ile. (D) Verification of the Met resonance assignments via a 2D plane from a 3D 13C(t1)-NOE-13C(t2)-1 H(t3) NOESY dataset recorded with t2 = 0 and a mixing time of 250 ms. Resonances from Ile (folded and unfolded) are circled in blue, while those from Met are within the green circle. NOE cross-peaks between Met 87 and Ile 73 are observed, as expected.
Figure 3—figure supplement 2
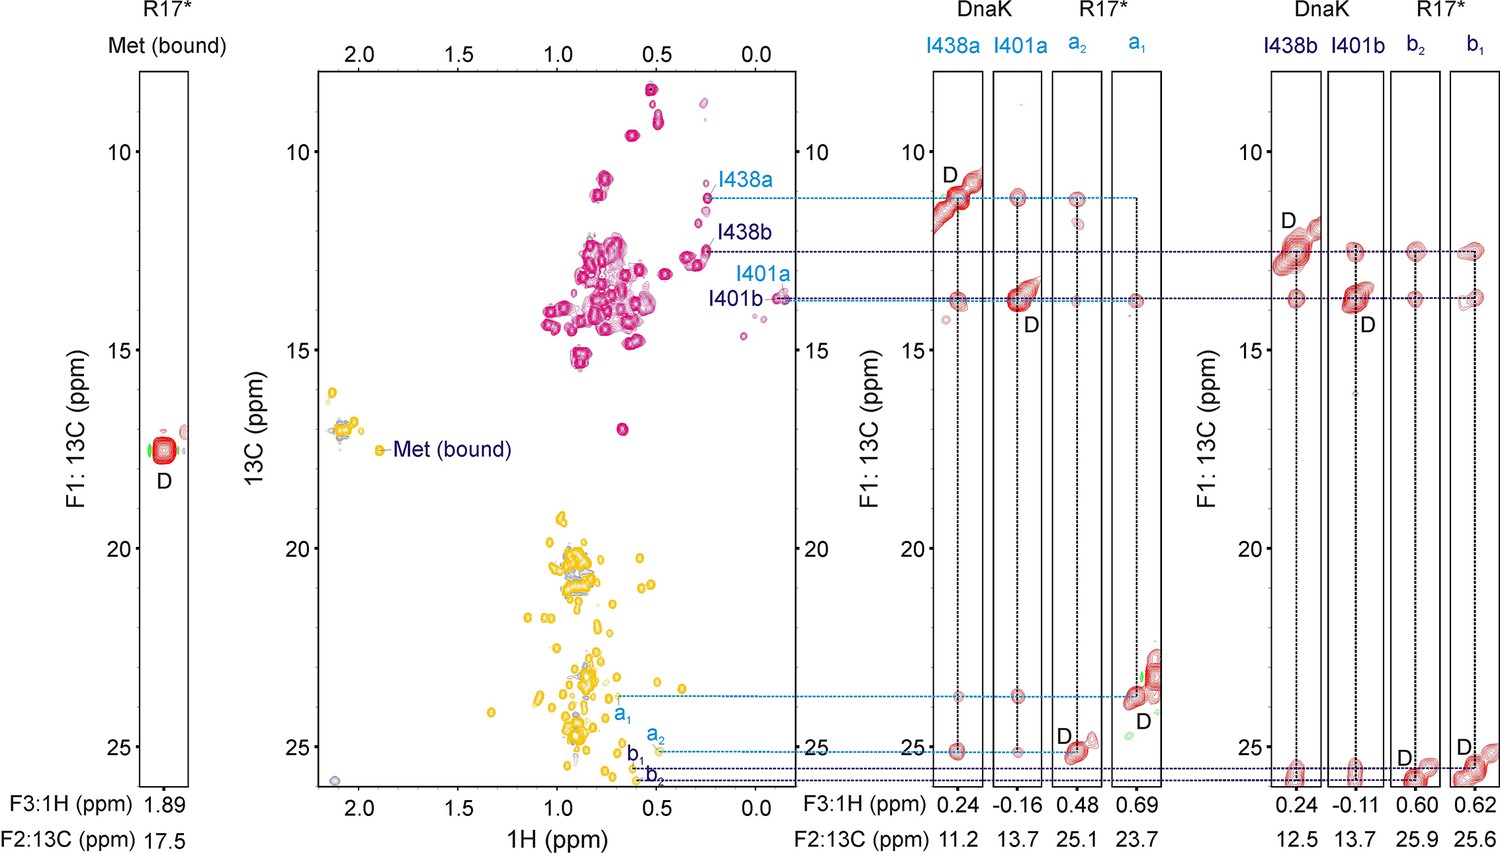
Identifying residues of R17* at the central binding groove of DnaK.
13C-1H HMQC spectrum (middle) of 400 μM ILVM-13CH3 R17* containing 800 μM I-13CH3 DnaK/ADP. (Right and Left) Strips (F1–F3) from a 13C-13C-1H NOESY dataset (200 ms mixing time) at F2 (13C) shifts indicated at the bottom of each strip. The strip from the bound Met resonance (left) does not show any crosspeaks to Ile methyl groups of DnaK, indicating that it is not located at position 0 of the DnaK binding site. On the other hand, four peaks in the Leu region (2 pairs of prochiral methyls, a1 and a2, b1 and b2) show cross-peaks to Ile 438 and Ile 401 of DnaK, demonstrating that there are at least two conformations of the R17*-DnaK complex, each with a distinct Leu at position 0. This is illustrated on the right where two groups of four strips each are highlighted, with the first strip in each group belonging to Ile 438, the second to Ile 401 and last two to Leu resonances of R17*. It is noteworthy that none of the peaks labelled a1, a2, b1, b2 disappear upon substitution of Leu 44, Leu 45 and Leu 72 of R17* with Ile indicating that these correlations do not arise from Leu 44, Leu 45 or Leu 72 at the 0 position.
Figure 4
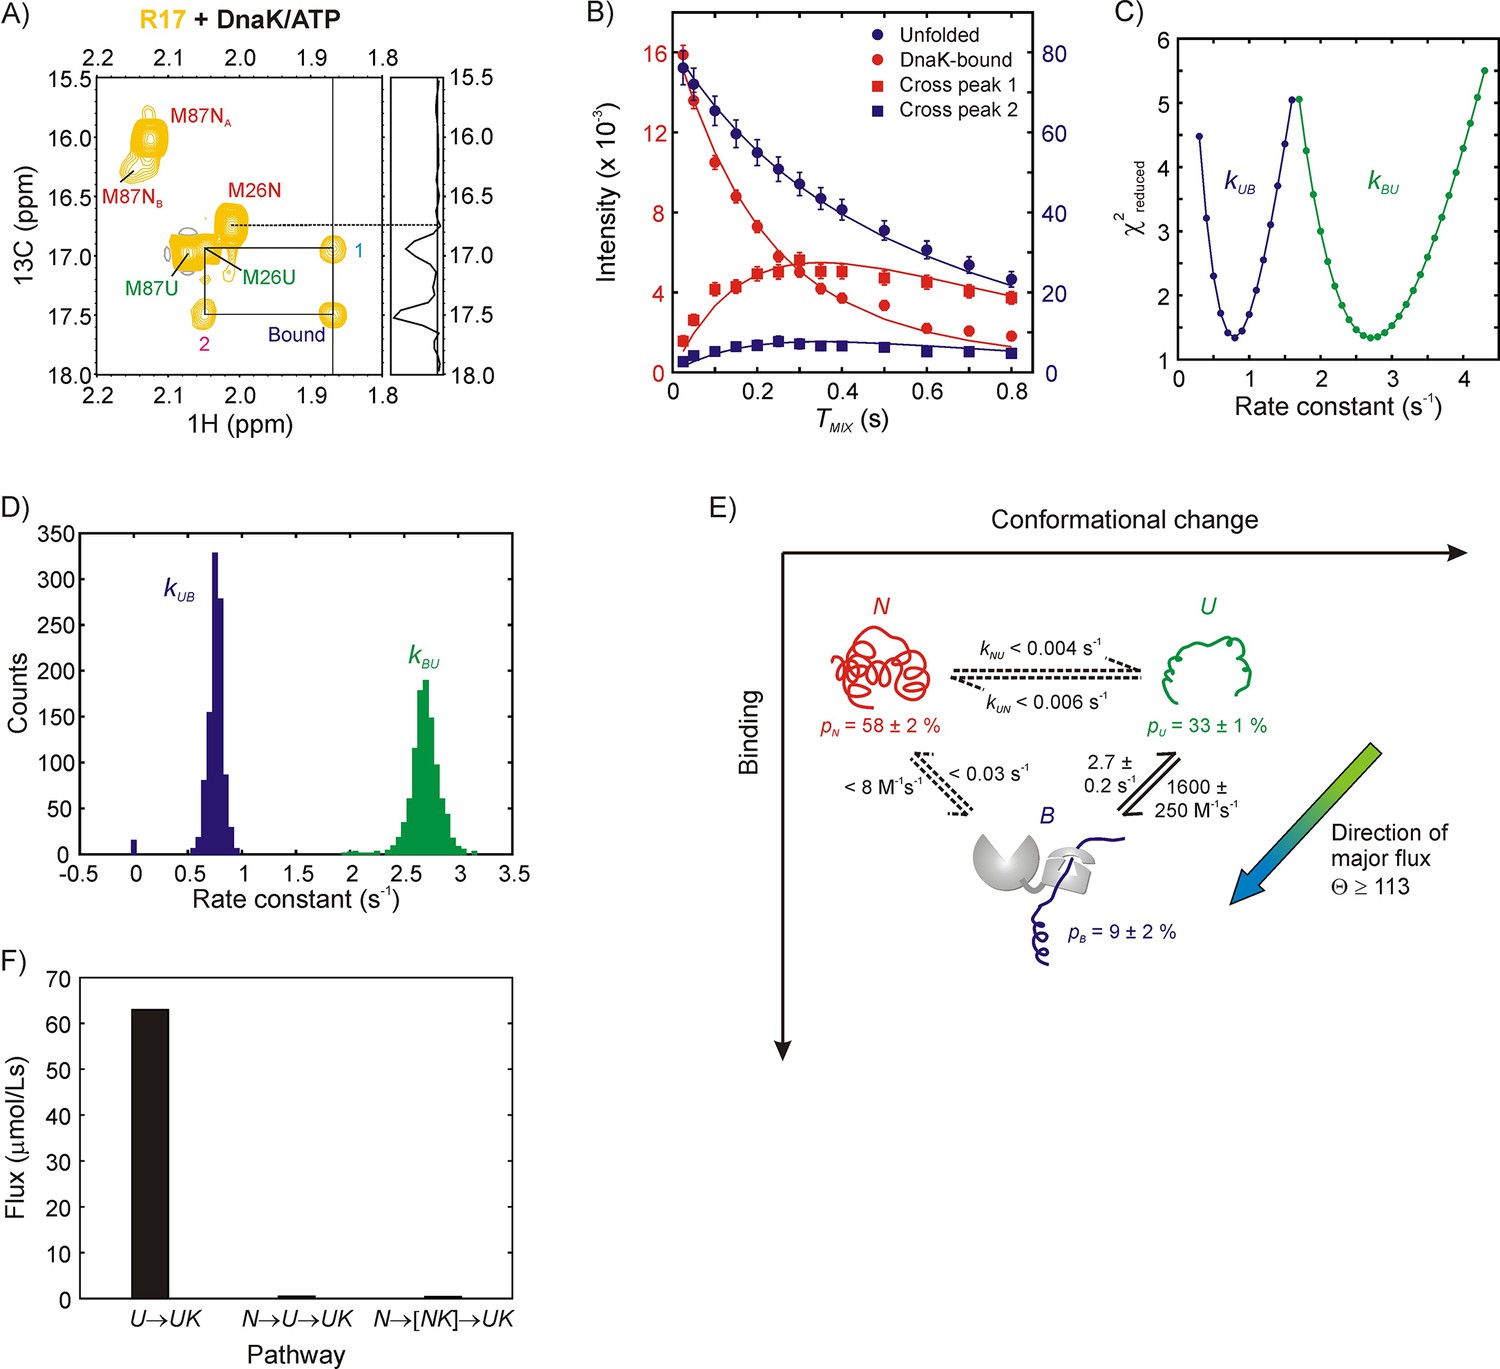
Mechanism of R17* binding to DnaK/ATP.
(A) Magnetization exchange spectrum recorded on a 250 μM ILVM 13CH3-labeled R17* sample (500 μM DnaK/ATP), focusing on the Met region. A mixing time of 300 ms was used so that exchange cross-peaks 1 and 2 could be easily observed. The exchange peaks establish the identity of the resonance labeled ‘Bound’ - it originates from Met 26. The 1D trace at the chemical shift denoted by the vertical solid line at 1.87 ppm is shown alongside the spectrum. Importantly, both the spectrum and the 1D trace show that cross-peaks are observed only from the bound state to the unfolded state and not to the native state of Met 26. (B) Mixing time-dependent changes in cross- (square) and diagonal- (circle) peak intensities of Met 26. The unfolded diagonal peak and the bound-to-unfolded cross-peak (cross-peak 2 in panel A) are coloured blue and matched with the blue axis labels (right) while the bound diagonal peak and the unfolded-to-bound cross-peak (cross-peak 1 in panel A) are shown in red along with the red axis labels (left). Solid curves are fits of the intensities to a two-state model of conformational exchange. (C) Dependence of reduced χ2 values from fits of the exchange data as a function of the pseudo first order rate constant kUB (blue) or the first order rate constant kBU (green). Values increase steeply from the minimum indicating that both rate constants can be obtained reliably from modeling the zz-exchange data. (D) Distributions in kUB and kBU based on a bootstrap analysis of the data, as described in Materials and methods; means and standard deviations of the distributions were used as parameter estimates and their errors, respectively. (E) Model of R17* binding to DnaK. Reactions for which only upper limits for the rate constants can be obtained are shown as dotted lines. The major flux for R17*-DnaK binding occurs along the elementary conformational selection pathway U to UK. (F) Histogram showing flux values for the UUK, (upper bound) and (upper bound) pathways. Note that NK is not directly detected in our experiments.
Figure 5 with 1 supplement
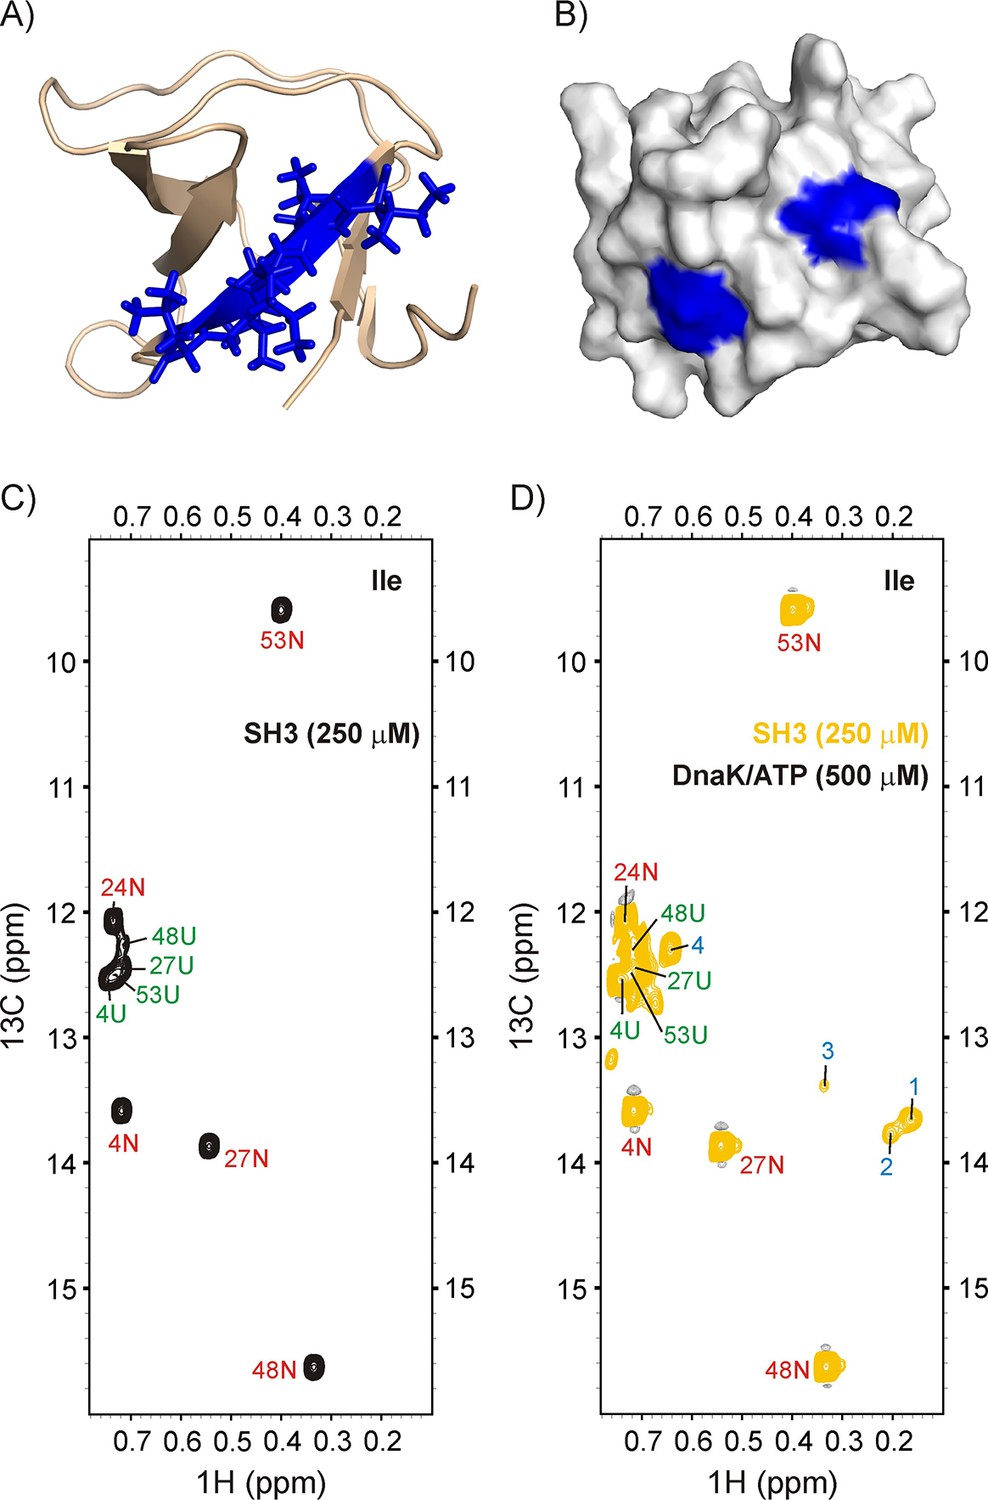
Binding of drkN SH3 to DnaK.
(A) Cartoon representation of the structure of drkN SH3 (PDB ID: 2A36) (Bezsonova et al., 2005) with the strongest predicted DnaK binding site coloured in blue. (B) Surface representation of drkN SH3 where the large aliphatic hydrophobic sidechains of the two DnaK binding sites identified by the algorithm LIMBO (Van Durme et al., 2009) are shown in blue, illustrating that the binding sites are partially accessible even in the N state. Ile regions of 13C-1H HMQC spectra of 250 μM IM-13CH3 drkN SH3 without (C) and with (D) 500 μM U-2H DnaK/ATP, 25°C. Ile cross-peaks derived from N and U are labeled in red and green, respectively, while DnaK-bound peaks 1 to 4 that appear only upon DnaK addition are denoted by blue labels.
Figure 5—figure supplement 1
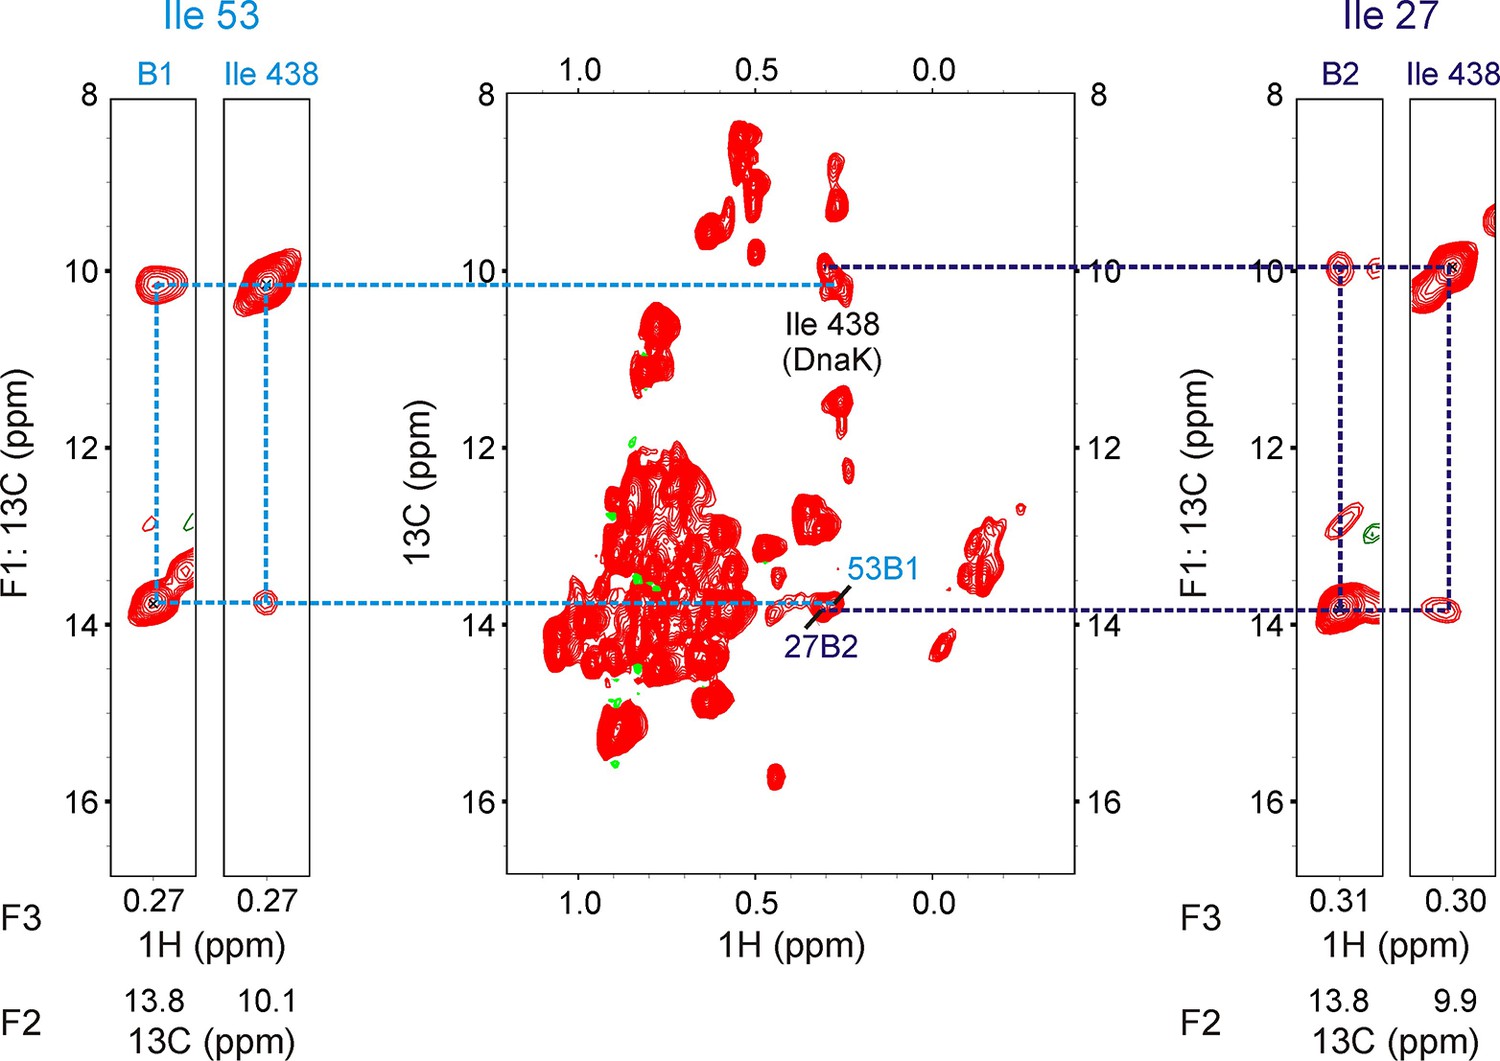
13C-1H HMQC spectrum of 250 μM ILVM-13CH3 drkN SH3 containing 500 μM IM-13CH3 DnaK/ADP (middle).
The spectrum is of poorer quality than the one in Figure 3—figure supplement 2 because the DnaK stock was over a year old. Resonances from Ile 438 of DnaK as well as from DnaK-bound drkN SH3 (Ile53B1 and Ile27B2) are labeled on the spectrum. F1-F3 strips from a 200 ms 13C-13C-1H-NOESY at F2 (13C) shifts identified at the bottom of each strip are illustrated. Two pairs of strips, one pair each for the bound state giving rise to peaks I53B1 (left) and I27B2 (right) are shown on either side of the HMQC. For each pair, the strip from the SH3 peak (I53B1 or I27B2) is shown on the left, while the strip from the Ile 438 resonance with NOE crosspeaks to it is shown on the right. The presence of cross-peaks between B1/B2 and Ile 438 demonstrates that both I53B1 and I27B2 belong to Ile residues of drkN SH3 located at the 0 position of the DnaK binding pocket. Interestingly, there are no NOEs between B1/B2 and Ile 401, and none between Ile 438 and Ile 401, suggesting that the binding pocket arrangement is altered when Ile residues are present at the 0 position, compared to when Leu residues are present at this site since in the later case NOEs between Ile 401 and Ile 438 as well as between Ile 401/438 and the Leu at the 0 position are observed (Rosenzweig et al., 2017).
Figure 6 with 2 supplements
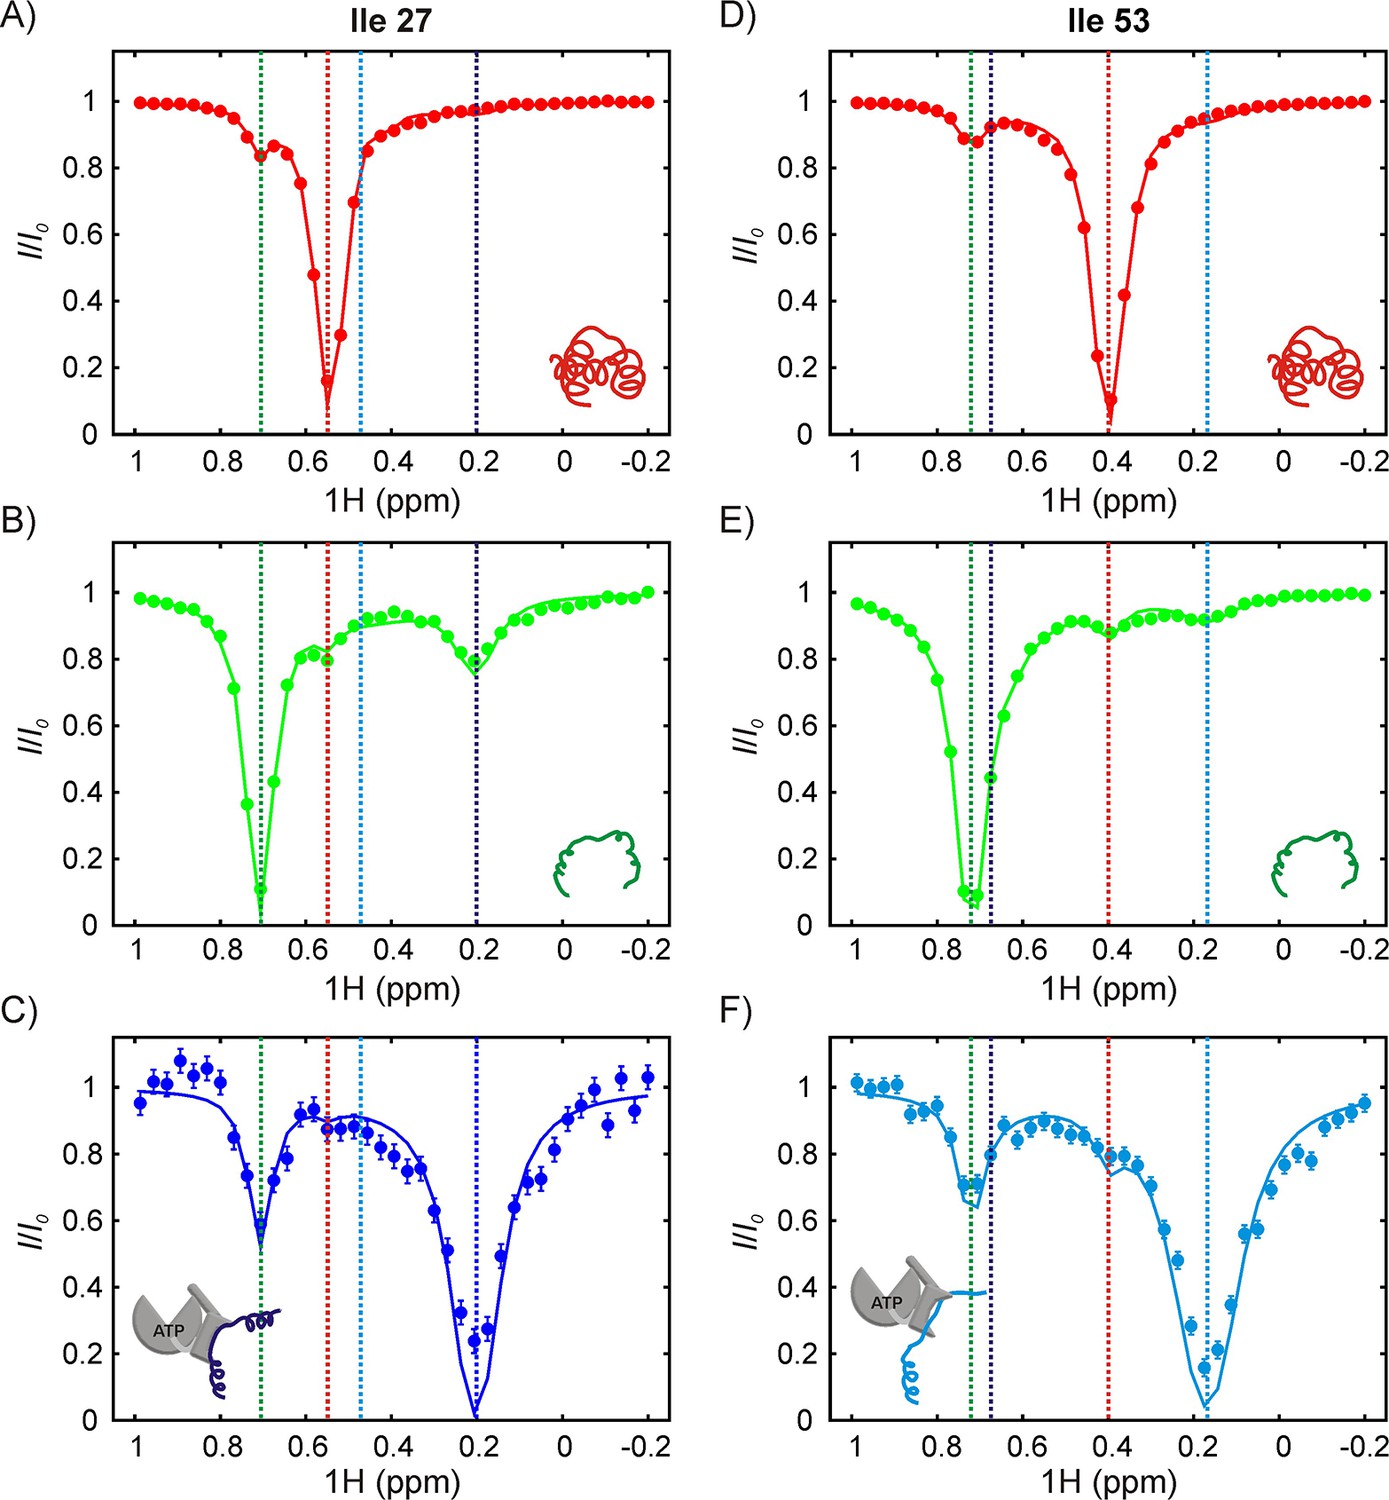
The SH3-DnaK binding interaction as detected by 1H CEST.
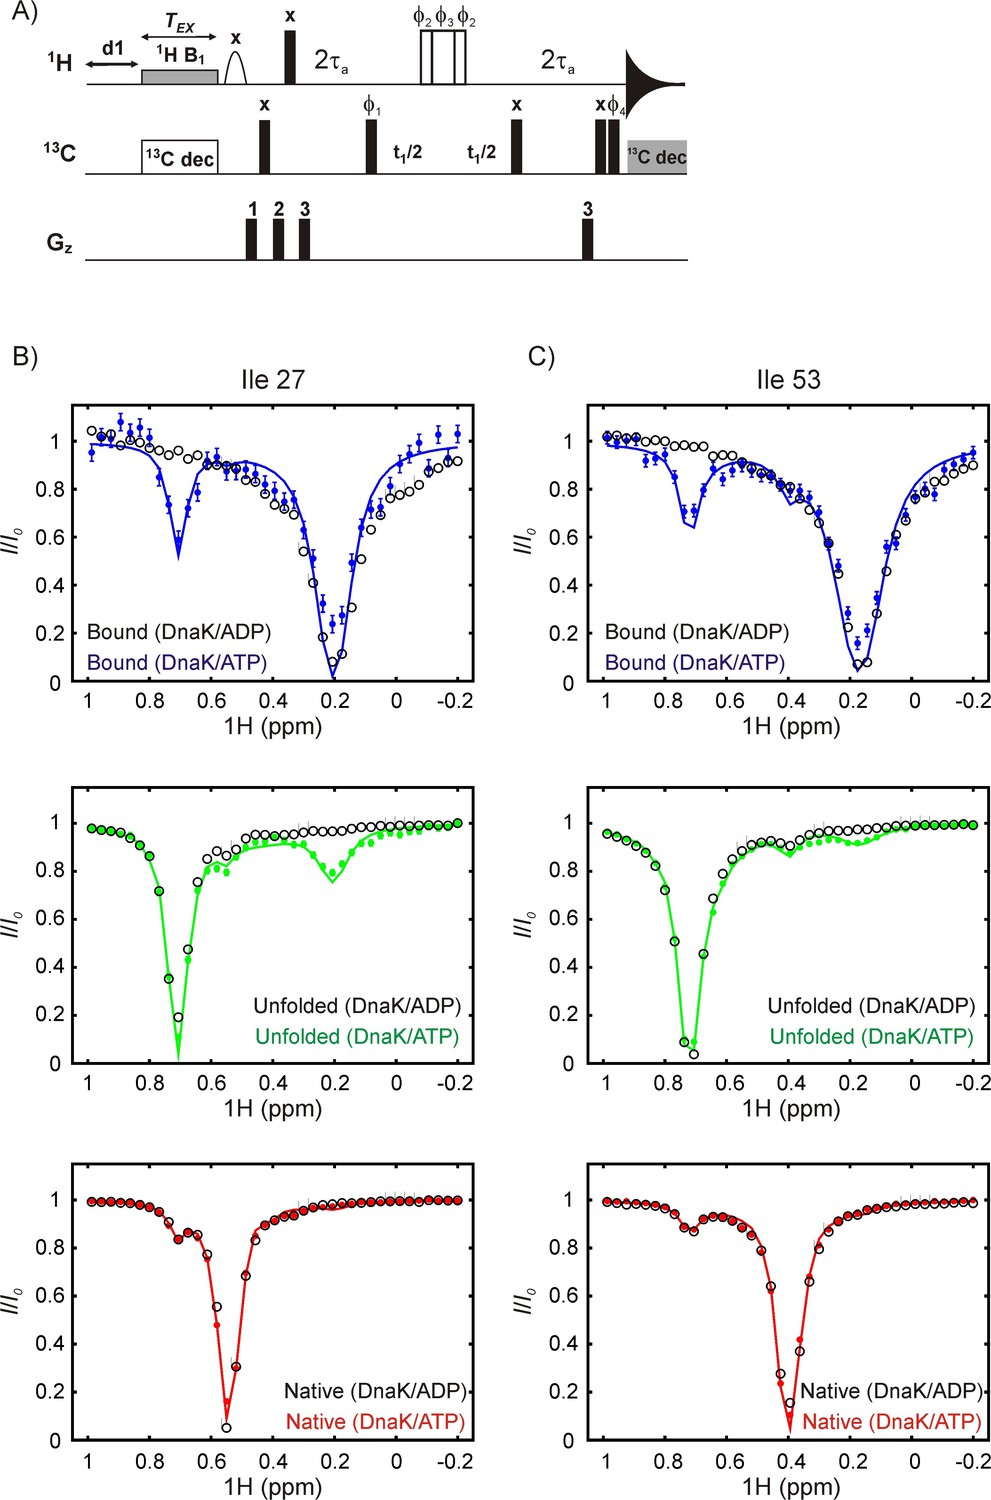
1H CEST profiles quantified from Ile 27 (A–C) and Ile 53 (D–F) native (A,D), unfolded (B,E) and DnaK-bound (C,F) resonances are highlighted. Measurements were performed on a 250 μM IM-13CH3 drkN SH3 sample containing 500 μM U-2H DnaK/ATP. Vertical dotted lines highlight 1Hδ1 chemical shifts of Ile 27 (A–C) or Ile 53 (D–F) in the following conformations: native (red), unfolded (green), bound with Ile 27 at position 0 of the DnaK binding cleft (blue, left hand side) and bound with Ile 53 at position 0 (cyan, right hand side). The vertical blue line in panel F and the vertical cyan line in panel C are drawn at 1H chemical shifts of Ile 53 (where Ile 27 is at the 0 position) and Ile 27 (where Ile 53 is at the 0 position), respectively. These shifts are obtained from the fit. Solid curves are fits of the data to the four-state model depicted in Figure 7.
Figure 6—figure supplement 1
DrkN binding to DnaK/ATP but not to DnaK/ADP can be detected by 1H CEST.
(A) Pulse sequence for measuring methyl 1H CEST data. All 1H and 13C pulses are applied at the highest possible power levels in the centers of the methyl spectral regions with the exception of (i) the 1H CEST element where the position of the weak B1 field (~20 Hz) is varied in each 2D data set, (ii) the 6.9 ms E-BURP1 pulse (Geen and Freeman, 1991) that, in concert with gradient 1 removes residual water, (iii) the 2 kHz 90x-240y-90x 13C decoupling sequence during the CEST element (Freeman et al., 2011; Vallurupalli et al., 2012), and (iv) the 1.25 kHz WALTZ-16 decoupling element (Shaka et al., 1983) during acquisition. The 180o 1H pulse in the middle of the t1 period was applied using a composite 90ϕ2-240ϕ3-90ϕ2 scheme (Freeman et al., 2011). The delay τa was set to be 1.8 ms. The phase cycle is: ϕ1 = (x,–x), ϕ2 = (x,x,y,y,–x,–x,–y,–y), ϕ3 = (y,y,–x,–x,–y,–y,x,x), ϕ4 = (x,x,–x,–x) and rec = (x,–x,–x,x). Gradient powers were set to 10 (1), 20 (2) and 30 (3) % of the maximum and applied with durations of 1, 1 and 0.5 ms, respectively. (B,C) Overlays of 1H CEST profiles for Ile 27 (B) and Ile 53 (C) acquired on samples of 250 μM IM-13CH3 drkN SH3 containing 500 μM U-2H DnaK/ADP (black) or 500 μM U-2H DnaK/ATP (blue, green or red). The top, middle and bottom CEST profiles are derived from DnaK-bound, unfolded or native state resonances. The coloured CEST profiles are repetitions of data shown in Figure 6. The minor dips reporting on binding of drkN SH3 to DnaK/ATP at ~0.75 ppm (top blue, bound state profiles) or at ~0.2 ppm (middle green, unfolded state profiles) are absent in the corresponding data from SH3 bound to DnaK/ADP, demonstrating that the exchange is too slow to be detected on the CEST timescale and consistent with the slow release (~0.001 s−1, 25°C) rate constants for typical substrate-DnaK/ADP binding observed in the literature (Mayer and Bukau, 2005; Pierpaoli et al., 1998).
Figure 6—figure supplement 2
DrkN SH3 binding to DnaK/ATP can be detected using magnetization exchange experiments.
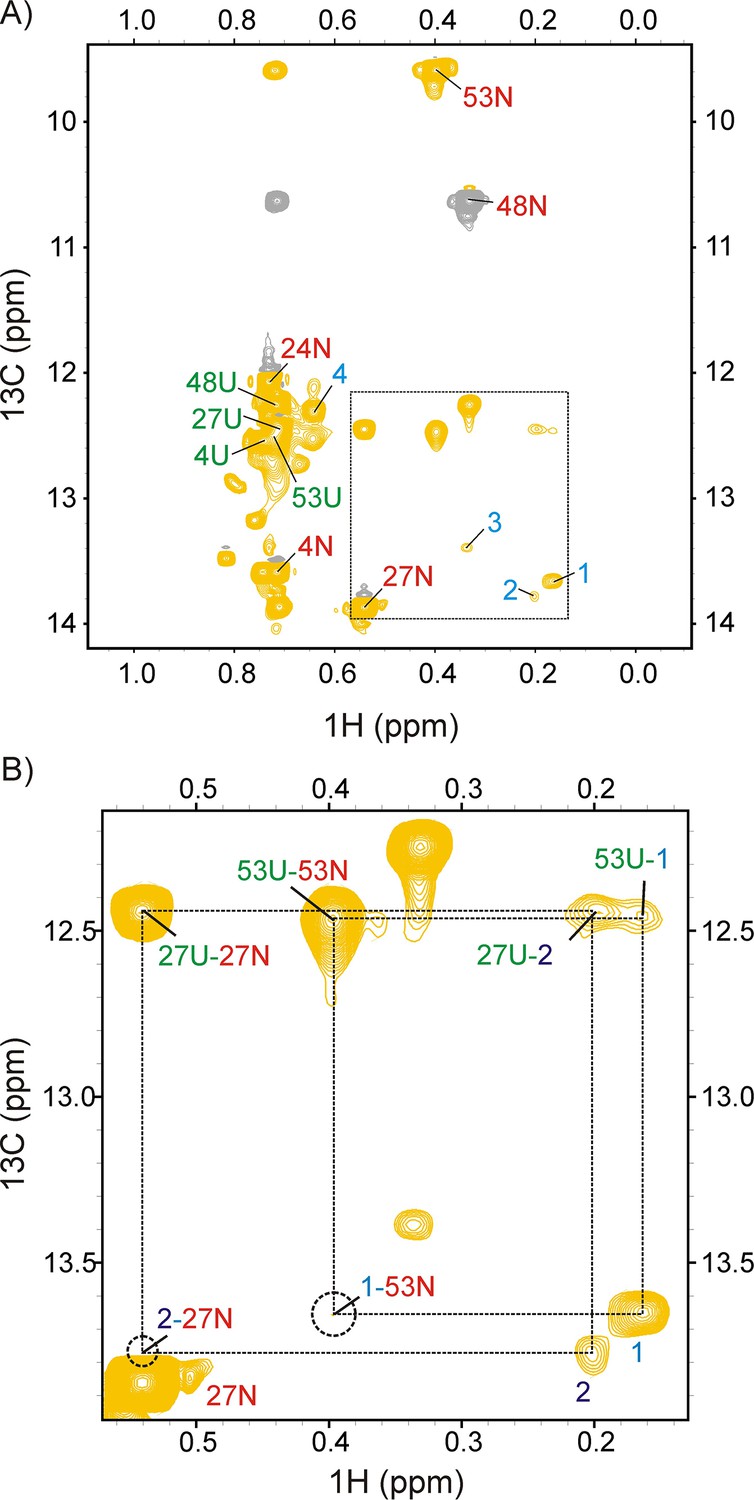
(A) zz-exchange spectrum of a sample comprising 250 μM ILVM-13CH3 drkN SH3 and 500 μM DnaK/ATP acquired using a mixing time of 200 ms. Diagonal native (N), unfolded (U) and bound (1-4) resonances of drkN SH3 are indicated on the spectrum. Negative contours are coloured grey. The Ile 48 native state peak is aliased. (B) Expansion of the region within the dotted lines in panel A with assignments for both diagonal and cross-peaks shown on the plot. Only positive contours are shown for clarity. The chemical shifts of the cross-peaks can be used to assign 1 to Ile 53 and 2 to Ile 27. The positions of cross-peaks 1–53N and 2–27N connecting the bound resonances 1 and 2 to their respective native states are denoted by dotted circles. 1–53N is visible at the noise level, while 2–27N cannot be distinguished from the intensity of 27N at lower contour levels.
Figure 7 with 2 supplements

Binding model for the drkN SH3 – DnaK complex, along with parameter estimates and flux along different pathways.
(A) Four-state model used for fitting 1H CEST data, comprising native (N), unfolded (U) and two DnaK-bound states, B1 and B2, corresponding to Ile 53 and Ile 27 at the central DnaK binding groove. Populations of the different states as well as rate constants for their interconversion are indicated. Mean values of parameters and errors are obtained as the averages and standard deviations from a bootstrap procedure. Values of kex are shown (), where kUX is an apparent pseudo-first order rate constant () and [L] is the equilibrium concentration of free ligand (DnaK in this case). Directions of major fluxes for binding at sites 1 (Ile 53) and 2 (Ile 27) are indicated. Histograms showing flux values for the UUK, and pathways leading to the formation of the two bound states B1 (B) and B2 (C).
Figure 7—figure supplement 1
Estimating the reliability of model parameters obtained by fitting 1H CEST data for SH3-DnaK binding to a four-state model.
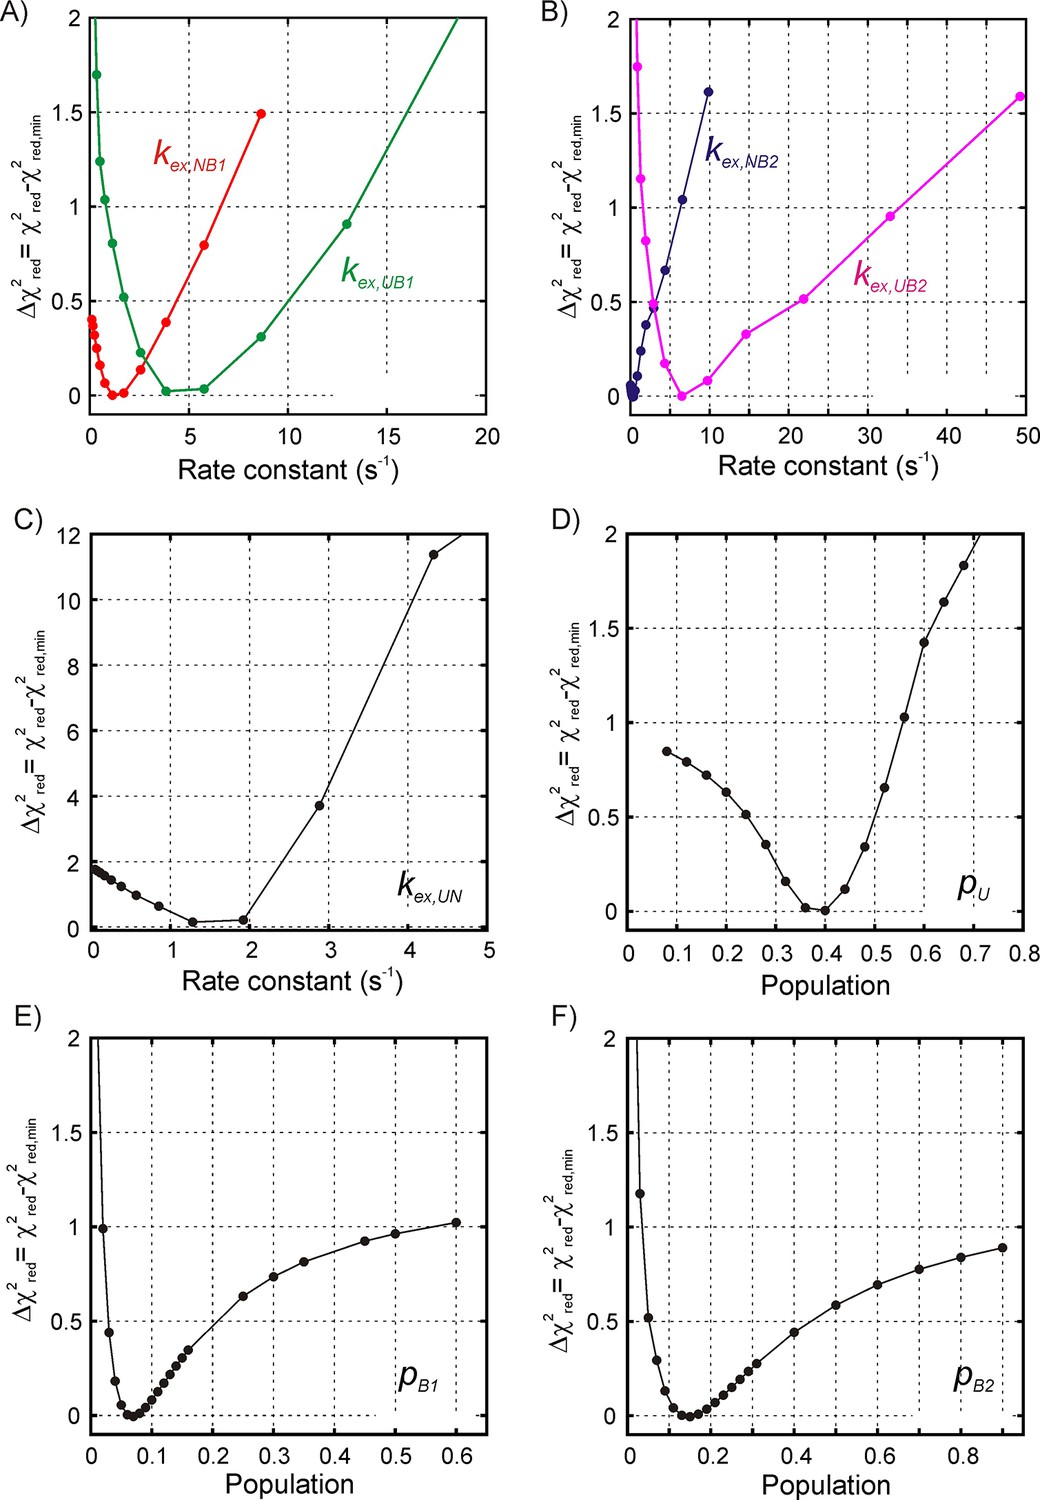
1D reduced χ2 curves for the binding/release exchange rate constants (A) kex,NB1, kex,UB1, and (B) kex,NB2, kex,UB2, as well as for the drkN SH3 U-N interconversion, kex,UN (C) obtained by fixing the target rate constant to a specific value during the fitting routine and calculating the reduced χ2 value. In the above the rate , where . The 1D reduced χ2 curves for all five rate constants show that there is a relatively steep penalty when the kex value is varied so that the rate constant values can be obtained reliably from the fit. On the other hand, 1D reduced χ2 curves for the populations of the unfolded state (D) and the two bound states (E, B1; F, B2) are shallow across the entire range of allowed population values, indicating that these populations cannot be reliably estimated from fitting the available data. The y-axis for all plots shows the difference between the reduced χ2 value obtained by fixing the target parameter at the specific value and the reduced χ2 value obtained by floating all the parameters.
Figure 7—figure supplement 2
Estimating parameter distributions using a bootstrapping procedure described in Materials and methods.
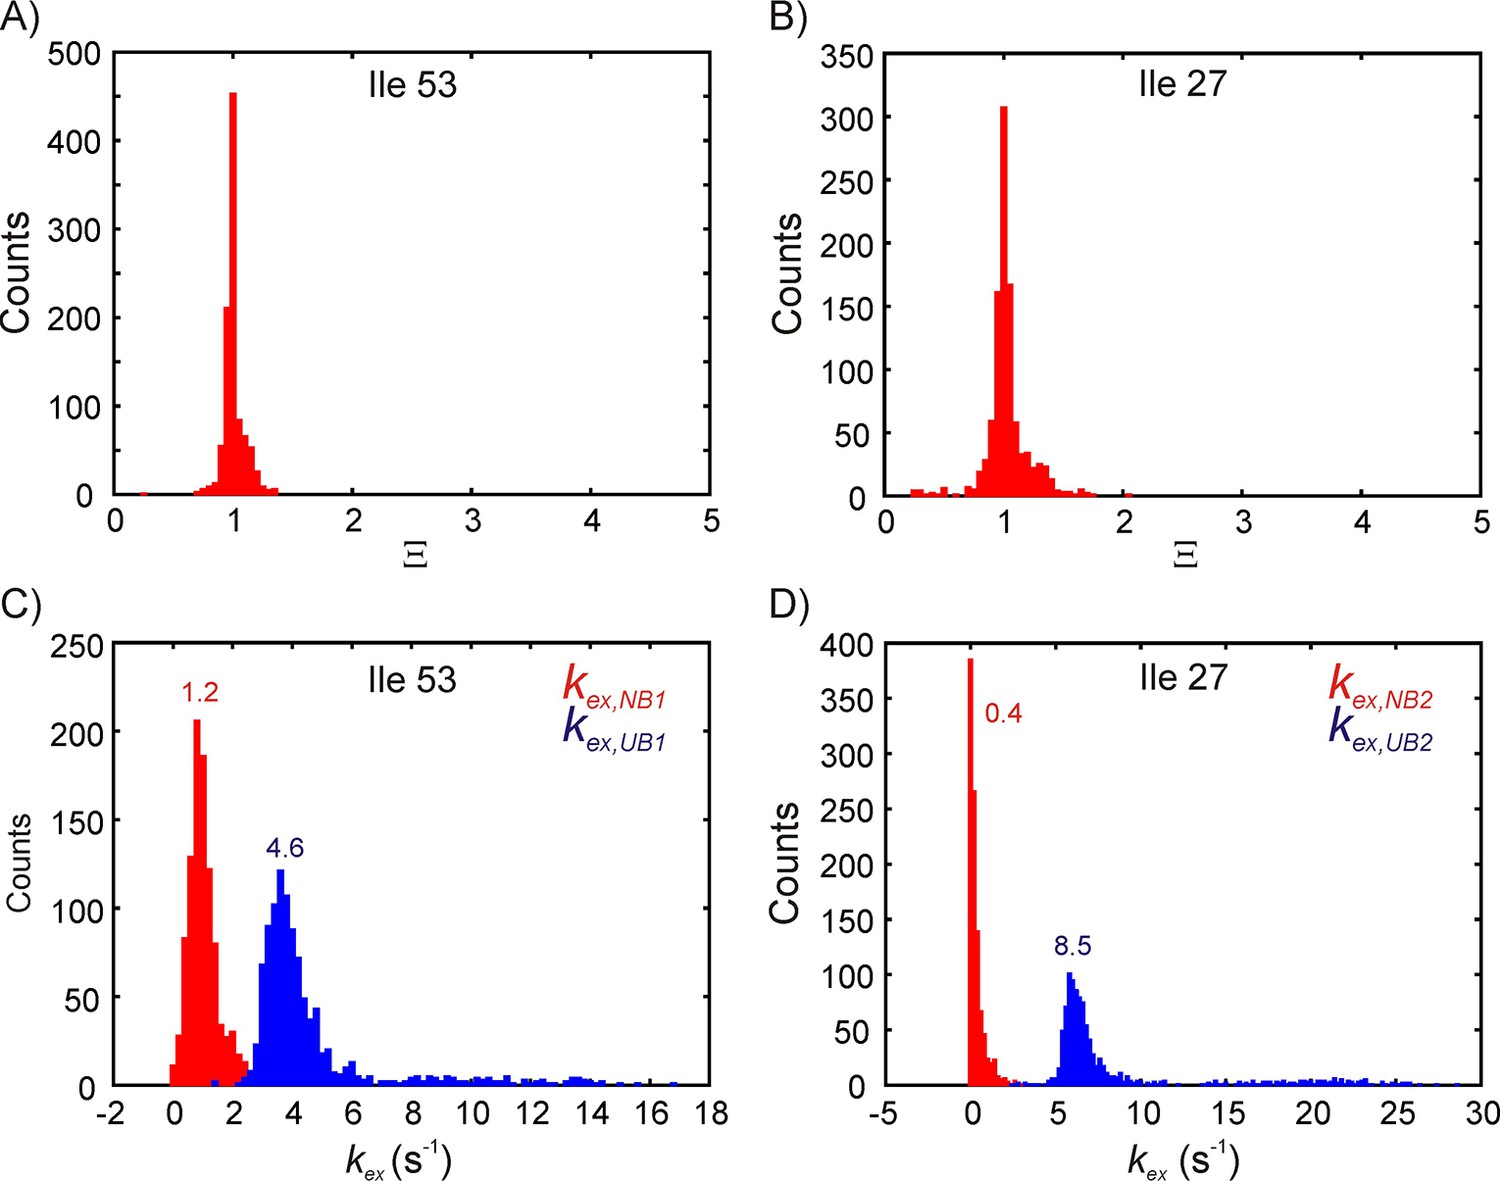
Distribution of Ξ (A,B) and kex,NB, kex,UB (C,D) for bound state B1 (A,C) and B2 (B,D). The means of the rate constant distributions are indicated on the plots in panels C and D. Note that the mean and standard deviation for kex,NB2 obtained from the bootstrap procedure may not be reliable because the distribution is one-sided.
Figure 8
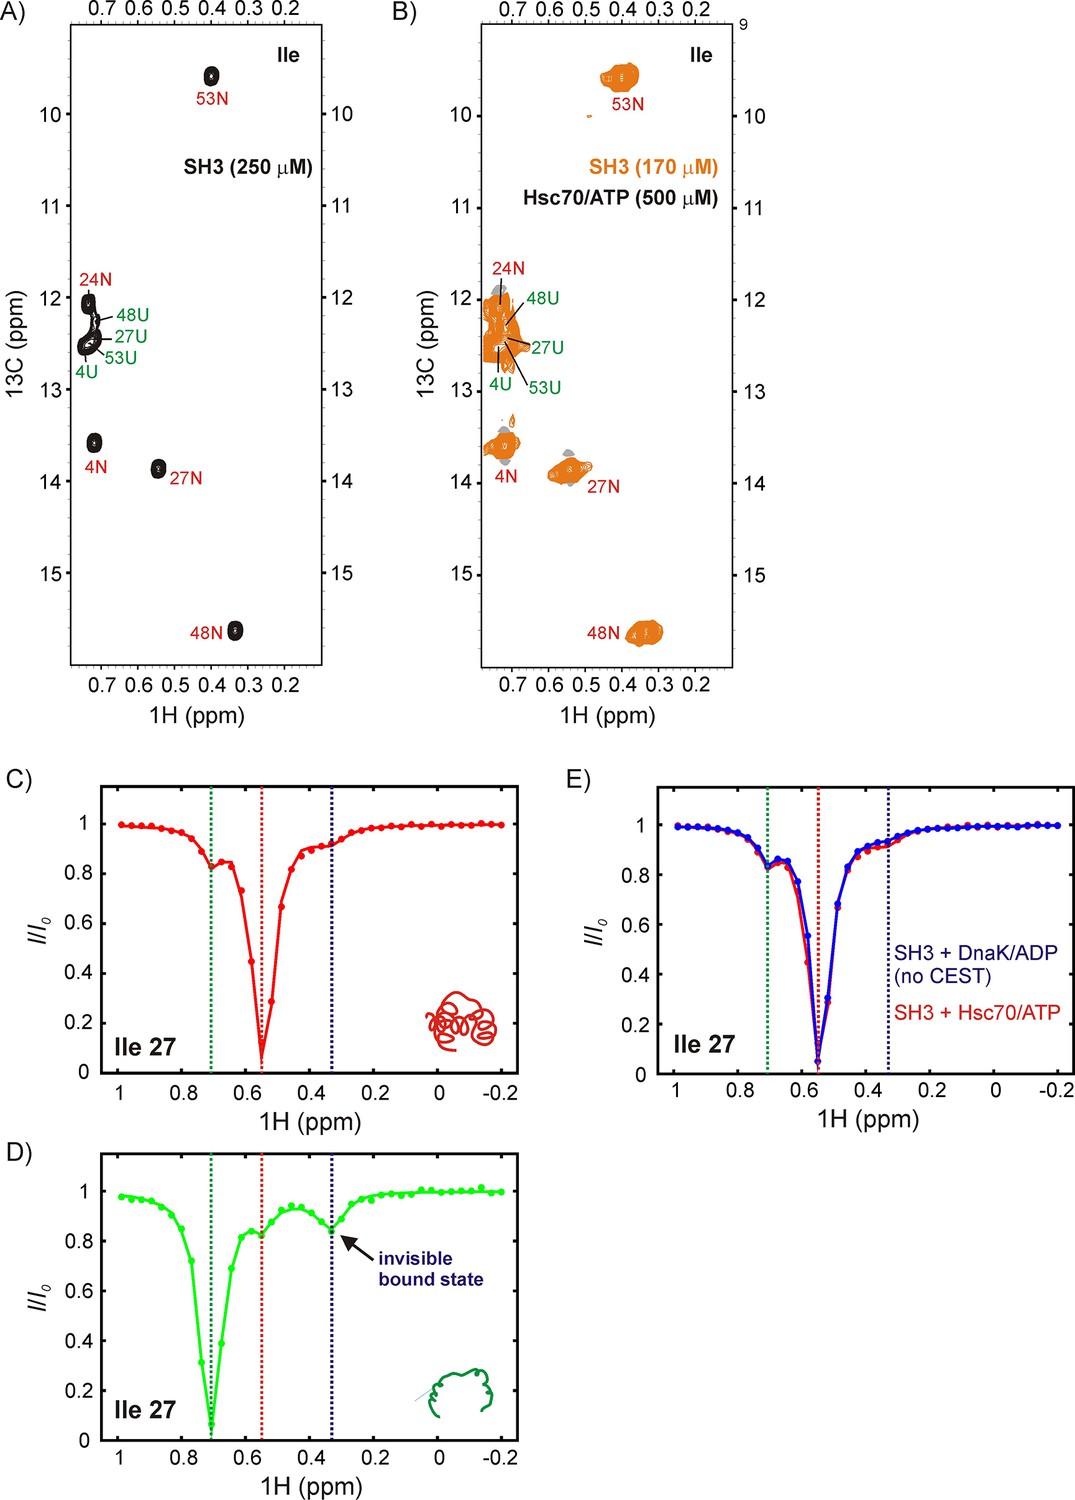
DrkN SH3 binds Hsc70 through the unfolded state.
13C-1H HMQC spectra of (A) 250 μM IM-13CH3 drkN SH3 without Hsc70 and (B) 170 μM IM-13CH3 drkN SH3 with 500 μM U-2H Hsc70/ATP. New peaks do not appear upon addition of Hsc70/ATP. Ile 27 1Hδ CEST profiles from native (C) and unfolded (D) drkN SH3 in the presence of Hsc70/ATP acquired using the sample from panel B. The unfolded state CEST profile (panel D) shows a minor dip at the native state chemical shift (~0.55 ppm), but also a prominent second minor dip at ~0.33 ppm that arises from the binding of drkN SH3 to Hsc70/ATP. While the existence of the bound state cannot be discerned from the spectrum in panel B, binding is clearly revealed in the CEST profile. (E) The small dip observed in the native state CEST profile (panel C, drkN SH3 +Hsc70/ATP) at ~0.33 ppm is also present in the native state CEST profile of drkN SH3 +DnaK/ADP where binding/release to DnaK/ADP is too slow to generate exchange dips (see Figure 6—figure supplement 1B). This dip arises from cross-relaxation of Ile 27 with the nearby Ile 48 in the native state.
Tables
Key resources table
| Reagent type (species) or resource | Designation | Source or reference | Identifiers | Additional information |
|---|---|---|---|---|
| Gene (Gallus gallus) | R17 | NA | Uniprot ID: P07751 | R17 is the 17th repeat of spectrin alpha chain |
| Gene (Drosophila melanogaster) | SH3 | NA | Uniprot ID: Q08012 | SH3 is the N-terminal SH3 domain of the Enhancer of Sevenless 2B |
| Gene (Escherichia coli) | DnaK | NA | Uniprot ID: P0A6Y8 | Hsp70 chaperone from E.coli |
| Gene (Escherichia coli) | GrpE | NA | Uniprot ID: P09372 | GrpE co-chaperone from E.coli |
| Gene (Homo sapiens) | Hsc70 | NA | Uniprot ID: P11142 | Heat shock cognate 71 kDa protein |
| Recombinant DNA reagent | pET29b(+) - R17* | This paper | R17* is L90A R17, plasmid has tags etc. | |
| Recombinant DNA reagent | pET28 - SH3 | This paper | Plasmid has tags etc. | |
| Recombinant DNA reagent | DnaK | DOI: 10.1073/pnas.1508504112 | ||
| Recombinant DNA reagent | GrpE | DOI: 10.1073/pnas.1508504112 | ||
| Recombinant DNA reagent | Hsc70 | DOI: 10.1073/pnas.1508504112 | ||
| Software, algorithm | NMRPipe | DOI: 10.1007/BF00197809 | ||
| Software, algorithm | Sparky | https://www.cgl.ucsf.edu/home/sparky/ | ||
| Software, algorithm | FuDA | http://www.biochem.ucl.ac.uk/hansen/fuda/ | ||
| Software, algorithm | ChemEx | https://github.com/gbouvignies/chemex |
Additional files
-
Transparent reporting form
- https://doi.org/10.7554/eLife.32764.018
Download links
A two-part list of links to download the article, or parts of the article, in various formats.
Downloads (link to download the article as PDF)
Open citations (links to open the citations from this article in various online reference manager services)
Cite this article (links to download the citations from this article in formats compatible with various reference manager tools)
Conserved conformational selection mechanism of Hsp70 chaperone-substrate interactions
eLife 7:e32764.
https://doi.org/10.7554/eLife.32764


