Developmental evolution of the forebrain in cavefish, from natural variations in neuropeptides to behavior
- Université Paris Sud, CNRS UMR9197, Université Paris-Saclay, Avenue de la terrasse, France
Figures
Figure 1 with 7 supplements
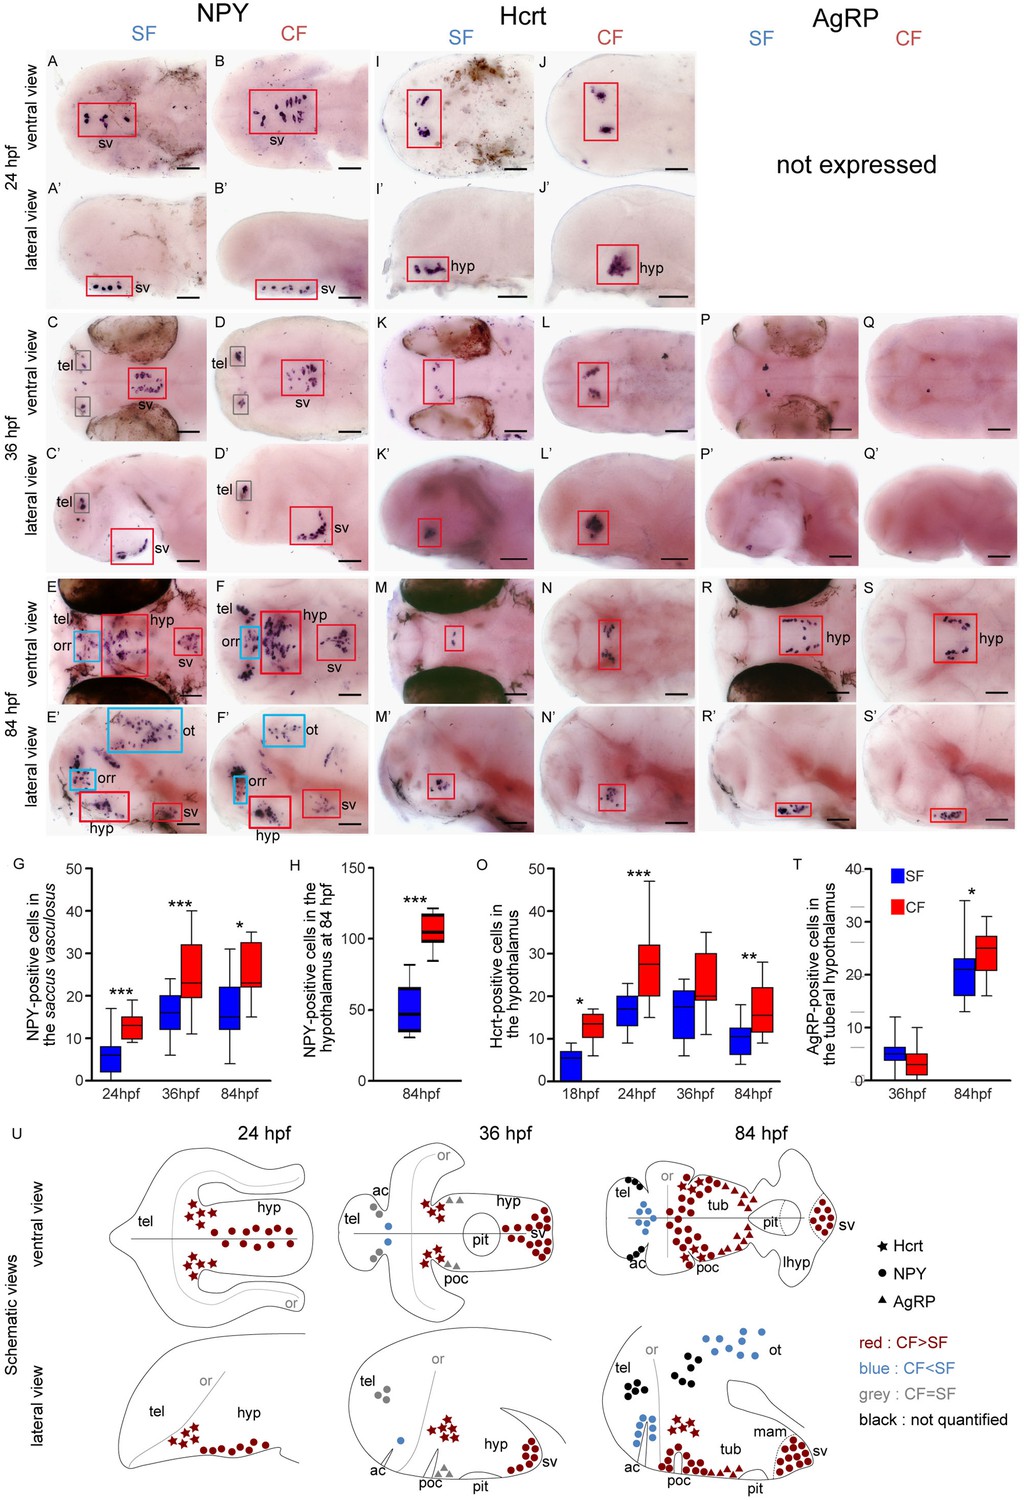
Comparative development of NPY, Hypocretin and AgRP neurons in SF and CF.
(A–S’) Photographs of embryonic brains after in situ hybridization for NPY, Hypocretin and AgRP at 24, 36, and 84 hpf. The stages, the lateral or ventral orientations, and the probes are indicated. Red squares and blue squares indicate peptidergic clusters with higher numbers of neurons in CF or in SF, respectively. For this and the following figures, raw data including the number of embryos examined are given in Supplementary file 1. (G, H, O, T) Quantification and time-course of cell numbers in specific clusters. Mann-Whitney tests. (U) Anatomical interpretation of peptidergic patterns and time-course of appearance. Hcrt (stars), NPY (circles) and AgRP (triangles) neurons are reported on schematic embryonic brains, in ventral or lateral views. A color code indicates higher numbers of neurons in CF (red) or in SF (blue), or equivalent numbers (grey). Black clusters were not counted. ac, anterior commissure; hyp, hypothalamus; mam; mamilary hypothalamus; or, optic recess; orr, optic recess region; ot, optic tectum; pit, pituitary; poc, post-optic commissure; tel, telencephalon; tub, tuberal hypothalamus; sv, saccus vasculosus.
Figure 1—figure supplement 1
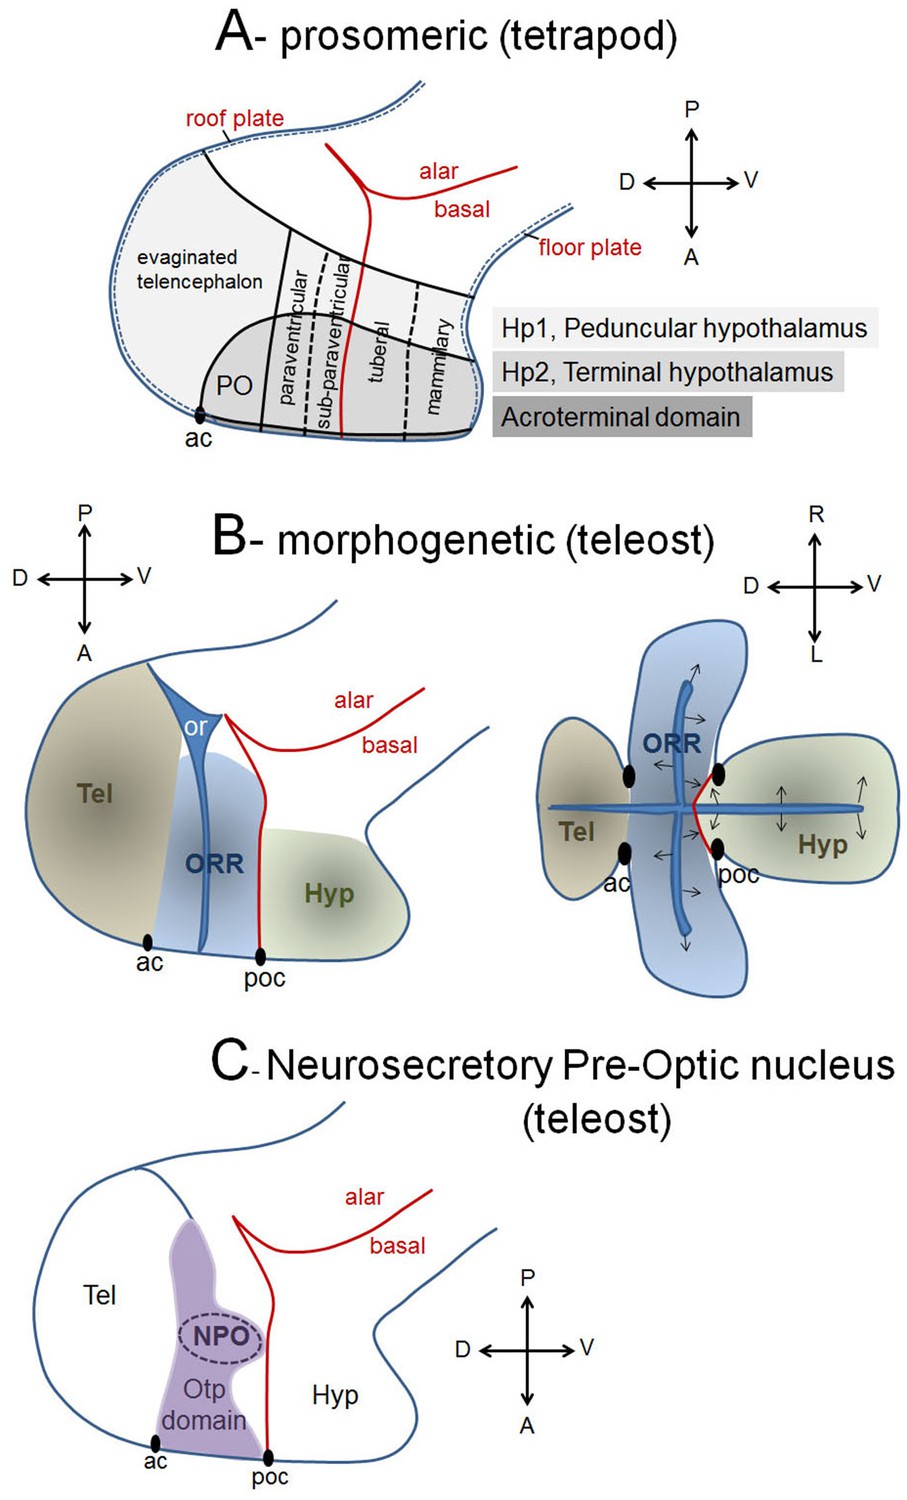
Models and interpretations of prosencephalic development.
(A) The updated prosomeric model interprets neuroepithelial domains with transverse and longitudinal boundaries according to the neuraxes (antero-posterior given by the alar/basal boundary; dorso-ventral orthogonal to the former, between the roof and the floor plates). The two hypothalamo-telencephalic prosomeres (light and medium grey) and their subdivisions are indicated, as well as the newly proposed acroterminal domain (dark grey). PO, preoptic area; ac, anterior commissure. (B) In teleosts, a morphogenetic interpretation of forebrain regionalization suggests that morphogenesis (and neurogenesis) follows the ventricular organization and forms three masses: the telencephalon (tel), the optic recess region (ORR) and the hypothalamus (hyp). Arrows illustrate the centrifuge pattern of neurogenesis, from the ventricular surface to the mantle. ac, anterior commissure; poc, postoptic commissure. (C) The teleost NPO is a dense clustering of neuropeptidergic neurons (AVT, IT, CRH, CCK, enk, VIP, neurotensin, somatostatin) located inside the Otp transcription factor expression domain (purple). A homology relationship is proposed between the NPO and the mammalian PVN (paraventricular nucleus in the alar hypothalamus, see A).
Figure 1—figure supplement 2

Onset of expression of Hcrt and POMCb around 18hpf.
Photographs of embryonic brains after in situ hybridization for Hcrt or POMCb at 18hpf in SF, in ventral views.
Figure 1—figure supplement 3
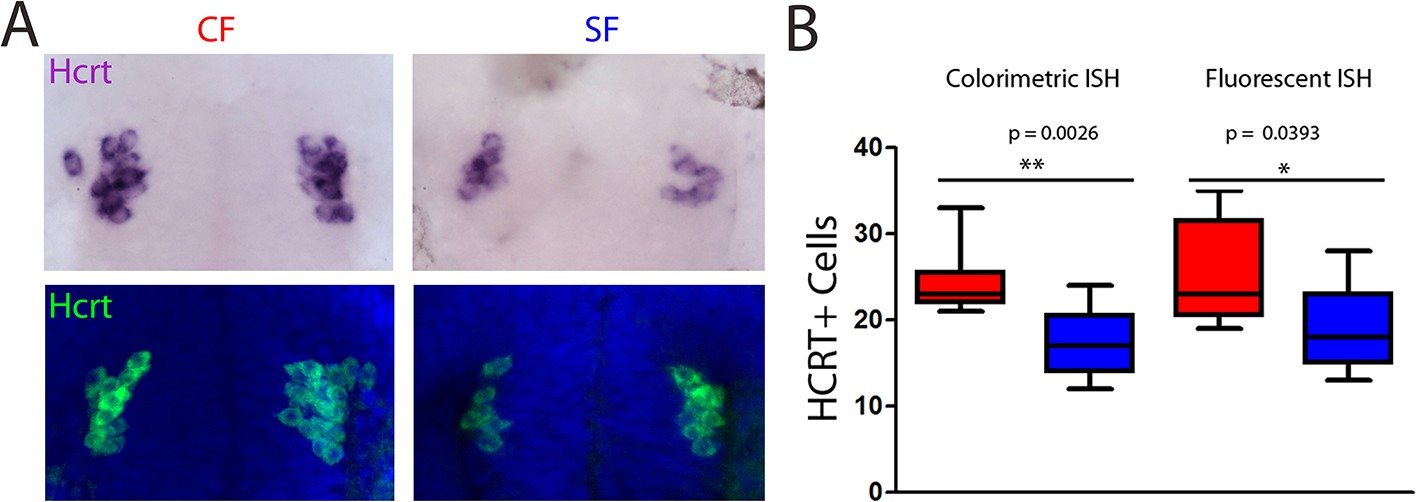
Comparison of colorimetric versus fluorescent in situ hybridization results.
(A) Photographs of embryonic brains after in situ hybridization for Hcrt at 24hpf in CF (left) and SF (right), after colorimetric (top) or fluorescent (bottom) in situ hybridization, in ventral views. (B) Quantification of cell numbers, compared between the two methods. The cell counts are identical and the difference between the two morphs is the same with the two types of revelations. Mann-Whitney tests.
Figure 1—video 1
Comparison of colorimetric versus fluorescent in situ hybridization results.
Four ‘movies’ are provided to assess the method for quantification of cell numbers. These movies show how cell counts were performed by travelling through stacks of photographs. Cells can be accurately counted in the depth of the brain by changing the focus (colorimetric) or the focal plane (fluorescent). This movie shows colorimetric in situ hybridization for Hcrt on a 24hpf CF specimen.
Figure 1—video 2
Comparison of colorimetric versus fluorescent in situ hybridization results.
This movie shows colorimetric in situ hybridization for Hcrt on a 24hpf SF specimen.
Figure 1—video 3
Comparison of colorimetric versus fluorescent in situ hybridization results.
This movie shows fluorescent in situ hybridization for Hcrt on a 24 hpf CF specimen.
Figure 1—video 4
Comparison of colorimetric versus fluorescent in situ hybridization results.
This movie shows fluorescent in situ hybridization for Hcrt on a 24 hpf SF specimen.
Figure 2 with 2 supplements
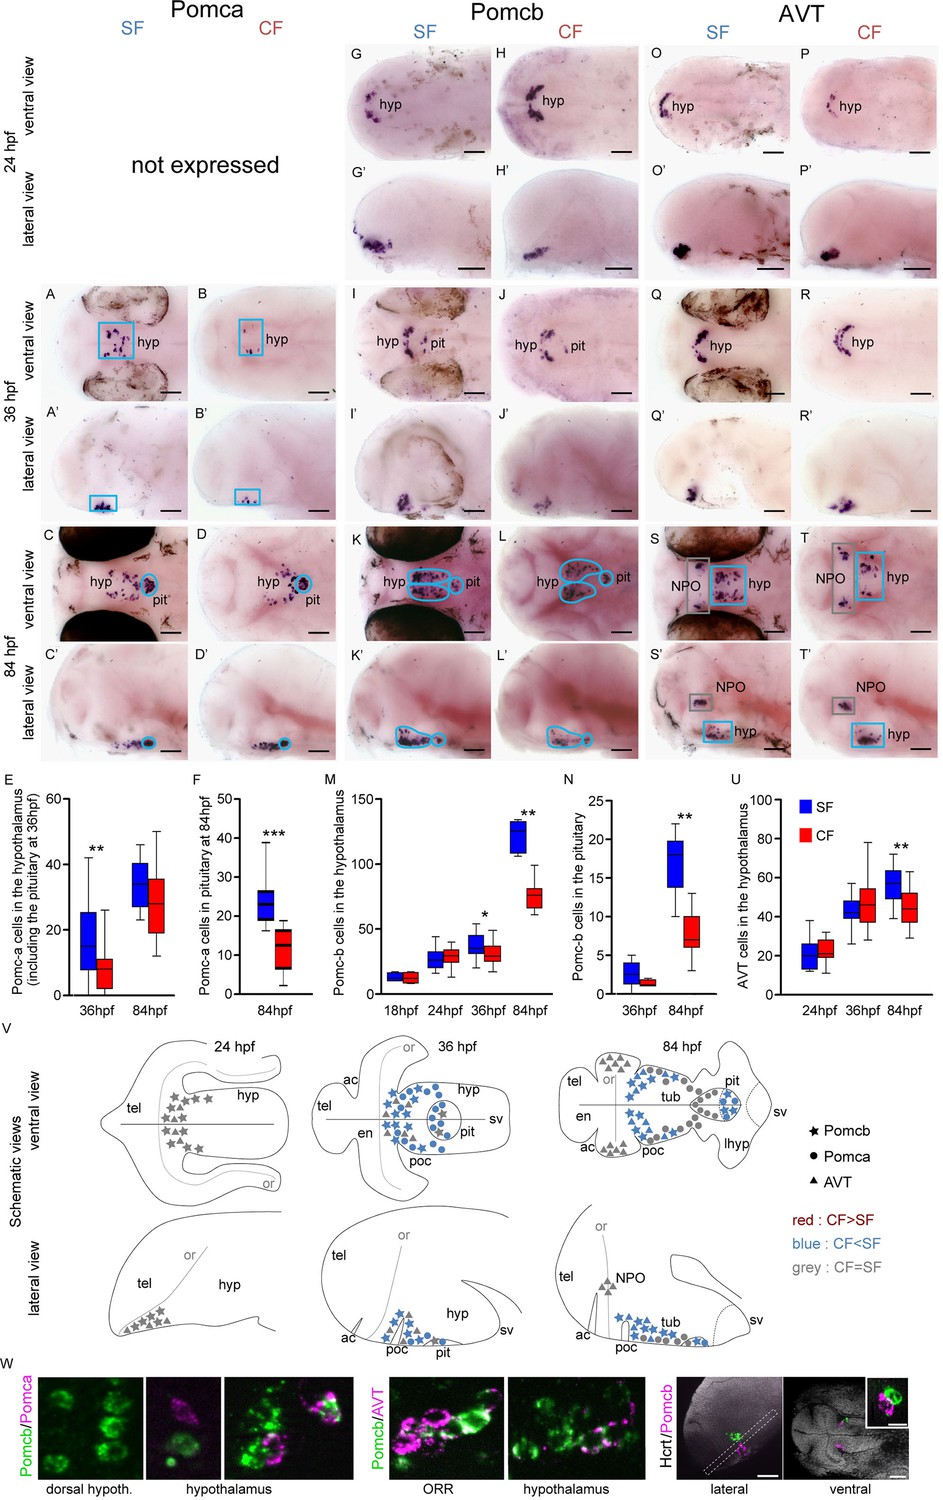
Comparative development of POMCa, POMCb and AVT neurons in SF and CF.
(A–T’) Photographs of embryonic brains after in situ hybridization for POMCa, POMCb and AVT at 24, 36, and 84 hpf. The stages, the lateral or ventral orientations, and the probes are indicated. Blue squares indicate peptidergic clusters with higher numbers of neurons in SF. (E, F, M, N, U) Quantification and time-course of cell numbers in specific clusters. Mann-Whitney tests. (V) Anatomical interpretation of peptidergic patterns and time-course of appearance. POMCb (stars), POMCa (circles) and AVT (triangles) neurons are reported on schematic embryonic brains, in ventral or lateral views. A color code indicates higher numbers of neurons in CF (red) or in SF (blue), or equivalent numbers (grey). ac, anterior commissure; hyp, hypothalamus; NPO, neurosecretory preoptic nucleus; or, optic recess; orr, optic recess region; pit, pituitary; poc, post-optic commissure; tel, telencephalon; tub, tuberal hypothalamus; sv, saccus vasculosus. (W) Confocal pictures after double fluorescence in situ hybridization for POMCa/POMCb (left), POMCb/AVT (middle) and Hcrt/POMCb (right), showing colocalisation or lack of colocalisation of the indicated neuropeptides.
Figure 2—figure supplement 1

Comparative development of IT, CART and MCH neurons in SF and CF.
(A–R’) Photographs of embryonic brains after in situ hybridization for IT, CART and MCH at 24, 36, and 84 hpf. The stages, the lateral or ventral orientations, and the probes are indicated. Red squares and blue squares indicate peptidergic clusters with higher numbers of neurons in CF or in SF, respectively. Grey squares indicate equal numbers. (G, N, S) Quantification and time-course of cell numbers in specific clusters. Mann-Whitney tests. (T) Anatomical interpretation of peptidergic patterns and time-course of appearance. MCH (stars), CART3 (circles) and IT (triangles) neurons are reported on schematic embryonic brains, in ventral or lateral views. A color code indicates higher numbers of neurons in CF (red) or in SF (blue), or equivalent numbers (grey). Black clusters were not counted. ac, anterior commissure; hyp, hypothalamus; mam, mamilary hypothalamus; NPO, neurosecretory preoptic nucleus; or, optic recess; orr, optic recess region; ot, optic tectum; pit, pituitary; poc, post-optic commissure; tel, telencephalon; tub, tuberal hypothalamus; sv, saccus vasculosus. (U) Confocal pictures after double fluorescence in situ hybridization for IT (green) and Otpb (red), showing that IT neurons are located in the Otpb-expressing NPO. DAPI counterstain appears in blue.
Figure 2—figure supplement 2
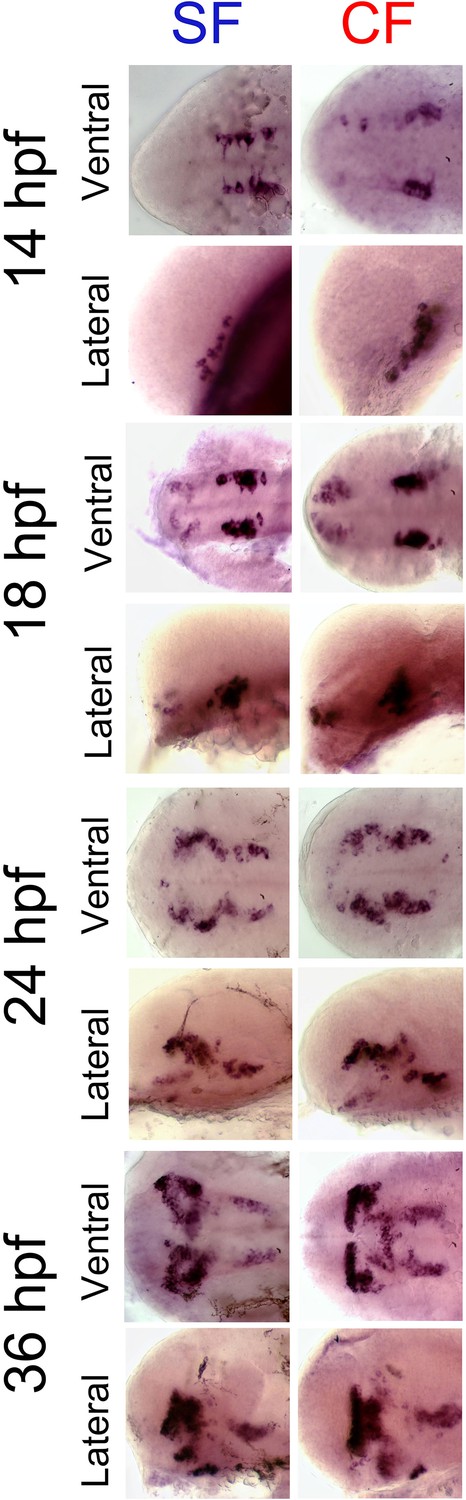
Comparative expression of otpb between 14 hpf and 36 hpf in SF and CF.
Photographs of embryonic brains after in situ hybridization for otpb at 14, 18, 24, and 36 hpf. The stages, the morph and the lateral or ventral orientations are indicated. Anterior is left.
Figure 3 with 4 supplements
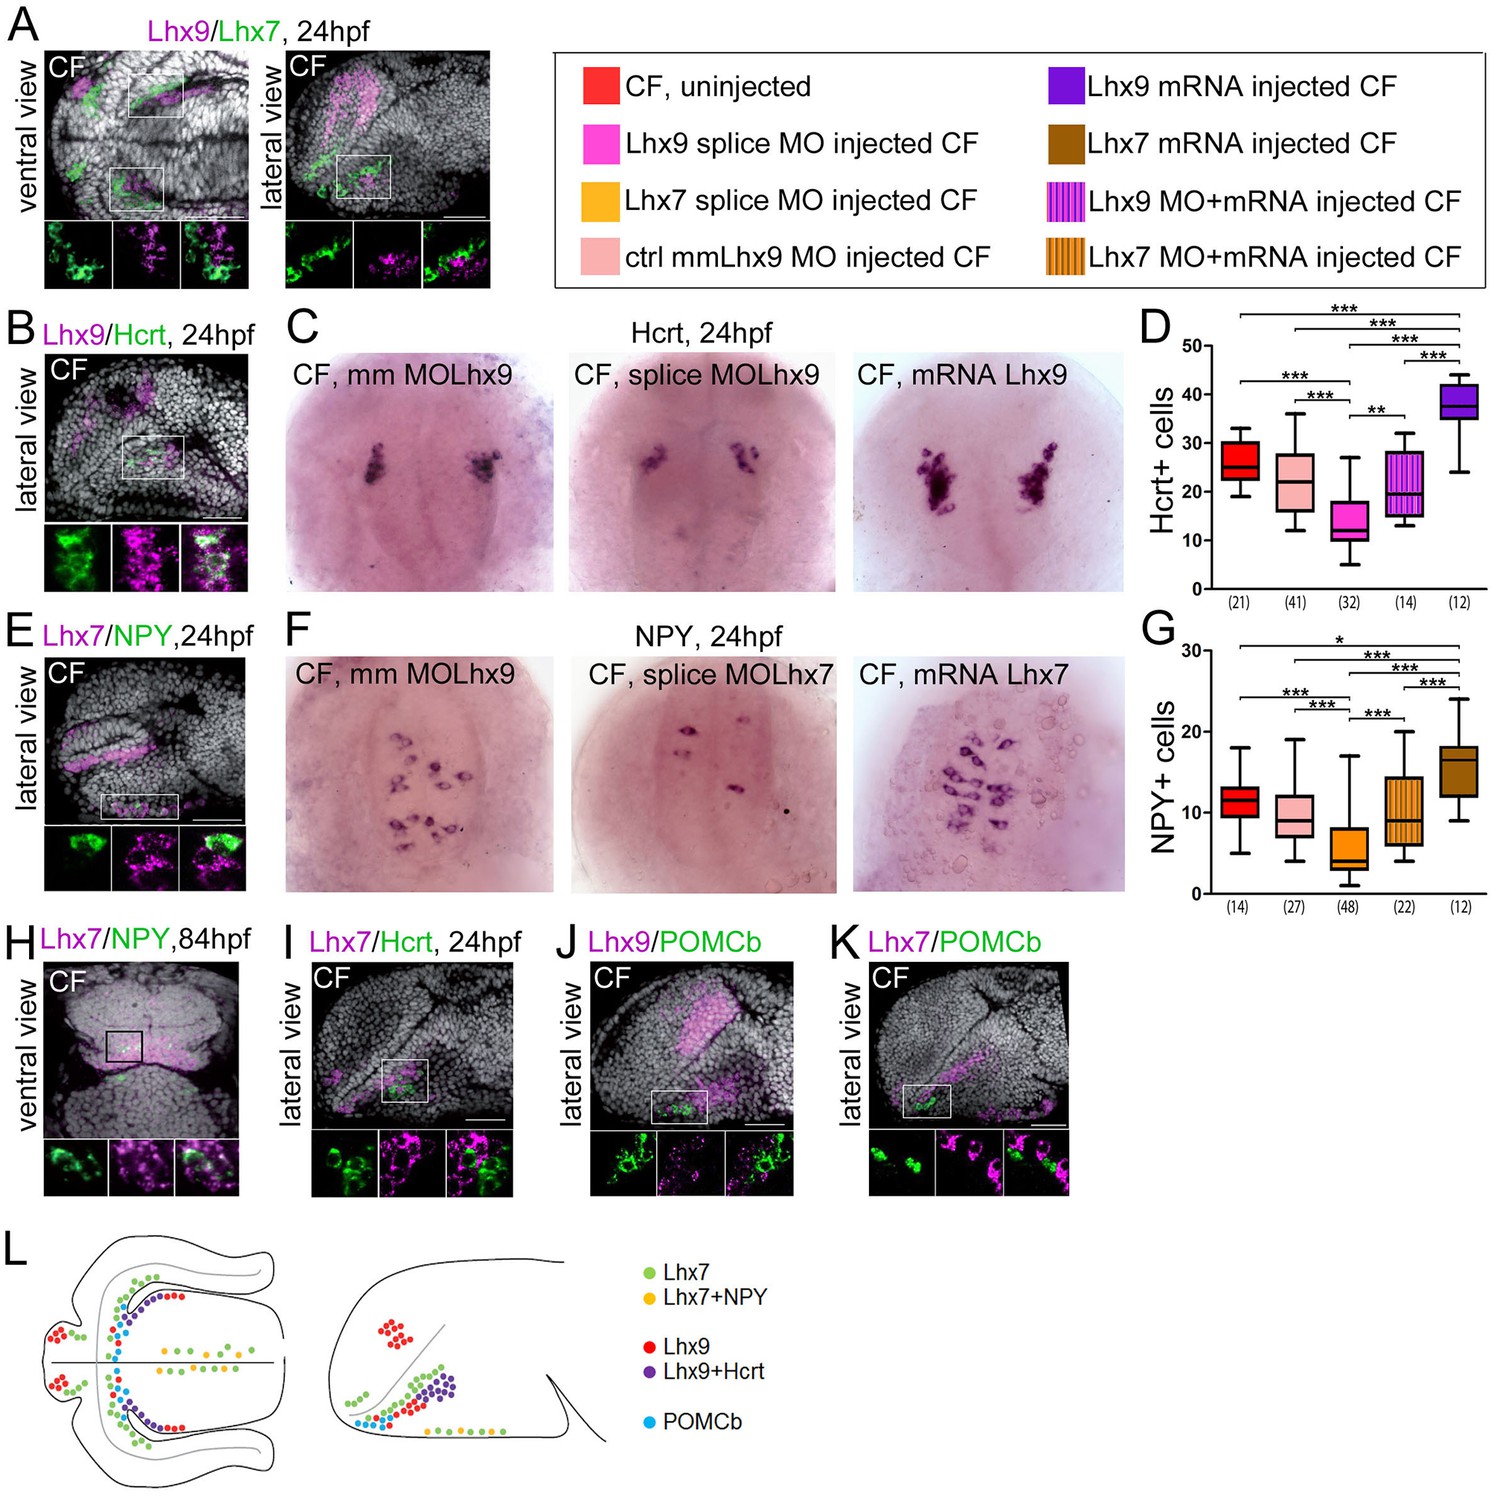
Expression and roles of Lhx7 and Lhx9 in NPY and Hypocretin neurons development.
(A, B, E and H–K) Confocal pictures after double fluorescence in situ hybridization in CF (one probe in magenta, the other in green, as indicated) with DAPI counterstain (grey nuclei). On all panels, the orientation, the stage, and the probes are indicated. The top photos show low magnification pictures of the whole forebrain, and the bottom photos show high power views for assessment of co-localization. (C) Photographs of control mismatch (mm), Lhx9 e1-i1 splice MO and Lhx9 mRNA-injected CF embryos after Hcrt in situ hybridization at 24 hpf. (D) Quantification of the number of Hcrt cells in control mismatch (pale red, 0.48 mM), Lhx9 splice MO-injected (pink, 0.48 mM), Lhx9 mRNA (purple, 200 ng/μl) or Lhx9 splice MO + Lhx9 mRNA (striped) injected CF. Un-injected CF are in red. See color code. ANOVA tests. In this and the following figures, numbers under boxplots indicate the numbers of embryos examined. (H) Photographs of control mismatch (mm), Lhx7 e4-i4 splice MO and Lhx7 mRNA-injected CF embryos after NPY in situ hybridization at 24hpf. (I,) Quantification of the number of NPY cells in control mismatch (pale red, 0.96 mM), Lhx7 splice MO-injected (orange, 0.96 mM), Lhx7 mRNA (brown, 200 ng/μl) or Lhx9 splice MO + Lhx7 mRNA (striped) injected CF. Un-injected CF are in red. See color code. ANOVA tests. (L) Summary of Lhx7/Lhx9/NPY/Hcrt/POMCb expression. A color code indicates the presence or absence of co-localization.
Figure 3—figure supplement 1
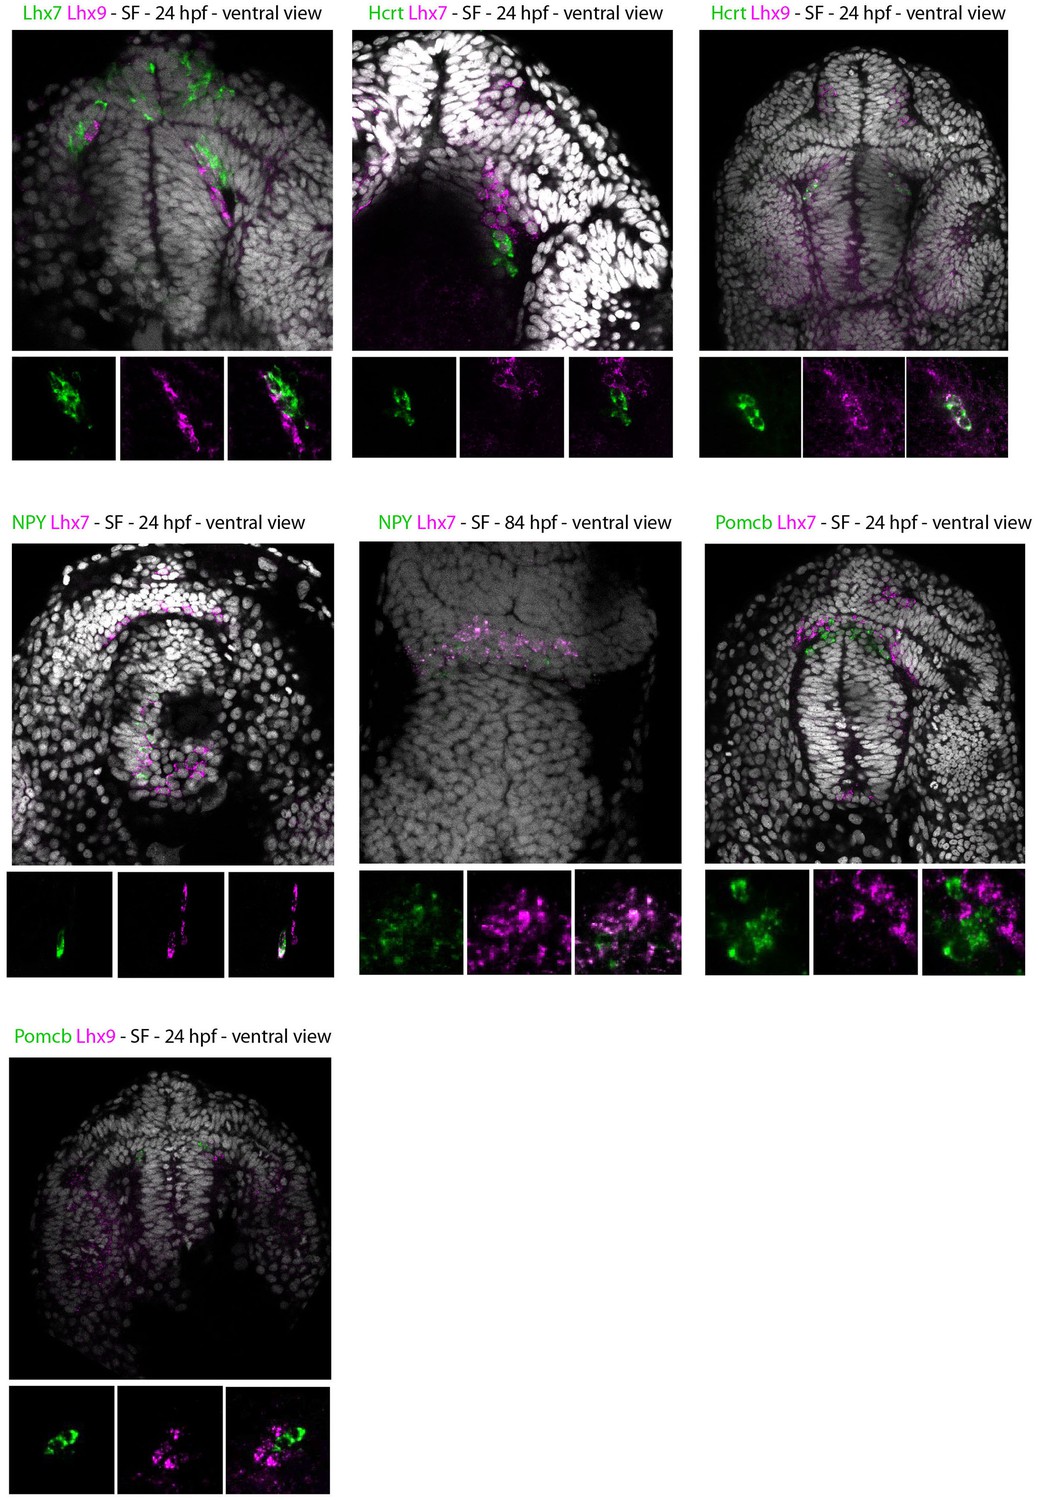
Expression of Lhx7, Lhx9, Hcrt and NPY in SF.
Confocal pictures after double fluorescence in situ hybridization (one probe in magenta, the other in green, as indicated) with DAPI counterstain (grey nuclei). All panels show SF, for comparison with CF shown on main Figure 3. The top photos show low-magnification pictures of the whole forebrain, and the bottom photos show high-power views for assessment of co-localization.
Figure 3—figure supplement 2
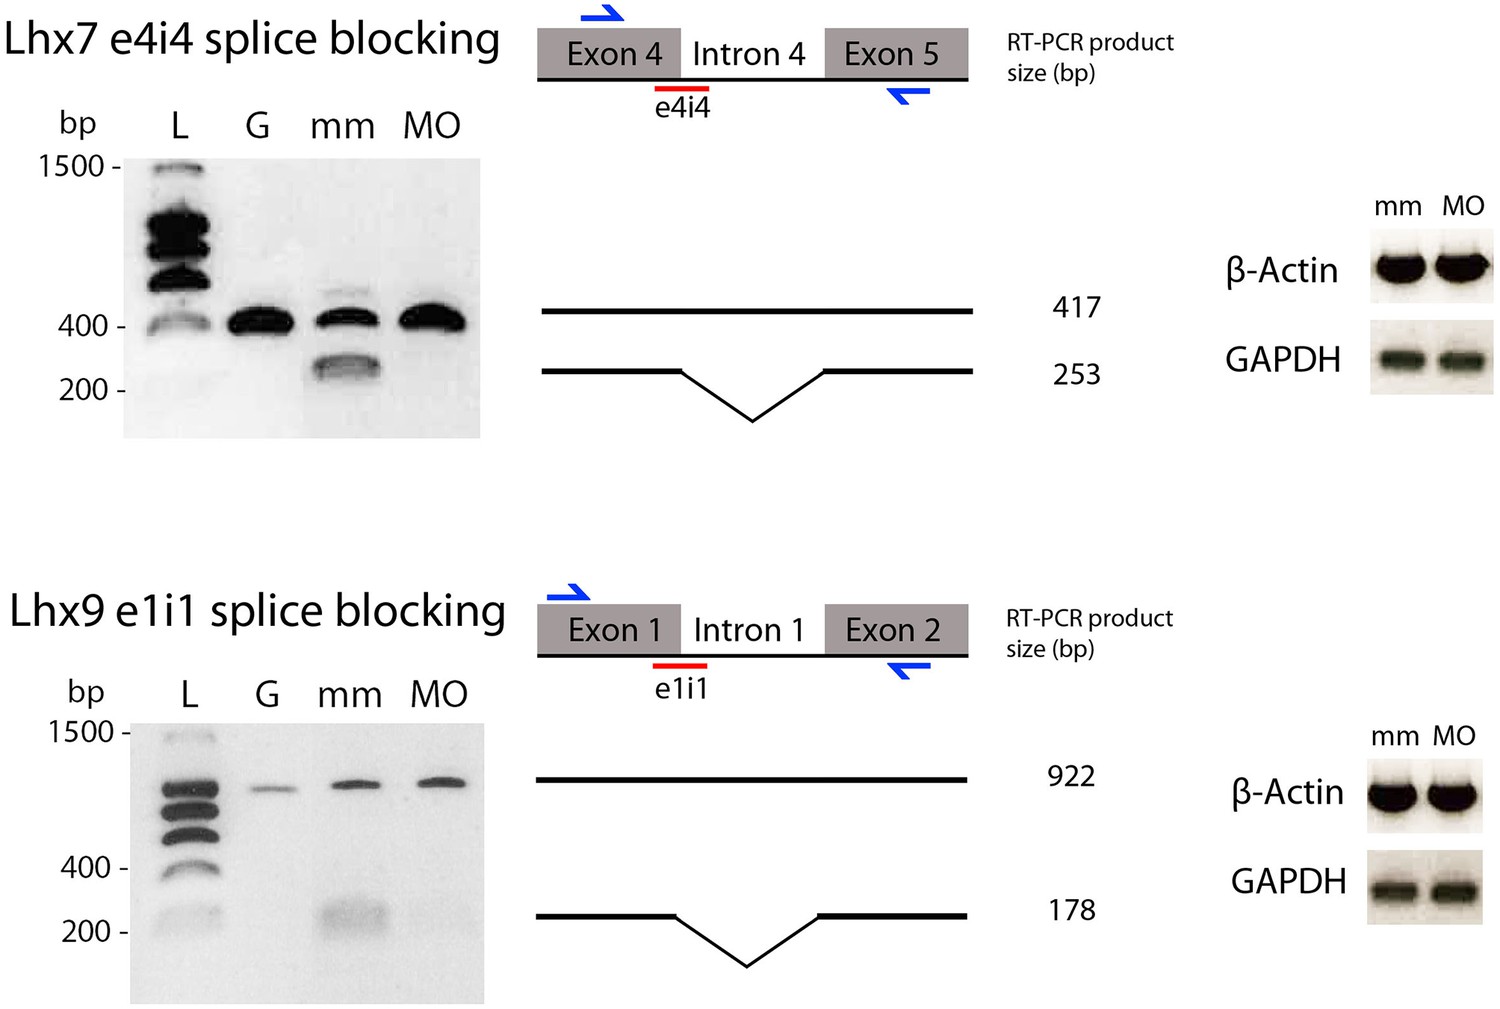
Controlling Lhx9 and Lhx7 splice-blocking morpholinos knock-down efficiency.
Left: agarose gels of PCR products. L: ladder; G: PCR on genomic DNA template; mm and MO: RT-PCR on RNA extracted from embryos injected with the indicated mismatch and splice blocking morpholinos. Middle: scheme of the targeted intron/exon region of Lhx7 and Lhx9, respectively. The exon-intron junction targeted by the splice blocking morpholino is indicated in red, and the PCR primers are depicted in blue. Expected sizes of PCR products, with or without splicing, are indicated. Right: gel loading controls showing amplification of control housekeeping genes by semi-quantitative RT-PCR.
Figure 3—figure supplement 3
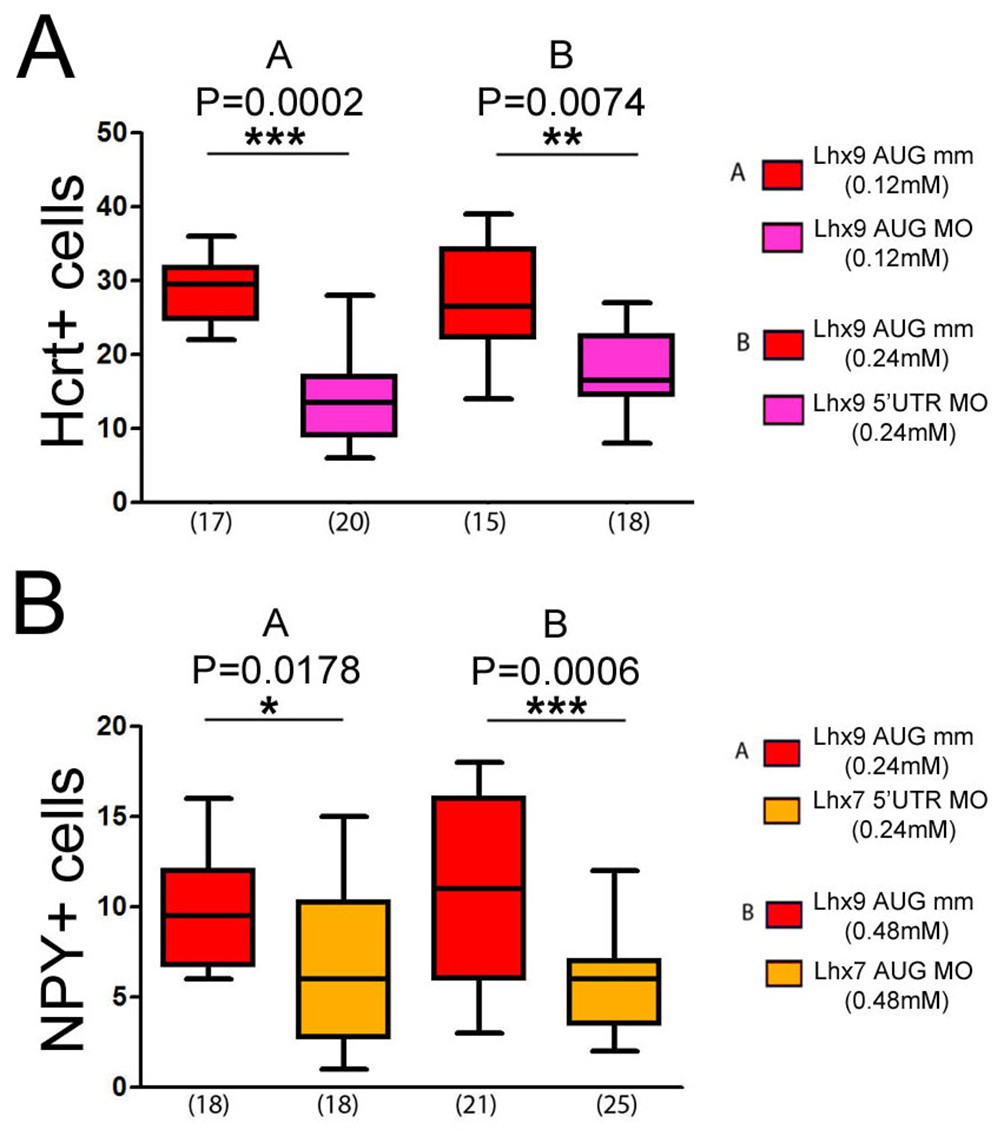
Effects of Lhx9 or Lhx7 ATG and 5’UTR morpholinos knock-down on Hcrt and NPY neurons numbers, respectively.
(A) Quantification of the number of Hcrt cells in control mismatch (red) and Lhx9 MO-injected (pink) CF embryos. The concentrations and types of MO used for mismatch control and knock-down are indicated. The effect is the same as for the Lhx9 splice MO. Mann-Whitney tests. (B) Quantification of the number of NPY cells in control mismatch (red) and Lhx7 MO-injected (orange) CF embryos. The concentrations and types of MO used for mismatch control and knock-down are indicated. The effect is the same as for the Lhx7 splice MO. Mann-Whitney tests.
Figure 3—figure supplement 4
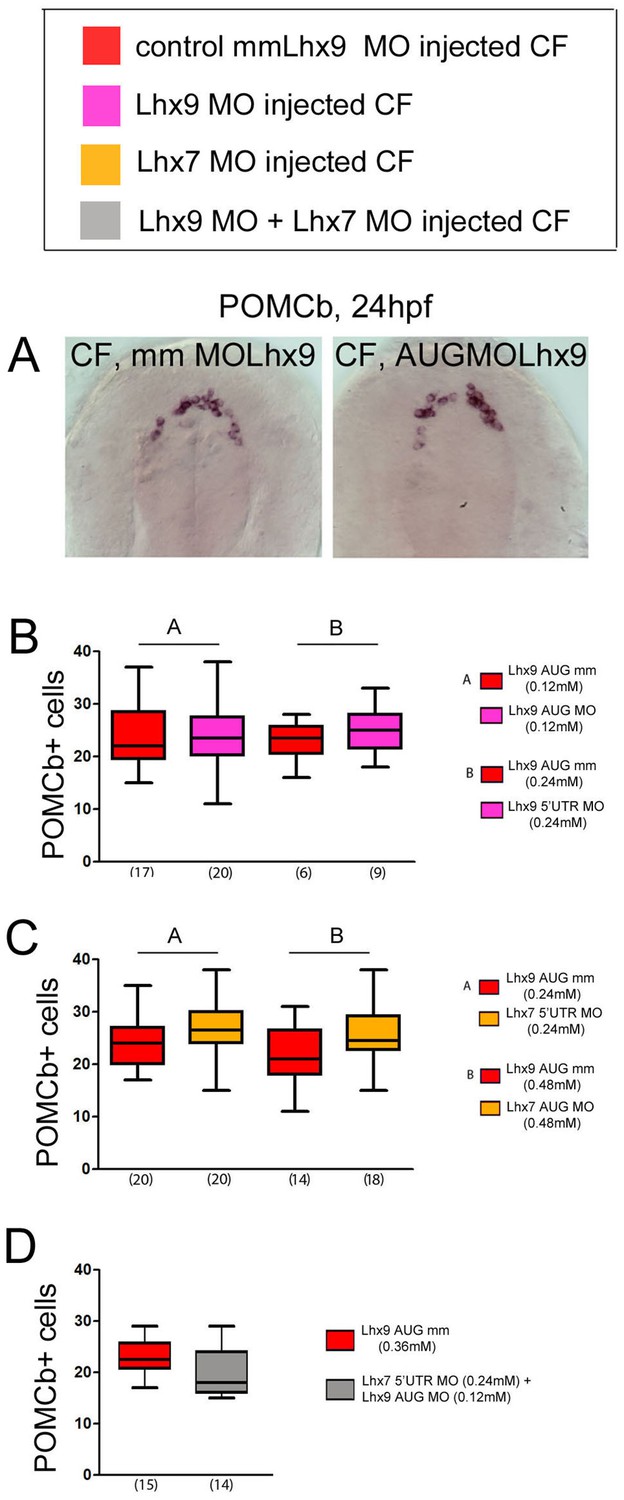
Effects of Lhx9 or/and Lhx7 morpholino knock-down on POMCb neurons numbers.
(A) Photographs of control mismatch (mm) and Lhx9 MO-injected CF embryos after POMCb in situ hybridization at 24 hpf. (B, C) Quantification of the number of POMCb cells in control mismatch (red), Lhx9 MO-injected (pink), and Lhx7 MO-injected (orange) CF embryos. The concentrations and type of MO used are indicated. Mann-Whitney tests. (D) Quantification of the number of POMCb cells in control mismatch (red) and Lhx7MO + Lhx9 MO-injected (grey) CF embryos. The concentrations and type of MO used are indicated. Mann-Whitney tests.
Figure 4 with 1 supplement
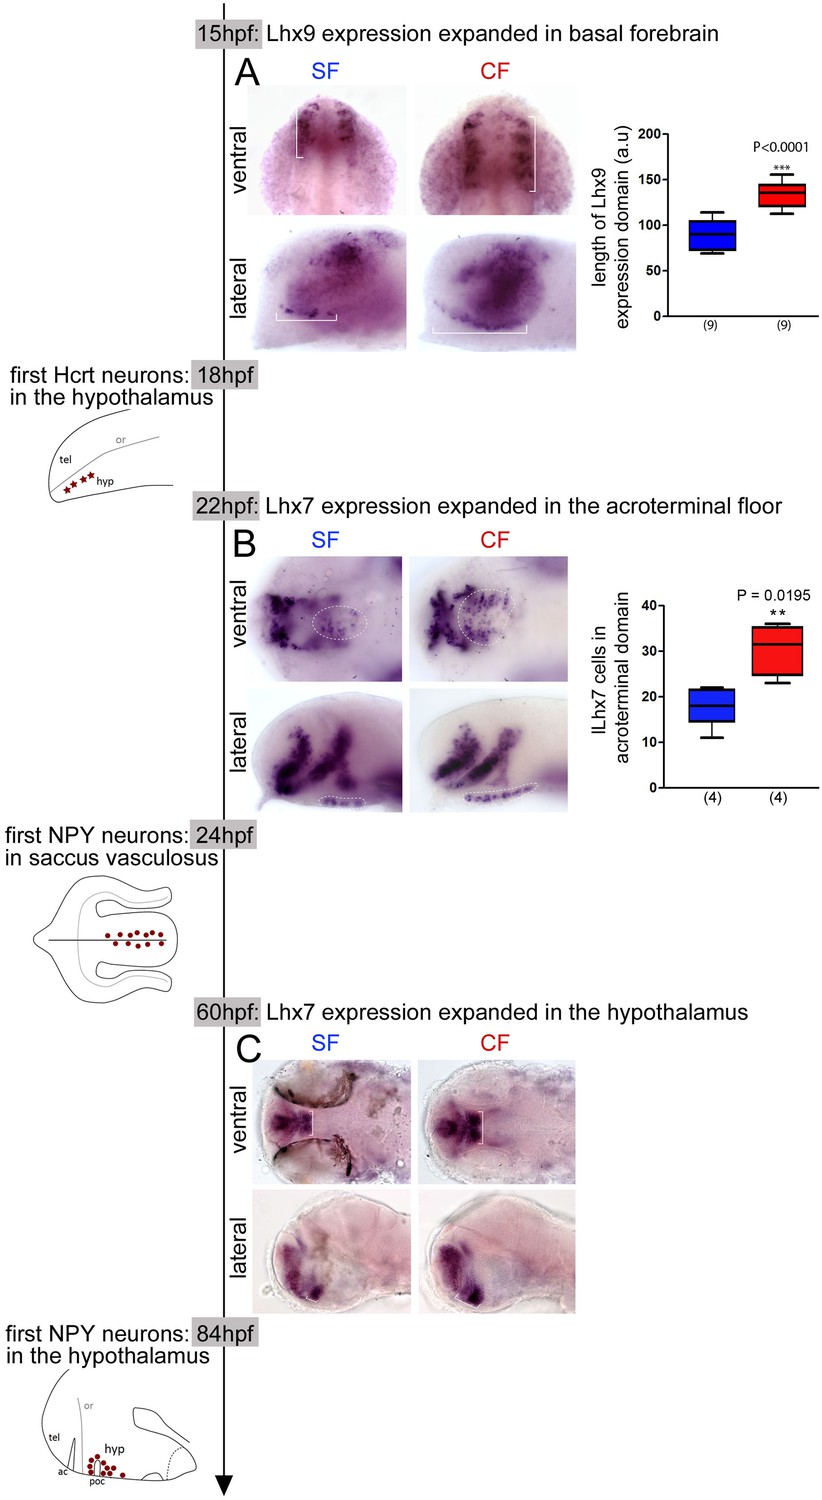
Time-line of expression of Lhx9 and Lhx7 relative to Hcrt and NPY neuron differentiation between 15 hpf and 84 hpf in SF and CF.
(A) Photographs of embryonic brains after in situ hybridization for Lhx9 at 15 hpf in SF and CF, in lateral and ventral views, and quantification of the hypothalamic expression domain (in brackets on the pictures). SF in blue, CF in red. (B) Photographs of embryonic brains after in situ hybridization for Lhx7 at 22 hpf in SF and CF, in lateral and ventral views, and quantification of the acroterminal expression domain (in dotted lines on the pictures). SF in blue, CF in red. (C) Photographs of larval brains after in situ hybridization for Lhx7 at 60 hpf in SF and CF, in lateral and ventral views.
Figure 4—figure supplement 1
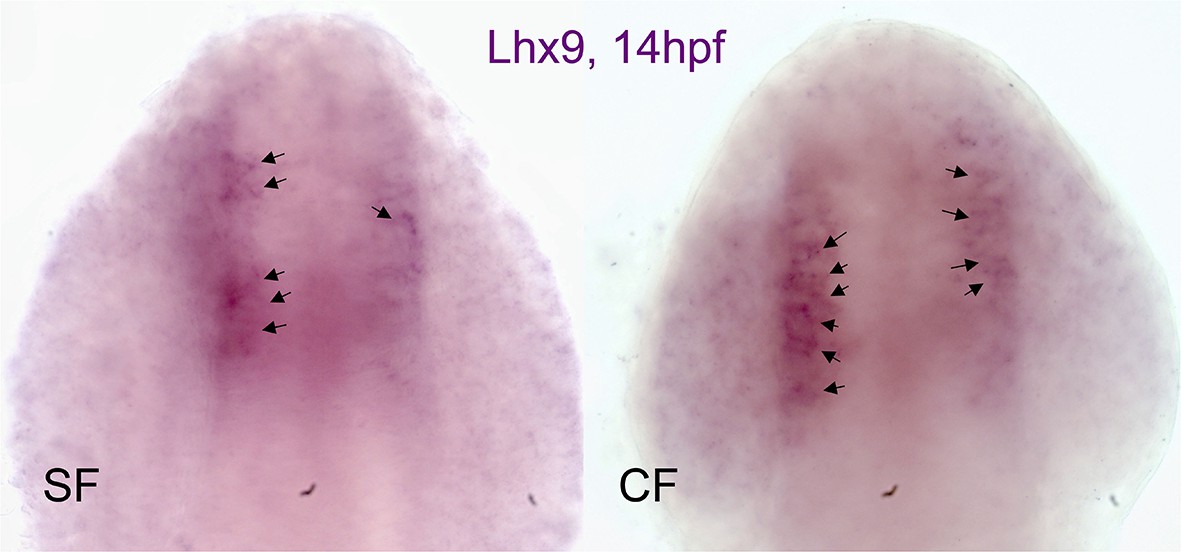
A slight heterochrony in the onset of Lhx9 expression between SF and CF.
Photographs of representative embryonic brains after in situ hybridization for Lhx9 at 14 hpf in SF and CF. In CF, all embryos show expression at 14 hpf, while in SF some do not or only show a few cells turning on Lhx9 expression in the region of interest. Arrows point to Lhx9-positive cells.
Figure 5 with 1 supplement
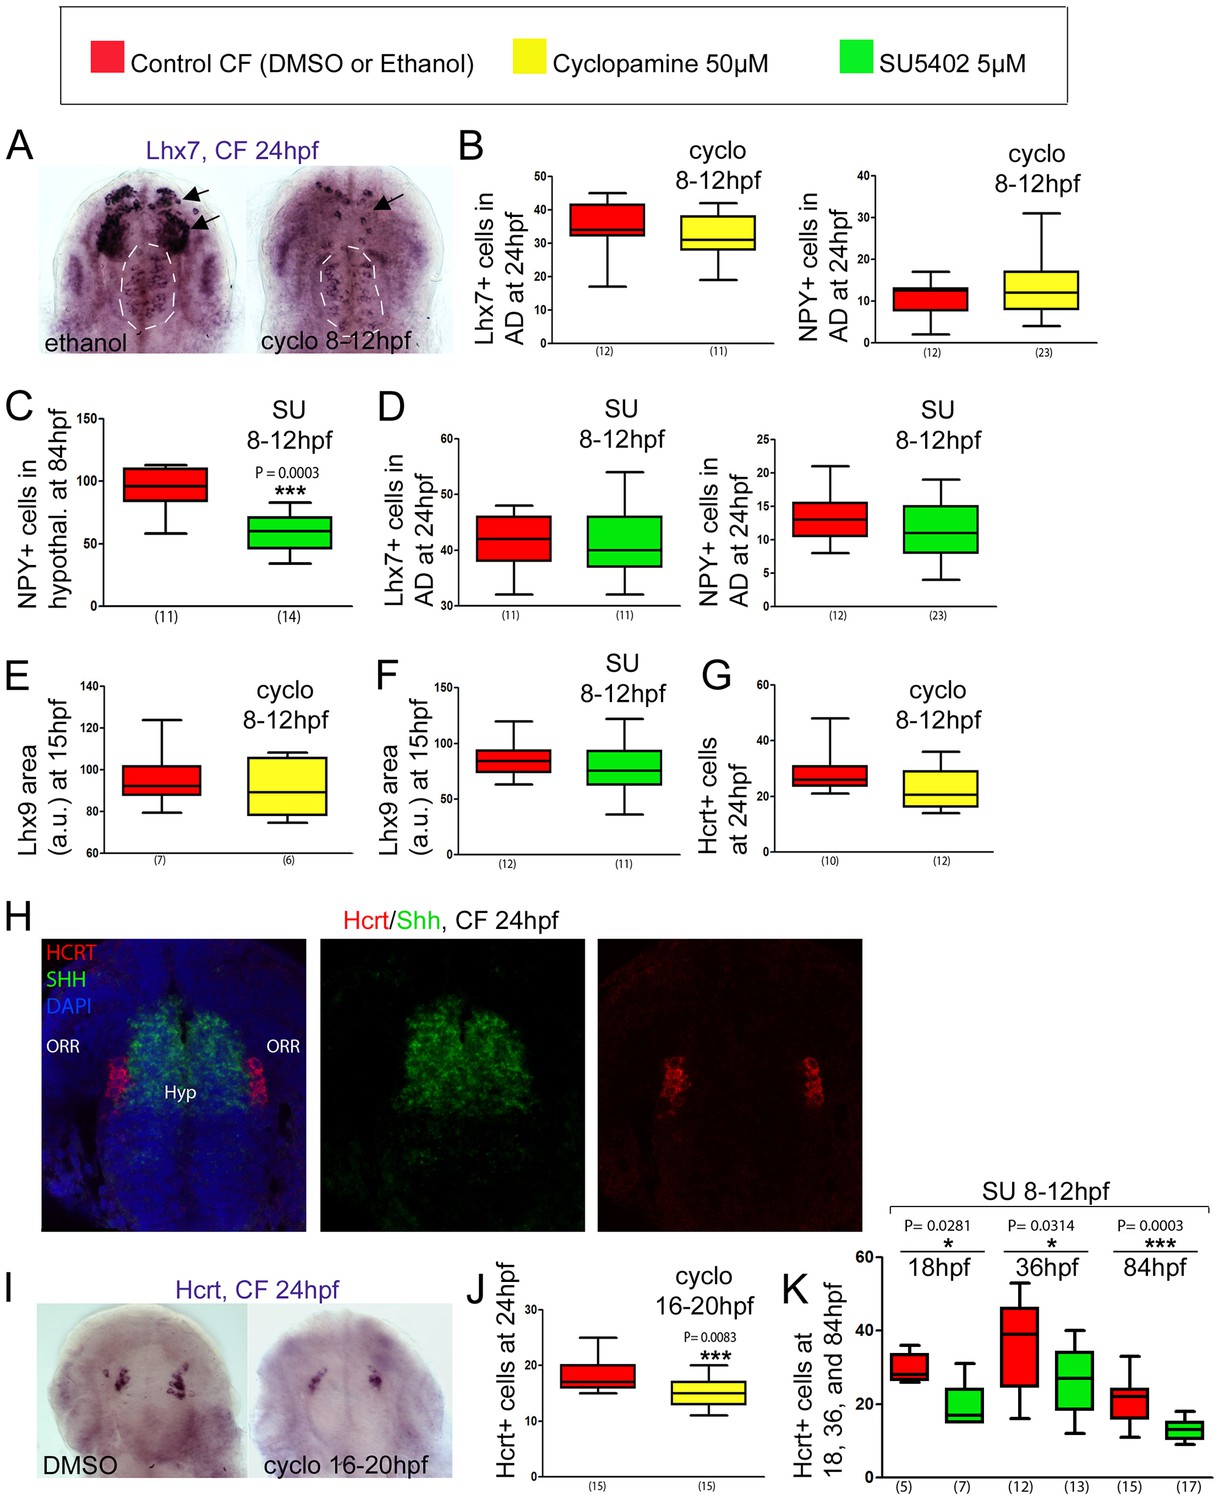
Effect of early or late inhibition of Shh and Fgf signaling on Lhx7, Lhx9, NPY, Hcrt and POMCb expression.
(A) Photographs of embryonic brains after in situ hybridization for Lhx7 at 24 hpf in control and cyclopamine-treated CF, in ventral views. The treatment was performed between 8 and 12 hpf. The presumptive saccus vasculosus (unaffected by the treatment) is delineated by a white dotted line, whereas the other, affected, expression domains are indicated by black arrows. (B) Quantification of the number of Lhx7 cells (left) and NPY cells (right) in the acroterminal domain (AD) of control CF (red) and cyclopamine-treated CF (yellow) at 24 hpf after an 8-12 hpf treatment. (C) Quantification of the number of NPY cells in the hypothalamus of control CF (red) and SU-treated CF (green) at 84 hpf after an 8-12 hpf treatment. Mann-Whitney tests. (D) Quantification of the number of Lhx7 cells (left) and NPY cells (right) in the AD of control CF (red) and SU-treated CF (green) at 24 hpf after a 8-12 hpf treatment. (E, F) Quantification of the Lhx9-expressing area in the hypothalamus of control CF (red) versus cyclopamine-treated (yellow)(E) or SU-treated CF (green)(F) at 15 hpf, after an 8-12 hpf treatment. (G) Quantification of the number of Hcrt cells in the hypothalamus of control CF (red) and cyclopamine-treated CF (yellow) at 24 hpf after an 8-12 hpf treatment. (H) Confocal pictures after double fluorescence in situ hybridization (Hcrt in red, Shh in green, as indicated) with DAPI counterstain (blue nuclei) at 24 hpf, in ventral view. (I) Photographs of embryonic brains after in situ hybridization for Hcrt at 24 hpf in control and cyclopamine-treated CF, in ventral views. The treatment was performed between 16 and 20 hpf. (J) Quantification of the number of Hcrt cells of control CF (red) and cyclopamine-treated CF (yellow) at 24 hpf after a 16-20 hpf treatment. Mann-Whitney tests. (K) Quantification of the number of Hcrt cells of control CF (red) and SU-treated CF (green) at 18, 36, and 84 hpf, after an 8-12 hpf treatment. Mann-Whitney tests.
Figure 5—figure supplement 1

Late inhibition of Shh or Fgf signaling has no effect on acroterminal NPY or POMCb differentiation.
(A) Absence of effect of a cyclopamine (yellow) or a SU5402 (green) treatment between 20-24 hpf on the number of NPY neurons in the acroterminal region at 24 hpf, when compared to vehicle treated CF embryos (red). The numbers of embryos treated and analyzed are indicated in parentheses under the box plots. (B) Confocal photographs of double fluorescence in situ hybridization for NPY (green) and Shh (red) in a ventral view on a 24 hpf CF embryo. DAPI counterstain appears in blue. (C) Absence of effect of a cyclopamine (yellow) or a SU5402 (green) treatment between 20 and 24 hpf on the number of POMCb neurons at 24 hpf, when compared to vehicle-treated CF embryos (red). Same color code as in A. The numbers of embryos treated and analyzed are indicated in parentheses under the box plots.
Figure 6 with 1 supplement
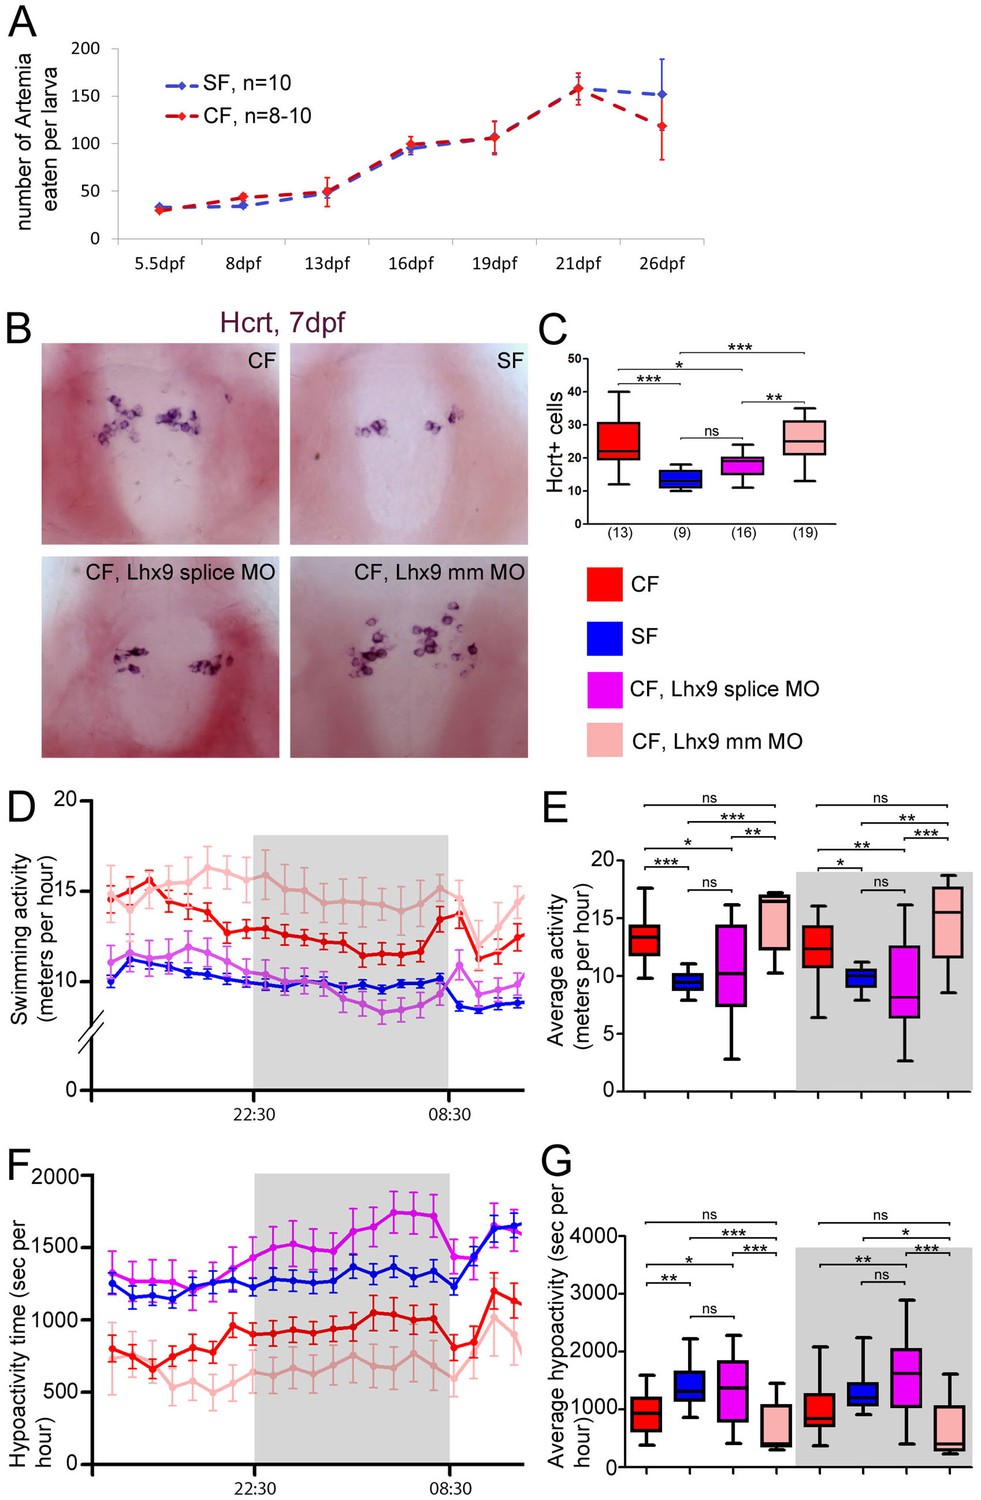
Neuropeptidergic evolution and cavefish larval behavior.
(A) Comparison of food intake during larval and juvenile stages in SF (blue) and CF (red). (B, C) Photographs of brains after in situ hybridization for Hcrt, in ventral views, in 7 dpf juveniles, in the indicated condition (B) and quantification of Hcrt cell numbers at 7 dpf in CF (red), SF (blue), Lhx9 splice MO-injected (purple) and mmLhx9 injected CF (pale red). (C). ANOVA test. (D, E) 24 hr plots of locomotor activity, and histogram showing average activity in the four conditions (see color code). The dark/night time is shaded in grey. In these and following graphs, the numbers of tested larvae are: CF, n = 23; SF, n = 21; Lhx9 splice MO-injected CF, n = 33; mmLhx9 injected CF, n = 11. ANOVA test. (F, G) 24 hr plots of time spent in hypoactivity, and histogram showing average time spent in hypoactivity in the four conditions (see color code). The dark/night time is shaded in grey. ANOVA test.
Figure 6—figure supplement 1
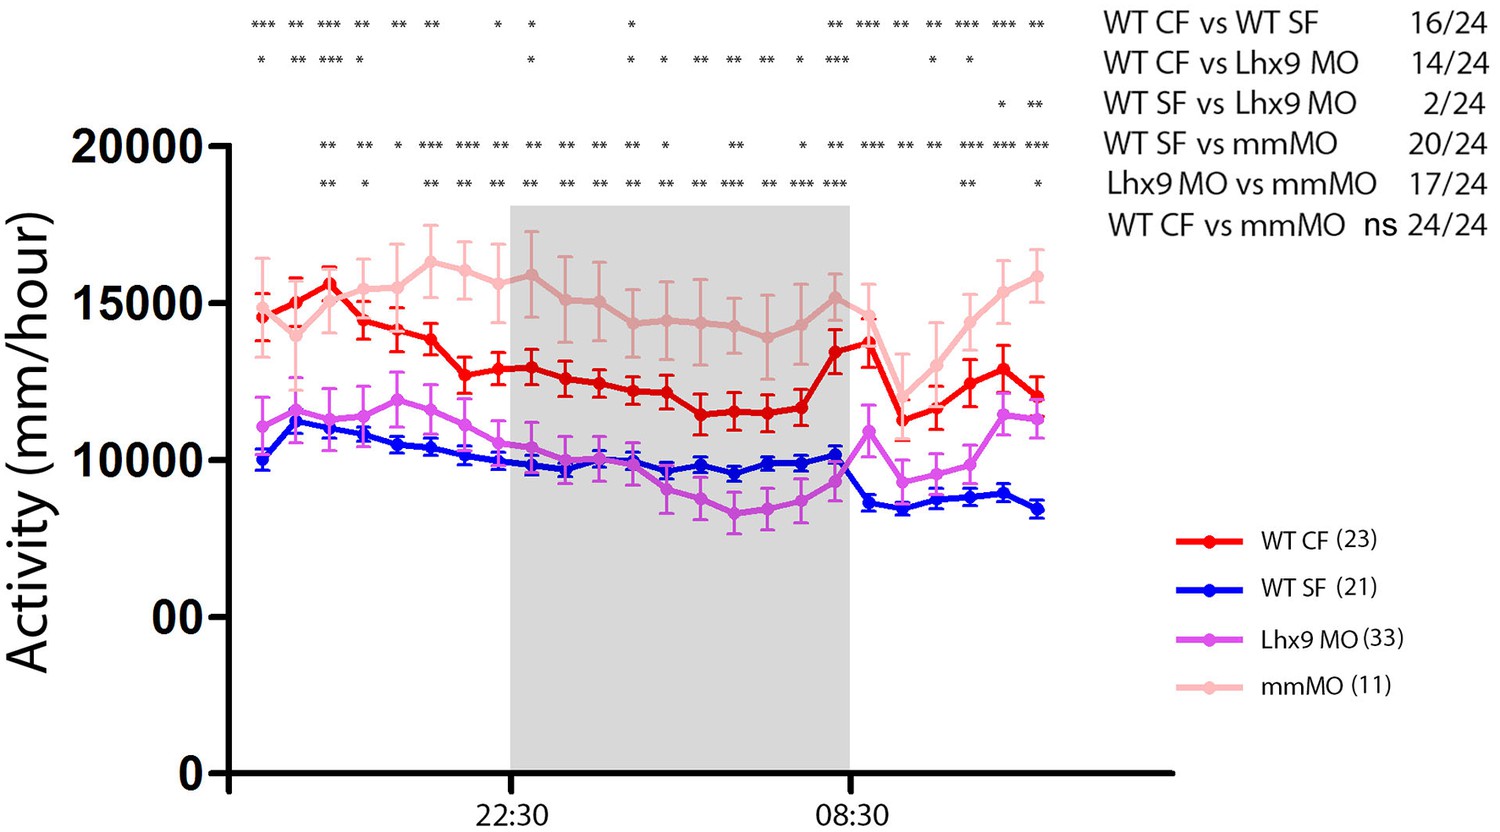
Statistics on locomotion data on 24 hr.
Same plot as in Figure 6D, with statistical significance between the four curves for everytime point (Mann-Whitney). Numbers in parentheses indicate the number of larvae tested.
Figure 7

Summary schemes.
(A) Comparative developmental maps of neuropeptidergic cell types between Astyanax and mouse. For mouse, data were taken from (Díaz et al., 2014). For Astyanax mexicanus, boundaries between putative hypothalamic subdivisions are grey dotted lines because we did not assess the position of the neuropeptidergic clusters within molecularly distinct cytoarchitectonic domains as it was done in the mouse (Ferran et al., 2015). Their relative positions are indicated, according to the brain axes and to the double labeling we have performed. Their localization in the mouse-like subdivisions is only tentative. (B) Signaling and transcription factors involved in NPY and Hcrt neurons development. Shh/Fgf signaling acts at different steps for the two neuropeptidergic types of neurons. The ‘priming’ effect of Fgf signaling on Hcrt fate without affecting Lhx9 expression is indicated by a dotted line. (C) From early developmental evolution to behavioral consequences in cavefish. The SF/CF comparison is schematized at neural plate stage (left, with modified midline signaling in CF), at embryonic stage (middle, with modified hypothalamic peptidergic cluster sizes in CF), and in terms of larval behavior (right, with increased locomotion in CF).
Additional files
-
Supplementary file 1
Cell counts.
Table showing raw data for cell counts for the nine studied neuropeptides in CF and SF at three different developmental stages.
- https://doi.org/10.7554/eLife.32808.025
-
Transparent reporting form
- https://doi.org/10.7554/eLife.32808.026
Download links
A two-part list of links to download the article, or parts of the article, in various formats.
Downloads (link to download the article as PDF)
Open citations (links to open the citations from this article in various online reference manager services)
Cite this article (links to download the citations from this article in formats compatible with various reference manager tools)
Developmental evolution of the forebrain in cavefish, from natural variations in neuropeptides to behavior
eLife 7:e32808.
https://doi.org/10.7554/eLife.32808


