Jak-Stat pathway induces Drosophila follicle elongation by a gradient of apical contractility
- Université Clermont Auvergne - CNRS UMR 6293- INSERM U1103, France
Figures
Figure 1 with 1 supplement

Polar cells determine the axis of early elongation.
(a) WT ovariole illustrating follicle elongation during the early stages of oogenesis (stages 2–6). (b) Optical cross-section of a stage 7 WT follicle stained with FasIII, a polar cell marker (white) and F-actin (red). (c) Stage seven fat2 mutant follicle stained with FasIII (white) and DE-Cad (red). (d) Elongation kinetics of WT and fat2 mutant follicles (n > 6 for each point). (e) Z-projection of a Pak mutant ovariole. Round follicles have only one cluster of polar cells (stage 5 and 8 follicles) or two non-diametrically opposed clusters (stage 3 follicle). (f) Removing a copy of Pvr restores early elongation and polar cell position in Pak mutants. (g) Elongation coefficient of Pak6/Pak11, Df(Pvr)/+ follicles, affecting (n = 23) (1) or not (n = 13) (2) polar cell positioning. (h,i) View of a mys mutant clone (GFP-negative) in a mosaic follicle showing (h) normal polar cell positioning and no elongation defect and (i) abnormal polar cell positioning and an early elongation defect. (j) Elongation coefficient of follicles containing mutant clones for mys affecting (n = 34) (3) polar cell positioning or not (n = 31) (4). Full details of the genotypes and sample sizes are given in the supplementary files. (p *<0.05, **<0.01, ***<0.001.) Scale bars are 10 μm throughout.
Figure 1—figure supplement 1
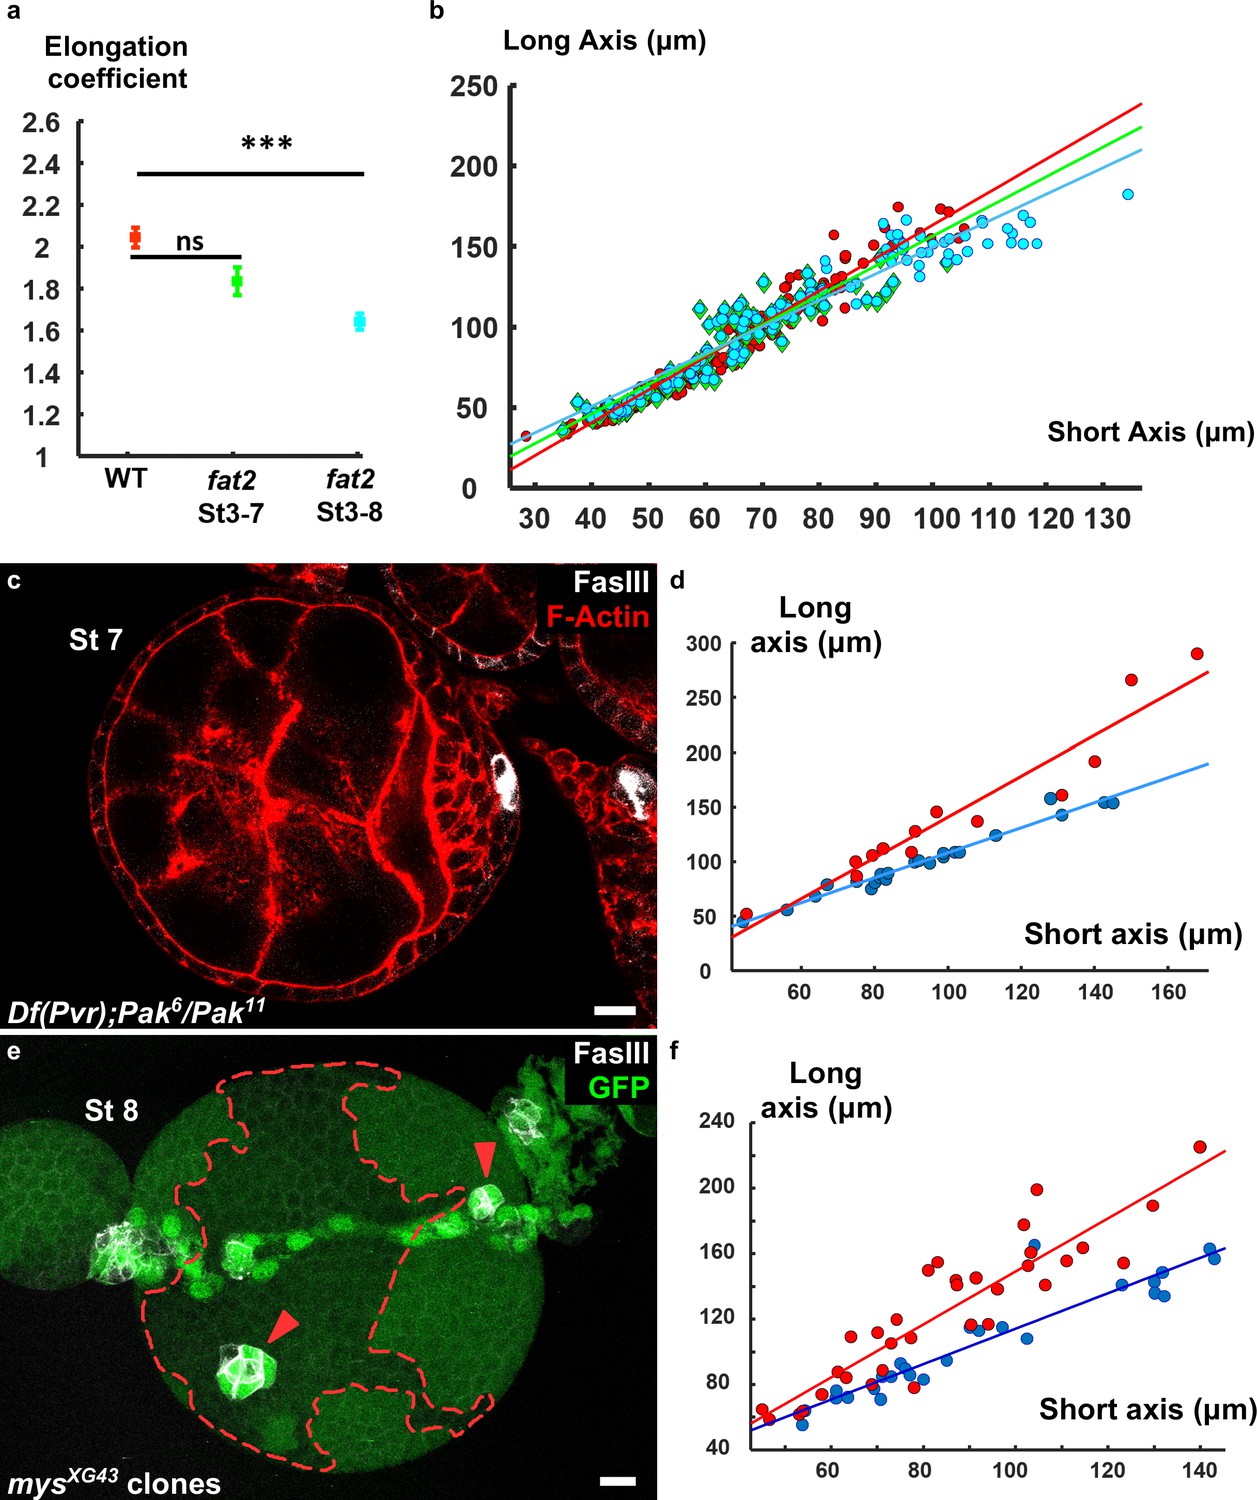
Polar cells determine the axis of early elongation.
(a) Elongation coefficients corresponding to the slope of the regression lines of the plots in (b). (b) Plot of the long axis as a function of a short axis of (b) fat2 mutant follicles (red = WT, green = fat2 stages 3–7, blue = fat2 stages 3–8). The corresponding regression lines are shown. (c) Pak6/Pak11, Df(Pvr)/+ follicle with a single cluster of polar cells. (d) Plot of the long axis as a function of a short axis of Pak6/Pak11, Df(Pvr)/+ follicles affecting polar cell positioning (blue) or not (red). The corresponding regression lines are shown. (e) z-projection of a follicle with a mys mutant clone and two misplaced polar cell clusters (red arrowheads). The green signal in the mutant clone comes from the germline signal due to the z-projection. (f) Plot of the long axis as a function of a short axis of follicles containing mutant clones for mys, affecting polar cell positioning (blue) or not (red). The corresponding regression lines are represented. (p ***<0.001.) Scale bars are 10 μm throughout.
Figure 2 with 1 supplement
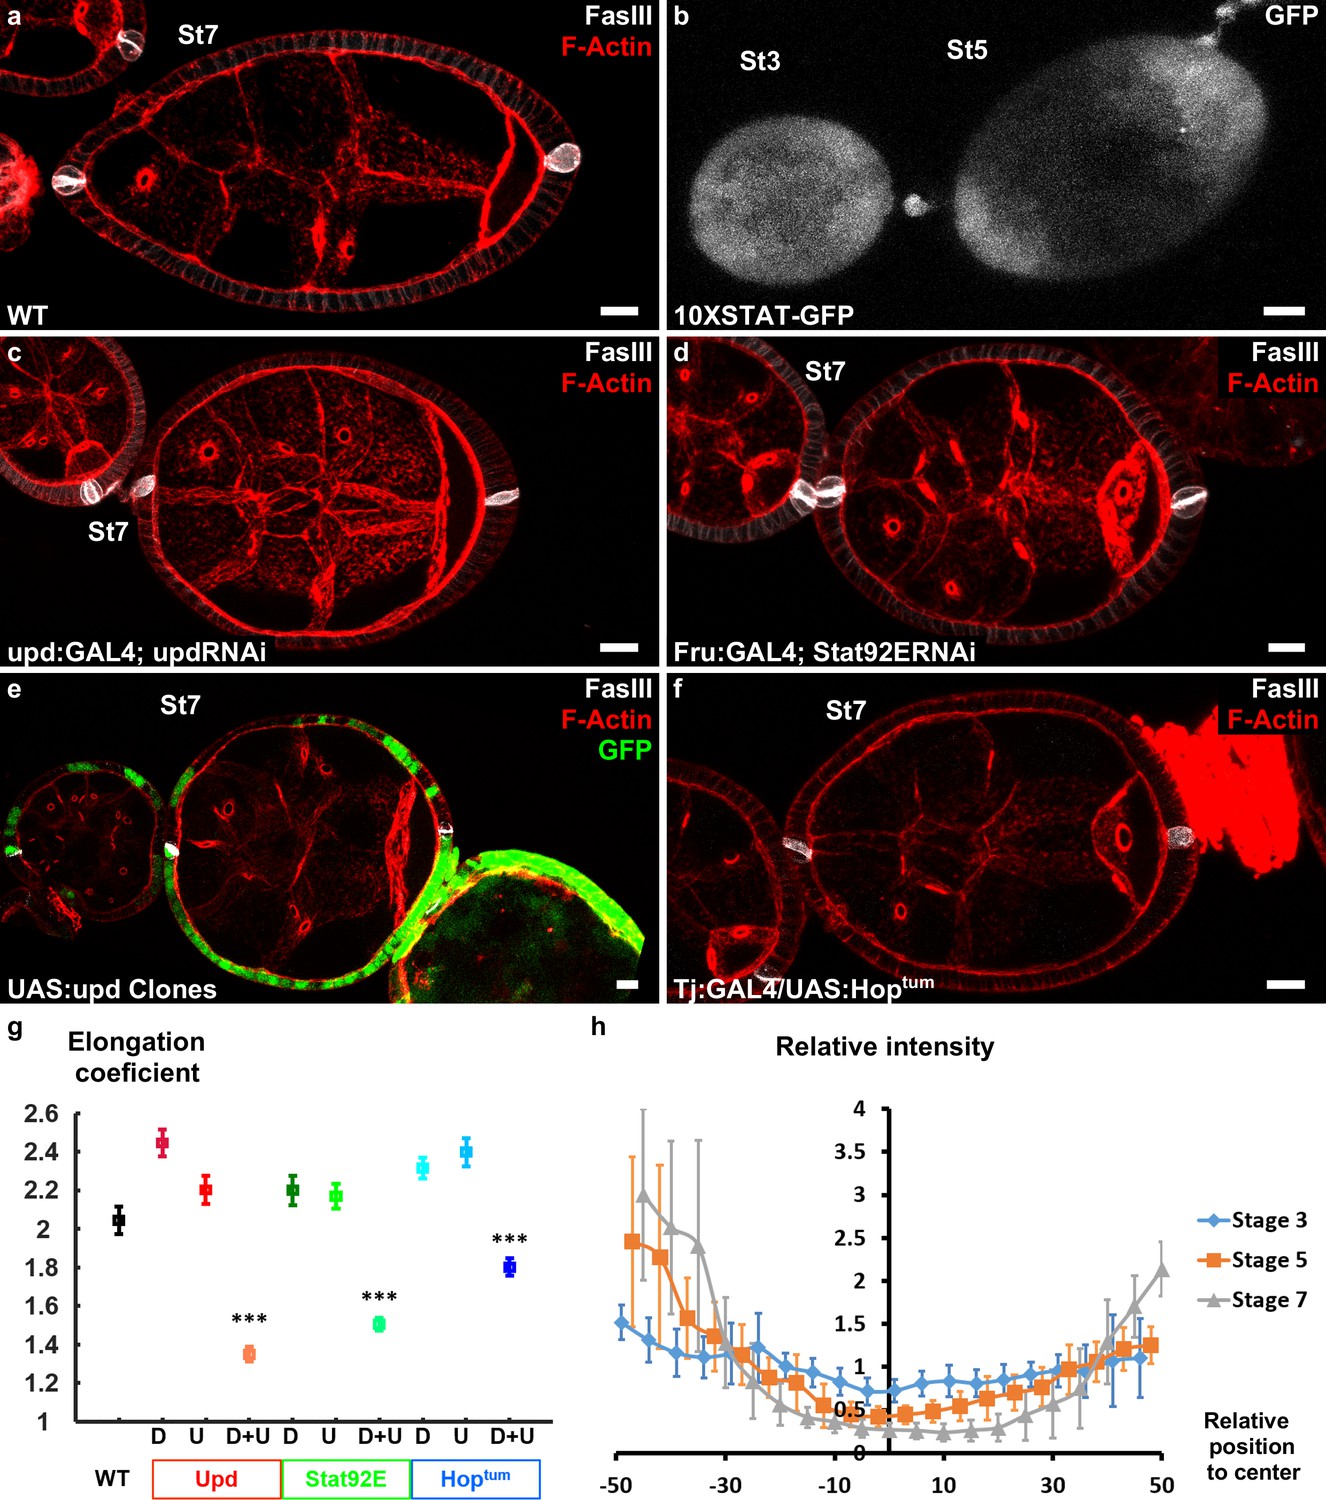
Upd is a polarizing cue for early elongation.
(a) Optical cross-section of a WT stage 7 follicle stained with FasIII (polar cell marker, white) and F-actin (red). (b) Expression of the 10xStatGFP reporter showing the progressive formation of a STAT gradient at each pole. Early elongation is affected by (c) knocking down upd in polar cells or (d) the expression of Stat92E in the anterior and posterior follicular cells. Early elongation is also affected by (e) clonal ectopic expression of upd (GFP-positive cells) and by (f) expression of a Hop gain of function mutant in all follicular cells. (g) Quantification of the elongation coefficient in WT and the different JAK-STAT loss- and gain-of-function genotypes — corresponding to Upd:GAL4 and Upd-RNAi, Fru:GAL4 and STAT92E-RNAi, and Tj:GAL4 and UAS:Hoptum — during early and intermediate stages of elongation (D, Driver; U, UAS line). (For each point n > 30; p *<0.05, **<0.01, ***<0.001.) (h) Quantification of the Stat activity gradient at stages 3, 5 and 7 using the 10XSTATGFP reporter. A gradient is already visible at stage 3 and becomes more visible until stage 7. Scale bars are 10 μm throughout. Relative intensity = intensity at a given position/mean intensity of measured signal. Full details of the genotypes and sample sizes are given in the supplementary files.
Figure 2—figure supplement 1
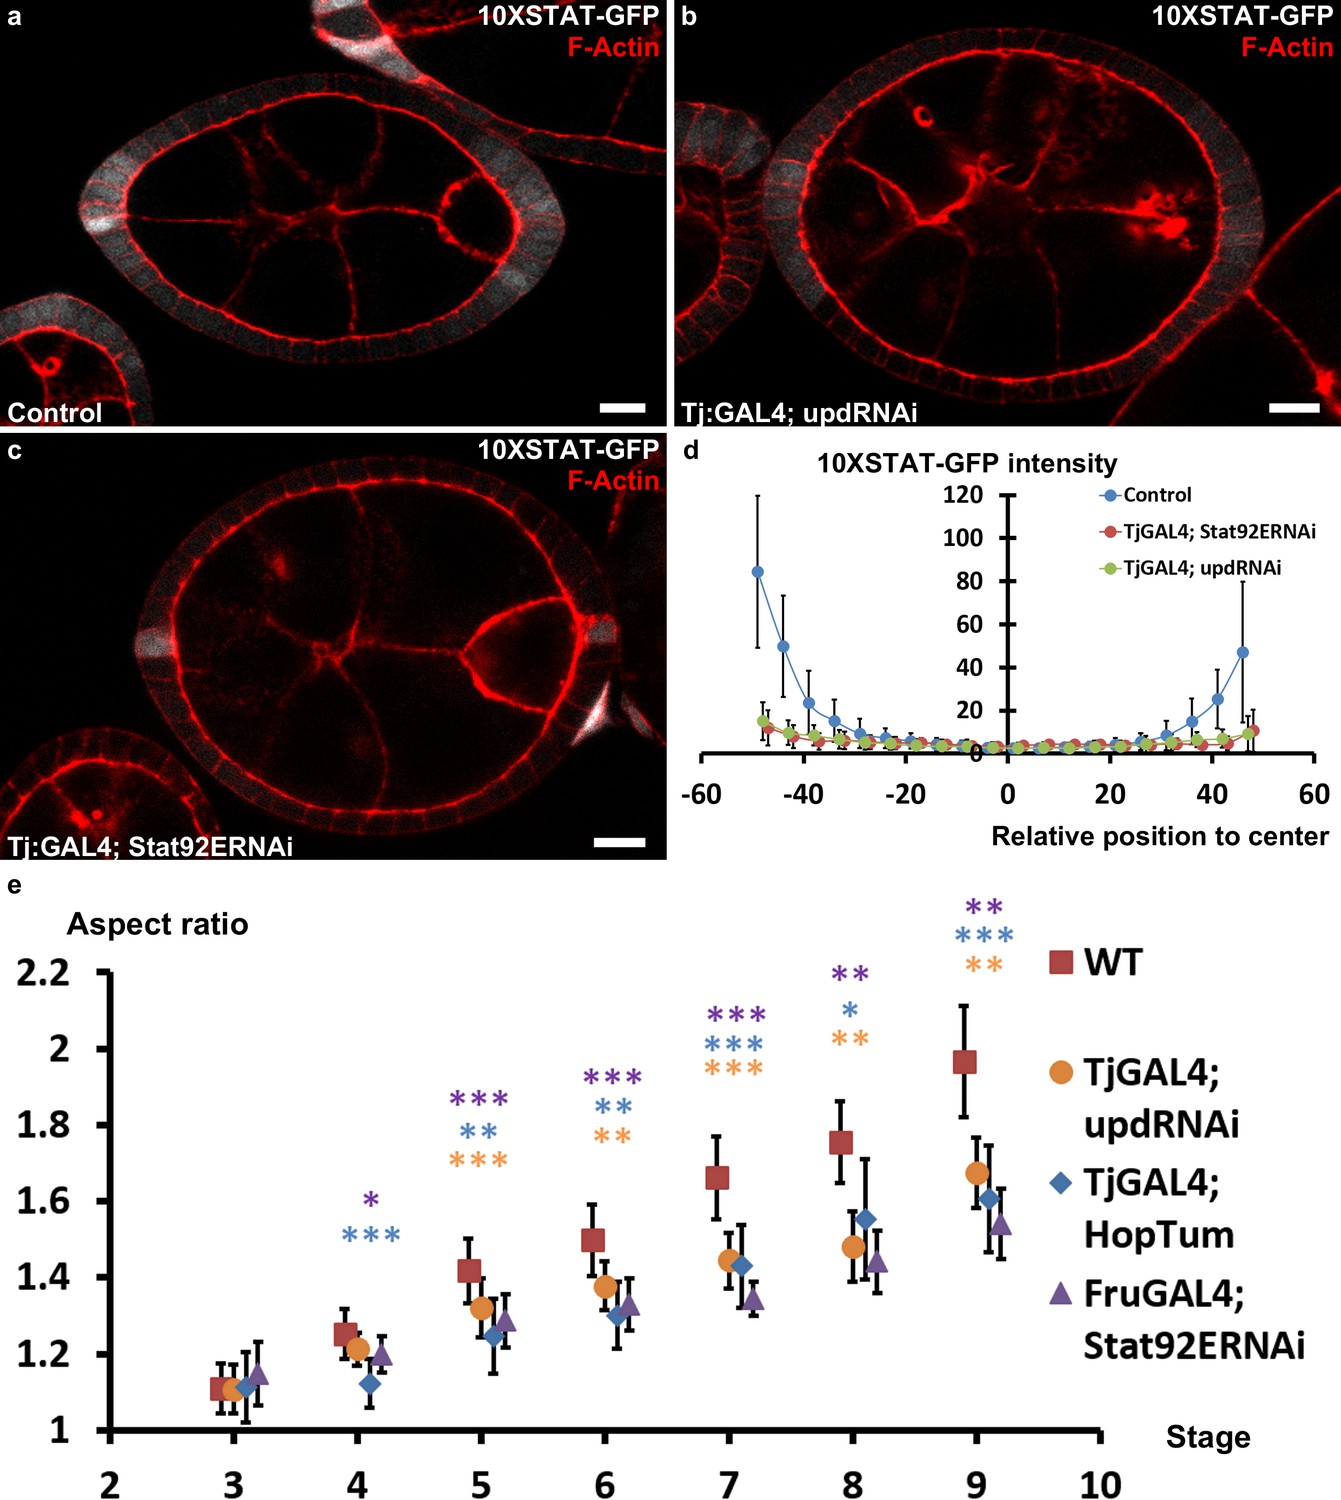
JAK-STAT singalling and early elongation.
(a–c) Representative follicles expressing 10XStatGFP in (a) WT (b) upd RNAi or (c) Stat92E RNAi background. (d) Quantification of the Stat activity gradient for the indicated genotypes at stage 7 using the 10XSTATGFP reporter. (e) Quantification of the aspect ratio (AR) in WT and the different JAK-STAT mutants (loss- and gain-of-function) during early and intermediate stages of elongation. (p *<0.05, **<0.01, ***<0.001.). Scale bars are 10 μm throughout.
Figure 3 with 1 supplement

Myosin II is required for early elongation and apical pulses.
(a) WT and (a′) sqh knockdown stage 7 follicles stained for F-actin (red) and FasIII (white). (b) Elongation coefficient of WT or sqh knockdown follicles during the early elongation phase (D, Driver; U, UAS line) (n > 30). (c) Fluorescence video-microscopy images of a stage 4 WT follicle that expresses BAZ-GFP and Sqh-mCherry. (d) Higher magnification of the area highlighted in (c) showing a pulsing cell. (e) Quantification of the cell apical surface (green) in the cell shown in (d) and of Sqh signal intensity in the apical area (red) over time. (f) Cross-correlation analysis over time of apical surface and Sqh apical signal intensity based on 86 cells from six follicles at stages 3–4. (g) Incubation with the Rok inhibitor Y-27632 strongly reduces pulse activity in stages 3 to 5 WT follicles. Each dot corresponds to one follicle, and at least 10 cells per follicle were analyzed. Red bars represent mean and ± SD (n ≥ 7 follicles). (h) Quantification of the length variation of the follicle cell AP and mediolateral axes during pulses indicates that pulses are isotropic (n > 13 follicles, at least 10 cells per follicle were analyzed). (i) Quantification of the relative BAZ-GFP and Sqh-mCherry signal intensity in cell bounds in function of their angle relative to the AP axis (n = 41 follicles). Relative intensity is given over the mean bond intensity. (j) Fixed stage 7 WT follicle that expresses GFP-Baz and Sqh-mCherry. Scale bars are 10 μm throughout. (p ***<0.001.) Full details of the genotypes and sample sizes are given in the supplementary files.
Figure 3—figure supplement 1
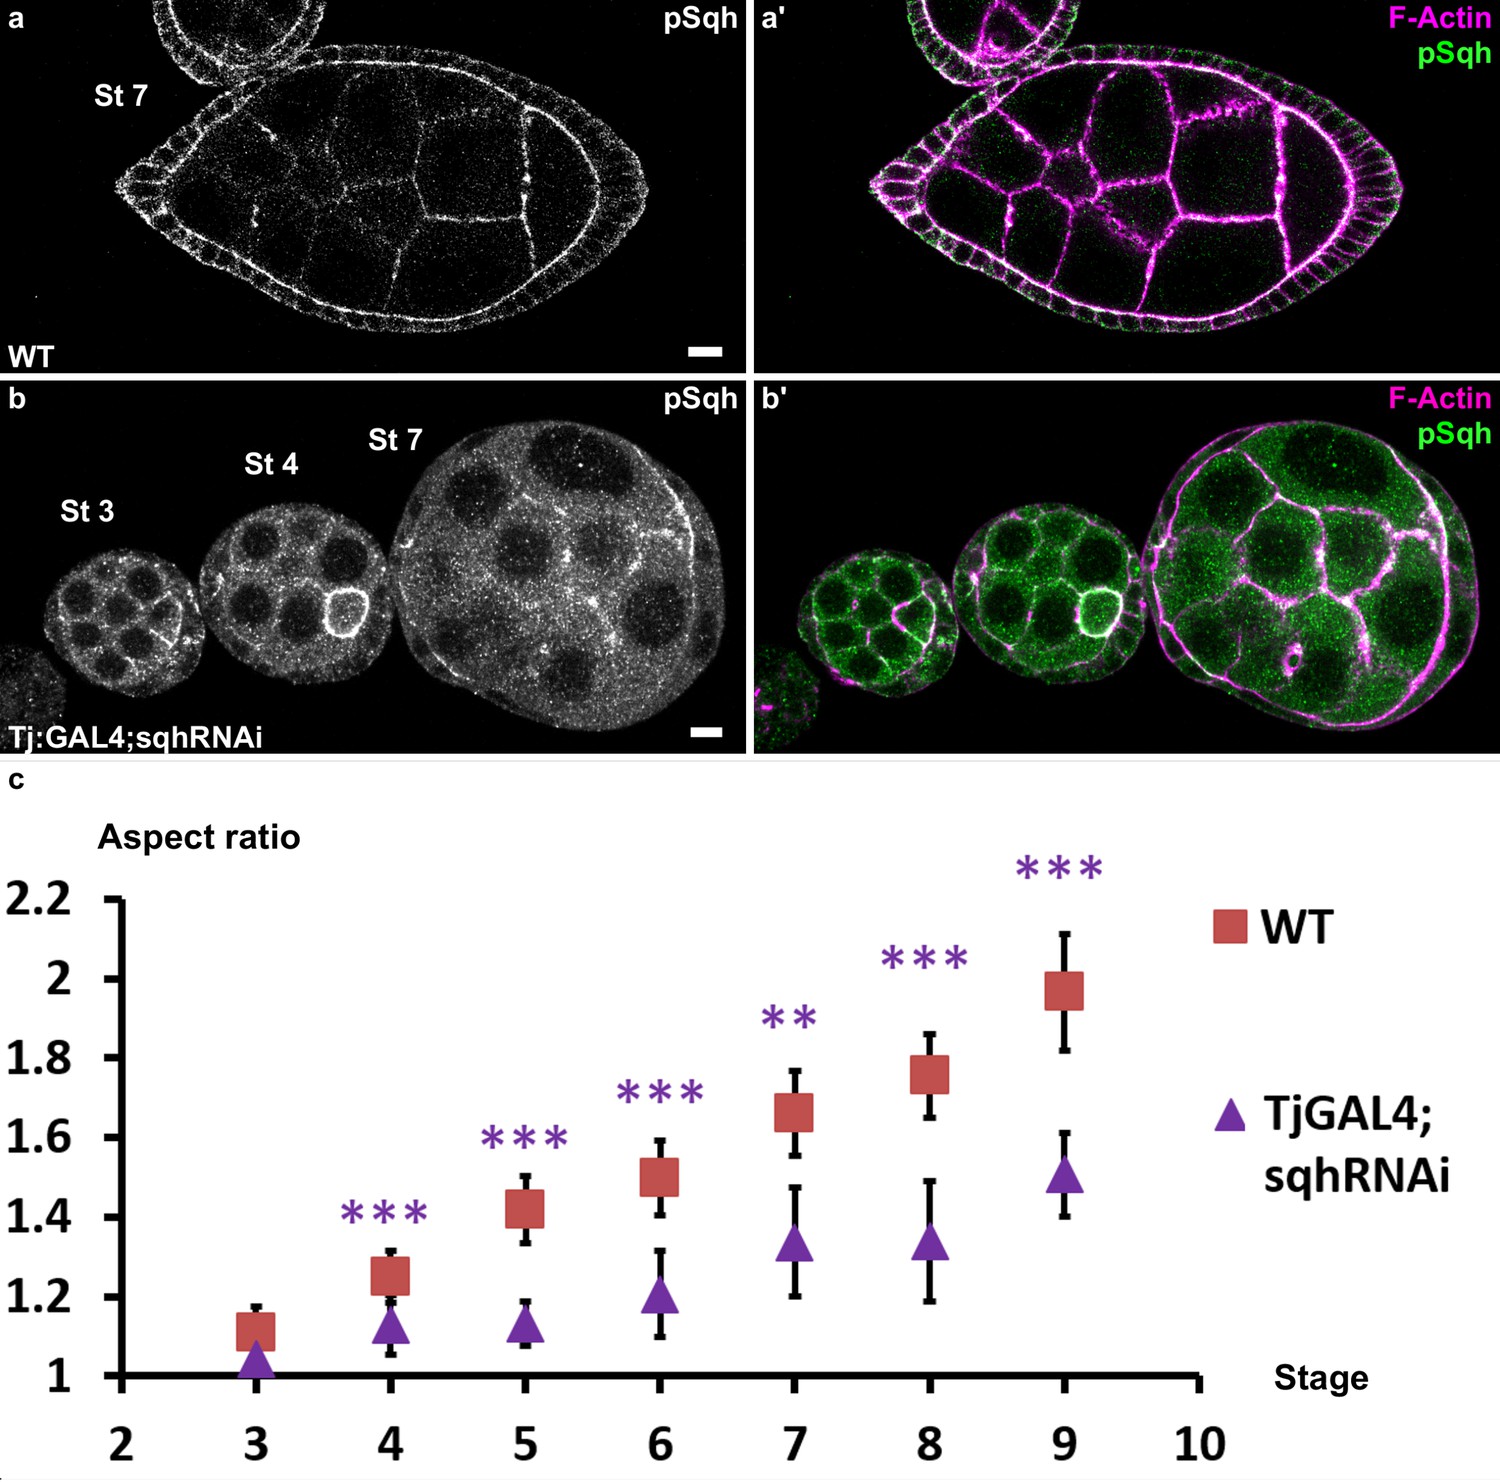
Myosin II is required for early elongation.
Follicles stained for pSqh (white in a,b, green in a’,b’) and F-actin (pink in a’b’). (a) WT follicle. (b) sqhRNAi in follicle cells driven with Tj:Gal4. The signal is mainly apical in WT follicle cells and is strongly reduced in the knockdown. (c) AR quantification in WT or sqh knockdown follicles during the early elongation phase. (p ***<0.001.)Scale bars are 10 μm throughout.
Figure 4 with 1 supplement
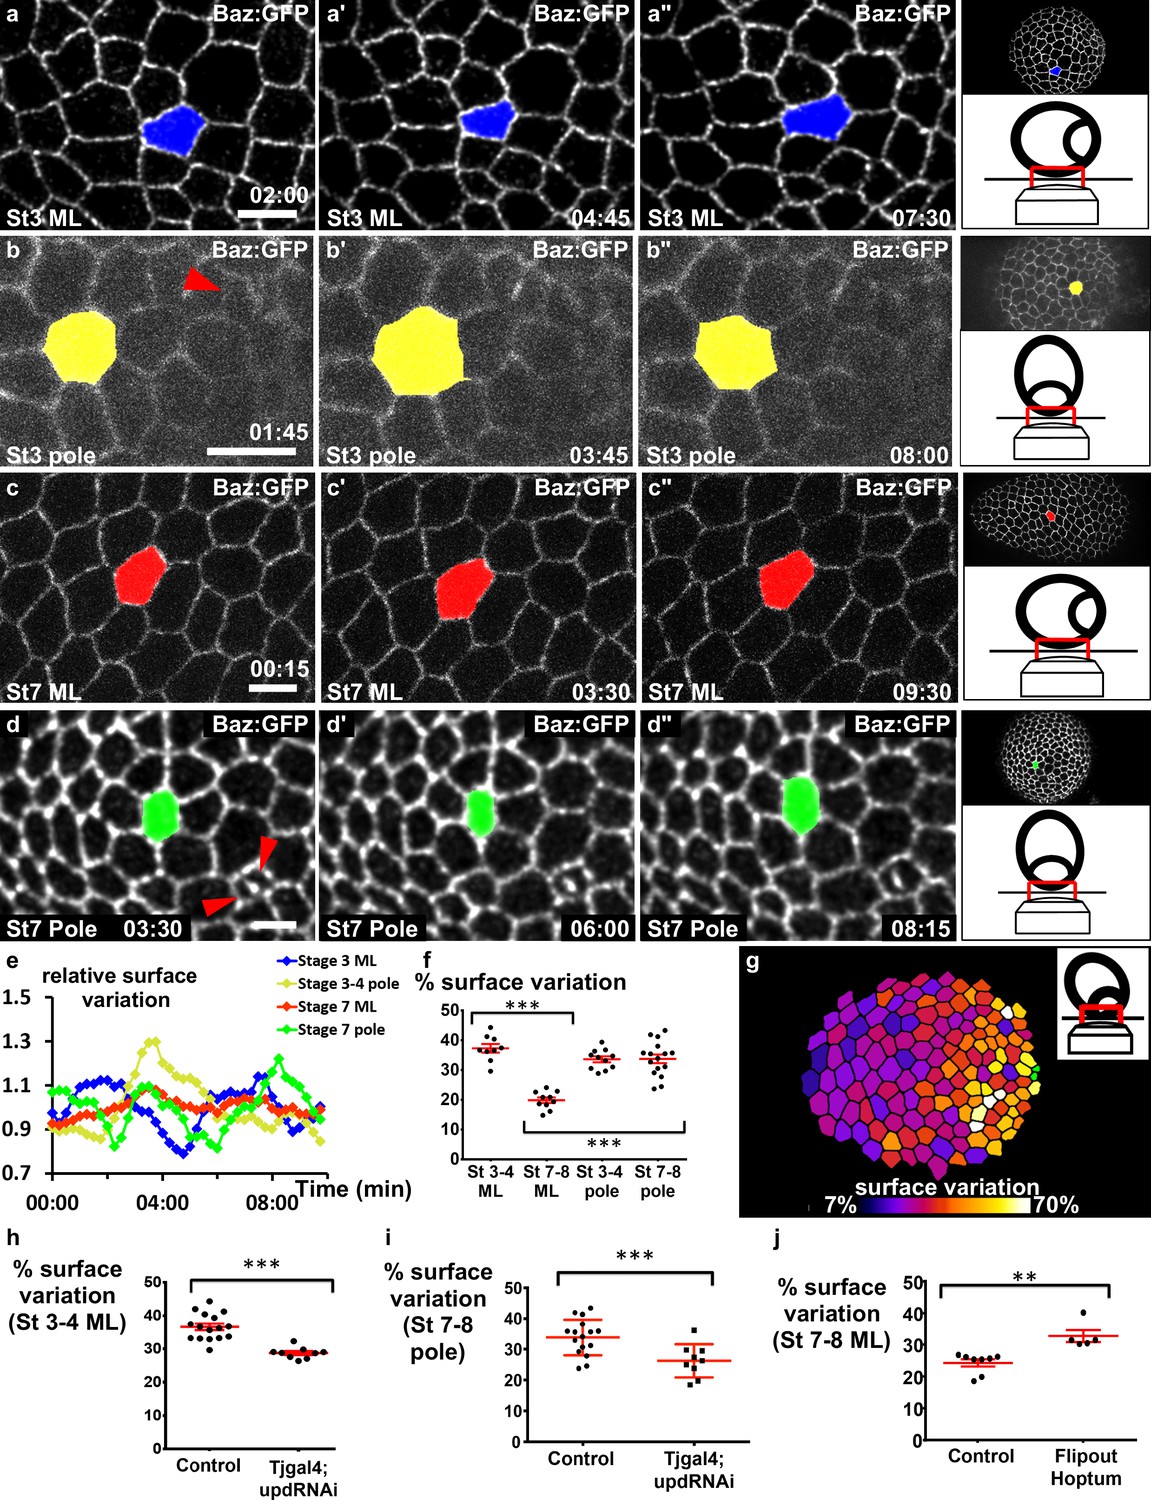
JAK-STAT induces a double gradient of pulses.
(a–d) Images from movies of the mediolateral region of (a) stage 3 and (c) stage 7 BAZ-GFP expressing follicles, or of the area near the polar cells (red arrowheads) of (b) stage 3 and (d) stage 7 follicles. Scale bars: 10 μm. (e) Surface variation of individual cells (examples shown in [a–d]) as a function of time (ML, mediolateral). The surface of each cell is divided by its average surface over time. (f) Mean percentage of apical surface variation depending on stage and position (n ≥ 9 follicles). (g) Color-coding of the pulse intensity of a representative stage 7 follicle (tilted view from the pole, see schematic image in insert) reveals an intensity gradient from the polar cells (in green) to the mediolateral region. (h–j) Mean percentage of apical surface variation in the mediolateral region of (h) stage 3–5 follicles and (j) stage 7 to 8 follicles, and (i) at the pole of stage 7–8 follicles for the indicated genotypes. (h, i) n ≥ 9, (j) n ≥ 5. (p **<0.01, ***<0.001, red bars represent mean and ± SD). Full details of the genotypes and sample sizes are given in the supplementary files.
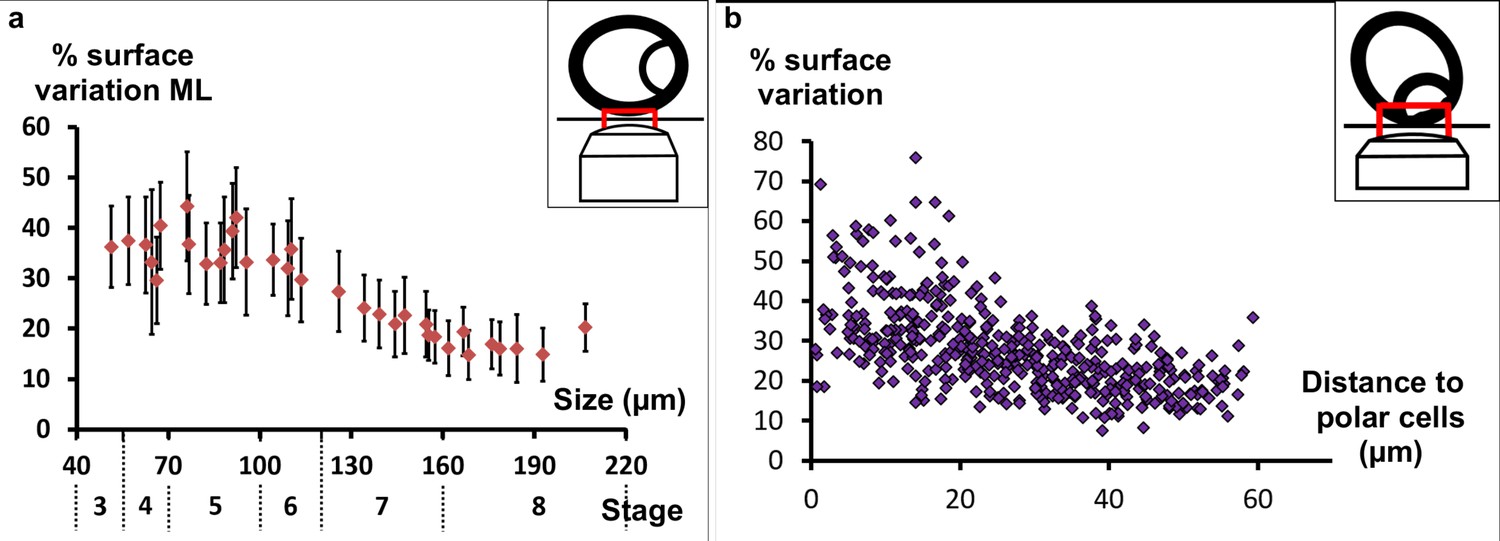
Figure 4—figure supplement 1
Myosin II is required for early elongation.
(a) Mean percentage of apical surface variation in the mediolateral region relative to the follicle length (corresponding stages are also indicated). (b) Pulsing activity of individual cells from five stage 7 follicles (n = 441 cells) relative to their distance from the polar cells (tilted view from the pole).
Figure 5
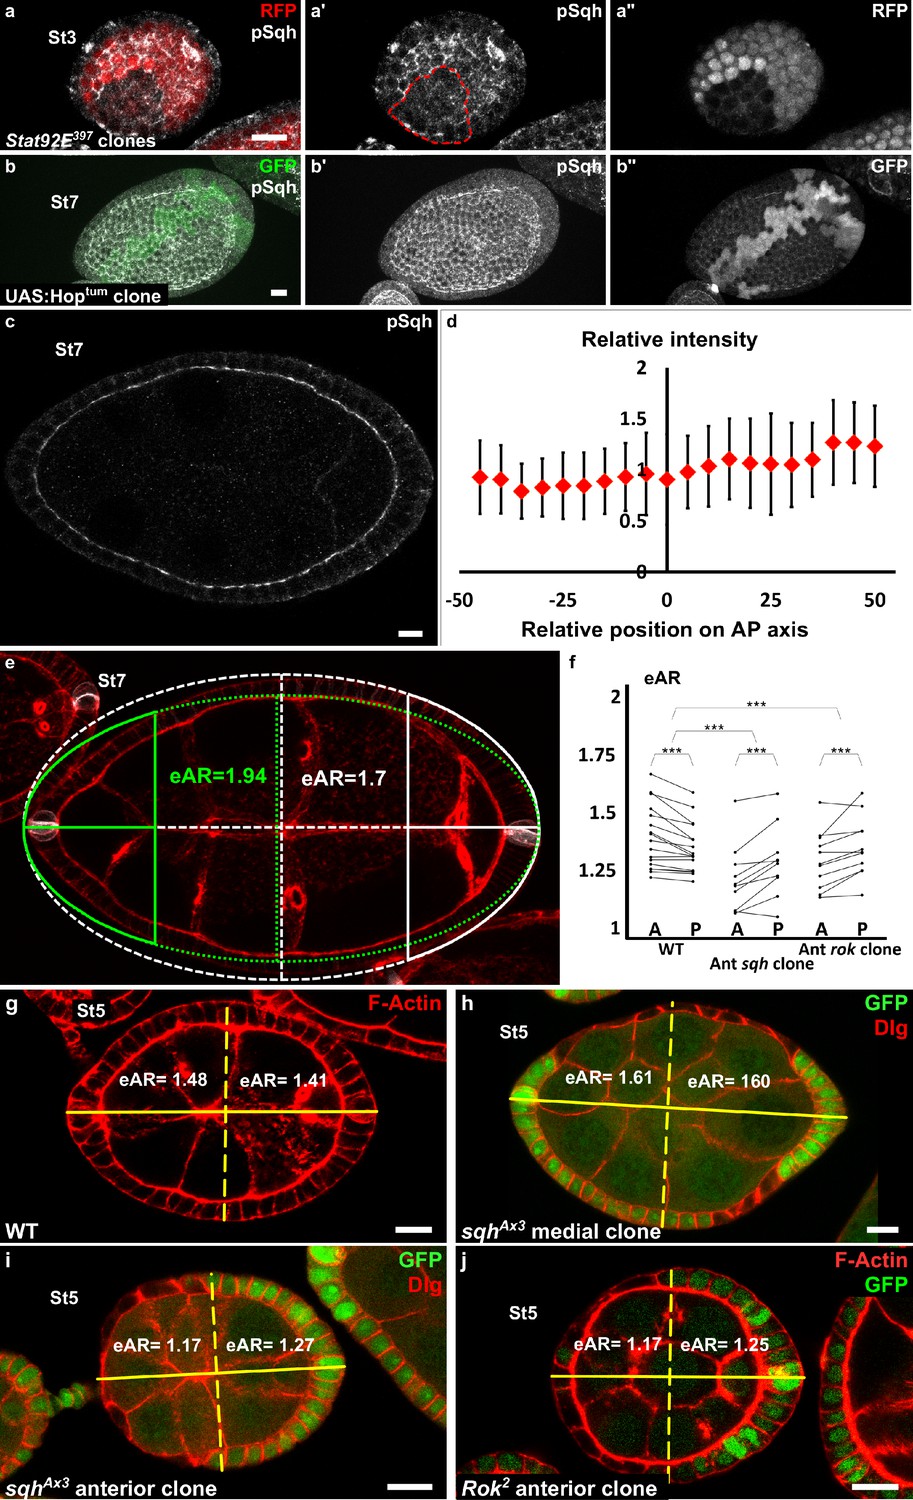
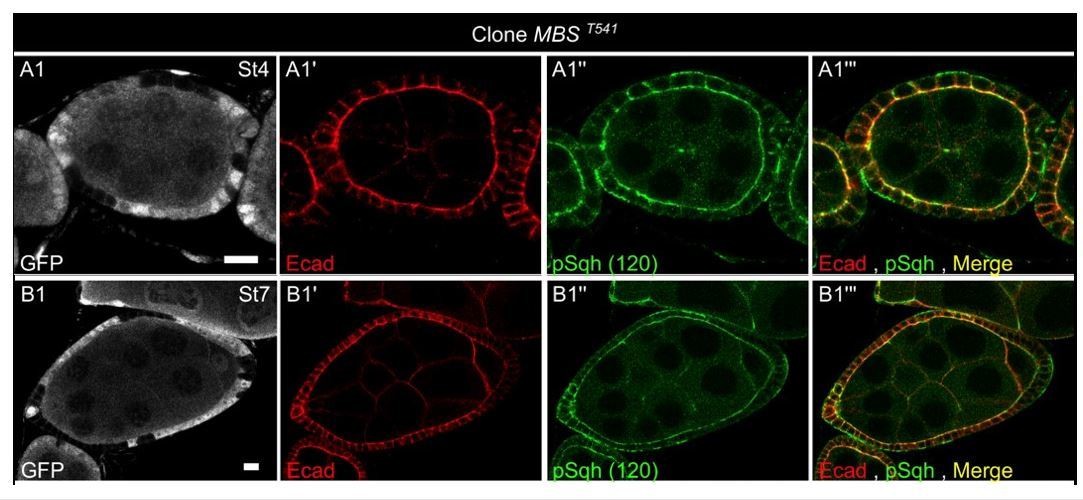
Myosin II is not controlled by JAK-STAT but is required at the poles.
(a) Apical level of phosphorylated Sqh (pSqh, white and [a′]) is reduced in a mutant Stat92E clone (RFP-negative) in a stage 3 follicle (z-projection of the superior half of the follicle). (b) Clonal overexpression of Hoptum (green cells) on a stage 7 follicle is not sufficient to increase the expression of apical pSqh (white and [b′]) z-projection of the superior half of the follicle). (c) pSqh staining in the middle plane of a wildtype stage 7 follicle. (d) Quantification of the intensity of apical pSqh along the AP axis of stage 6–7 follicles. n = 5 follicles. Baseline value = mean apical pSqh per follicle. (e) Illustration of extrapolated Aspect Ratio (eAR) calculation based on width measure of a pole at 25% of AP axis length. (f) Quantification of the extrapolated aspect ratio (eAR) of stage 4–7 WT follicles or follicles with a sqhAX3 or Rok2 clone covering the anterior pole (n ≥ 10). In WT follicles, the anterior is significantly more curved than the posterior, whereas the tendency is opposite with sqh and Rok clones. (p ***<0.001.) (g,h,I,j) representative images of (g) WT, (h) mediolateral sqhAX3 clone, (i) anterior sqhAX3 clone and (j) anterior Rok2 clone with the corresponding eARs. Full details of the genotypes and sample sizes are given in the supplementary files.
Figure 6 with 1 supplement
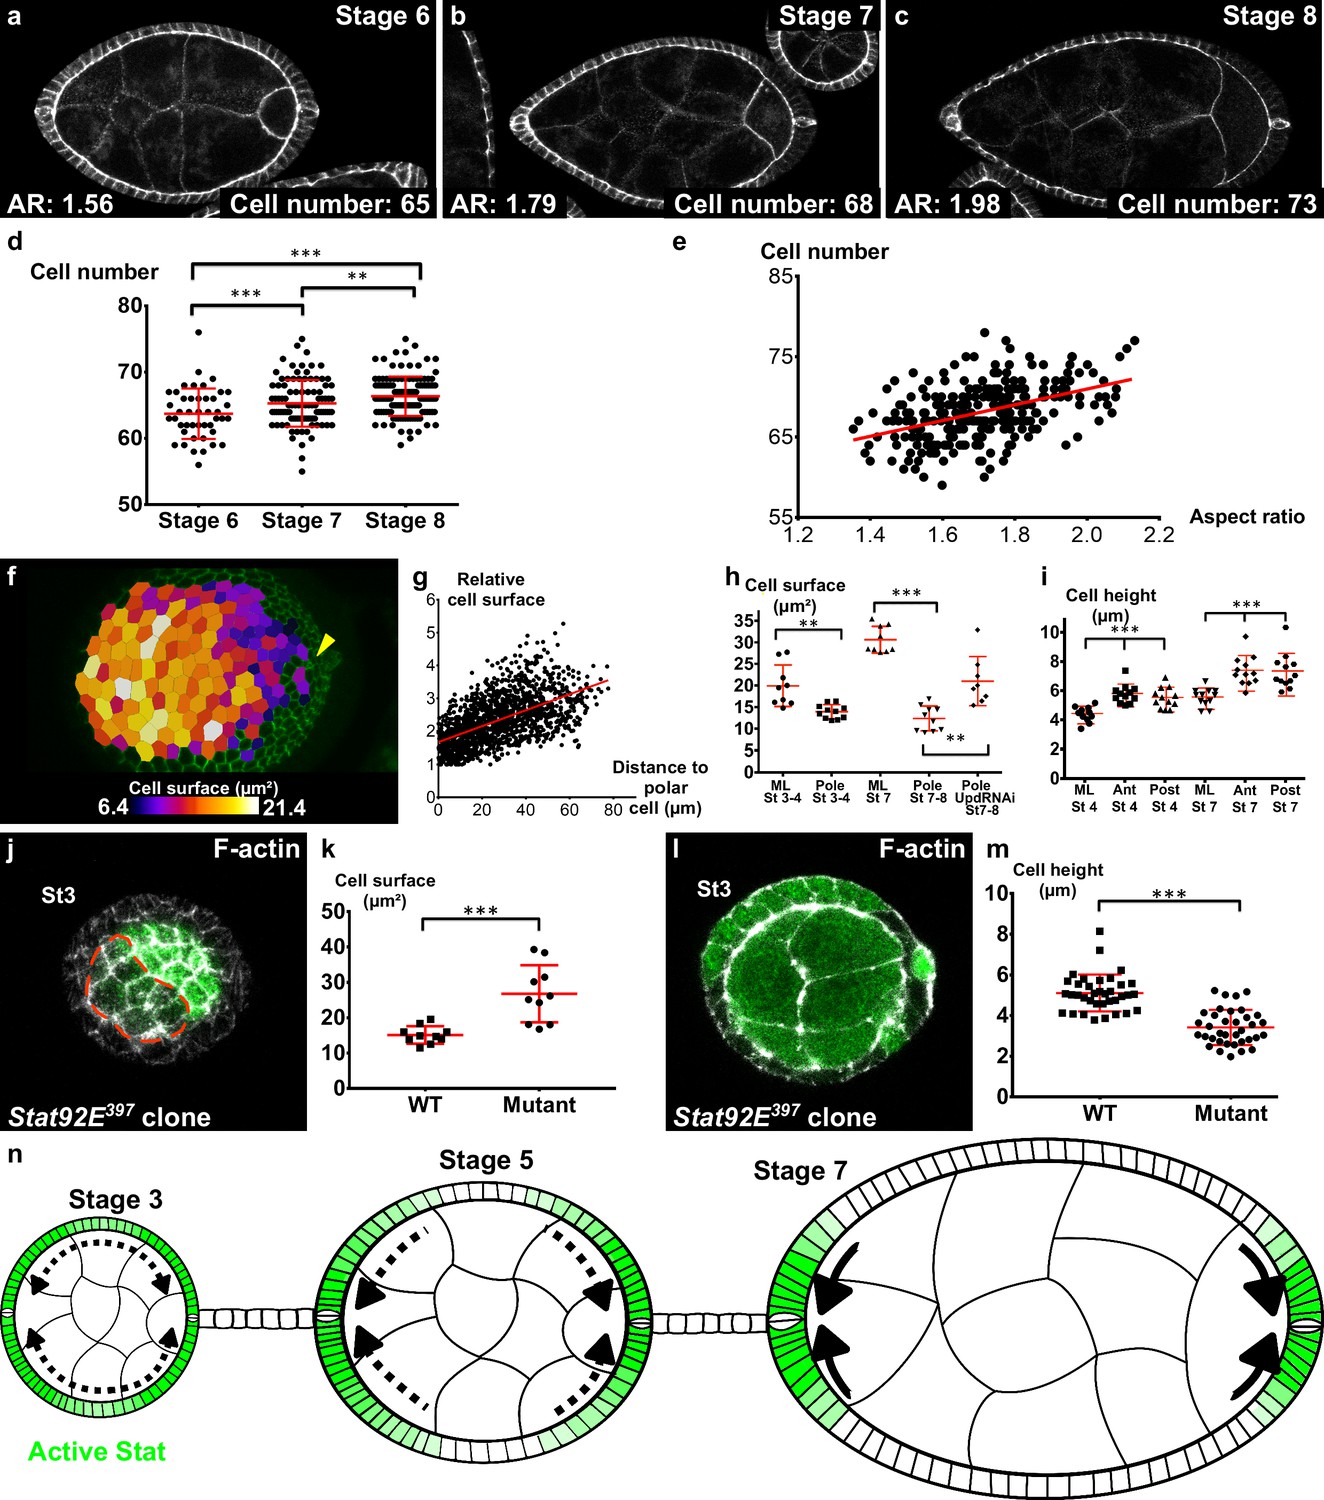
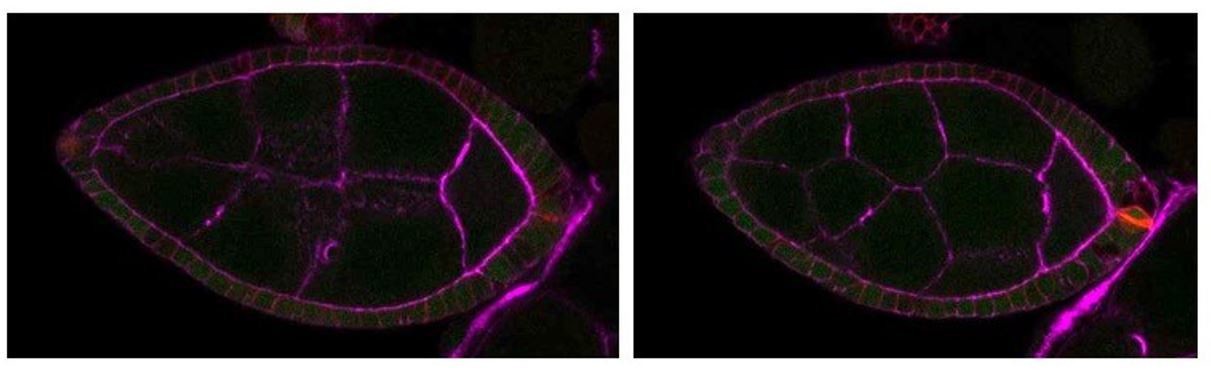
Localized apical cell constriction and oriented cell intercalation occur during early elongation.
(a–c) AR and number of cells along the polar cell plane in representative (a) stage 6, (b) stage 7 and (c) stage 8 follicles stained for DE-Cad. (d–e) Number of follicular cells in the plane of polar cells based on DE-Cad staining of stage 6–8 follicles depending on (d) the stage and (e) the aspect ratio of the follicle. (f) Heat map of the cell apical surface of a representative stage 7 follicle imaged as on Figure 4g. Arrowhead shows polar cells. (g) Quantification of the relative apical cell surface (smallest cell = 1) as a function of the distance from polar cells (n = 10 stage 7 follicles, 1487 cells). (h) Apical cell surface and (i) cell height depending on stage, position and genotype (ML, mediolateral). (j) Representative top view and (l) section view of Stat92E397 mutant clones at stage 3. Mutant cells have (k) a larger apical surface and (m) a lower cell height than do wildtype cells. Each dot corresponds to the mean value obtained for a clone. (n) Schematic figure showing the progressive restriction of JAK-STAT signaling (green) and of cell constriction to the follicle poles. p *<0.05, **<0.01, ***<0.001. Full details of the genotypes and sample sizes are given in the supplementary files.
Figure 6—figure supplement 1
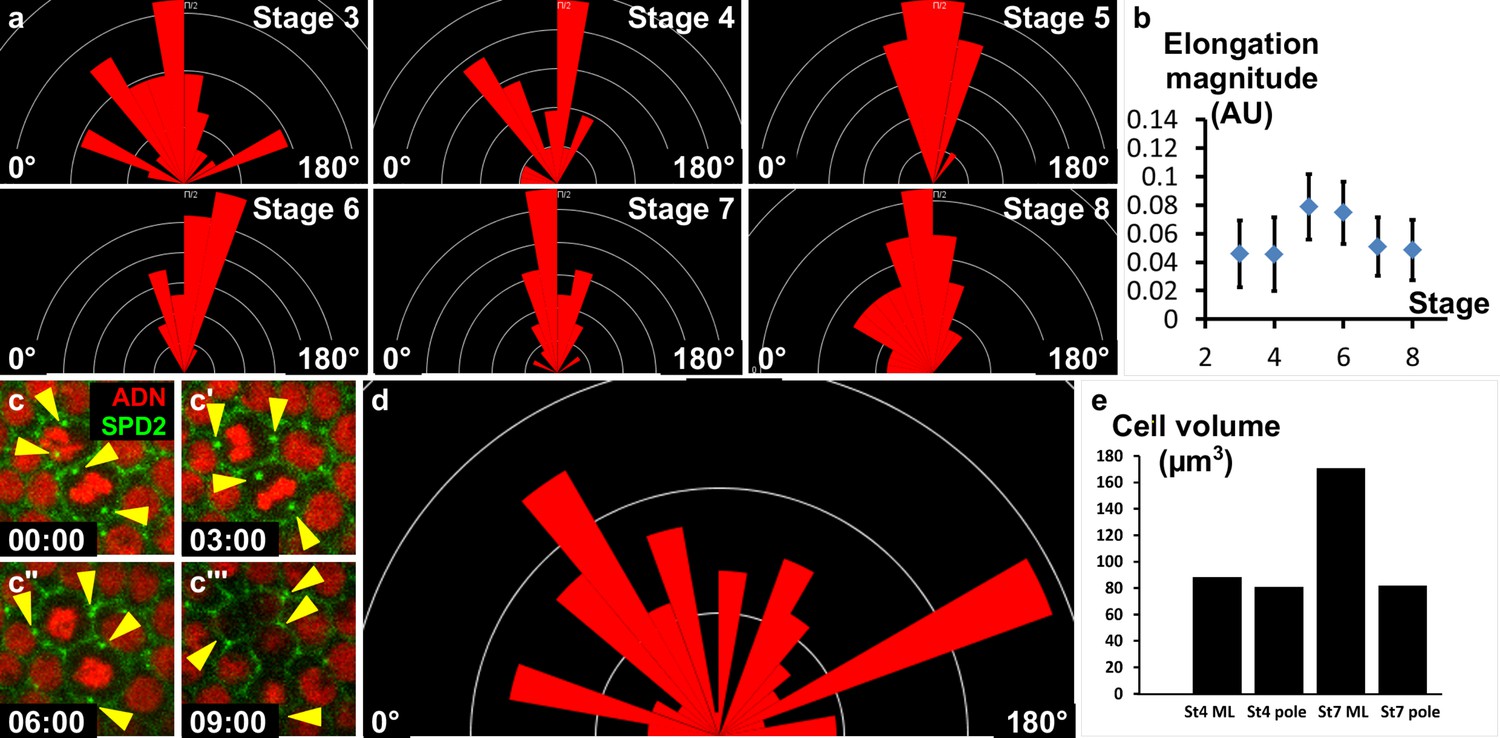
No contribution of cell elongation and cell division to early elongation.
(a) Orientation of cells with elongated shape in the mediolateral part of the follicle at the indicated stages (the X-axis corresponds to the AP axis). (b) Magnitude of the elongated cell shape according to the stage. Values correspond to an aspect ratio between 1.1 and 1.2. (c) Fluorescence video-microscopy images of dividing wildtype follicular cells that express H2A-RFP and SPD2-GFP to mark the centrosomes (yellow arrowheads). (d) Orientation of cytokinetic figures (the X axis corresponds to the AP axis). (e) Calculation of FC volume depending on the position (pole or mediolateral (ML)) and the stage. Volume is higher in stage 7 ML cells due to the mitosis/endoreplication switch that occurs at stage 6. However, cells at the poles maintain a lower volume.
Author response image 1
Author response image 2
Videos
Video 1
Full z-stack of a follicle with a mys mutant clone that affects polar cells.
https://doi.org/10.7554/eLife.32943.004
Video 2
Full z-stack of a follicle with a mys mutant clone that does not affect polar cells.
https://doi.org/10.7554/eLife.32943.005
Video 3
Stage 3 follicle expressing Sqh-GFP.
The pool of apical myosinII is very dynamic.
Video 4
Zoom in on a cell of a stage 3 follicle expressing Baz-GFP and Sqh-mCherry.
Apical MyosinII enrichment occurs at the same time as the apical cell domain contracts.
Video 5
Stage 3 follicle expressing Baz-GFP.
Cells in the mediolateral part undergo apical pulsations.
Video 6
Stage 7 follicle expressing Baz-GFP.
The apical surface variation is strongly reduced on the mediolateral part compared with stage 3 follicles.
Video 7
Stage 7 follicle expressing Baz-GFP observed from the pole.
Polar cells are indicated on the corresponding Figure 5d (red arrowheads). The pulse intensity remains high in these cells compared with Video 4. The rotation is visible and occurs around the polar cells.
Video 8
Stage 3 follicle expressing Baz-GFP observed from the pole.
Polar cells are indicated on the corresponding Figure 5b (red arrowhead).
Video 9
Stage 3 upd knockdown follicle expressing Baz-GFP.
The intensity of the pulse is reduced compared with a WT stage 3 follicle (Video 3).
Video 10
Stage 7 upd knockdown follicle expressing Baz-GFP and observed from the pole.
The intensity of the pulse is reduced compared with a WT stage 7 follicle (Video 6).
Video 11
Stage 7 follicle expressing ectopically Baz-mCherry.
The intensity of the pulse is low.
Video 12
Stage 7 follicle expressing ectopically Baz-mCherry and Hoptum.
Activation of the JAK-STAT pathway is sufficient to increase the pulsing.
Video 13
Movie representing a stage 7 DE-Cad-GFP follicle imaged over two hours.
One cell is tracked (red line). No intercalation occurs during this period.
Additional files
-
Supplementary file 1
Stock list and source.
The Baz-Cherry fusion protein was produced by cloning mCherry in frame at the C-terminus of the Par-6 coding sequence in the pUASP vector.
- https://doi.org/10.7554/eLife.32943.026
-
Supplementary file 2
Detailed genotypes and specific conditions.
HS: 1 hr heat-shock at 37°C, when not specified flies were kept at 25°C.
- https://doi.org/10.7554/eLife.32943.027
-
Supplementary file 3
Detailed sample size.
n corresponds to the number of analyzed follicles, with usually more than 10 segmented cells per follicle.
- https://doi.org/10.7554/eLife.32943.028
-
Transparent reporting form
- https://doi.org/10.7554/eLife.32943.029
Download links
A two-part list of links to download the article, or parts of the article, in various formats.
Downloads (link to download the article as PDF)
Open citations (links to open the citations from this article in various online reference manager services)
Cite this article (links to download the citations from this article in formats compatible with various reference manager tools)
Jak-Stat pathway induces Drosophila follicle elongation by a gradient of apical contractility
eLife 7:e32943.
https://doi.org/10.7554/eLife.32943


