Noncoding RNA-nucleated heterochromatin spreading is intrinsically labile and requires accessory elements for epigenetic stability
- George Williams Hooper Foundation, University of California San Francisco, United States
- University of California San Francisco, United States
- The University of Texas at Austin, United States
Figures
Figure 1 with 1 supplement

Heterochromatin spreading from ncRNA-nucleated elements is stochastic and produces intermediate states.
(A) Overview of heterochromatin spreading sensor. Three transcriptionally encoded fluorescent proteins are inserted in the genome: The ‘clamp’ site enables isolation of successful nucleation events, the ‘sensor’ reports on spreading events and the ‘noise filter’ normalizes for cell-to-cell noise. (B) Overview of the ura4::dhHSS1-7kb strains. Genes downstream of the ‘green’ nucleation color are annotated. The alg11 gene is essential. (C) Spreading from ura4::dh visualized by the HSS with ‘orange’ inserted at different distances shown in (B). The ‘red’-normalized ‘orange’ fluorescence distribution of ‘green”OFF cells plotted on a histogram. Inset: 2D-density hexbin plot showing red-normalized ‘green’ and ‘orange’ fluorescence within the size gate, with no ‘green’ or ‘orange’ filtering. The ‘green'OFF population is schematically circled. The fluorescence values are normalized to = 1 for the Δclr4 derivate of each strain. (D) TOP: cartoon overview of the FACS experiment for D. and E. ‘green'OFF cells collected from the ura4::dhHSS3kb were separated in three populations (‘Low’, ‘Intermediate’ and ‘High’) as shown schematically based on the ‘orange’ fluorescence. BOTTOM: ‘orange’ RT-qPCR signal for the indicated populations. The y-axis is scaled to = 1 based on the ‘orange’ signal in Δclr4. Error bars indicate standard deviation of two replicate RNA isolations. (E) ChIP for H3K9me2 and H3K4me3 in the same populations as (D). Each ChIP is normalized over input and scaled to = 1 for a positive control locus (dh repeat for H3K9me2 and act1 promoter for H3K4me3). Error bars indicate standard deviation of two technical ChIP replicates. Primer pairs for RT-qPCR and ChIP are indicated by solid and dashed line, respectively, in the C. ura4::dhHSS3kb diagram.
Figure 1—figure supplement 1

Validation of ectopic heterochromatin spreading sensor.
(A) Correlation of ade6p:SFGFP or ade6p:mKO2 with ade6p:3XE2C (Red) or act1p:1XE2C (High Red) in Δclr4 HSS size-gated cells. LEFT: Plots of green and orange vs. red channel signals of size-gated PAS 135 (Δclr4, ‘red’). RIGHT: Plots of green and orange vs. red channel signals of size-gated PAS 237 (Δclr4, ‘high-red’). The Pearson correlation between ‘green’ and ‘red’/‘high-red’ or ‘orange’ and ‘red’/‘high-red’ is shown. (B) Correlation of ade6p:SFGFP or ade6p:mKO2 with ade6p:3XE2C (Red) or act1p:1XE2C (High Red) in Δclr4 HSS in cells without size gate. Plots and Pearson correlation as above. (C) Effect of red-normalization on distribution of clr4+ HSS cells. Plots of green and orange vs. red channel signals of PAS 136, which contains the ectopic HSS (Figure 1C). LEFT: effect of using only size gate, without red normalization. RIGHT: effect of red-normalization with and without additional size gate. The distribution of cells is tightened by red-normalization. (D) Cell cycle stage of HSS and wild-type cells by flow cytometry. Wild-type cells (PM03, see strain table) were fixed, stained with Sytox green DNA stain, and analyzed by flow cytometry. LEFT: side vs. forward scatter plot. Dotted line: The approximate size gate encompassing all experiments reported. Pink area: cells analyzed in the experiment shown. RIGHT: Plot of area vs. width parameter for the Sytox green channel, gates are drawn to denote cell cycle phases, G2 (red), G1 and M (Blue), S (purple) as described (Knutsen et al., 2011). (E) Stochastic spreading and intermediate states produced by ncRNA-driven nucleators are replicated at a second ectopic site. LEFT: Overview of the his1::dhHSS3kb. The colors are reversed relative to the ura4::dhHSS1-7kb with ‘orange’ as the ‘nucleation clamp’ and ‘green’ as the ‘sensor’. ‘Orange’ replaces the his1 gene and ‘green’ is located 3 kb downstream within the rec10 open-reading frame. RIGHT: histogram of ‘red’-normalized ‘green’ fluorescence distribution of ‘orange'OFF cells. Inset: 2D density hexbin plot.
Figure 2 with 2 supplements
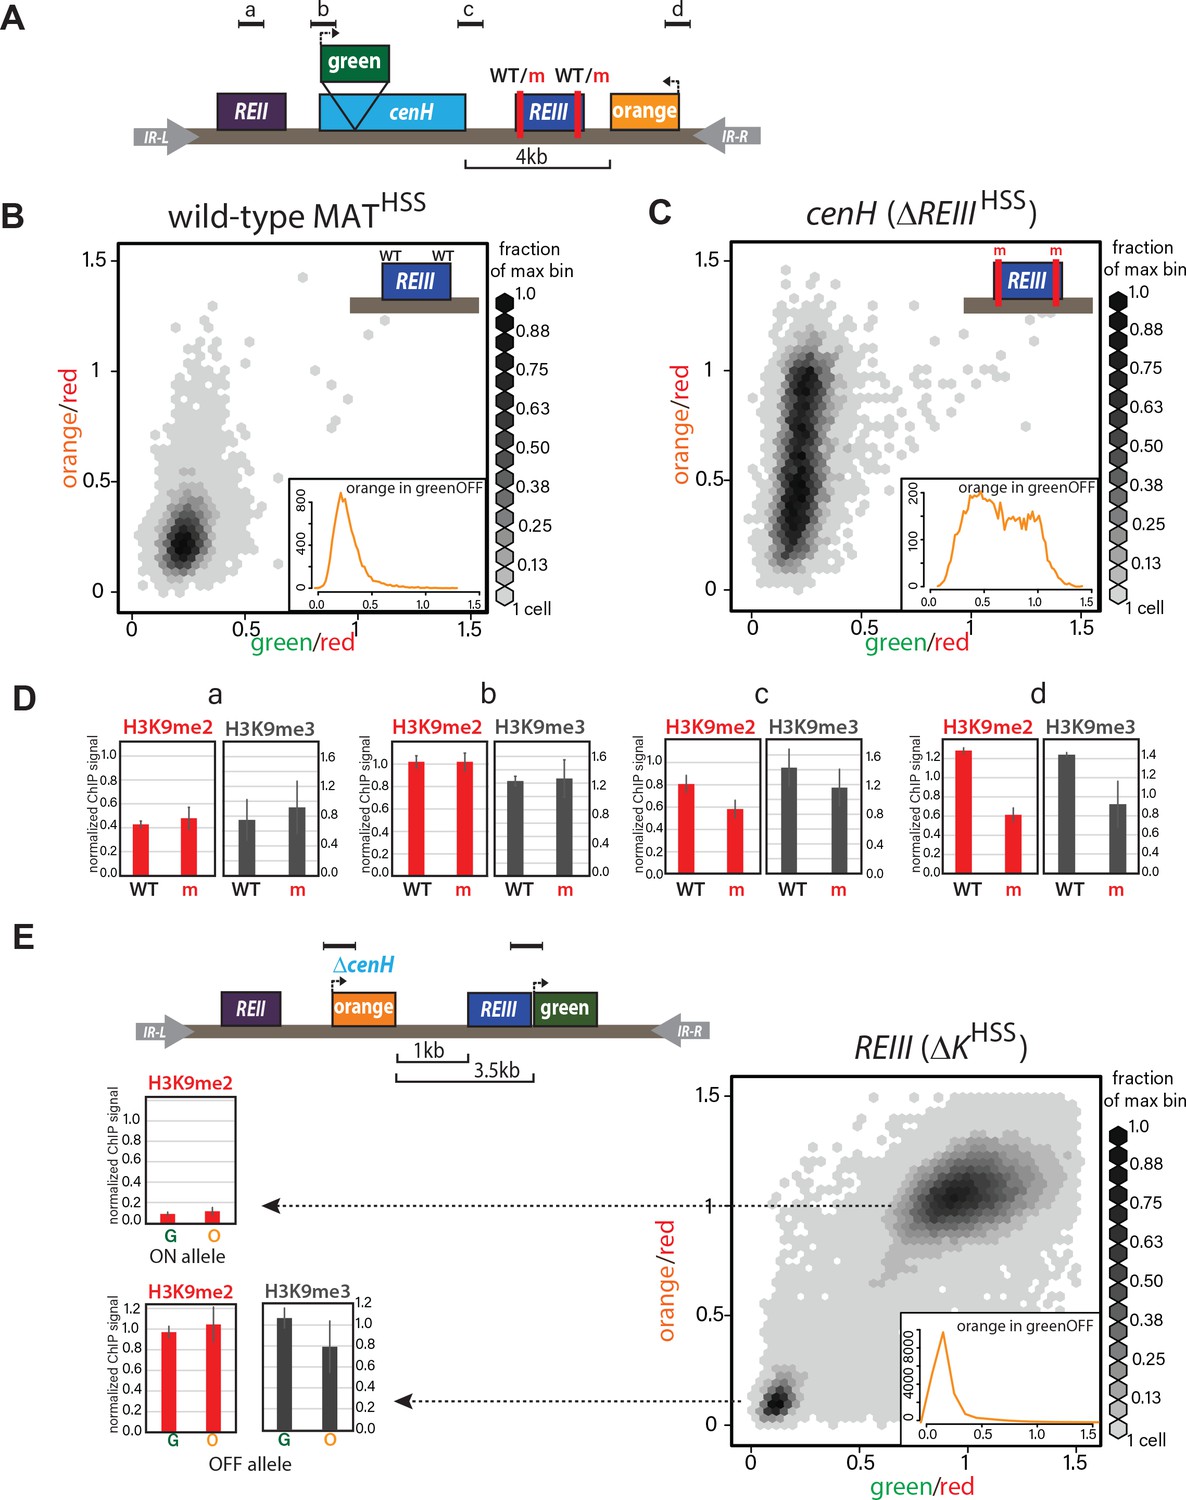
ncRNA-dependent and independent nucleation yields qualitatively different spreading reactions in the MAT locus.
(A) Diagram of the reporters within MATHSS and ΔREIIIHSS. WT and m for REIII indicate the presence or deletion of the Atf1/Pcr1 binding sites, respectively. (B) 2D-density hexbin plot showing the ‘red’-normalized ‘green’ and ‘orange’ fluorescence for wild-type MATHSS cells. Scale bar shows every other bin cutoff as a fraction of the bin with the most cells. Inset: histogram of the ‘red’-normalized ‘orange’ fluorescence distribution of ‘green'OFF cells. (C) 2D-density hexbin plot and inset as above for ΔREIIIHSS, which contains two 7 bp Atf1/Pcr1-binding site deletions (m) within the REIII element. (D) ChIP for H3K9me2 (red) and H3K9me3 (grey) for amplicons indicated in (A). normalized to dh. WT, wild-type MATHSS, m, ΔREIIIHSS. (E) TOP: diagram of the reporters within ΔKHSS. The cenH nucleator and additional 5’ sequence is deleted and replaced by ‘orange’. ‘green’ is located directly proximal to REIII and serves as the nucleation clamp. ChIP amplicons are indicated as black bars. BOTTOM: 2D- density hexbin plot and inset as above. LEFT: ChIP for H3K9me2 (red) and H3K9me3 (grey) for ‘green’ and ‘orange’ in isolated ΔKHSS-ON or ΔKHSS-OFF alleles. In hexbin plots, the Δclr4 derivative of each strain was used to normalize the X- and Y-axes to = 1. Error bars indicate standard deviation of technical replicates.
Figure 2—figure supplement 1
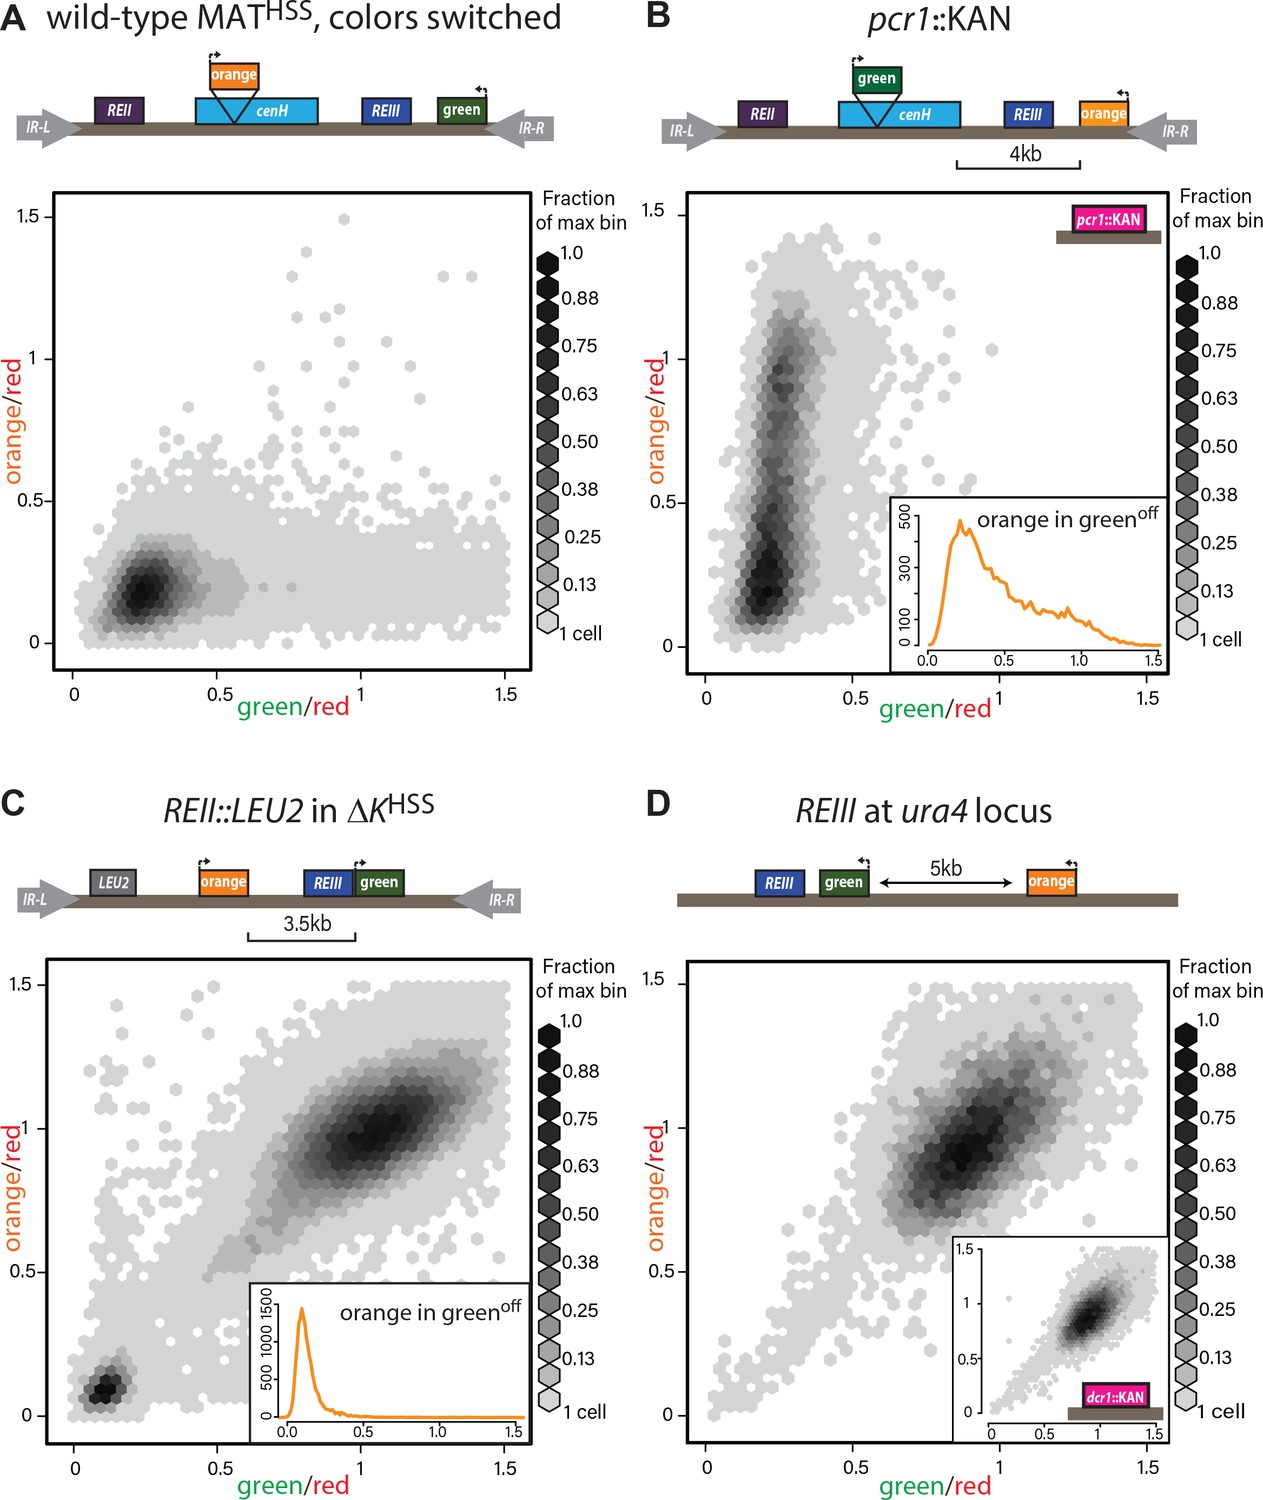
Heterochromatin spreading characteristics of cis-acting elements at the tightly repressed MAT locus.
(A) The MATHSS documents tight repression of the wild-type MAT locus. As in Figure 2A and B, with ‘green’ and ‘orange’ switched. (B) Stochastic spreading with intermediate states in pcr1::KAN. pcr1 transcription factor was knocked-out in the PAS217 wild-type MATHSS. Plot and inset as in Figure 2B. (C) REII does not contribute to bimodal distribution seen for ΔKHSS. The REII locus (1 kb) was replaced with the LEU2 gene before clr4+ was introduced by cross. (D) REIII is unable to establish spreading at an ectopic site. 2D density hexbin plots of ura4::REIIIHSS5kb. Normalized green and orange are near 1.0, indicating a failure to repress both reporters. Inset: 2D density hexbin plots of ura4::REIIIHSS5kb dcr1::KAN. dcr1 was deleted to release extra heterochromatin factors from RNAi- repressed loci. No additional silencing is detected.
Figure 2—figure supplement 2
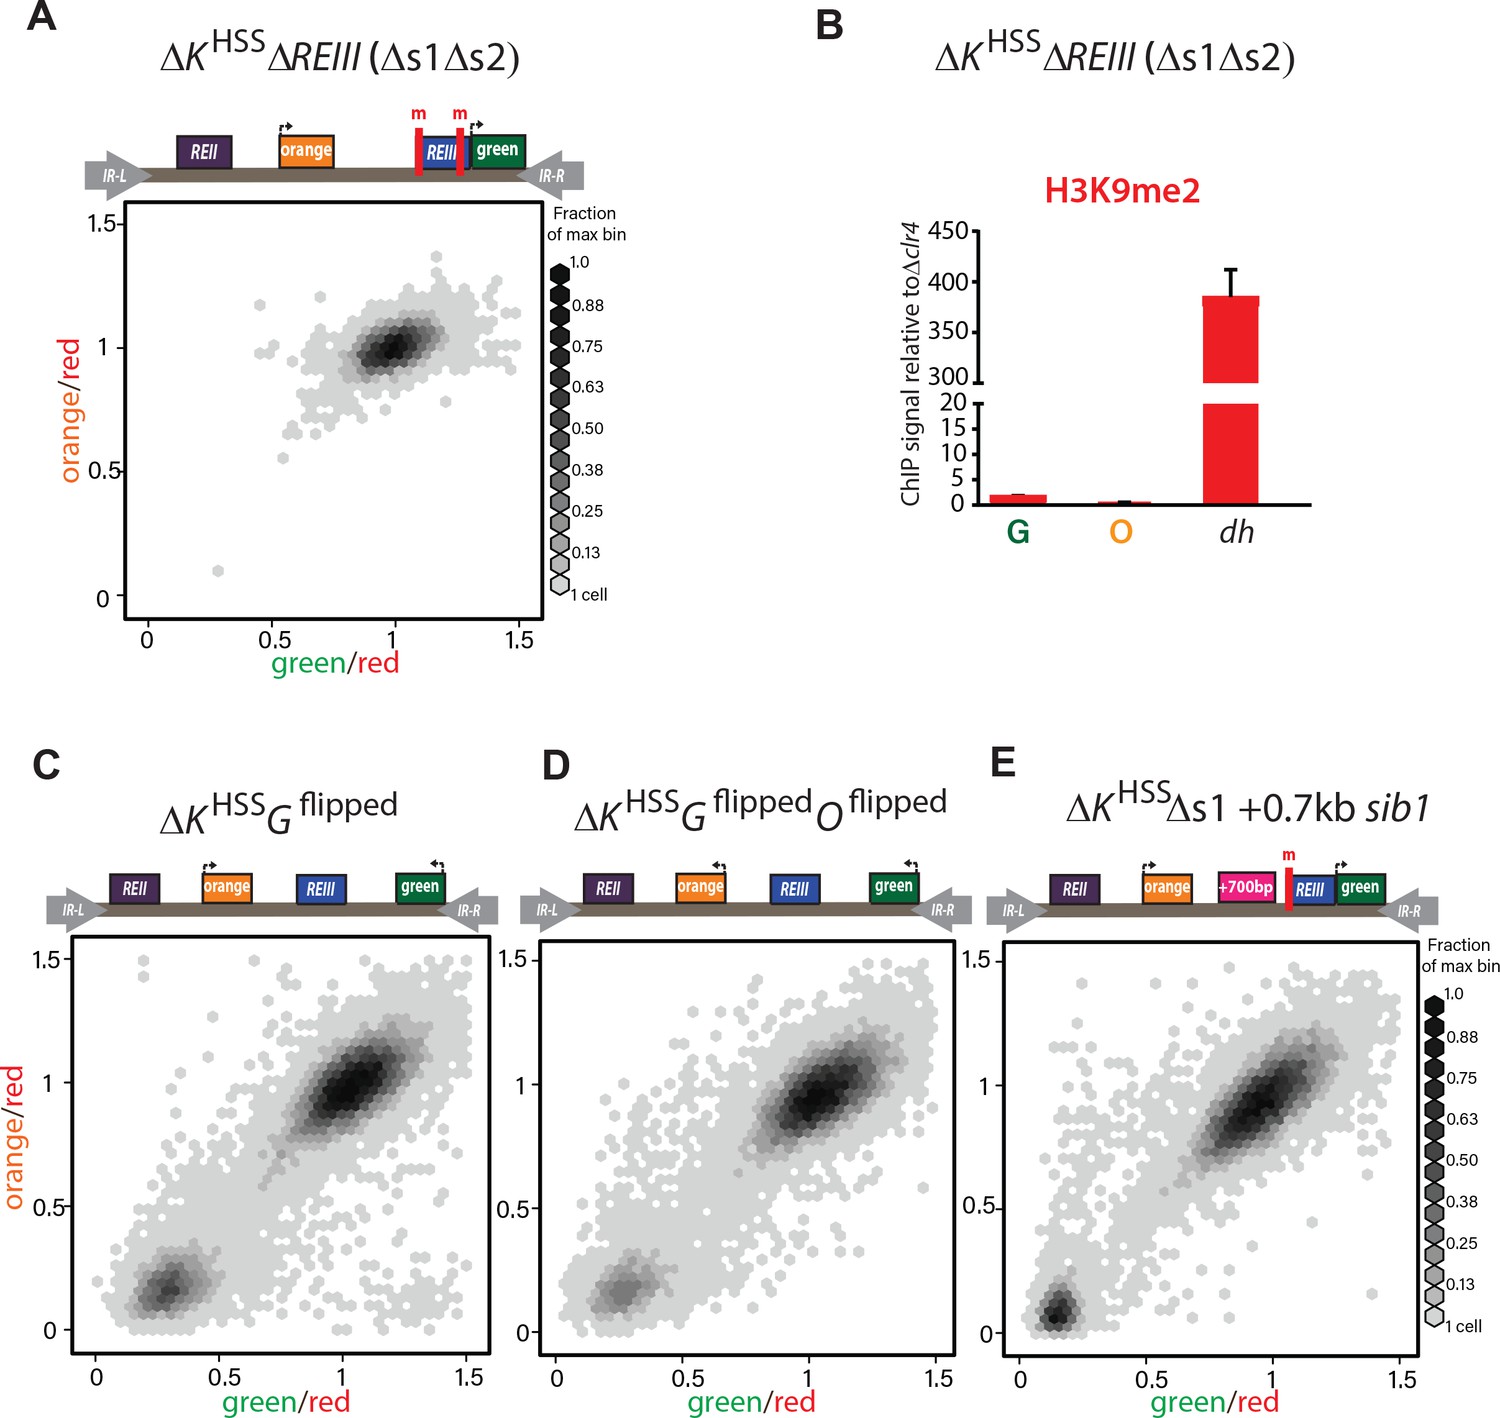
REIII is required for heterochromatin formation in ΔKHSS.
(A) Deletion of both Atf1-/Pcr1-binding sites before introduction of clr4+ in ΔKHSS blocks gene silencing. In 34/34 strains tested (one representative shown), ΔKHSSΔs1Δs2 cannot form repressed states. (B) H3K9me2 does not accumulate when both Atf1/Pcr1-binding sites are deleted in ΔKHSS. H3K9me2 ChIP in ΔKHSSΔs1Δs2 at ‘green’, ‘orange’ and dh. (ΔKHSS-OFF accumulates H3K9me2 to similar extent as dh, Figure 2E). Error bars indicate standard deviation of technical replicates. (C) ‘green’ orientation and position does not substantially affect ΔKHSS behavior. In ΔKHSS Gflipped‘green’ is flipped in orientation with respect to ΔKHSS. (D) ‘green’ and ‘orange’ orientations do not substantially affect ΔKHSS behavior. In ΔKHSS Gflipped Oflipped‘green’ is located as in C and ‘orange’ is flipped in orientation with respect to ΔKHSS. ‘green’ in (C) and (D) is 2.1 kb downstream from its location in ΔKHSS now on the distal side of the mat3m cassette. (E) Increasing distance between REIII and ‘orange’ does not substantially affect ΔKHSS behavior. The Atf1/Pcr1-binding site proximal to ‘orange’ was deleted (Δs1) and 700 bp of the sib1 ORF inserted to the left of the Δs1 site. 2D-hexbin plots as in Figure 2.
Figure 3 with 7 supplements

Single-cell analysis of nucleation and spreading using a Fission Yeast Lifespan Micro-dissector (FYLM).
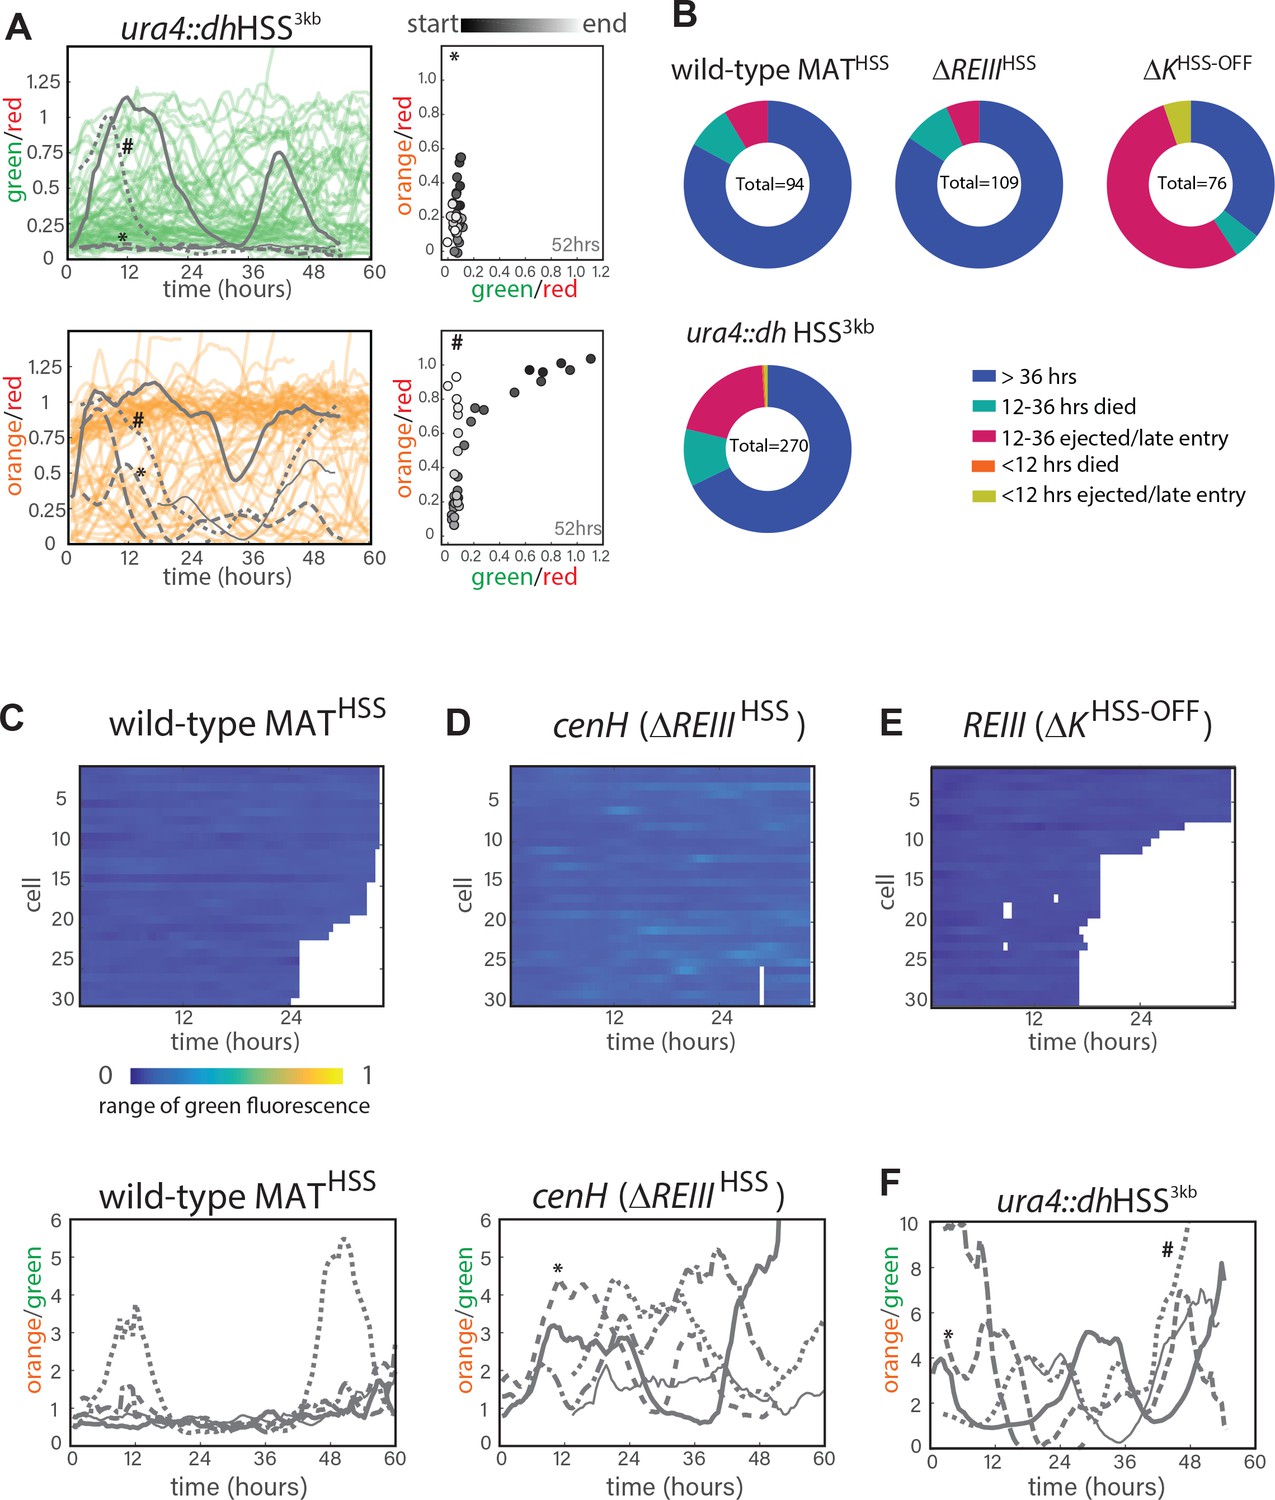
(A) Overview of the FYLM-based heterochromatin spreading assay. The old-pole cell is trapped at the bottom of one of hundreds of wells in the FYLM microfluidic device and is continuously imaged in brightfield (to enable cell annotation), green, orange and red channels. Hypothetical example traces are shown. (B) Maximum values attained by each nucleated cell for normalized ‘orange’ plotted against normalized ‘green’. Solid horizontal lines correspond to y = 0 and y = 0.5. Dashed line corresponds to an ON cutoff determined by mean less three standard deviations for each strain’s matched Δclr4 strain. Percentage of cells between each line was calculated. (C) FYLM analysis of wild-type MATHSS cells. CELL TRACES: 60 hr of normalized ‘green’ (left) and ‘orange’ (right) fluorescence in cells that maintained nucleation with the same five cells overlaid in different gray line styles in both plots. Gaps indicate loss of focus. HEATMAP: Up to 36 hr of normalized ‘orange’ fluorescence for 30 cells that maintained nucleation is represented from blue (0) to yellow (1). X-Y FLUORESCENCE PLOT: for one representative sample cell, plot of normalized ‘green’ and ‘orange’ fluorescence across its measured lifetime (grayscale). (D) FYLM analysis of ΔREIIIHSS cells as in C. The example cell in the X-Y dot plot is marked with an asterisk(*) on the orange traces (E) FYLM analysis of ΔKHSS-OFF isolate, as in C., D. All cells were normalized to Δclr4 (max, 1).
Figure 3—figure supplement 1
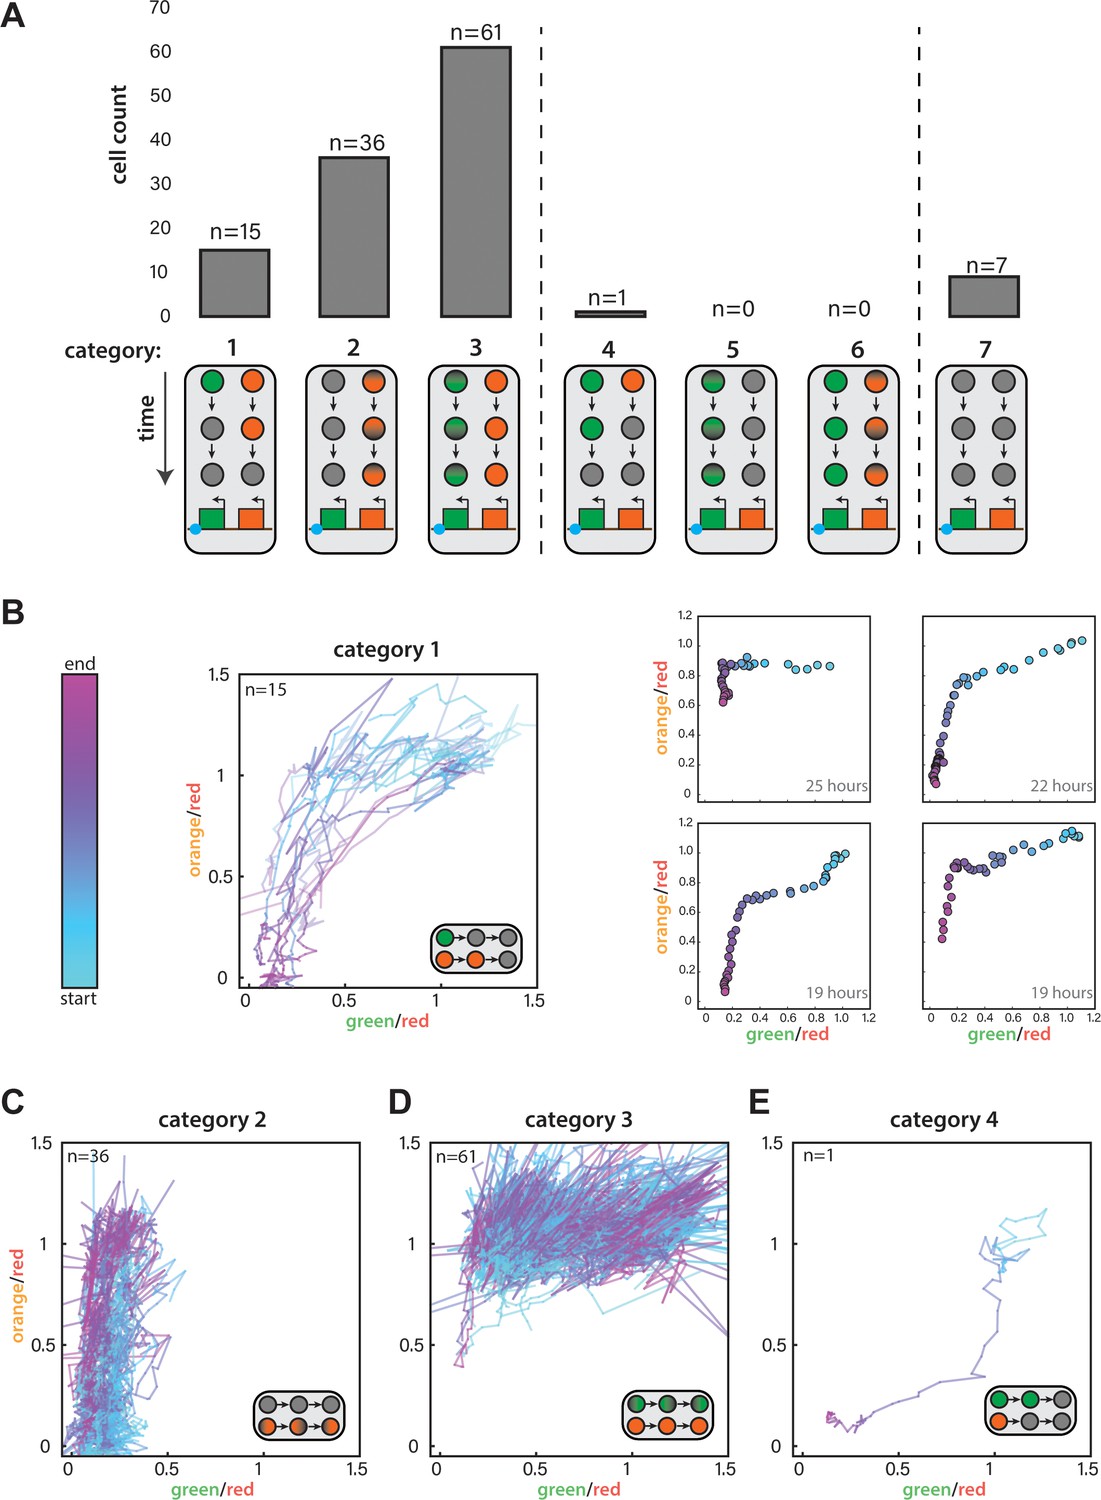
Single-cell analysis of nucleation and spreading using a Fission Yeast Lifespan Micro-dissector (FYLM).
(A) For ura4::dhHSS3kb FYLM experiments, counts of cells in each of seven categories. Diagrams indicate the time-dependent silencing behaviors of cells in each category. Categories 1–3 are consistent with proximal to distal silencing, whereas categories 4–6 are consistent with a distal to proximal silencing. (B) Time-dependent traces showing cells from Category 1 where the normalized ‘green’ and ‘orange’ values at each time point are plotted color-coded by time where blue and pink represent the start and end of the measurement, respectively. LEFT: Traces for all Category 1 cells, which begin at the start of the silencing event with both colors fully expressed and end when both colors have reached their local minimum. RIGHT: Four example cells where points represent 30-min time points colored from the start to end of the event. The duration of the time represented is indicated in the lower right corner. (C) Traces for Category 2 cells during their entire measured lifespan. (D) Traces for Category 3 cells during their entire measured lifespan. (E) Time-dependent traces for the one cell in Category 4. Lines are plotted and time is curated as in (B).
Figure 3—figure supplement 2
Single-cell analysis of nucleation and spreading using a Fission Yeast Lifespan Micro-dissector (FYLM).
(A.) FYLM analysis of ura4::dhHSS3kb cells. TOP LEFT: 60 hr of normalized ‘green’ fluorescence, a subset of cells are shown for clarity. five example cells are overlaid in gray each with different line types. BOTTOM LEFT: 60 hr of normalized ‘orange’ fluorescence in the matching subset of cells with the same five overlaid in gray. *, # represent two example cells. RIGHT: for two representative sample cells imaged, plots of normalized ‘green’ and ‘orange’ across its measured lifetime (grayscale). The corresponding cells are marked in the orange traces on LEFT. (B) Categorization of cell longevity of all cells analyzed in the FLYM experiment. Measured lifespan ends when a cell dies or is ejected from its capture channel. (C) For wild-type MATHSS TOP: ‘green’ fluorescence heatmap (blue (0) to yellow (1)) for the same 30 cells as in 3C. BOTTOM: 60 hr of traces for ‘orange’ divided by ‘green’ for the five example cells indicated in 3C. (D) ‘green’ fluorescence heatmap and ‘orange’/”green’ traces for ΔREIIIHSS as in C. (E) ‘green’ fluorescence heatmap ΔKHSS as in C. (F) ‘orange’/”green’ traces for ura4::dhHSS3kb as in C. *, # indicate the same cells as in A.
Figure 3—video 1
Cell #274 from strain PAS244.
This movie consists of imaging in four channels, listed from top to bottom: Bright field, ‘green’, ‘orange’, and ‘red’ for cell #274 from the strain PAS244 ura4HSS3kb. X-Y fluorescence plot for this cell is shown in Figure 3—figure supplement 2A, top right.
Figure 3—video 2
Cell #271 from strain PAS244.
This movie consists of imaging in four channels, listed from top to bottom: Bright field, ‘green’, ‘orange’, and ‘red’ for cell #271 from the strain PAS244 ura4HSS3kb. X-Y fluorescence plot for this cell is shown in Figure 3—figure supplement 2A, bottom right.
Figure 3—video 3
Cell #350 from strain PAS389.
This movie consists of imaging in four channels, listed from top to bottom: Bright field, ‘green’, ‘orange’, and ‘red’ for cell #350 from the strain PAS389 WT MATHSS. X-Y fluorescence plot for this cell is shown in Figure 3C. Fluctuations of colors in this video occur over a narrow range (see Figure 3C RIGHT) and are amplified due to relative scaling in the video with respect to background.
Figure 3—video 4
Cell #407 from strain PAS391.
This movie consists of imaging in four channels, listed from top to bottom: Bright field, ‘green’, ‘orange’, and ‘red’ for cell #407 from the strain PAS391 ΔREIIIHSS. X-Y fluorescence plot for this cell is shown in Figure 3D.
Figure 3—video 5
Cell #123 from strain PAS387.
This movie consists of imaging in four channels, listed from top to bottom: Bright field, ‘green’, ‘orange’, and ‘red’ for cell #123 from the strain PAS387 ΔKHSS. X-Y fluorescence plot for this cell is shown in Figure 3E.
Figure 4 with 2 supplements
ncRNA-nucleated spreading exhibits weak memory and resistance in the absence of REIII.
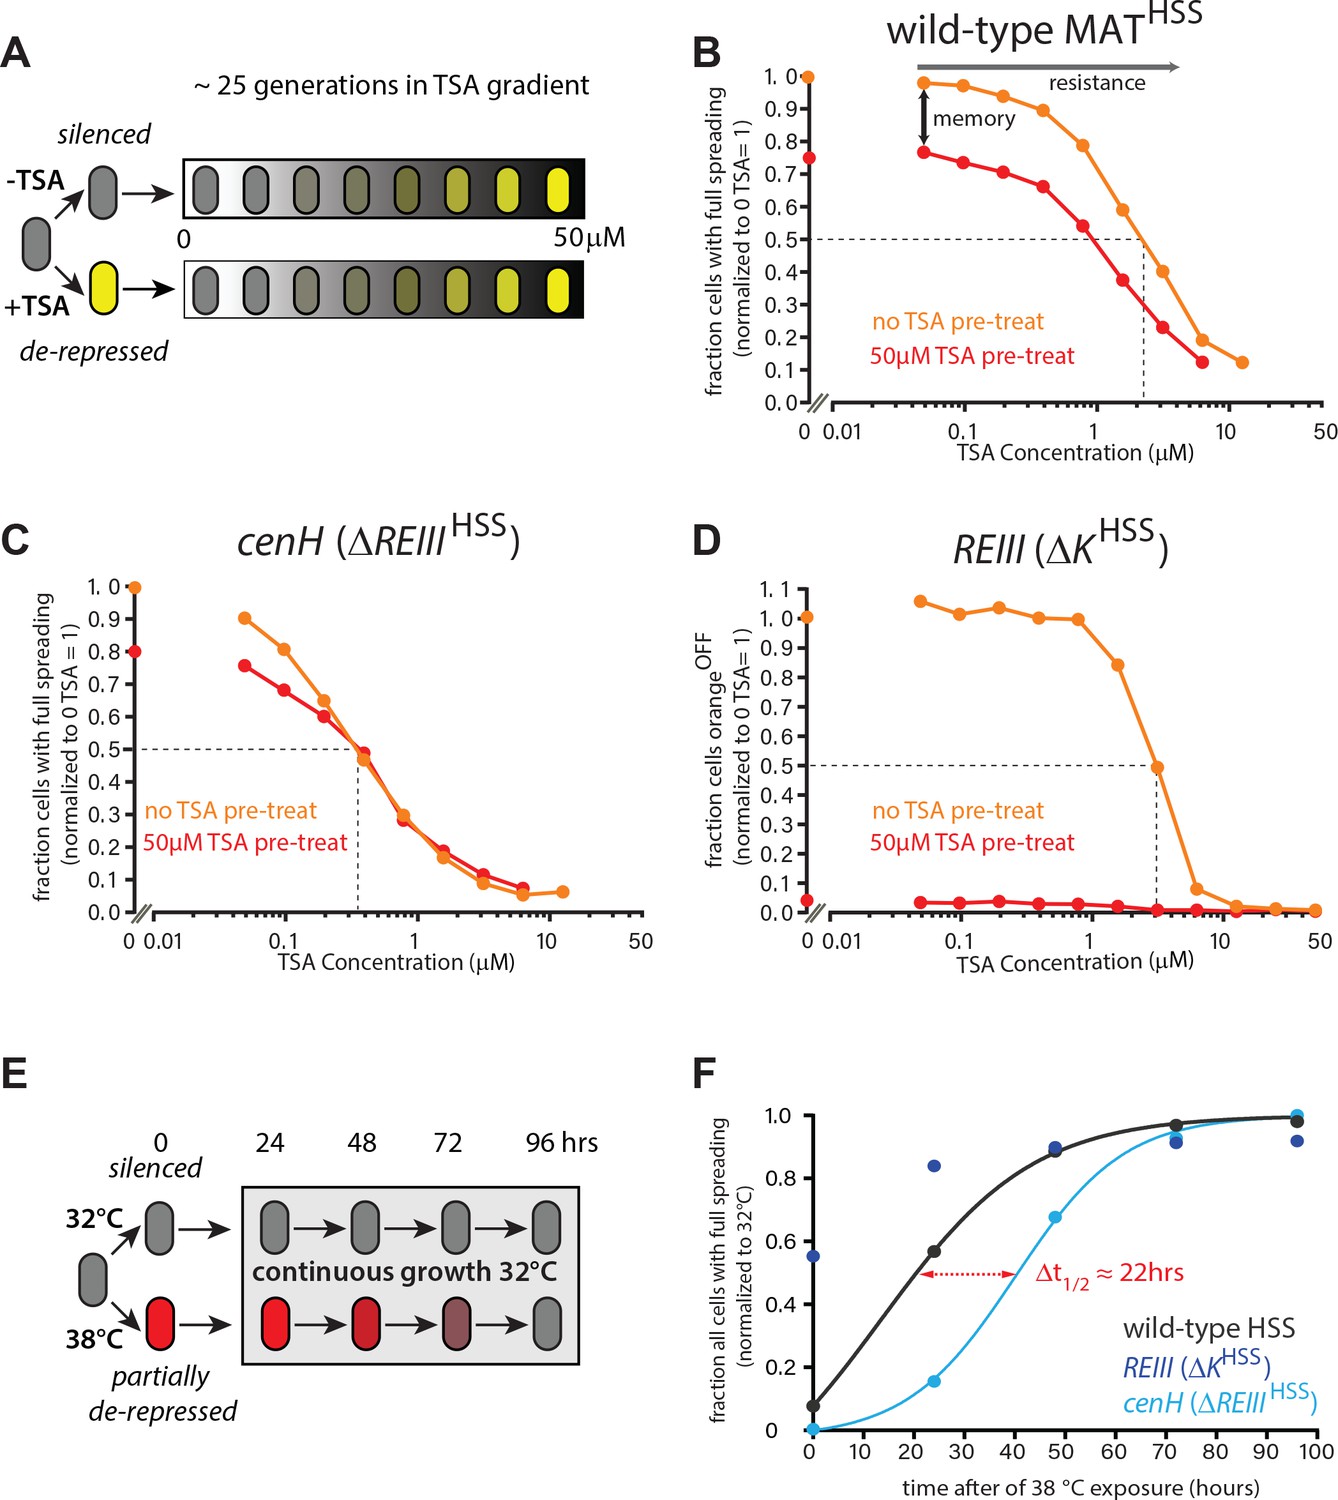
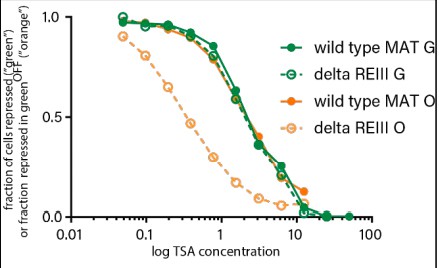
(A) Experimental schematic for memory and resistance measurements. Cells in log phase were treated with TSA (50 μM) for 10 generations to erase all heterochromatin (de-repressed, yellow) or kept untreated (repressed, gray). Both populations are then grown in a gradient of TSA concentration from 0 to 50 μM for 25 generations. (B) The wild-type MAT locus exhibits memory in silencing ‘orange’ throughout the TSA gradient. The fraction of ‘green'OFF cells that fully silence ‘orange’ normalized to the no TSA pre-treatment, 0 μM TSA point are plotted for each TSA concentration. Red line: cell ancestrally TSA pre-treated; light orange line: cells without pre-treatment. (C) Spreading from cenH exhibits weak memory and low resistance. Cell populations as above. (D) ncRNA-independent spreading exhibits high resistance. The fraction of ‘orange'OFF for all cells is plotted, because in the TSA pre-treatment almost no ‘green'OFF cells can be detected. Dotted lines indicate the half-resistance points: TSA concentration at which 50% of non-pretreated cells fail to form heterochromatin at ‘orange’. Memory is the difference between orange and red lines. One of two full biological repeats of the experiment is shown.( E) Experimental schematic for heat stress and recovery. Cells were grown at either 32 or 38°C for 10 generations and strains subsequently grown continuously for 96 hr at 32°C. (F) The fraction of cells with full spreading (‘green'OFF and ‘orange'OFF) after 38°C exposure and recovery normalized to the fraction of cells with full spreading at 32°C for each strain is plotted over time. For wild-type MATHSS and ΔREIIIHSS strains, we fit a simple sigmoidal dose response curve and determined a t1/2 value. The difference in t1/2 values or Δt1/2 is ~22 hr or ~9–10 generations.
Figure 4—figure supplement 1
heterochromatin behaviors during TSA treatment and after 35 generations.
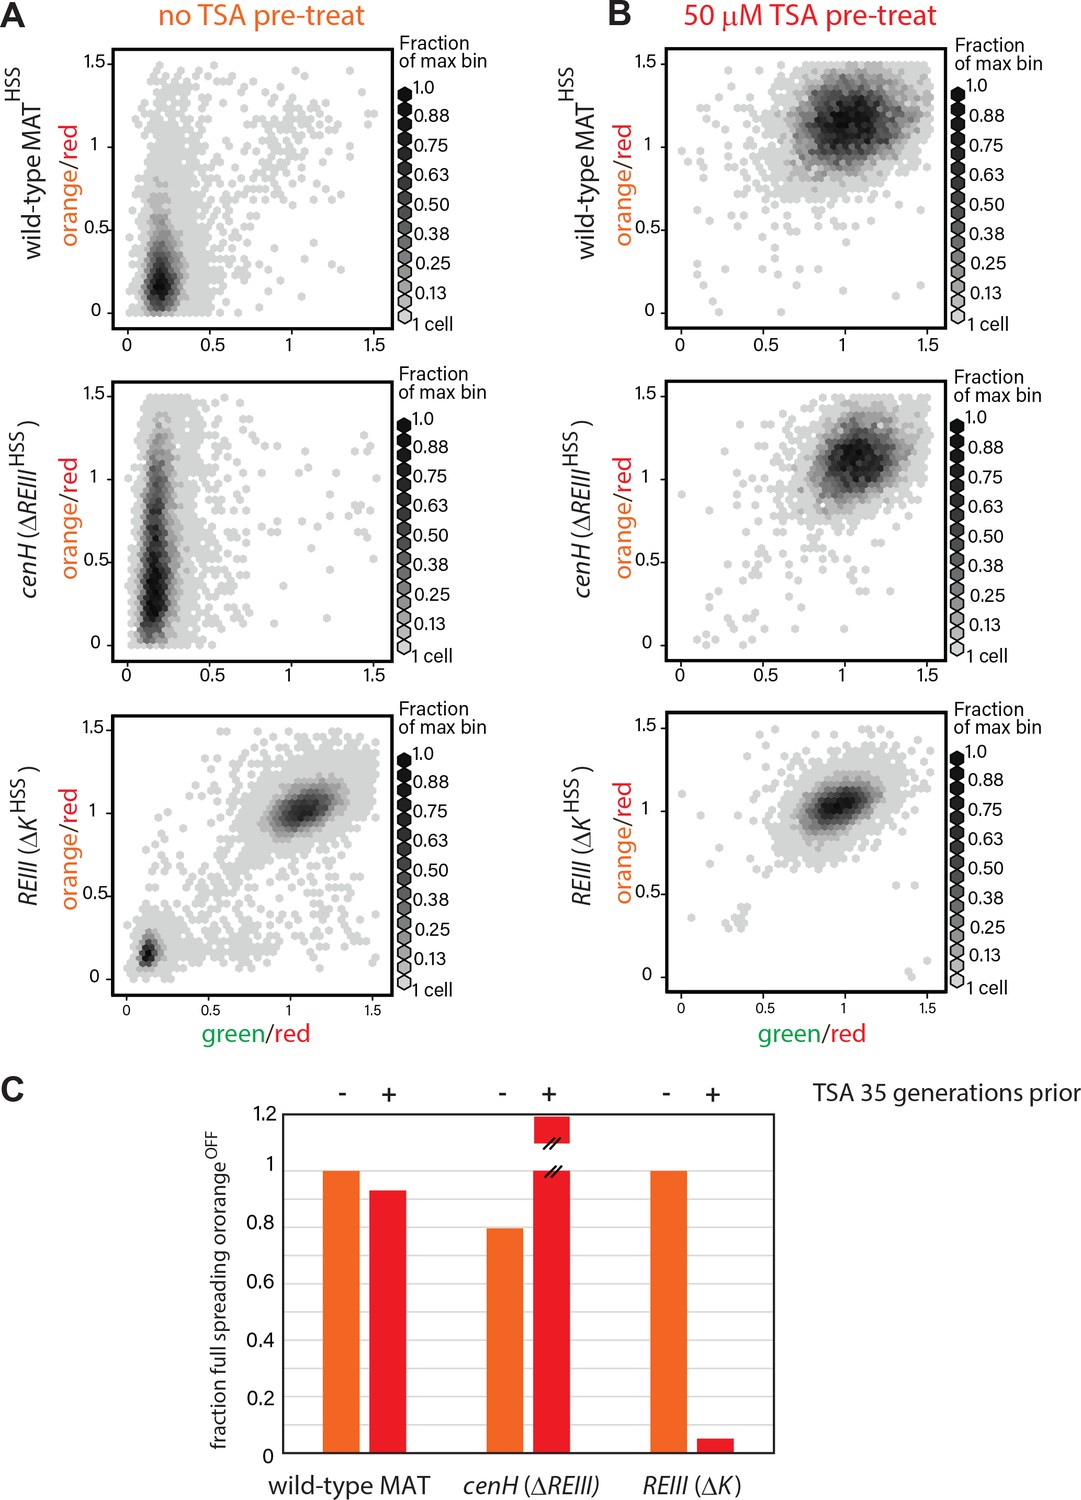
(A) 2D density hexbin plots of wild-type MATHSS, ΔREIIIHSS, and ΔKHSS strains grown 10 generations without TSA. (B) 2D density hexbin plots of wild-type MAT locusHSS, ΔREIIIHSS, and ΔKHSS strains grown 10 generations in 50 μM TSA. The density distributions are near 1.0 in all strains indicating complete erasure of heterochromatin. (C) History dependence at 35 generations after pretreatments. The fraction of cells with full spreading (wild-type MAT and ΔREIII) or fraction of cells with orangeOFF (ΔK) normalized to the highest value for ancestrally untreated cells (=1) is shown for the 0 µM TSA point. TSA pretreated cells for ΔREIIIHSS show higher repression than untreated cells. We interpret this to indicate experimental variations in silencing in the absence of memory. This is because for all other circumstances, TSA treatment results in reduced spreading, including for ΔREIIIHSS at 25 generations post-treatment.
Figure 4—figure supplement 2
Behavior of MAT heterochromatin at elevated temperature.
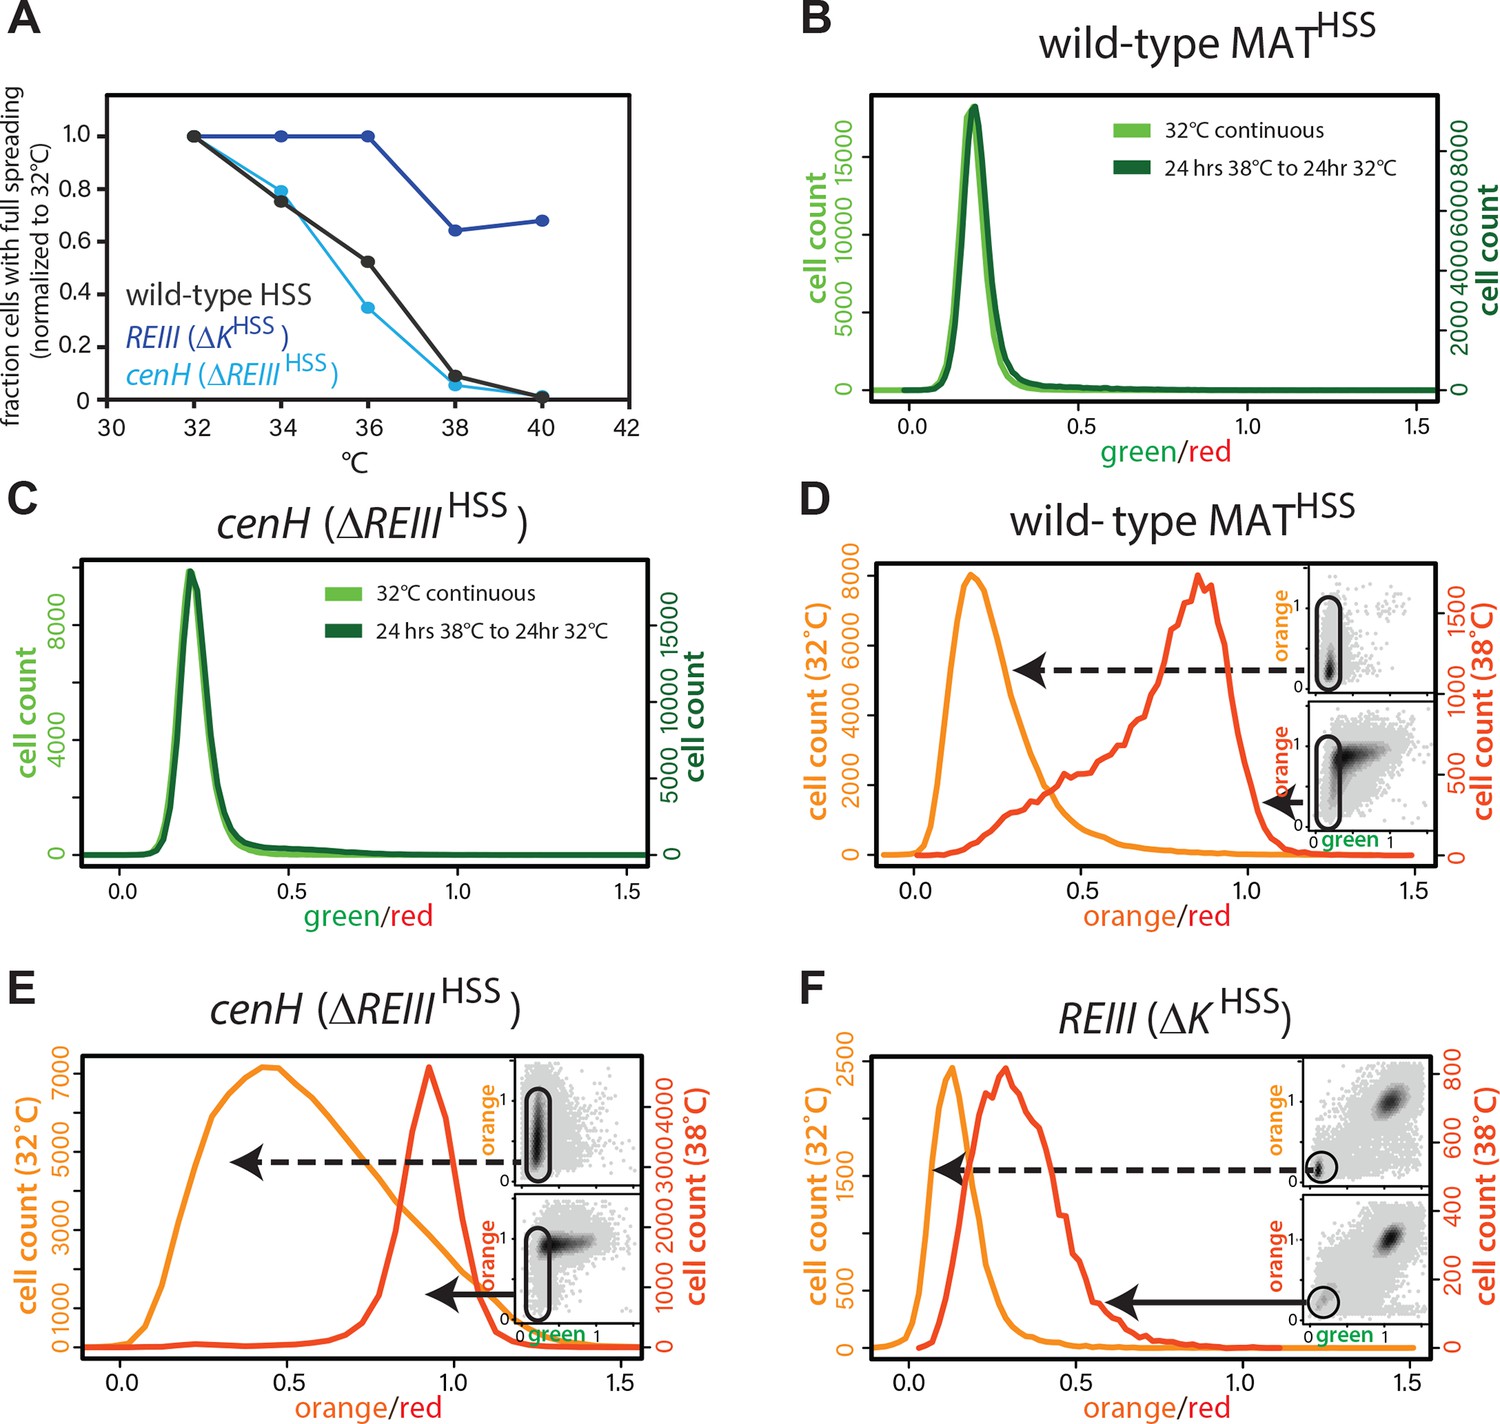
(A) The resistance of the heterochromatin state from 32°C to 40°C in wild-type MATHSS, ΔKHSS, and ΔREIIIHSS. The fraction of cells that fully repress both ‘orange’ and ‘green’ (full spreading) at each temperature is plotted normalized to the given strains value at 32°C. (B and C) nucleation is recovered within 24 hr at 32°C. 1-D histogram showing the distribution of green fluorescence in wild-type MAT locusHSS (B) or ΔREIIIHSS (C) cells grown either for 48 hr continuously at 32°C (left y-axis, light green) or heat stressed for 24 hr at 38°C followed by 24 hr growth at 32°C (right y-axis, dark green). (D–F) Histograms of ‘red’-normalized ‘orange’ fluorescence distribution in ‘green'OFF cells are shown for cells grown at both 32°C (light orange) and 38°C (dark orange). Insets: 2D density hexbin plots, ‘green'OFF cells are schematically circled. (C-E) represent t = 0 in Figure 4F.
Figure 5 with 1 supplement
Differential inheritance of ncRNA-dependent and independent spreading in the absence of nucleation factors.
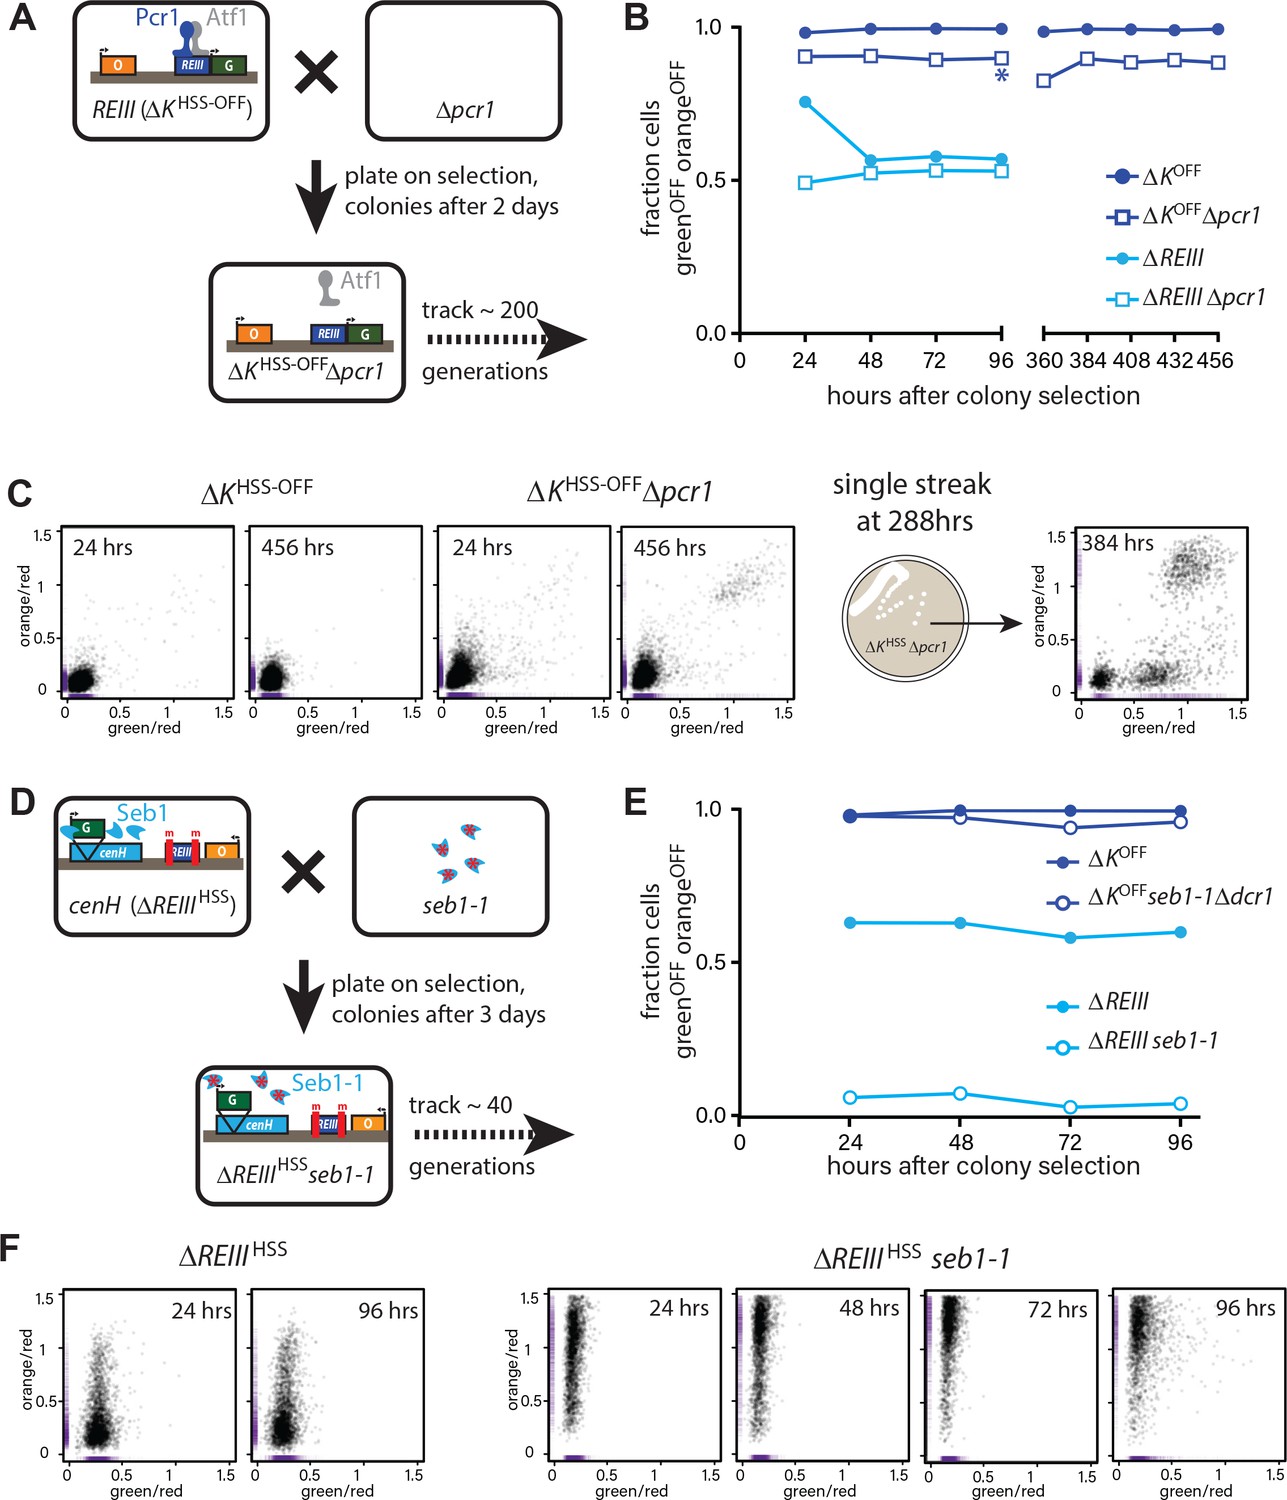
(A) Scheme for removal of Pcr1 (REIII binding factor) in the ΔKHSS strain OFF isolate (ΔKHSS-OFF). Progeny of the cross was selected for ΔKHSS-OFFΔpcr1 genotype and identifiable colonies immediately grown for cytometry, and passaged for 456 hr. (B) Stable inheritance of repression in ΔKHSS-OFFΔpcr1. ΔKHSS-OFFΔpcr1 or ΔKHSS-OFF cells (dark blue lines) where analyzed by flow cytometry over consecutive days, the break indicating passaging without analysis. Δpcr1 had no significant effect on ΔREIIIHSS (light blue lines). (C) LEFT: scatter plots with partial point transparency of ΔKHSS-OFF or ΔKHSS-OFFΔpcr1 early and late in the time course. RIGHT: In the middle of the time course (asterisk in (B)), ΔKHSS-OFFΔpcr1 were struck for single colonies. The scatter plots for one of the isolates is shown. (D) Scheme for removal of functional Seb1 in ΔREIIIHSS strain. Selection and growth as in A., total passaging time 96 hr. (E) Weak inheritance of repression in ΔREIIIHSSseb1-1 (light blue lines). Analysis as above, total time course 96 hr. Removal of both Seb1 and RNAi pathways (ΔKHSS-OFFseb1-1Δpcr1) does not affect maintenance of silencing (dark blue lines). (F) Scatter plots of ΔREIIIHSS at 24 and 96 hr and through the entire time course for ΔREIIIHSSseb1-1. In these scatter plots, X and Y values of each cell are represented by purple dashes along the corresponding axis.
Figure 5—figure supplement 1
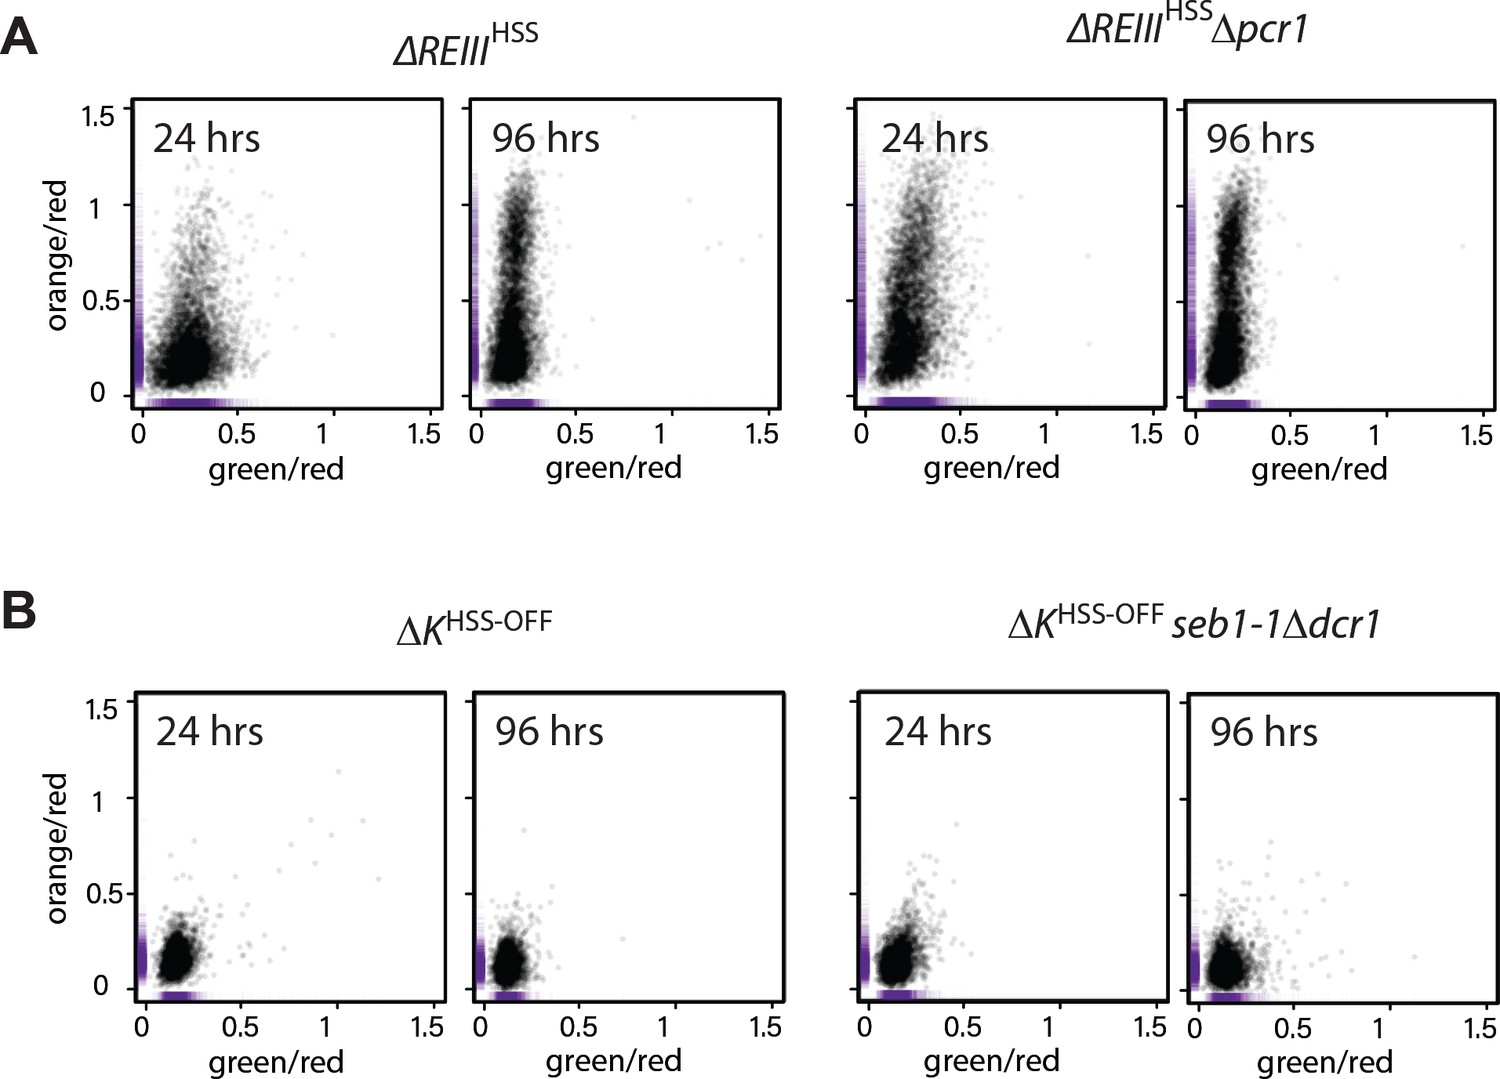
trans-factor mutants do not substantially affect spreading when their cognate cis-acting element is inactivated.
(A) Scatter plots of ΔREIIIHSS and ΔREIIIHSSΔpcr1 at 24 and 96 hr. (B) Scatter plots of ΔKHSS and ΔKHSSseb1-1Δdcr1 at 24 and 96 hr. The seb1-1 and Δdcr1 double mutant should abolish all RNA-dependent nucleation (Marina et al., 2013). The X and Y values of each cell are represented by purple dashes along the axis.
Figure 6 with 1 supplement
Histone turnover correlates with epigenetic stability in ncRNA-dependent and REIII-dependent heterochromatin.
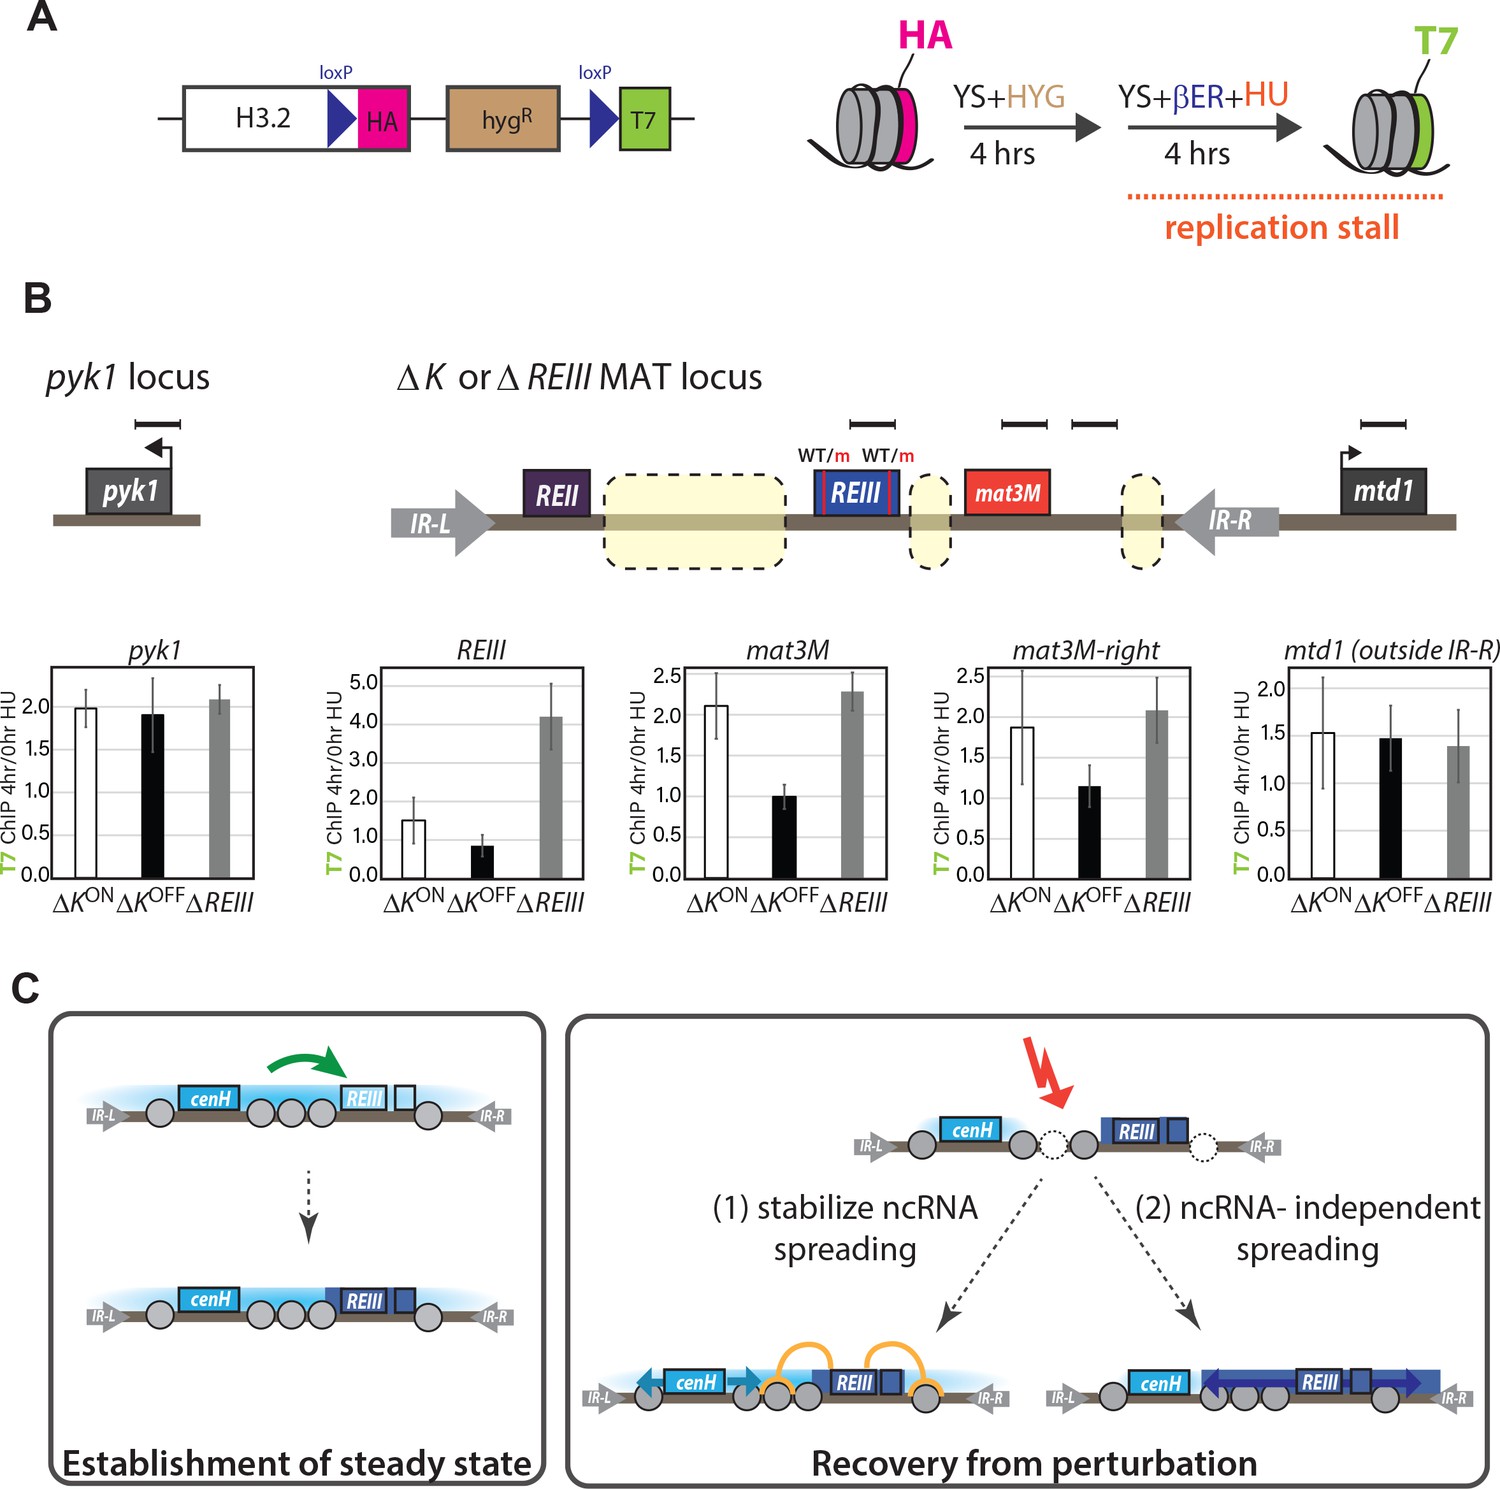
(A) LEFT: Overview of the RITE system for histone 3.2. Cre recombinase allows tag exchange from HA to T7. RIGHT: experimental scheme for detecting replication-independent H3 turnover. Cells were grown to log phase and then grown for 4 hr in the presence of β-estradiol and 15 mM hydroxyurea. (B) Enrichment for H3-T7 at indicated loci in ΔKHSS-ON, ΔKHSS-OFFor ΔREIIIHSS strain. TOP: Location of amplicons for T7-ChIP indicated by bars. Dashed boxes in MAT indicated regions of genomic difference between ΔKHSS and ΔREIIIHSS. WT and m for REIII indicate presence or deletion of Atf1/Pcr1-binding sites, respectively. BOTTOM: Enrichment of T7 tag by ChIP at 4 hr in HU over 0 hr for indicated strains. one indicates no enrichment over 0 hr. Error bars indicate standard deviation of technical replicates. (C) Model for collaboration of cenH and REIII in establishing and maintaining the high fidelity MAT locus. (LEFT) During initial establishment, cenH heterochromatin raises the nucleation frequency at REIII (green arrow). A box right of REIII represents a putative additional nucleation element. (RIGHT) Labile cenH-nucleated spreading is disrupted, in part by de-stabilized nucleosomes, in a environmental perturbation or a stochastic event. REIII promotes reestablishment of the initial state by repressing histone turnover, limiting nucleosome loss (orange) and thus aiding spreading from cenH (light blue arrows, (1)), or promoting heterochromatin spreading from surrounding elements (dark blue arrows, (2)).
Figure 6—figure supplement 1
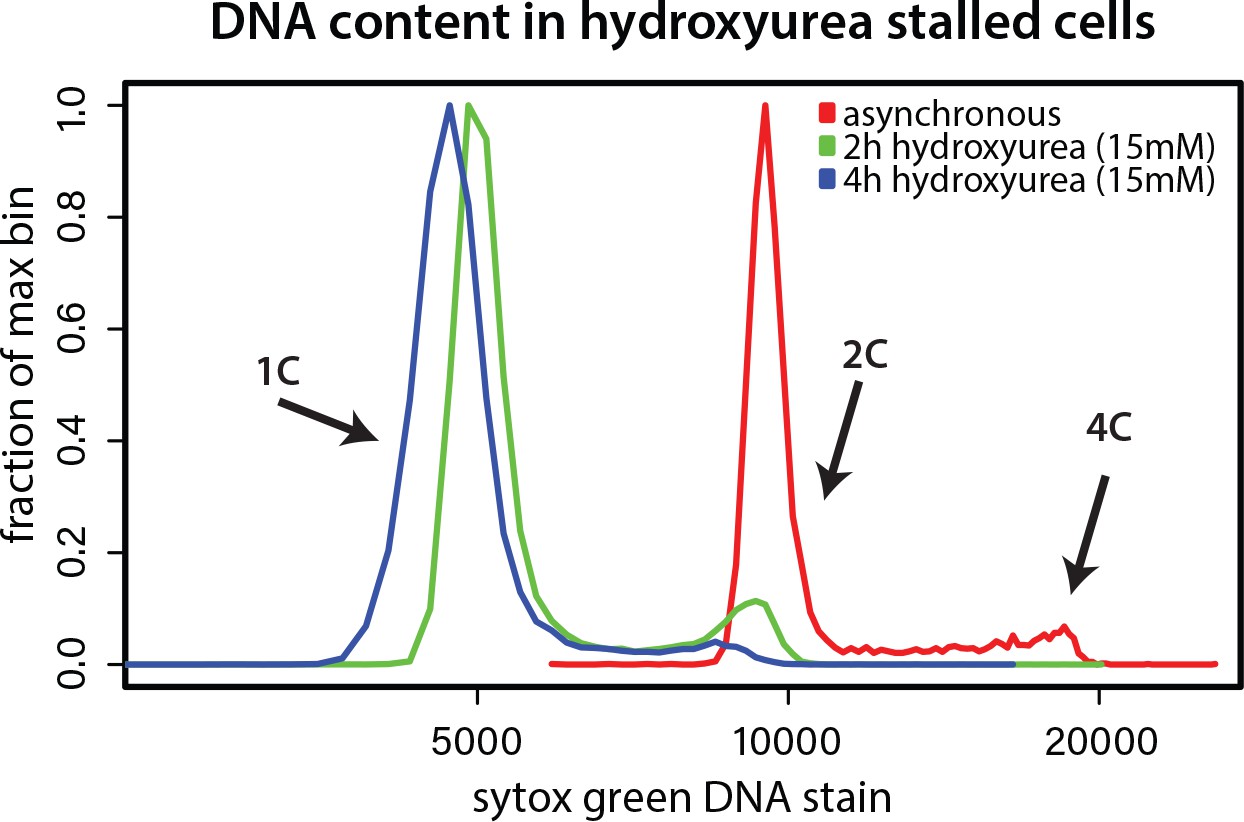
Hydroxyurea induced cell cycle arrest.
Cells were grown without (asynchronous) or with 15 mM hydroxyurea for 2 or 4 hr and DNA content was determined by Sytox green staining and flow cytometry. Hydroxyurea treatment stalls cells in early S phase, evident from loss of 2 and 4C peaks.
Author response image 1
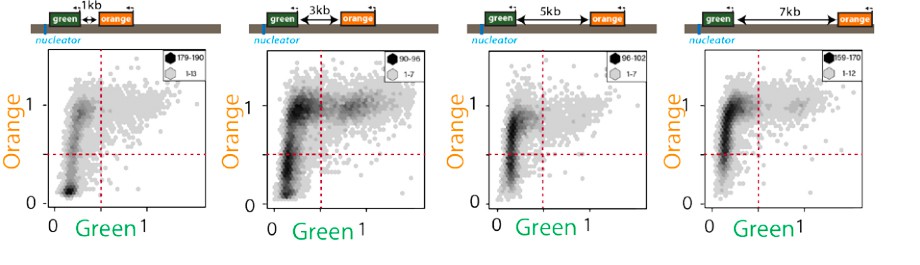
Exceedingly few cells are “green”ON and “orange”OFF.
2D hexbin plots of cells (max and min bin cell numbers indicated) with ectopic nucleation site (“green” nucleation proximal, “orange” distal at indicated distances, see Figure 1C). Fluorescence of all cells gated for cell size is plotted and normalized by “red” with no green or orange filtering. Note the very small number of cells detectable in the bottom right quadrant.
Author response image 2
“green” at cenH shows the same resistance to TSA irrespective of spreading behavior.
The same cells plotted in Figure 4B and C are plotted for the 0 TSA condition. Note that green lines represent fraction of total “green”OFF, orange lines represent fraction of “orange” repressed cells within “green”OFF.
Tables
Table 1
Yeast strains used in this study.
https://doi.org/10.7554/eLife.32948.022| Strain | Genotype |
|---|---|
| PAS075 | Locus2::ade6p::3xE2C:hygMX at Locus2 (between SPBC1711.11 andSPBC1711.12) |
| PM03 | Wild-type strain: h(+); ura4-D18; leu1-32; ade6-M216; his7-366 |
| PM1035 | ura4::natMX:dh fragment 1, clr4::KAN as in Marina et al. (2013) |
| PAS111 | ura4::natMX:dh:ade6p:SF-GFP, ade6p:mKO2 7 kb, ade6p:3xE2C: hygMX at Locus2 |
| PAS112 | ura4::natMX:dh:ade6p:SF-GFP, ade6p:mKO2 7 kb, ade6p:3xE2C: hygMX at Locus2; clr4::kanMX |
| PAS133 | ura4::natMX:dh:ade6p:SF-GFP, ade6p:mKO2 1 kb, ade6p:3xE2C: hygMX at Locus2; clr4::kanMX |
| PAS134 | ura4::natMX:dh:ade6p:SF-GFP, ade6p:mKO2 1 kb, ade6p::3xE2C: hygMX at Locus2 |
| PAS135 | ura4::natMX:dh:ade6p:SF-GFP, ade6p:mKO2 3 kb, ade6p::3xE2C: hygMX at Locus2; clr4::kanMX |
| PAS136 | ura4::natMX:dh:ade6p:SF-GFP, ade6p:mKO2 3 kb, ade6p::3xE2C: hygMX at Locus2 |
| PAS141 | ura4::natMX:dh:ade6p:SF-GFP, ade6p:mKO2 5 kb, ade6p::3xE2C: hygMX at Locus2 |
| PAS142 | ura4::natMX:dh:ade6p: SF-GFP, ade6p:mKO2 5 kb; ade6p::3xE2C: hygMX at Locus2; clr4::kanMX |
| PAS192 | ΔK::ade6p:mKO2; ade6p: SF-GFP between REIII and mat3M; ade6p:3xE2C: hygMX at Locus2, h(-) |
| PAS193 | ΔK::ade6p:mKO2; ade6p:SF-GFP between REIII and mat3M; ade6p:3xE2C: hygMX at Locus2; clr4::kanMX, h(-) |
| PAS214 | ΔK::ade6p:mKO2:ura4t; mat3m(EcoRV):: ade6p:SF-GFP; ade6p:3xE2C: hygMX at Locus2; clr4::kanMX, h(-) |
| PAS215 | ΔK::ura4t:mKO2:ade6p; mat3m(EcoRV):: ade6p:SF-GFP; ade6p:3xE2C: hygMX at Locus2; clr4::kanMX, h(-) |
| PAS216 | cenH::ade6p:SF-GFP (Kint2); mat3m(EcoRV):: ade6p:mKO2; ade6p:3xE2C: hygMX at Locus2; clr4::kanMX, h90 |
| PAS217 | cenH: ade6p:SF-GFP (Kint2); mat3m(EcoRV):: ade6p:mKO2; ade6p:3xE2C: hygMX at Locus2, h90 |
| PAS218 | cenH::ade6p:mKO2 (Kint2); mat3m(EcoRV):: ade6p:SF-GFP; ade6p:3xE2C: hygMX at Locus2; in clr4::kanMX, h90 |
| PAS219 | cenH: ade6p:mKO2 (Kint2); mat3m(EcoRV):: ade6p:SF-GFP; ade6p:3xE2C: hygMX at Locus2, h90 |
| PAS231 | ura4::natMX:dh:ade6p:SF-GFP, ade6p:mKO2 3 kb, leu1::ade6p:3xE2C: hygMX |
| PAS237 | ura4::natMX:dh:ade6p:SF-GFP, ade6p:mKO2 3 kb, act1p::qxE2C: hygMX at Locus2; clr4::kanMX |
| PAS243 | ura4::natMX:dh:ade6p:SF-GFP, ade6p:mKO2 3 kb, act1p::1xE2C: hygMX at Locus2; clr4::kanMX |
| PAS244 | ura4::natMX:dh:ade6p:SF-GFP, ade6p:mKO2 3 kb, act1p::1xE2C: hygMX at Locus2 |
| PAS264 | cenH:: ade6p:SF-GFP (Kint2); mat3m(EcoRV):: ade6p:mKO2; ade6p:3xE2C: hygMX at Locus2, pcr1::kanMX, h90 |
| PAS268 | ΔK:: ade6p:mKO2; ade6p:SF-GFP between REIII and mat3M; ade6p:3xE2C: hygMX at Locus2, REII::LEU2, h(-) |
| PAS269 | ΔK:: ade6p:mKO2; ade6p:SF-GFP between REIII and mat3M; ade6p:3xE2C:hygMX at Locus2; clr4::kanMX, REII::LEU2, h(-) |
| PAS331 | cenH:: ade6p:SF-GFP (Kint2); mat3m(EcoRV):: ade6p:mKO2; ade6p:3xE2C:hygMX at Locus2; ΔREIII::REIII(Δs1, Δs2) in clr4::kanMX, h90 |
| PAS332 | cenH:: ade6p:SF-GFP (Kint2); mat3m(EcoRV):: ade6p:mKO2; ade6p:3xE2C:hygMX at Locus2; ΔREIII::REIII(Δs1, Δs2), h90 |
| PAS348 | ura4::hygMX:REIII:ade6p:SF-GFP; ade6p:mKO2 5 kb, ade6p:3xE2C:natMX at Locus2 |
| PAS350 | ura4::hygMX:REIII:ade6p:SF-GFP; ade6p:mKO2 5 kb, ade6p:3xE2C:natMX at Locus2 dcr1::kanMX |
| PAS355 | ura4::natMX:dh:ade6p:SF-GFP, ade6p:mKO2 3 kb, leu1::ade6p:3xE2C:hygMX; clr4::kanMX |
| PAS385 | ΔK:: ade6p:mKO2; ade6p:SF-GFP between REIII and mat3M; act1p:1xE2C:hygMX at Locus2; clr4::kanMX, h(-) |
| PAS387 | ΔK:: ade6p:mKO2; ade6p: SF-GFP between REIII and mat3M; act1p:1xE2C: hygMX at Locus2, h(-) |
| PAS388 | cenH:: ade6p:SF-GFP (Kint2); mat3m(EcoRV):: ade6p:mKO2; ura4 at Locus2; leu1::act1p:1xE2C:hygMX, clr4::kanMX, h90 |
| PAS389 | cenH:: ade6p:SF-GFP (Kint2); mat3m(EcoRV):: ade6p:mKO2; ura4 at Locus2; leu1::act1p:1xE2C:hygMX, h90 |
| PAS390 | cenH:: ade6p:SF-GFP (Kint2); mat3m(EcoRV):: ade6p:mKO2; ura4 at Locus2; ΔREIII::REIII(Δs1, Δs2), leu1::act1p:1xE2C:hygMX, in clr4::kanMX, h90 |
| PAS391 | cenH:: ade6p:SF-GFP (Kint2); mat3m(EcoRV):: ade6p:mKO2; ura4 at Locus2; ΔREIII::REIII(Δs1, Δs2), leu1::act1p:1xE2C:hygMX, h90 |
| PAS398 | his1::natMX:dh:ade6p:mKO2; ade6p:SF-GFP 3 kb, ade6p::3xE2C:hygMX at Locus2, clr4::kanMX, ura4::phyB. |
| PAS399 | his1::natMX:dh:ade6p:mKO2; ade6p:SF-GFP 3 kb, ade6p::3xE2C:hygMX at Locus2, ura4::phyB. |
| PAS410 | ΔK:: ade6p:mKO2; ade6p: SF-GFP between REIII and mat3M; ade6p::3xE2C:hygMX at Locus2, natMX:clr4+, h(-); ‘OFF’ allele |
| PAS411 | ΔK:: ade6p:mKO2; ade6p: SF-GFP between REIII and mat3M; ade6p::3xE2C:hygMX at Locus2, natMX:clr4+, h(-); ‘ON’ allele |
| PAS464 | ΔK::ade6p:mKO2:ura4t; mat3m(EcoRV):: ade6p:SF-GFP; ade6p:3xE2C: hygMX at Locus2; natMX:clr4+, h(-) |
| PAS465 | ΔK::ura4t:mKO2:ade6p; mat3m(EcoRV):: ade6p:SF-GFP; ade6p:3xE2C: hygMX at Locus2; natMX:clr4+, h(-) |
| PAS473 | ΔK:: ade6p:mKO2; ade6p: SF-GFP between REIII and mat3M; 700 bp sib1 ORF between REIII-s1 and mKO2; ade6p:3xE2C: hygMX at Locus2, clr4::kanMX, h(-); |
| PAS474 | ΔK:: ade6p:mKO2; ade6p: SF-GFP between REIII and mat3M; ΔREIII::REIII(Δs1, Δs2), ade6p:3xE2C: hygMX at Locus2, clr4::kanMX, h(-); |
| PAS478 | ΔK:: ade6p:mKO2; ade6p: SF-GFP between REIII and mat3M; 700 bp sib1 ORF between REIII-s1 and mKO2 ade6p:3xE2C: hygMX, natMX:clr4+, h(-); |
| PAS482 | ΔK::ade6p:mKO2; ade6p: SF-GFP between REIII and mat3M; ade6p:3xE2C: hygMX at Locus2, h(-); ‘OFF’ allele |
| PAS483 | ΔK:: ade6p:mKO2; ade6p: SF-GFP between REIII and mat3M; ΔREIII::REIII(Δs1, Δs2), ade6p:3xE2C: hygMX at Locus2, natMX:clr4+, h(-); |
| PAS496 | cenH:: ade6p:SF-GFP (Kint2); mat3m(EcoRV):: ade6p:mKO2; ade6p:3xE2C:hygMX at Locus2; ΔREIII::REIII(Δs1, Δs2), ars1::prad15:cre-EBD:LEU2; h3.2:lox:HA:hygMX:lox:T7; h90 |
| PAS497 | ΔK::ade6p:mKO2; ade6p: SF-GFP between REIII and mat3M; ade6p:3xE2C: hygMX at Locus2; ars1::prad15:cre-EBD:LEU2; h3.2:lox:HA:hygMX:lox:T7; ‘OFF’ allele, h(-) |
| PAS498 | ΔK::ade6p:mKO2; ade6p: SF-GFP between REIII and mat3M; ade6p:3xE2C: hygMX at Locus2; ars1::prad15:cre-EBD:LEU2; h3.2:lox:HA:hygMX:lox:T7; ‘ON’ allele; h(-) |
| PAS508 | ΔK::ade6p:mKO2; ade6p: SF-GFP between REIII and mat3M; ade6p:3xE2C: hygMX at Locus2, ‘OFF’ allele; pcr1::kanMX |
| PAS510 | cenH:: ade6p:SF-GFP (Kint2); mat3m(EcoRV):: ade6p:mKO2; ade6p:3xE2C:hygMX at Locus2; ΔREIII::REIII(Δs1, Δs2), pcr1::kanMX |
| PAS514 | ΔK::ade6p:mKO2; ade6p: SF-GFP between REIII and mat3M; ade6p:3xE2C: hygMX at Locus2, ‘OFF’ allele; dcr1::kanMX; seb1-1:natMX |
| PAS515 | cenH:: ade6p:SF-GFP (Kint2); mat3m(EcoRV):: ade6p:mKO2; ade6p:3xE2C:hygMX at Locus2; ΔREIII::REIII(Δs1, Δs2), seb1-1:natMX |
Additional files
-
Source code 1
R scripts for flow cytometry analysis
- https://doi.org/10.7554/eLife.32948.023
-
Transparent reporting form
- https://doi.org/10.7554/eLife.32948.024
Download links
A two-part list of links to download the article, or parts of the article, in various formats.
Downloads (link to download the article as PDF)
Open citations (links to open the citations from this article in various online reference manager services)
Cite this article (links to download the citations from this article in formats compatible with various reference manager tools)
Noncoding RNA-nucleated heterochromatin spreading is intrinsically labile and requires accessory elements for epigenetic stability
eLife 7:e32948.
https://doi.org/10.7554/eLife.32948


