Adult-born neurons facilitate olfactory bulb pattern separation during task engagement
- University of California, San Diego, United States
- Kyoto University, Japan
Figures
Figure 1 with 1 supplement
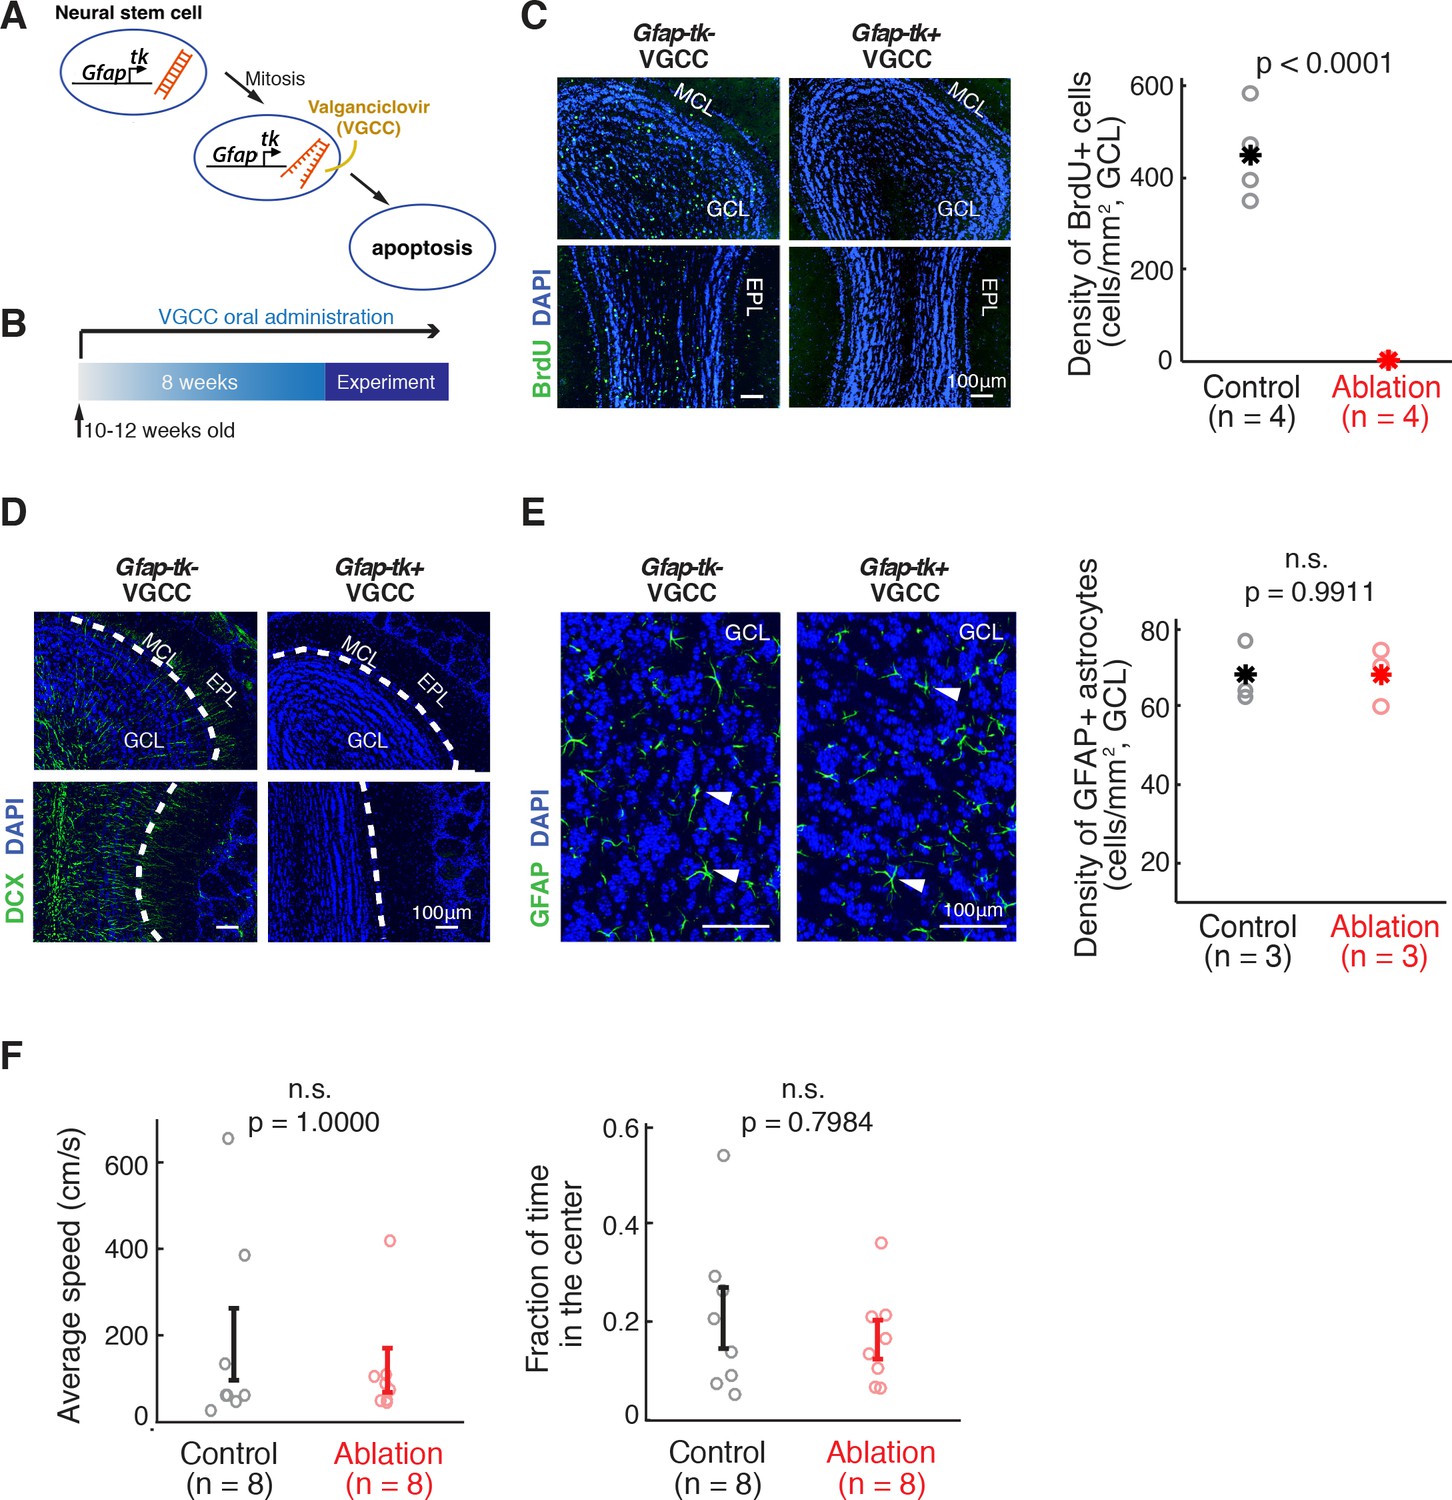
Inducible ablation of adult neurogenesis.
(A) Pharmacogenetic ablation of ABNs. Valganciclovir (VGCC) induces apoptosis of Gfap-expressing mitotic neural stems cells, blocking the generation of ABNs. (B) Experimental timeline. Adult mice underwent 8 weeks of VGCC treatment before starting the behavioral task and imaging. (C,D) VGCC administration results in a near-complete ablation of ABNs in the olfactory bulbs of Gfap-tk+ (ablation) mice. (C) BrdU labeling of olfactory bulbs of Gfap-tk- (control) and ablation mice administered with VGCC. Green: BrdU; Blue: DAPI; MCL: mitral cell layer; GCL: granule cell layer; EPL: external plexiform layer. Right: quantification of the BrdU-labeled cell density in control (n = 4, black) and ablation (n = 4, red) (p<0.0001, Wilcoxon rank sum test). Asterisks represent means. (D) Doublecortin (DCX) labeling of immature neurons in the olfactory bulbs showed similar results to BrdU labeling. Green: DCX; Blue: DAPI. (E) VGCC administration in ablation mice does not affect the density of GFAP astrocytes in the olfactory bulb. Left: GFAP immunostaining of astrocytes in the olfactory bulbs of control mice (left panel) and ablation mice (right panel) after 8 weeks of continuous treatment of VGCC. Arrows show examples of GFAP astrocyte cell bodies. Green: GFAP; Blue: DAPI. Right: No significant difference in the density of GFAP astrocytes in VGCC-administered control mice (n = 3, black) and ablation mice (n = 3, red) (mean ±S.E.M.; p=0.9911, Wilcoxon rank sum test). Asterisks represent means. (F) Open field test shows no deficiency in mobility in ablation mice (n = 8, red) compared to controls (n = 8, black). All error bars: mean ±S.E.M. Left: average speed (cm/s) (p=1.0000, Wilcoxon rank sum test). Right: fraction of time spent in the center area (p=0.7984, Wilcoxon rank sum test).
Figure 1—figure supplement 1
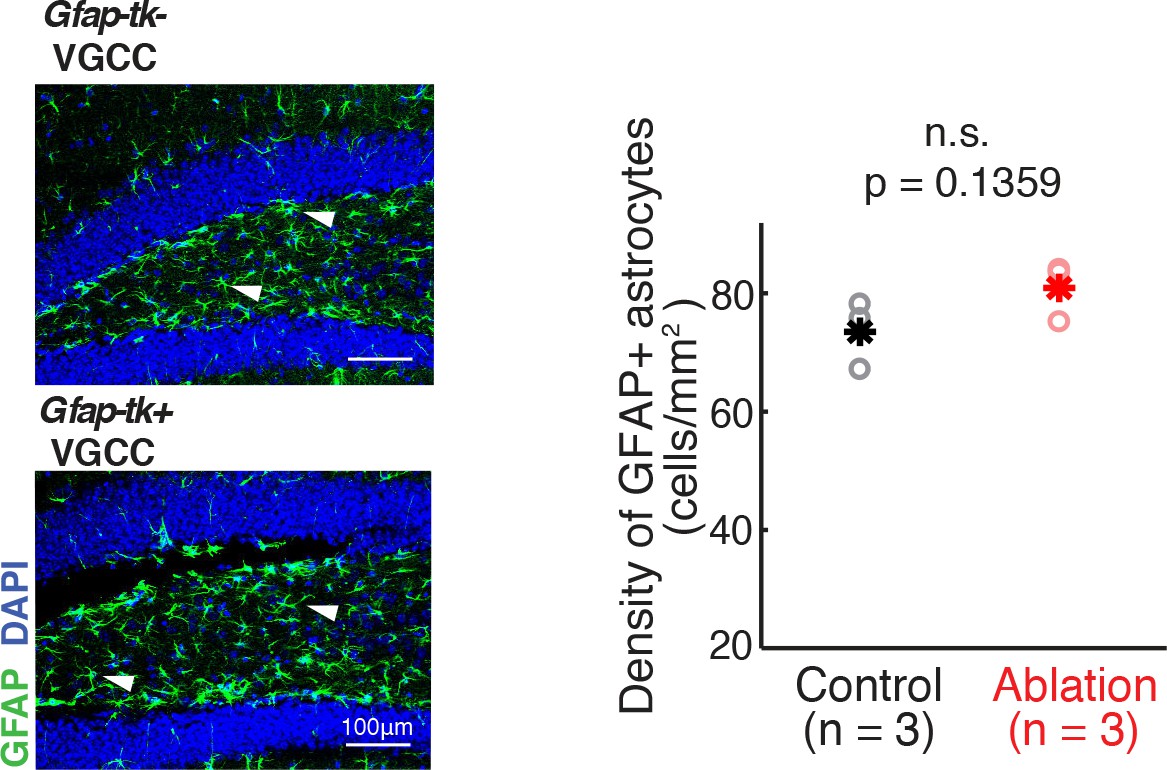
VGCC administration in ablation mice does not affect the density of GFAP astrocytes in the hippocampus.
Left: GFAP immunostaining of astrocytes in the dentate gyrus of control mice (upper panel) and ablation mice (lower panel) after 8 weeks of continuous treatment of VGCC. Arrowheads show examples of GFAP astrocyte cell bodies. Green: GFAP; Blue: DAPI. Right: No significant difference in the density of GFAP astrocytes in VGCC-administered control mice (n = 3, black) and ablation mice (n = 3, red) (mean ±S.E.M.; p=0.1359, Wilcoxon rank sum test). Asterisks represent means.
Figure 2 with 1 supplement
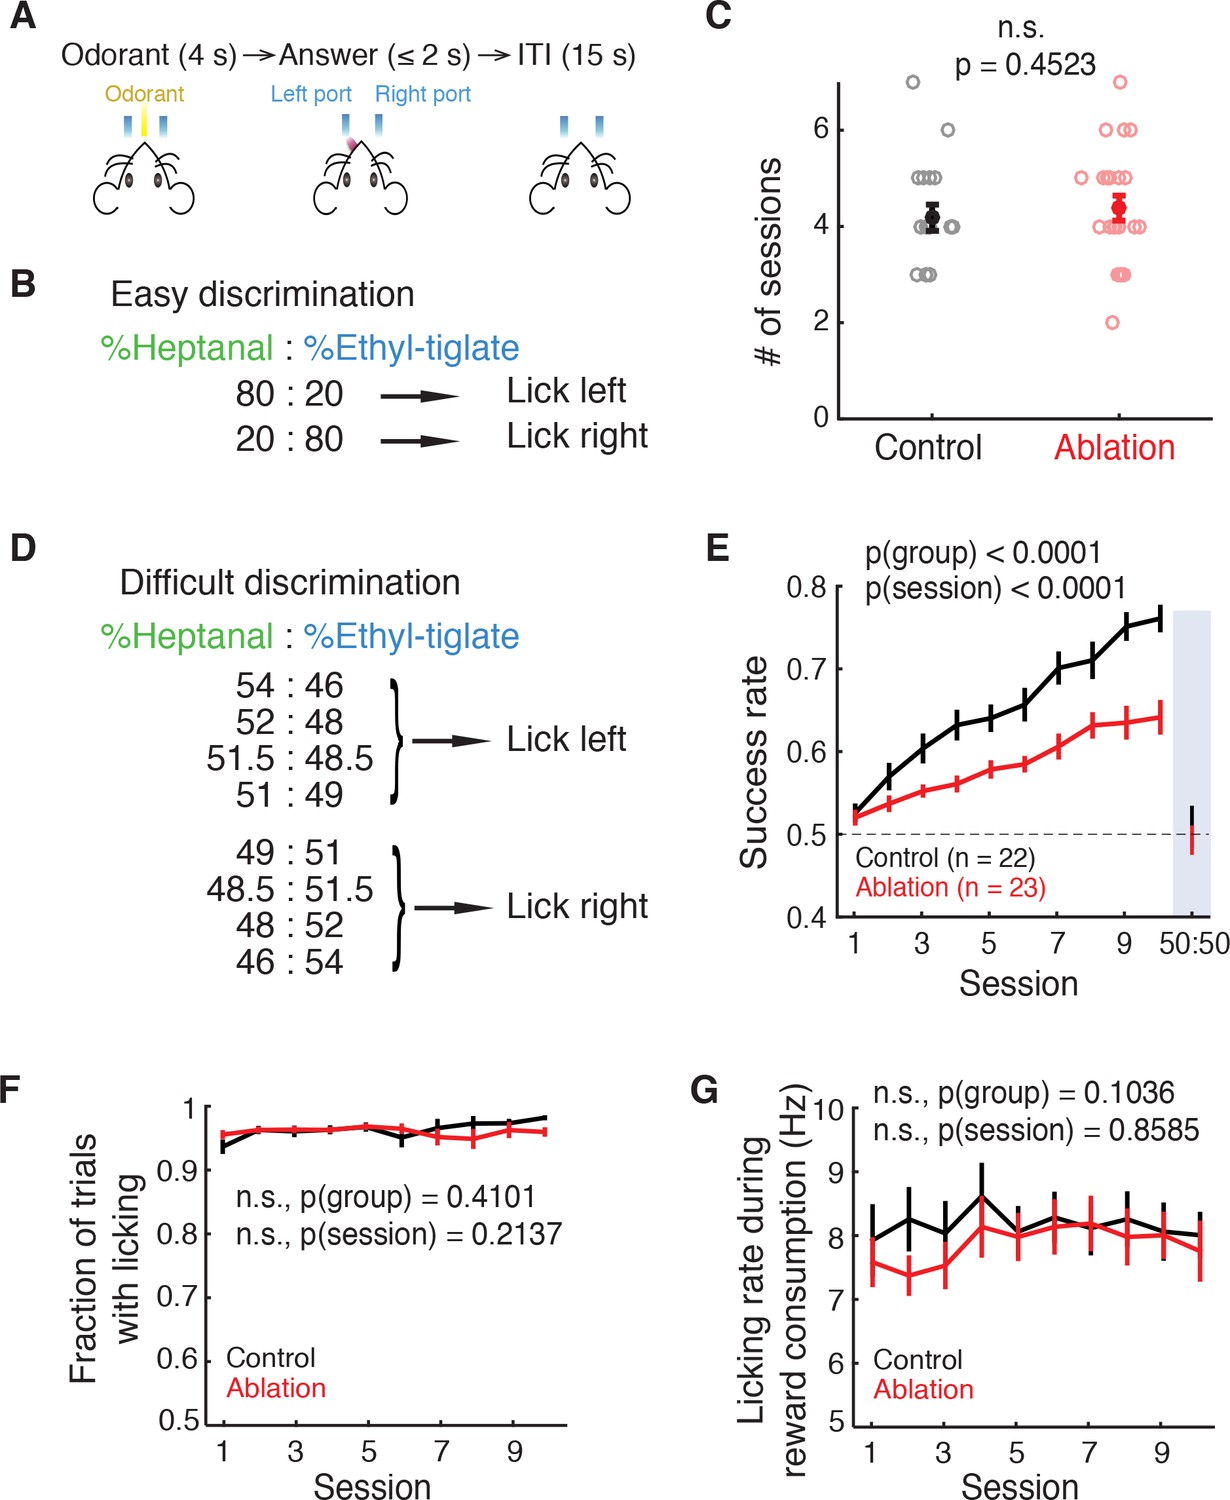
Ablation mice are impaired in difficult but not easy discrimination task.
(A) Trial structure. (B) Easy discrimination task. Mice are trained to lick left in response to H80E20 (a mixture of 80% heptanal and 20% ethyl-tiglate) and lick right to H20E80. (C) Number of sessions required to reach expertise (>80% success rate) in the easy discrimination task. There is no significant difference between control (n = 22) and ablation (n = 23) groups (p=0.4523, Wilcoxon rank sum test). Learning curves are not shown since each animal was trained until expertise, resulting in varying durations of training. (D) Difficult discrimination task. One of the eight mixtures is presented pseudorandomly in each trial. (E) Fraction of correct trials over 10 sessions in the difficult discrimination task. Ablation animals exhibit impaired learning compared to control animals (p(group)<0.0001, p(session)<0.0001, two-way ANOVA). Both groups had equal and chance-level success rate in the test session with identical H50E50 mixtures, indicating that they were using odorants to guide their choice (described in Results). (F) Fraction of trials with answers (correct or incorrect) throughout the difficult task sessions. There is no difference between control and ablation (p=0.4101, two-way ANOVA). (G) Control and ablation had comparable lick rates during reward consumption (p=0.1036, two-way ANOVA). All error bars: mean ±S.E.M.
Figure 2—figure supplement 1
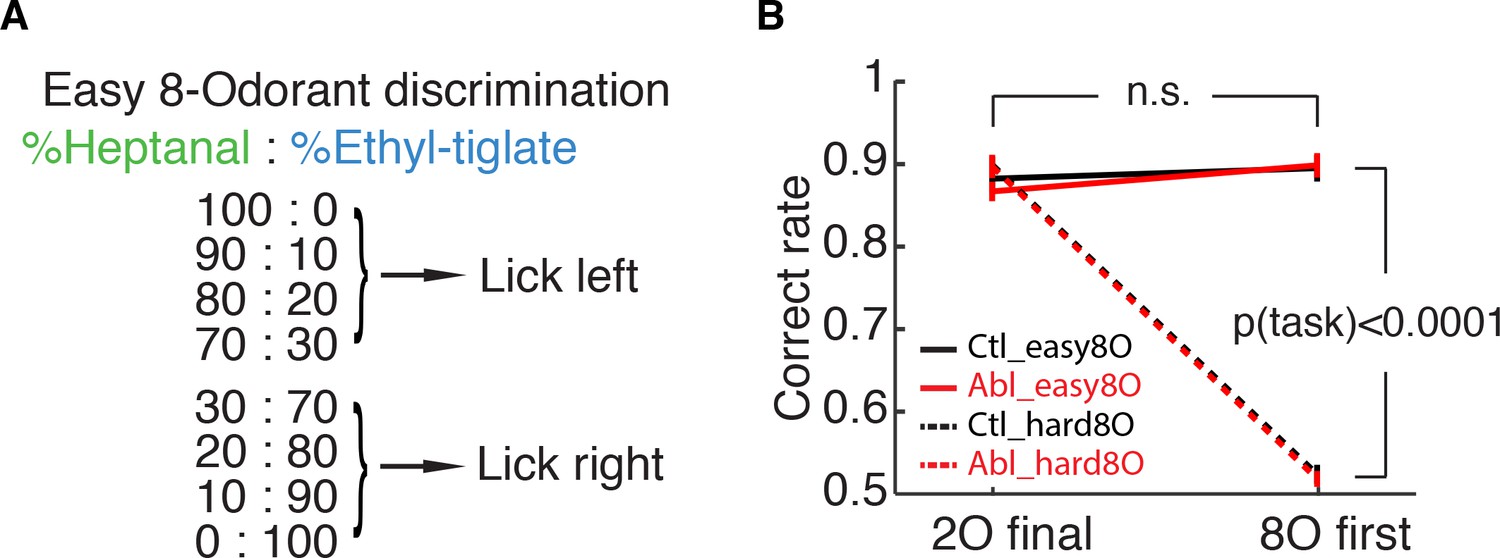
ABN ablation does not affect the performance in the easy 8-odorant discrimination.
(A) Easy 8-odorant discrimination task. One of the eight mixtures is presented pseudorandomly in each trial. (B) Fraction of correct trials out of answered trials in the last session with the easy 2-odorant discrimination and the first session with the easy 8-odorant discrimination. There is no difference between two sessions for both control and ablation (control: n = 7, p=0.5350, ablation: n = 6, p=0.2229, Wilcoxon rank sum test; mean ±S.E.M.), and the overall performance in the easy 8-odorant discrimination task is significantly better than in the difficult 8-odorant discrimination task (p(task)<0.0001, three-way ANOVA).
Figure 3 with 1 supplement
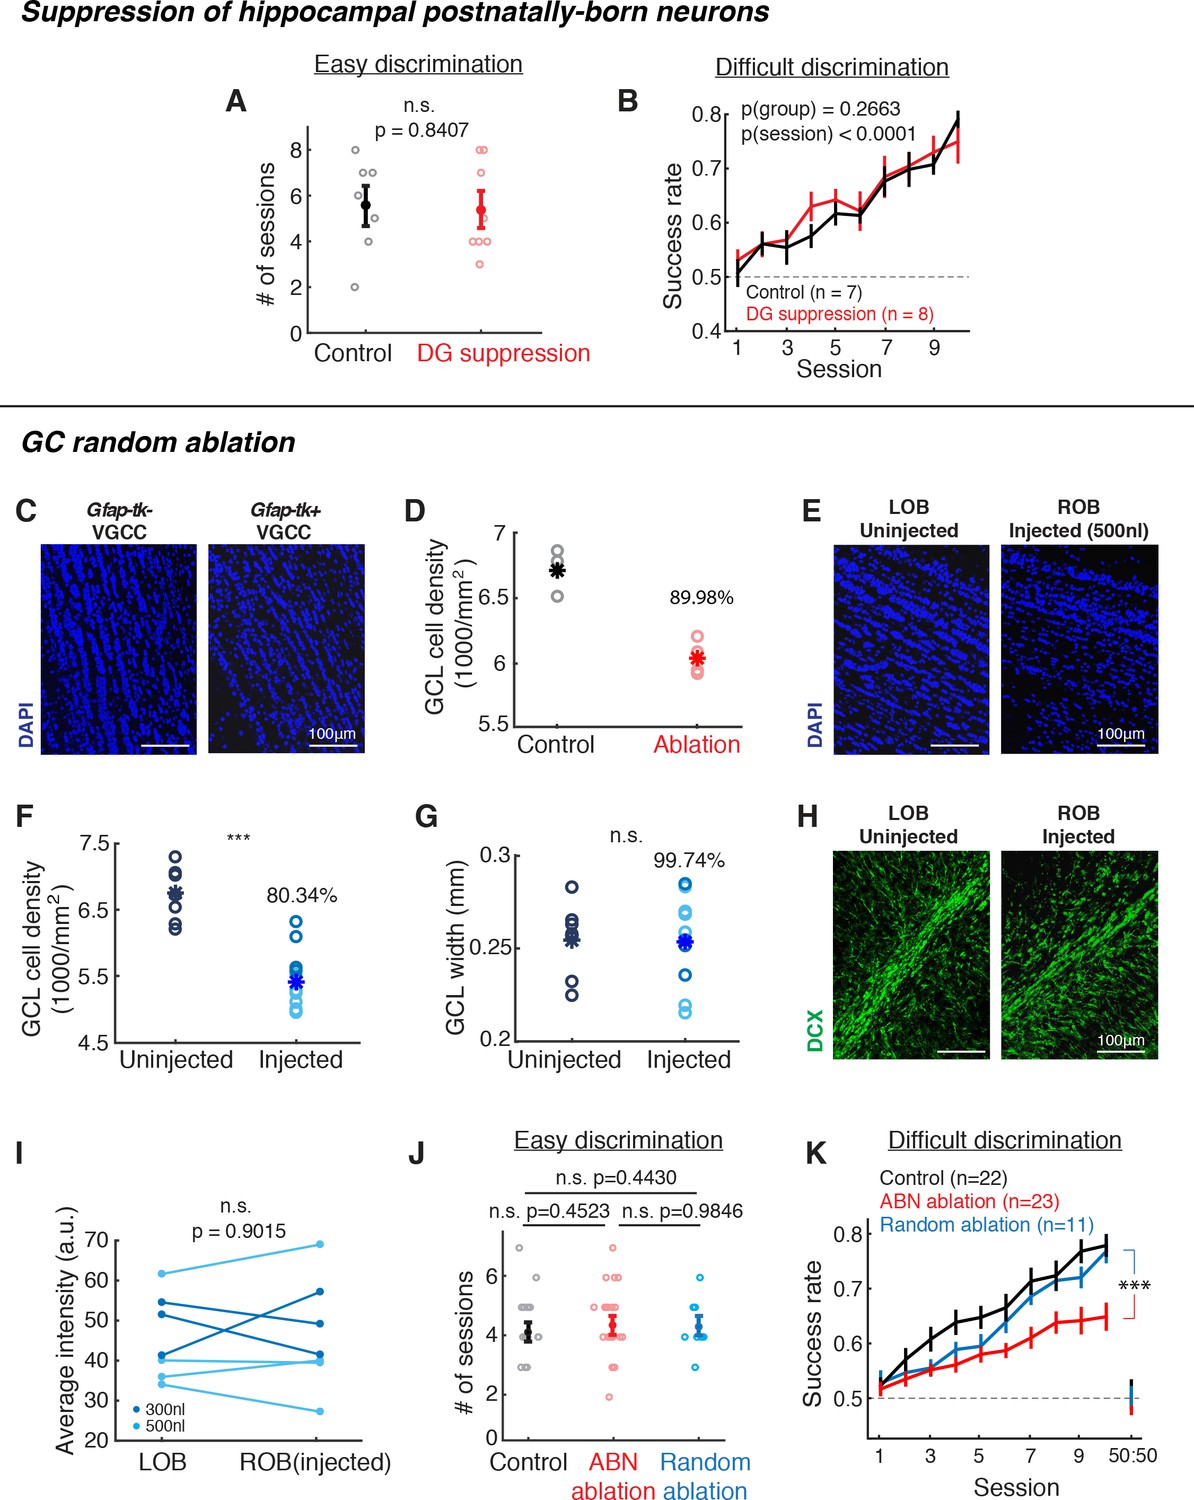
Suppression of hippocampal postnatally-born neurons or random ablation of GCL neurons did not cause the same behavioral deficit as Gfap-tk mice.
(A,B) Behavioral performance of control (black) vs. hippocampal DG postnatally-born neuron suppression (red) groups. (A) Number of sessions required to reach expertise (>80% success rate) for the easy discrimination task. There is no significant difference between control (n = 7) and DG suppression (n = 8) groups (p=0.8047, Wilcoxon rank sum test). (B) Fraction of correct trials over 10 sessions in the difficult discrimination task. There is no significant difference between control (n = 7) and DG suppression groups (n = 8; p(group)=0.2663, two-way ANOVA). (C,D) Quantification of GCL neuron reduction after VGCC treatment. (C) Post hoc DAPI (blue) labeling shows that after ~2 months of VGCC treatment, Gfap-tk+ (right) ablation group have a lower cell density in the GCL compared to Gfap-tk- (left) controls. (D) GCL cell density in control (n = 3, black) and ablation (n = 4, red). Asterisks represent means. On average, density (ablation)/density (control) = 89.98%, indicating that there was a 10.02% reduction in cell density. (E,F,G) Random cell ablation in GCL by injecting a combination of AAV2/1-CMV-Cre and AAV2/1-EF1a-FLEX-taCasp viruses caused a reduction in cell density, without changing the GCL size or affecting olfactory adult neurogenesis. (E) DAPI labeling 10 days after right OB unilateral injection shows a reduced cell density in GCL of the injected right OB (right) compared to the uninjected left OB (left). Blue: DAPI. (F) Post hoc quantification of GCL DAPI signal density 1.5 months after 300 nl (n = 4, dark blue) or 500 nl (n = 7, light blue) viral cocktail bilateral injection compared to uninjected control (n = 7) (injected vs. unjected control: p<0.0001; Wilcoxon rank sum test). Asterisks represent means. (G) There is no difference in GCL width with or without viral ablation (injected vs. uninjected control: p=0.9499; Wilcoxon rank sum test). Asterisks represent means.. (H,I) Random ablation method did not affect olfactory adult neurogenesis. (H) Doublecortin (DCX) labeling of immature neurons in uninjected (left) or injected (right) OBs 10 days after right OB unilateral injection. Green: DCX. (I) Average DCX signal intensity of RMS-periRMS area in the OB. There is no difference between un-injected and injected OBs (p=0.9015, Wilcoxon rank sum test), indicating that the injections did not affect subsequent adult neurogenesis. Dark blue: 300 nl injection; light blue: 500 nl injection. (J,K) Behavioral performance of random GCL cell ablation group (blue, n = 11), compared to control (black) and ABN ablation (red) groups shown in Figure 2C,E. (J) Number of sessions required to reach expertise (>80% success rate) for the easy discrimination task. There is no significant difference between random ablation group and control or ABN ablation groups (random ablation vs. control: p=0.4430; random ablation vs. ABN ablation: p=0.9846; Wilcoxon rank sum test). (K) Fraction of correct trials in the difficult discrimination task. For all 10 sessions, random ablation group is significantly different from other two groups (random ablation vs. control, p<0.0001; random ablation vs. ABN ablation, p<0.0001). For sessions 1–5, random ablation is worse than control (p=0.0124), but not different from ABN ablation (p=0.2528); for sessions 6–10, random ablation is better than ABN ablation (p<0.0001), but not different from control (p=0.2575). Mean ±S.E.M., two-way ANOVA.
Figure 3—figure supplement 1
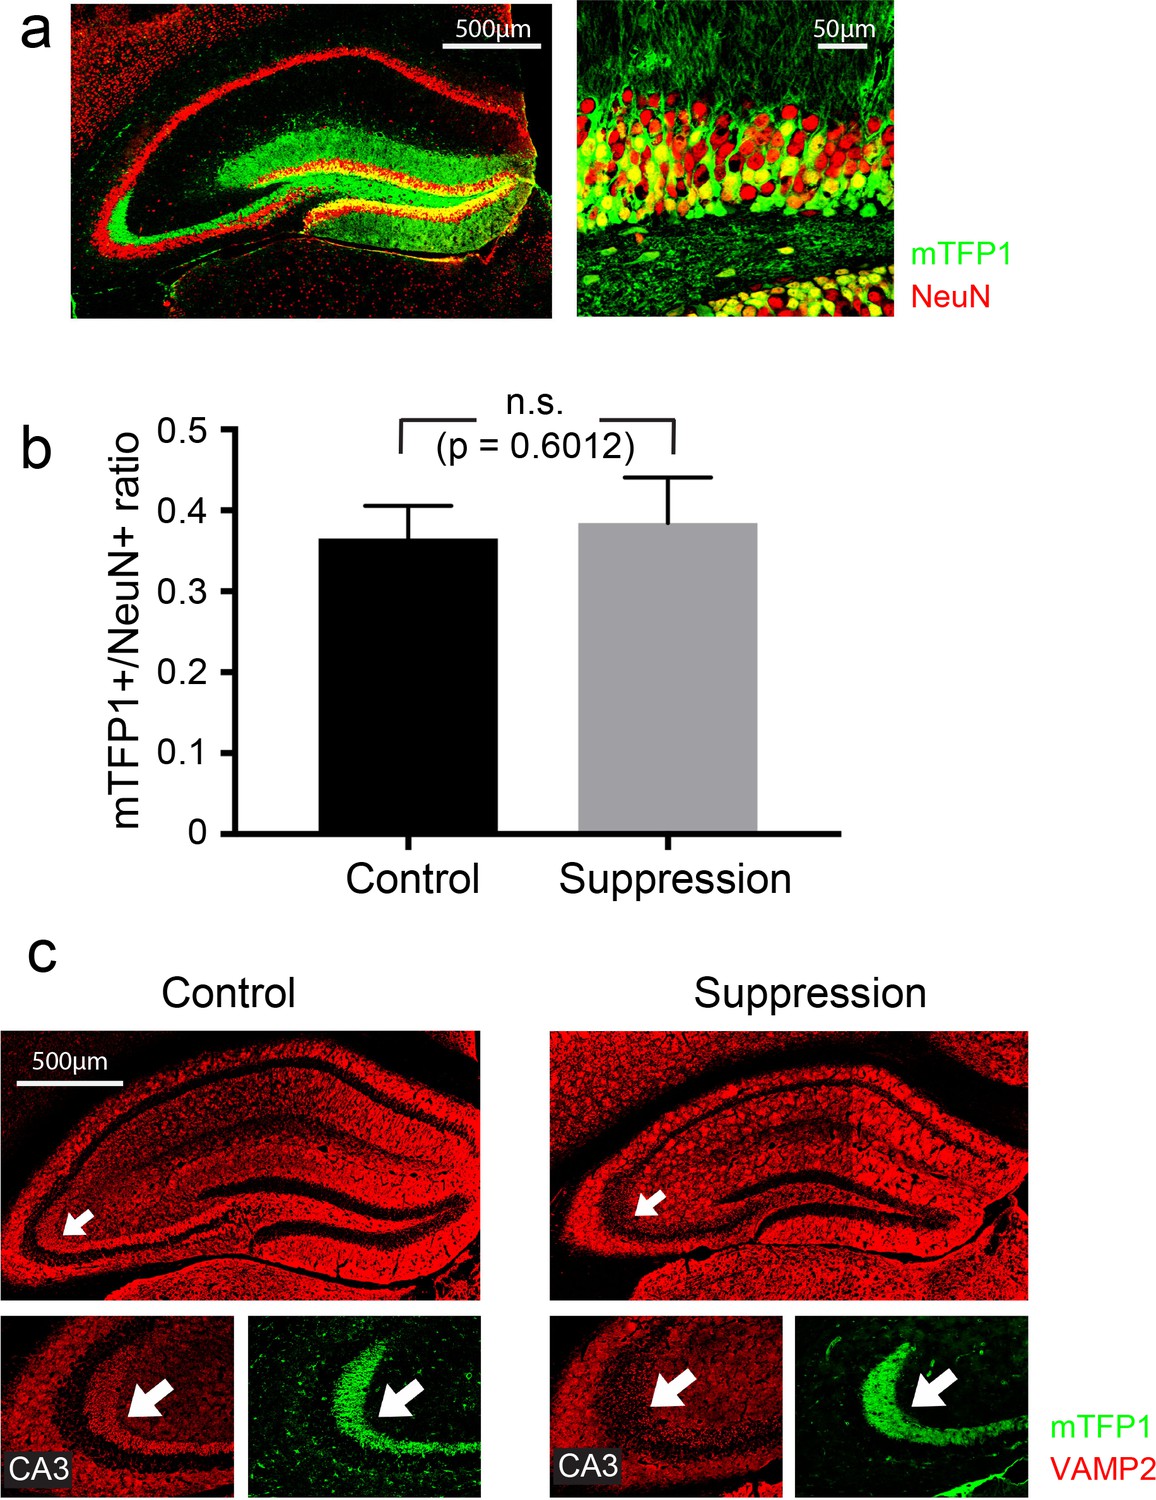
Suppression of hippocampal postnatally-born neurons with mGfap-Cre::vGlut1-LSL-TeNT targeted a larger fraction of DG neurons than ABN ablation.
(A) Hippocampal section of a mGfap-Cre::R26-CAG-LoxP-HA-mTFP1 mouse (Imayoshi et al., 2012). Targeted neurons are labeled with mTFP1. Green: mTFP1; red: NeuN. Left: hippocampus; right: DG granule cell layer. (B) The fractions of targeted neurons in control (mGfap-Cre::R26-CAG-LoxP-HA-mTFP1) and suppression (mGfap-Cre::vGlut1-LSL-TeNT::R26-CAG-LoxP-HA-mTFP1) groups are comparable (p=0.6012, Student's t-test; mean ±S.E.M.), with both much higher than that of ABN ablation. Our ABN ablation lasts no more than 3 months (Figure 1B), with an estimation of <10% cell loss in the DG (Imayoshi et al., 2008). (C) Hippocampal sections of control and suppression mice stained for VAMP2 antibody. Arrows indicate the mossy fibers in CA3 which consist of DG granule cell axons. The suppression mouse shows a marked decrease in VAMP2 staining, indicating the functional expression of TeNT in many DG granule cells.
Figure 4 with 1 supplement
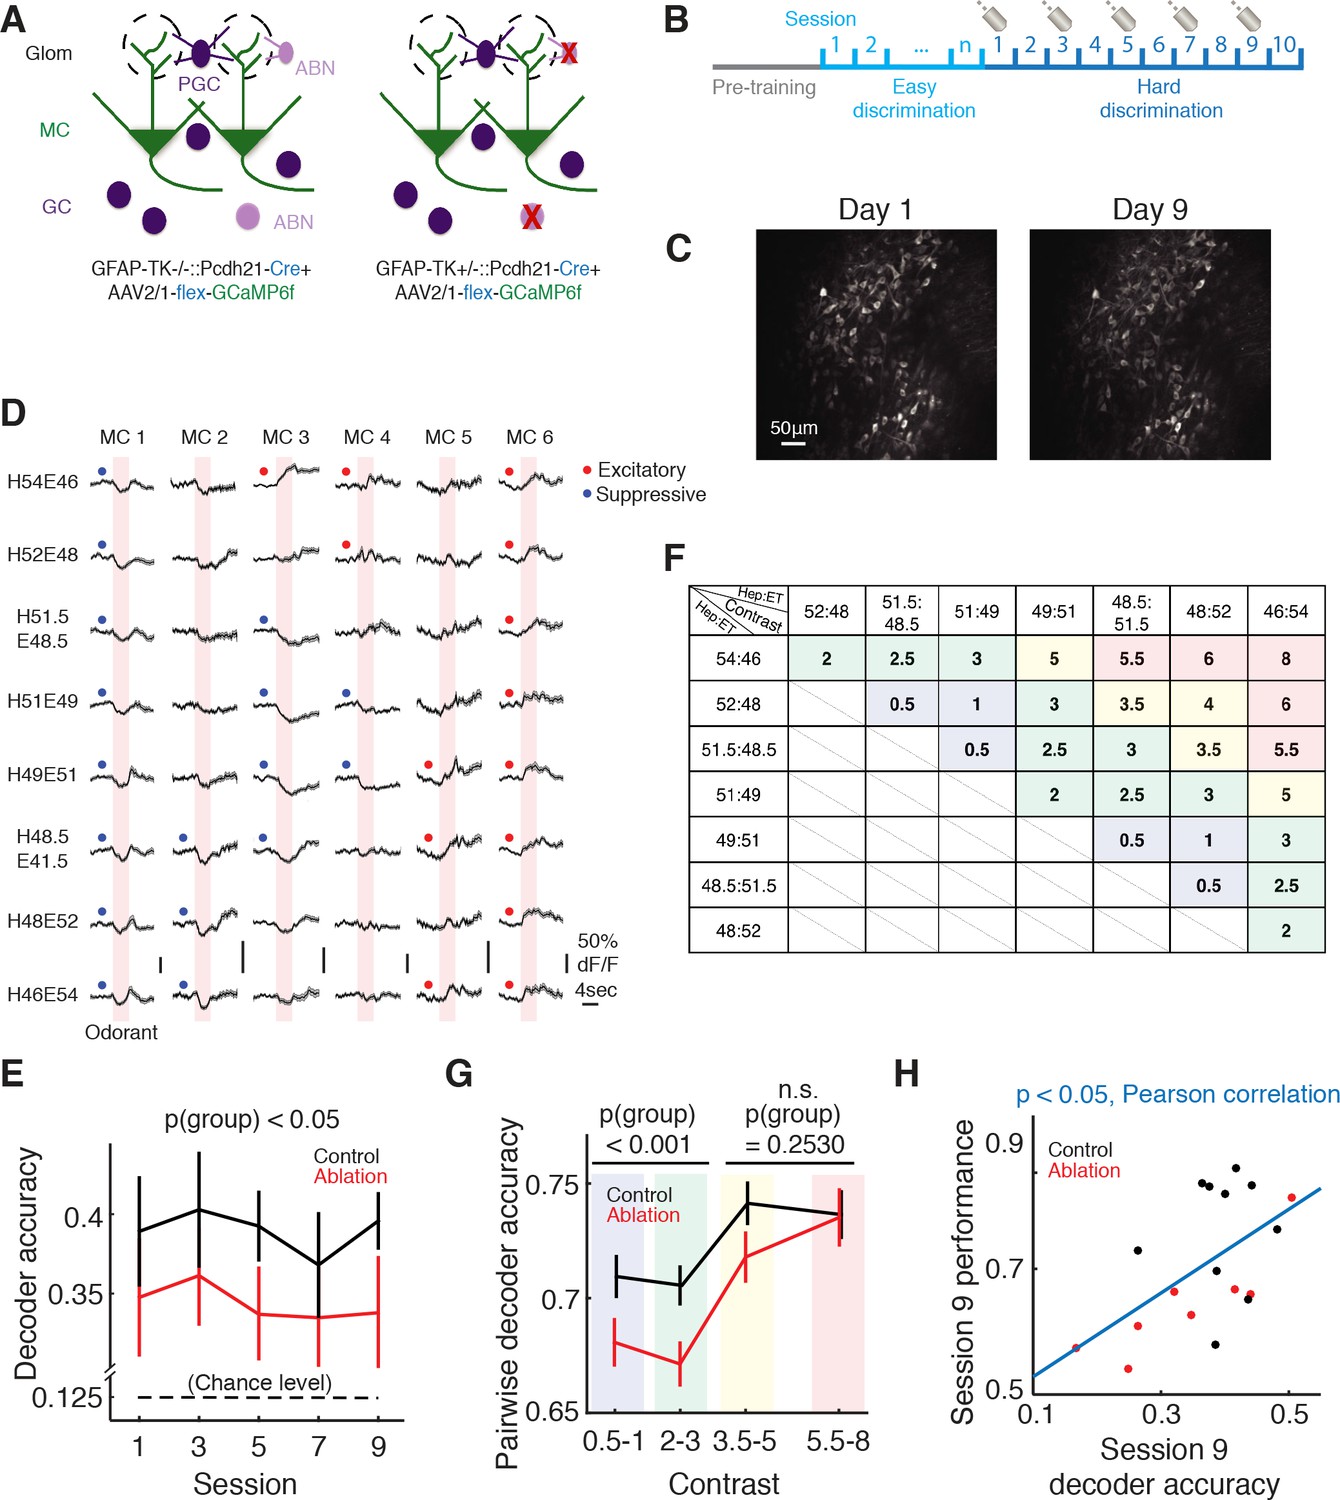
Imaging of mitral cell responses during the difficult discrimination task.
(A) Schematic of the olfactory bulb. AAV2/1-flex-GCaMP6f was injected into the olfactory bulb to express GCaMP6f in mitral/tufted cells in both control (Gfap-tk-/-::Cdhr1-Cre) and ablation (Gfap-tk+/-::Cdhr1-Cre) animals. VGCC was administered continuously to both groups, resulting in ABN ablation in the ablation group (right) but not control group (left). (B) Imaging timeline. After the pretraining period, mice were trained with the easy discrimination task until they reached expertise (>80% fraction correct within a session). The mice were then trained to perform the 8-odorant difficult discrimination task for 10 sessions with two-photon imaging on sessions 1, 3, 5, 7 and 9. (C) A field of the same mitral cell (MC) population on first day of imaging (left) and 8 days later (right). (D) Odorant responses (mean ±S.E.M.) of six example MCs during the first day of the difficult discrimination task. Pink areas denote the 4 s odorant period. Red and blue dots indicate significant excitatory and suppressive responses respectively. (E) Population decoder accuracy during the difficult discrimination task in ablation animals (n = 10) is significantly worse than control animals (n = 12) (mean ±S.E.M., p<0.05, two-way ANOVA). Black broken line indicates the chance level (0.125). (F) Table of contrast values between odorant pairs for the eight odorants used in the difficult discrimination task. Different color shades in the boxes match with the binning of the contrast values in G. (G) Pairwise decoder accuracy during the difficult discrimination task plotted as a function of binned odorant pair contrasts (mean ±S.E.M.). Control is significantly better than ablation for smaller contrasts (≤3, p<0.001, two-way ANOVA) but not for larger contrasts (>3, p=0.2530, two-way ANOVA). (H) Behavioral performance in session 9 correlates with decoder accuracy of the session (mean ±S.E.M., p<0.05, Pearson correlation).
Figure 4—figure supplement 1
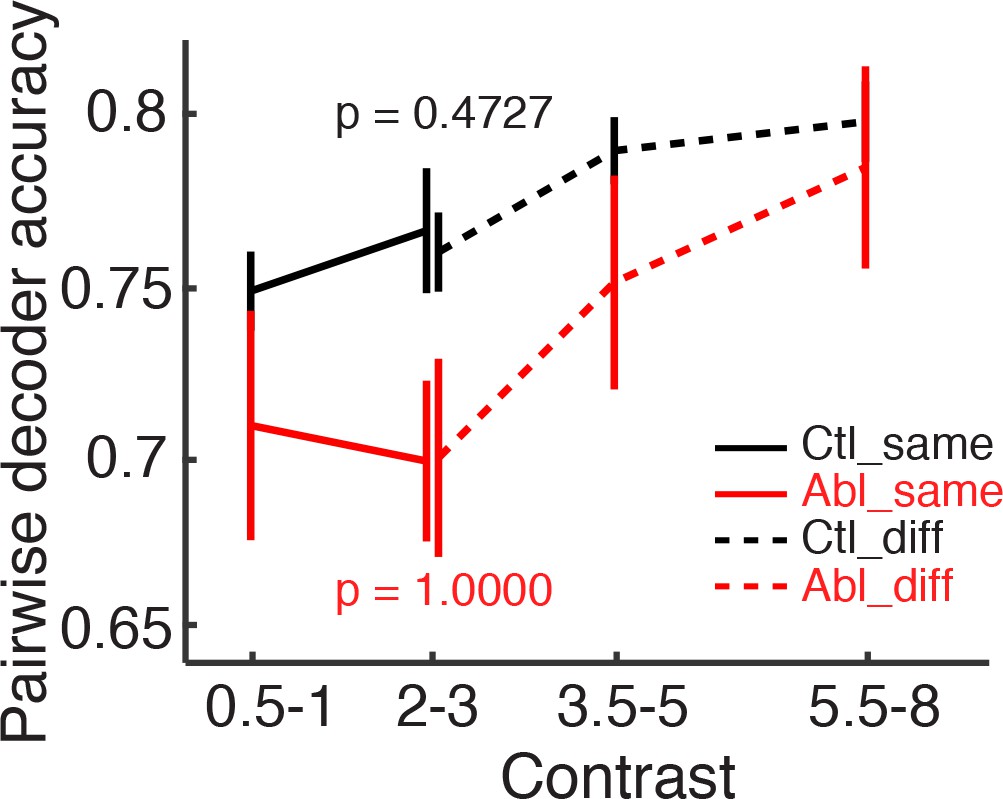
Categorical associations with choices do not influence the pattern separation of MC population responses.
Pairwise decoder accuracy during the difficult discrimination task plotted as a function of binned odorant pair contrasts (see Figure 4F and G). Odorant pairs are further separated into the pairs associated with the same (solid lines) or different (broken lines) lick sides (mean ±S.E.M.). The decoder performance was not affected by whether the two odorants were associated with the same or different lick sides (control: p=0.4727, ablation: p=1.0000, same vs. different associations in the bin ‘contrast = 2–3’, Wilcoxon rank sum test).
Figure 5
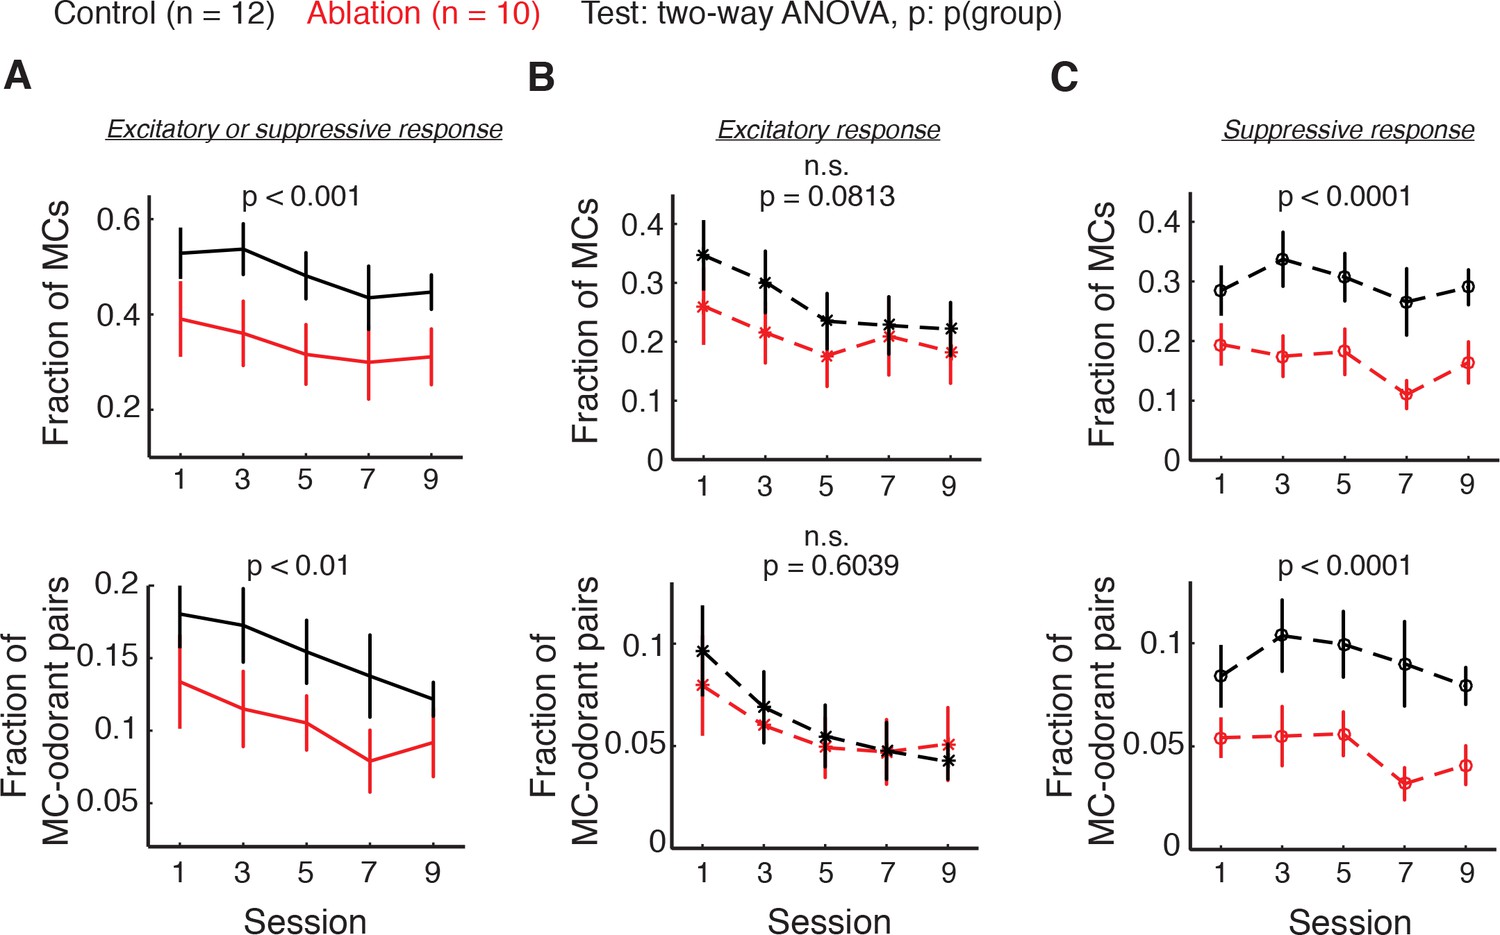
Fraction of responsive MCs (top) and responsive MC-odorant pairs (bottom) during the difficult discrimination task.
Control: n = 12; ablation: n = 10. Mean ±S.E.M. (A) MCs with either excitatory or suppressive responses. Fraction of MCs: p<0.001; fraction of MC-odorant pairs: p<0.01. (B) MCs with excitatory responses. Fraction of MCs: p=0.0813; fraction of MC-odorant pairs: p=0.6039. (C) MCs with suppressive responses. Fraction of MCs: p<0.0001; fraction of MC-odorant pairs: p<0.0001. All p values are for two-way ANOVA, control vs. ablation. Note that a given MC can have excitatory responses to some odorants and suppressive responses to others, and thus the total response is not necessarily a sum of excitatory and suppressive.
Figure 6
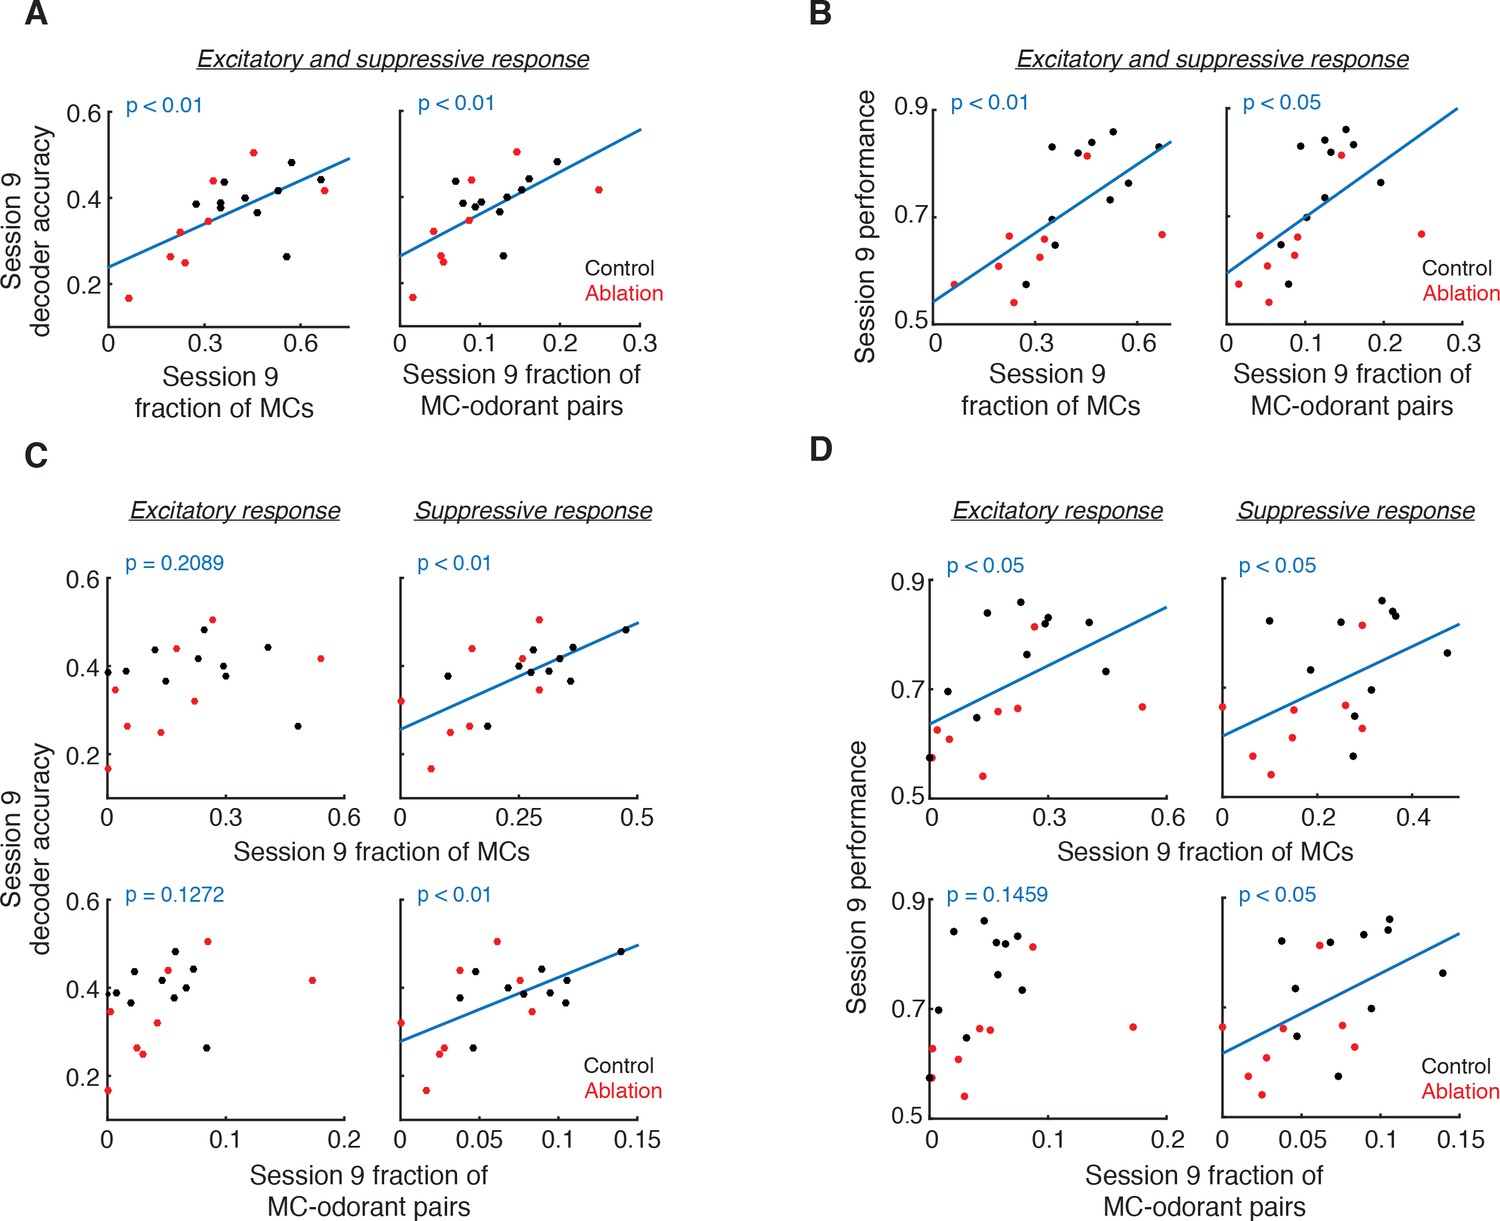
Relationship of responsive MC fractions with MC ensemble discriminability and behavioral performance.
(A) Session 9 decoder accuracy correlates with fraction of responsive MCs (left, p<0.01, Pearson correlation) and MC-odorant pairs (right, p<0.01, Pearson correlation). (B) Session 9 behavioral performance correlates with fraction of responsive MCs (left, p<0.01, Pearson correlation) and MC-odorant pairs (right, p<0.05, Pearson correlation). (C) Session 9 decoder accuracy correlates with suppressive but not excitatory MC responses. Top left: excitatory MCs, p=0.2089; bottom left: excitatory MC-odorant pairs, p=0.1272; top right: suppressive MCs, p<0.01; bottom right: suppressive MC-odorant pairs, p<0.01, Pearson correlation. (D) Session 9 behavioral performance correlates with MC suppressive responses. Top left: excitatory MCs, p<0.05; bottom left: excitatory MC-odorant pairs, p=0.1459; top right: suppressive MCs, p<0.05; bottom right: suppressive MC-odorant pairs, p<0.05, Pearson correlation.
Figure 7 with 1 supplement

Task engagement enhances MC suppressive responses through ABNs.
(A–C) Fraction of responsive MCs (top) and responsive MC-odorant pairs (bottom) during passive exposure. Control passive: n = 10; ablation passive: n = 7. Mean ±S.E.M. (A) MCs with either excitatory or suppressive responses. Fraction of MCs: p=0.6162; fraction of MC-odorant pairs: p=0.2043. (B) MCs with excitatory responses. Fraction of MCs: p=0.7625; fraction of MC-odorant pairs: p=0.8691. (C) MCs with suppressive responses. Fraction of MCs: p=0.2620; fraction of MC-odorant pairs: p=0.0625. All p values are for two-way ANOVA, control passive vs. ablation passive.
Figure 7—figure supplement 1
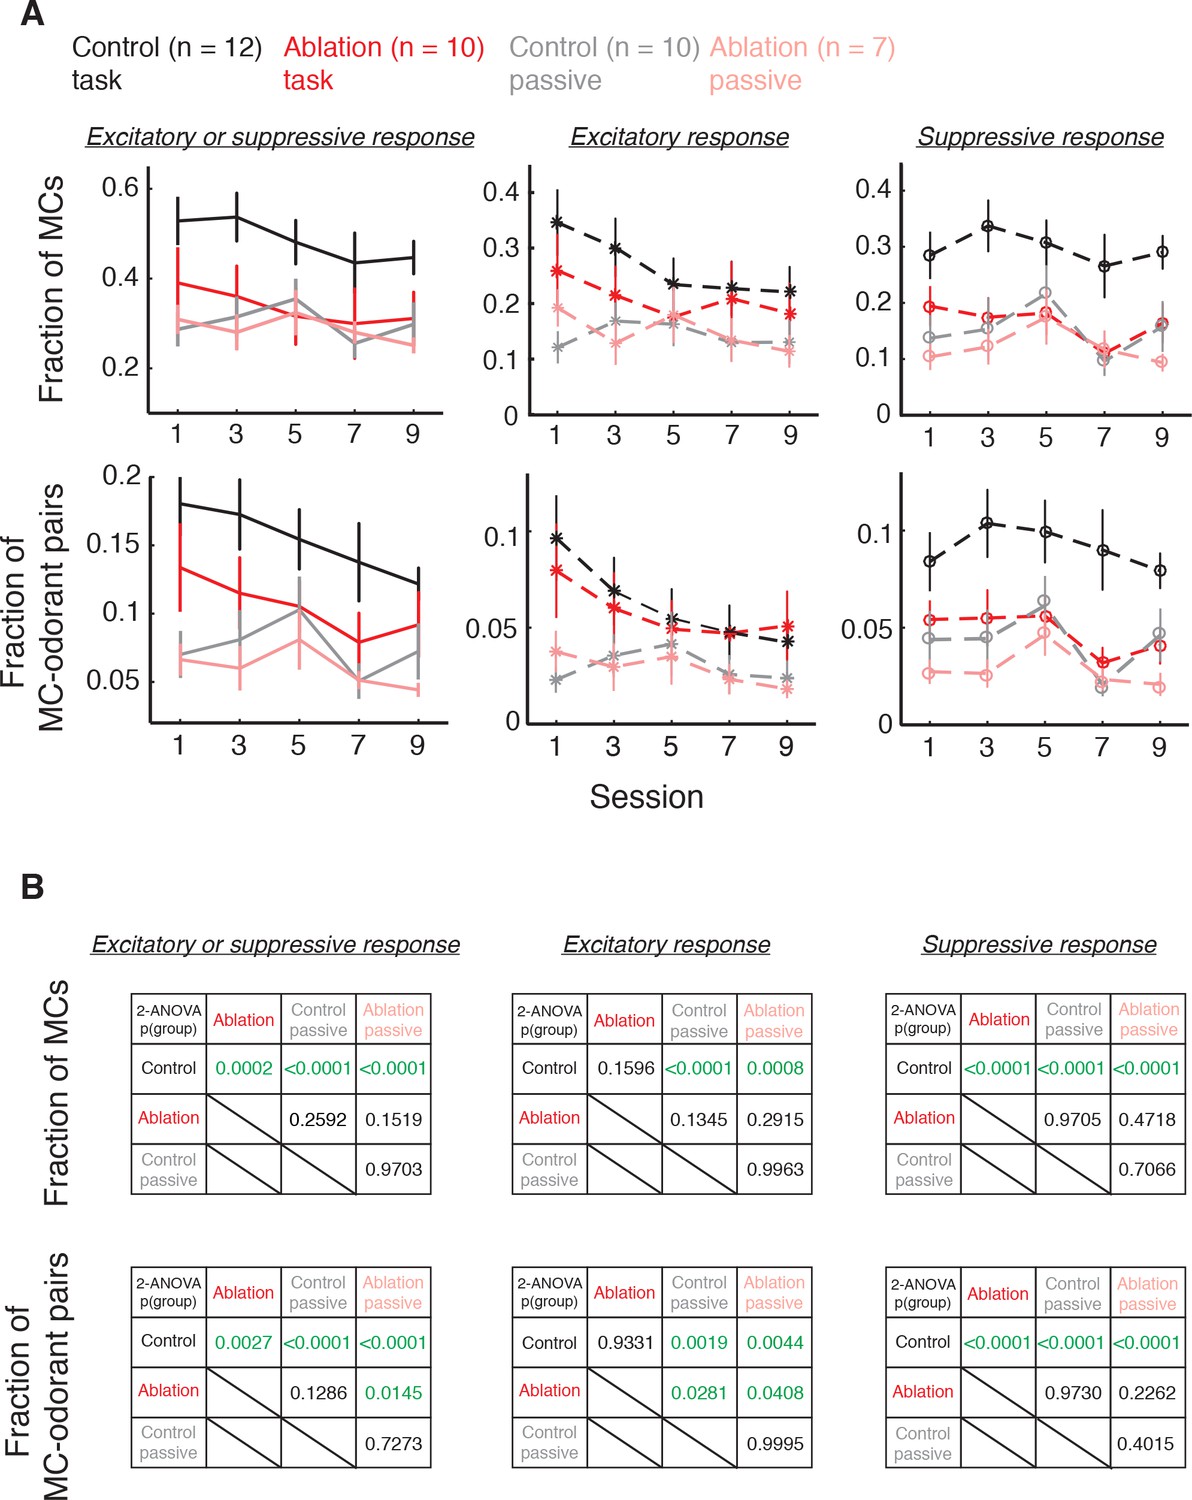
Fractions of responsive MCs during difficult discrimination task and passive exposure.
Control behavior: n = 12; ablation behavior: n = 10; Control passive: n = 10; ablation passive: n = 7. (A) Overlay of Figures 5A–C and 7A–C. Mean ±S.E.M. (B) P values of comparisons between each pair of groups for total, excitatory and suppressive response fractions. P values: two-way ANOVA, group effect. Green indicates statistical significance.
Tables
Key resources table
| Reagent type (species) or resource | Designation | Source or reference | Identifiers | Additional information |
| strain, strain background | Gfap-tk, ICR | PMID: 21814201 | Cameron Lab | |
| strain, strain background | Cdhr1-Cre, C57Bl/6 | RIKEN Brain Research Center | ID_source:RBRC02189 | |
| strain, strain background | mGfap-Cre, C57Bl/6 | PMID: 15494728 | Sofroniew Lab | |
| strain, strain background | Slc17a7-LoxP-TeNT, C57Bl/6 | PMID: 24760839 | Imayoshi Lab | |
| transfected constrct | AAV2.1 hsyn-FLEX-GCaMP6f | Upenn Vector Core | ID_source:CS1165 | |
| transfected constrct | AAV2.1-EF1a-FLEX-taCasp3-TEVp | Upenn Vector Core | ID_source:V3734TI-S | |
| transfected constrct | AAV2.1-CMV-PI-Cre-rBG | Upenn Vector Core | ID_source:CS1235 | |
| antibody | rat anti-BrdU | AbD serotec | ID_source:OBT0030 | Dilution: 1:500 |
| antibody | goat anti-rat Alexa 488 | Thermo Fisher | ID_source:RRID:AB_2534074 | Dilution: 1:1000 |
| antibody | goat anti-Doublecortin | Santa Cruz | ID_source:SC8066 | Dilution: 1:400 |
| antibody | donkey anti-goat Alexa 488 | Thermo Fisher | ID_source:RRID:AB_2534102 | Dilution: 1:1000 |
| antibody | goat anti-GFAP | Santa Cruz | ID_source:SC6170 | Dilution: 1:400 |
| antibody | mouse anti-NeuN | Millipore | ID_source:MAB377 | Dilution: 1:400 |
| antibody | rabbit anti-VAMP2 | Synaptic Systems | ID_source:104_202 | Dilution: 1:500 |
| antibody | DAPI | Vector Labs | ID_source:H1200 | |
| chemical compound, drug | Valganciclovir | Genentech | ID_source:NDC 0004-0039-09 | |
| chemical compound, drug | heptanal | Sigma | ID_source:111-71-7 | |
| chemical compound, drug | ethyl-tiglate | Sigma | ID_source:5837-78-5 | |
| software, algorithm | Matlab | https://www.mathworks.com/products/matlab.html | ID_source:RRID:SCR_001622 |
Additional files
-
Transparent reporting form
- https://doi.org/10.7554/eLife.33006.015
Download links
A two-part list of links to download the article, or parts of the article, in various formats.
Downloads (link to download the article as PDF)
Open citations (links to open the citations from this article in various online reference manager services)
Cite this article (links to download the citations from this article in formats compatible with various reference manager tools)
Adult-born neurons facilitate olfactory bulb pattern separation during task engagement
eLife 7:e33006.
https://doi.org/10.7554/eLife.33006


