Evidence for loss and reacquisition of alcoholic fermentation in a fructophilic yeast lineage
- Universidade Nova de Lisboa, Portugal
- Vanderbilt University, United States
- Purdue University, United States
- University of Wisconsin-Madison, United States
- Instituto Universitário Egas Moniz, Portugal
- Universidade Nova de Lisboa, Av. da República, Portugal
- LNEG – Laboratório Nacional de Energia e Geologia, Unidade de Bioenergia (UB), Portugal
- South China Agricultural University, China
- Institute of Agrochemistry and Food Technology (IATA), CSIC, Spain
- Agricultural Research Service, U.S. Department of Agriculture, United States
Figures
Figure 1
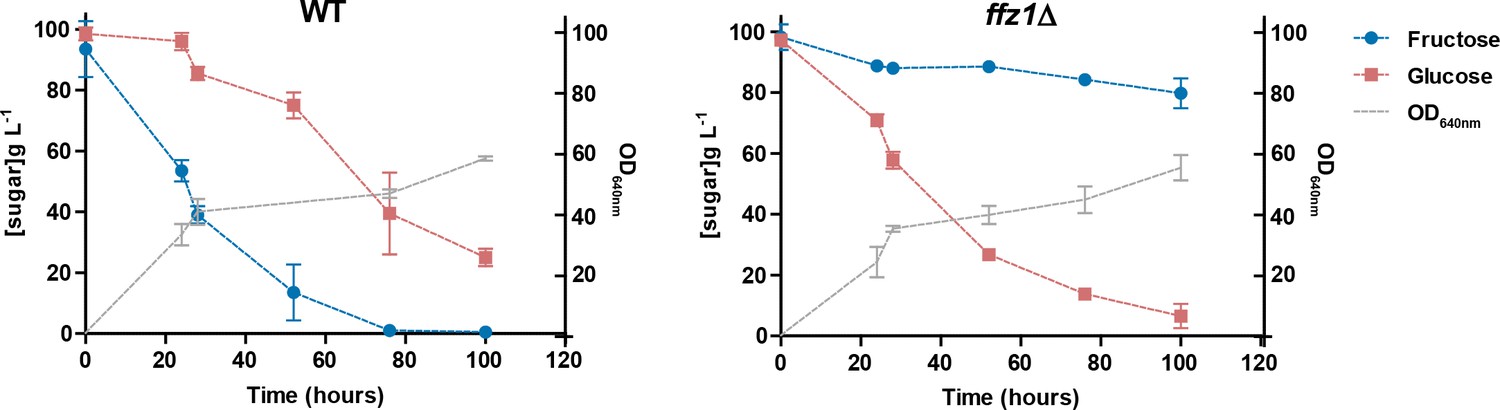
Sugar consumption profiles of St. bombicola wild type (wt) and ffz1Δ.
Strains were grown in YP supplemented with 10% (w/v) fructose and 10% (w/v) glucose for 100 hr at 30°C with aeration. Error bars represent standard deviation of assays performed in duplicate in two biological replicates.
-
Figure 1—source data 1
Data used to construct the plots is presented in Figure 1.
- https://doi.org/10.7554/eLife.33034.004
Figure 2 with 1 supplement
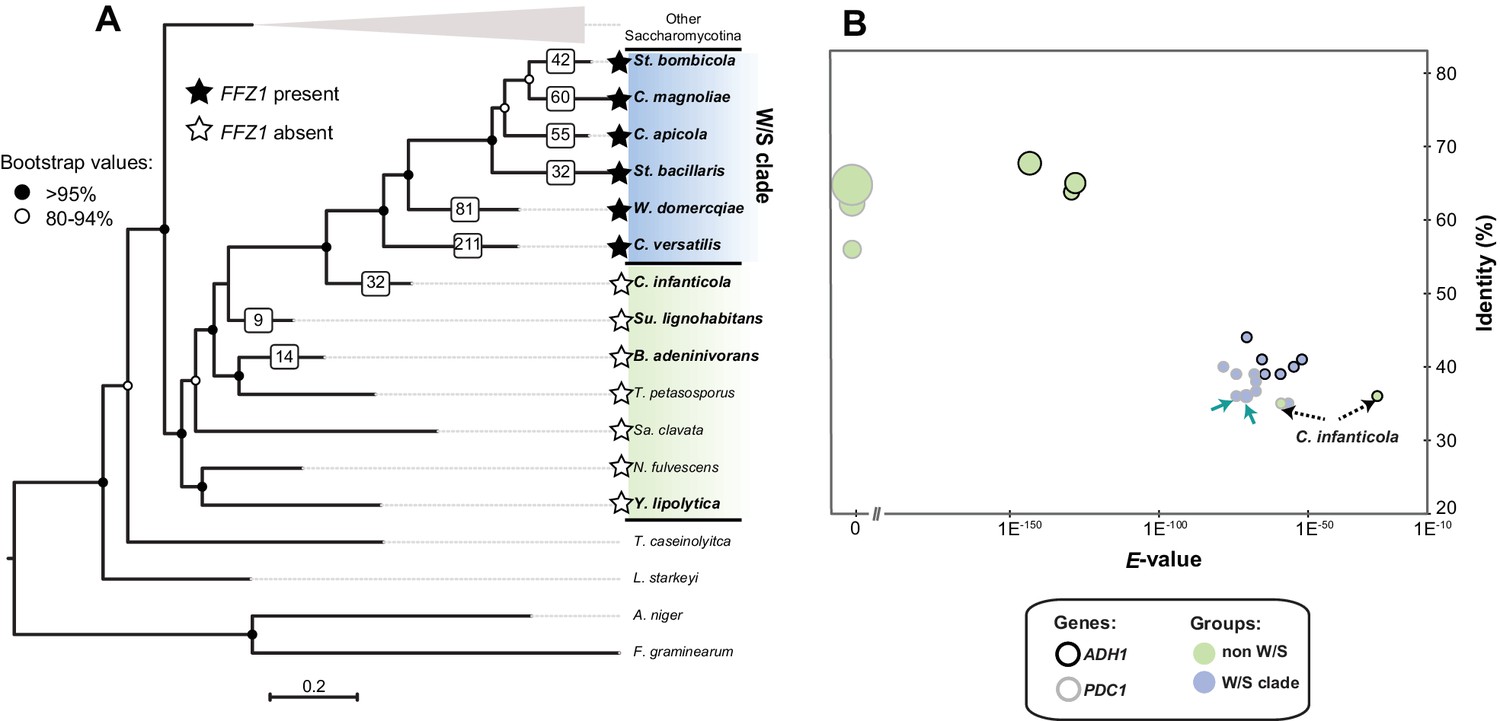
Maximum Likelihood phylogeny of Saccharomycotina (A) and tBLASTx results for alcoholic fermentation genes (B).
(A) ML phylogeny depicting the phylogenetic relationship between W/S species (highlighted in blue) and closest relatives (highlighted in green); other Saccharomycotina lineages were collapsed as indicated. Names of the species are abbreviated as indicated in Figure 2—source data 1. Presence (black stars) and absence (white stars) of the Ffz1 transporter is indicated for each species. AI results are shown as the number of trees in which phylogenetic clustering with bacteria was confirmed for each species tested in the respective branch (white squares). (B) tBLASTx results for ADH1 and PDC1 searches in W/S-clade species and closest relatives Su. lignohabitans, B. adeninivorans, and Y. lipolytica (highlighted in bold in Figure 2A). For each gene and species, the plot depicts the E-value (x axis), identity (y axis), and bitscore (z axis, diameter of the circle) relative to the S. cerevisiae orthologs. C. versatilis Pdc proteins of bacterial origin are indicated by the blue arrows.
-
Figure 2—source data 1
Accession numbers or coordinates for the proteins used to construct the species phylogeny.
- https://doi.org/10.7554/eLife.33034.007
-
Figure 2—source data 2
AI results for W/S species, C. infanticola, B. adeninivorans, and Su. lignohabitans.
- https://doi.org/10.7554/eLife.33034.008
-
Figure 2—source data 3
tBLASTx results for glycolytic proteins in the W/S clade.
- https://doi.org/10.7554/eLife.33034.009
-
Figure 2—source data 4
KEGG, Interpro and GO annotations of genes of bacterial origin in the W/S clade.
- https://doi.org/10.7554/eLife.33034.010
Figure 2—figure supplement 1
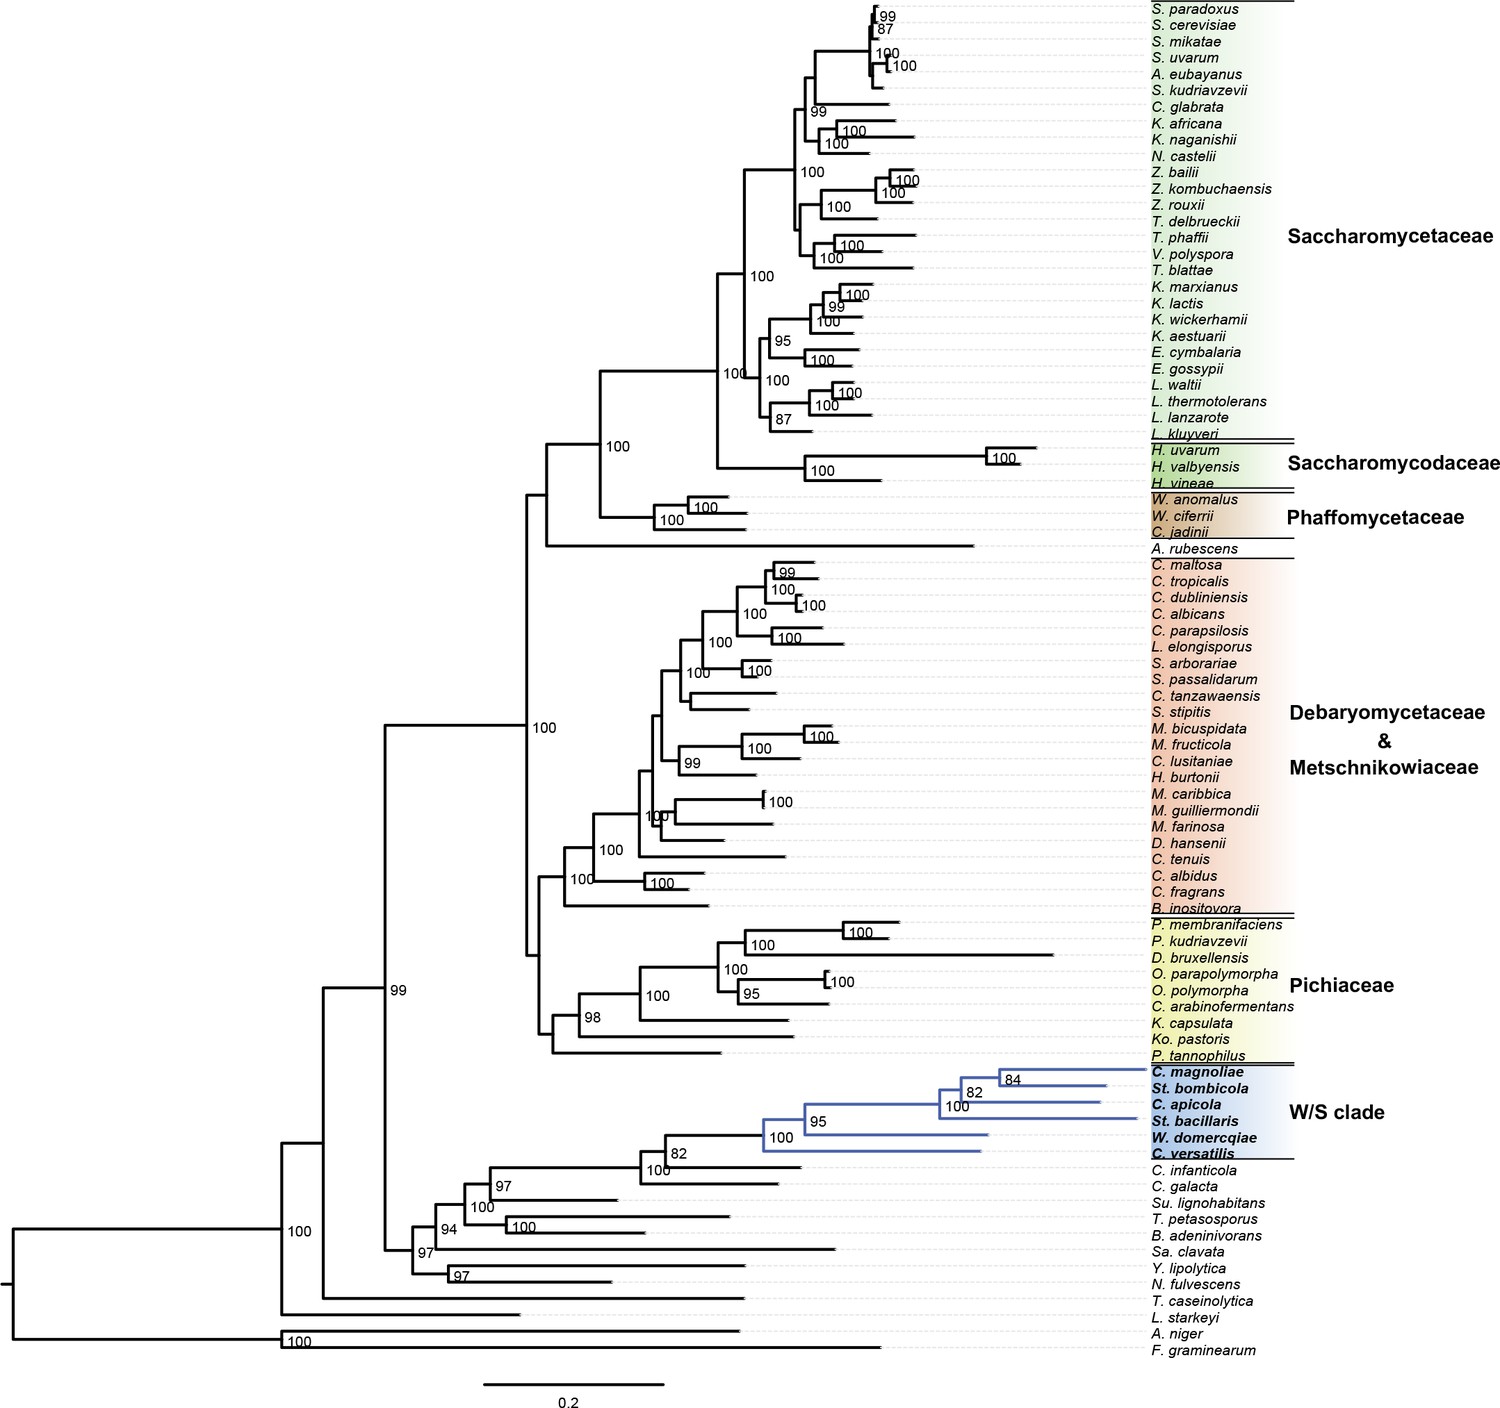
Complete ML phylogeny.
https://doi.org/10.7554/eLife.33034.006
Figure 3
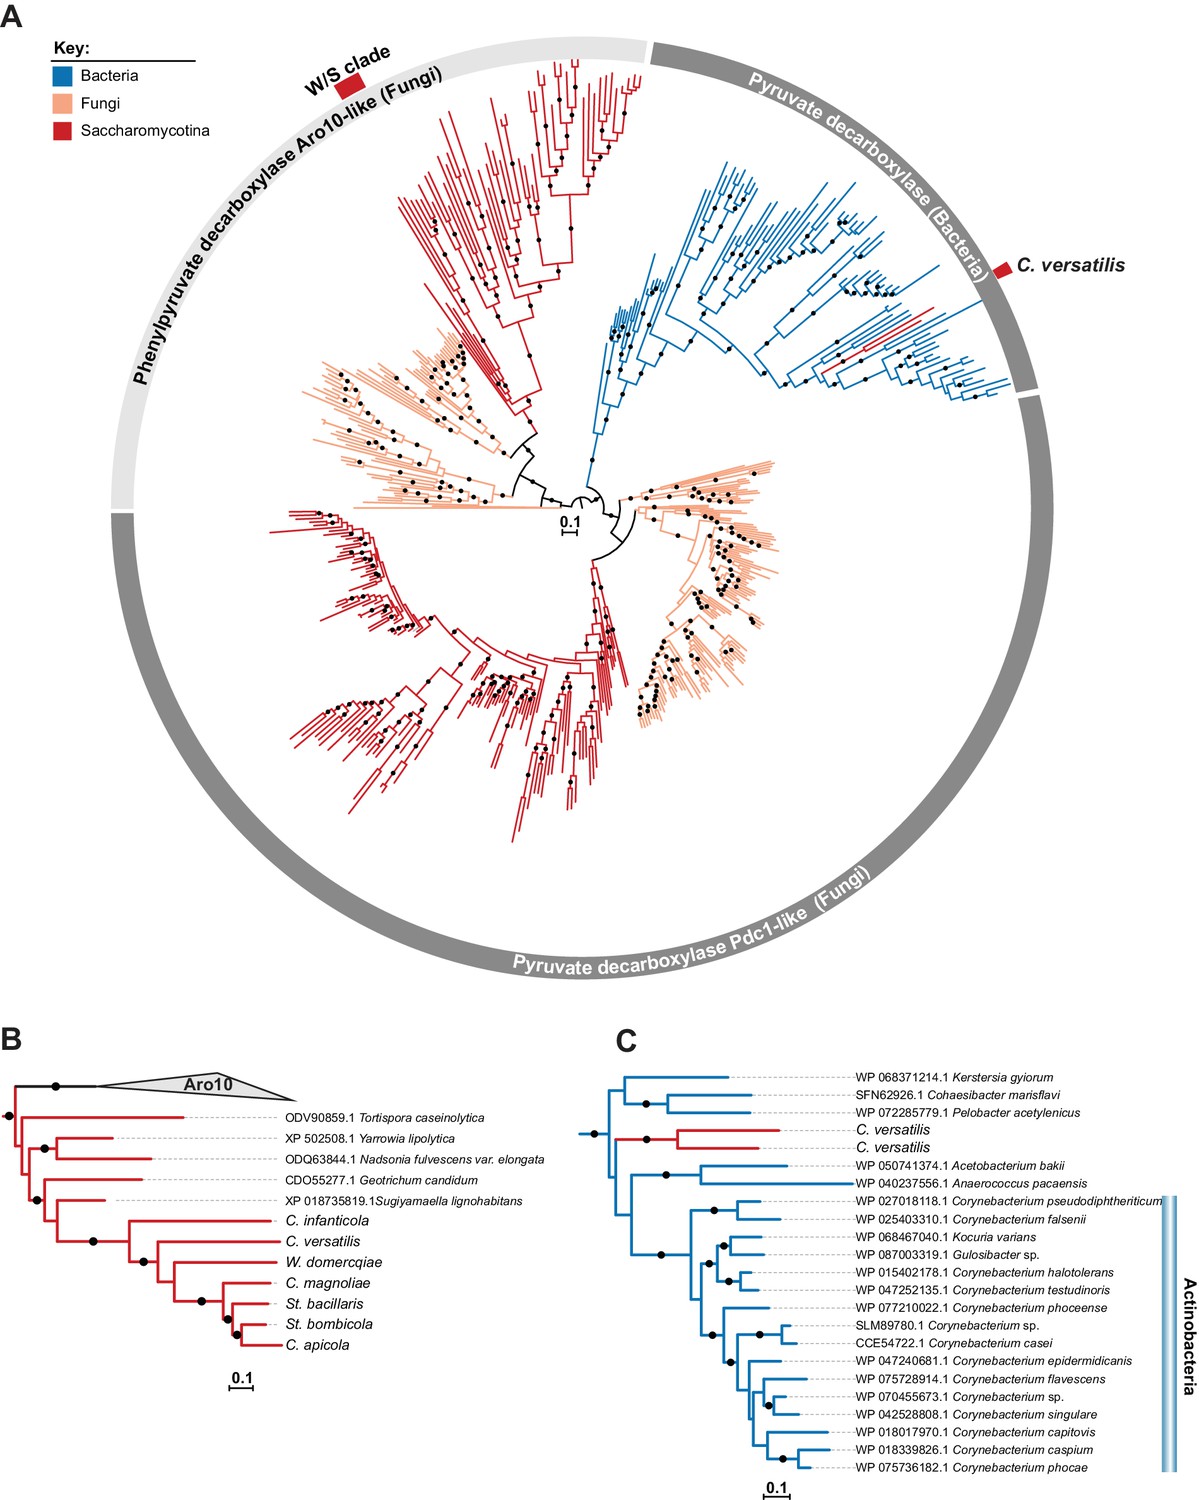
ML phylogeny of Pdc1 and Aro10.
A) ML phylogeny of Pdc1-like proteins. W/S-clade and C. versatilis sequences are indicated by red blocks. Branches with bootstrap support higher than 90% are indicated by black dots. The different lineages are represented with different branch colors (red for Saccharomycotina, blue for bacteria and orange for other Fungi (i.e. non-Saccharomycotina). Clades highlighted in grey (Aro10- and Pdc1-like) were assigned according to the phylogenetic position of functionally characterized S. cerevisiae proteins. (B, C) Pruned ML phylogenies depicting the phylogenetic relationship between W/S-clade Aro10 proteins and their closest relatives in the Saccharomycotina (B) and between C. versatilis Pdc1 xenologs and the closest related bacterial pyruvate decarboxylases (C). For W/S- clade sequences, protein ID is indicated before the abbreviated species name.
Figure 4 with 1 supplement
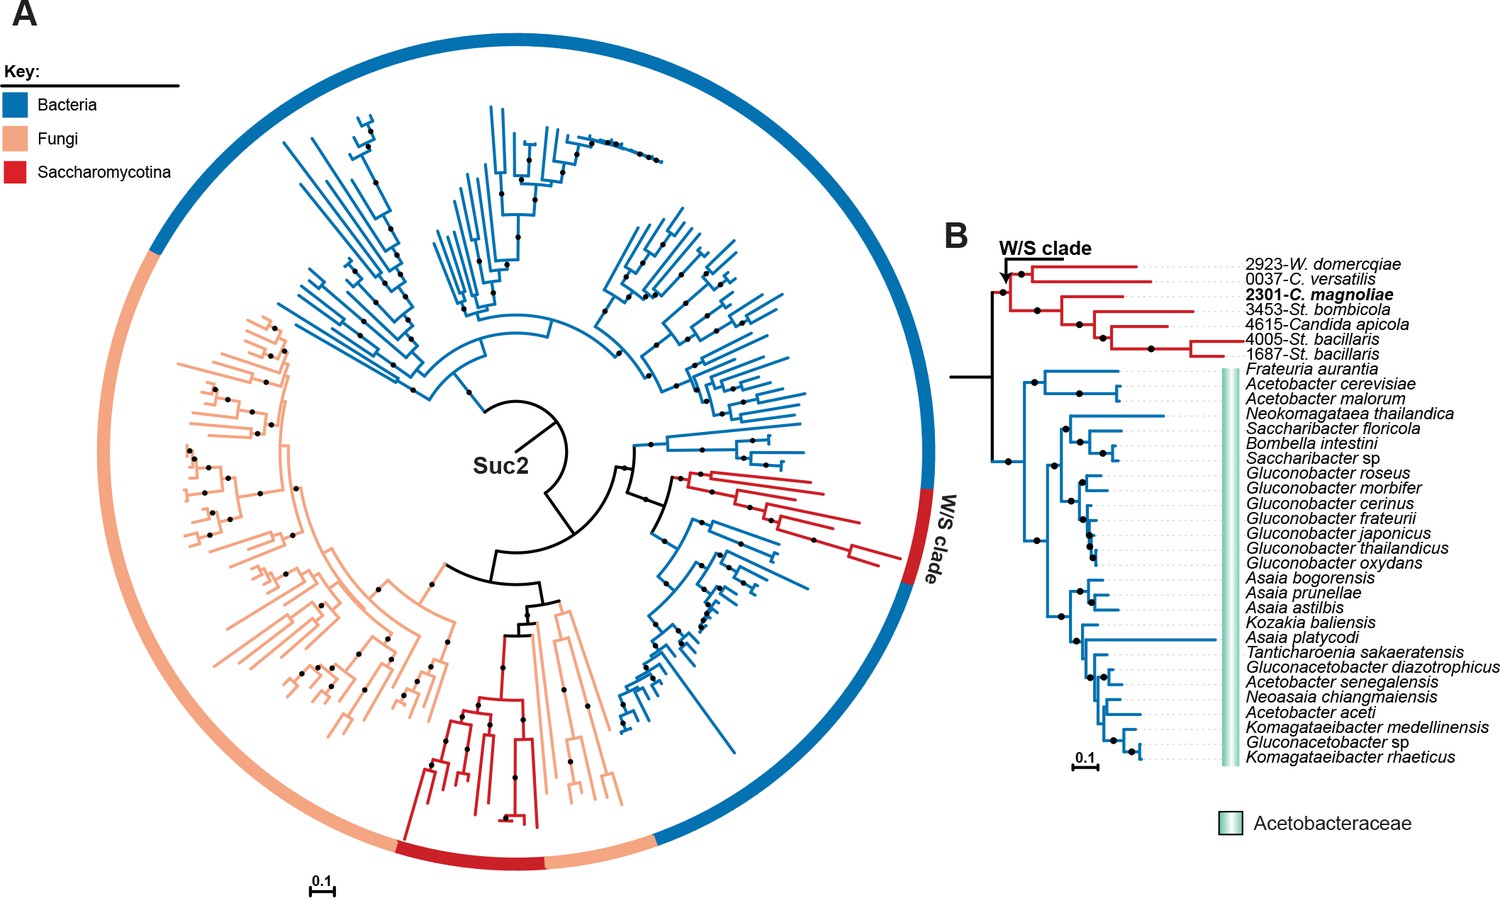
ML phylogeny of fungal Suc2 and bacterial SacC proteins.
A) ML phylogeny of Suc2/SacC proteins (top 200 phmmer hits). W/S-clade species are highlighted. The different lineages are represented with different branch colors (red for Saccharomycotina, blue for bacteria, and orange for other Fungi (i.e. non-Saccharomycotina)). Branches with bootstrap support higher than 90% are indicated by black dots. (B) Pruned ML phylogeny of Suc2 depicting the phylogenetic relationship between the W/S clade and Acetobacteraceae. For W/S sequences, protein ID is indicated before the abbreviated species name.
Figure 4—figure supplement 1
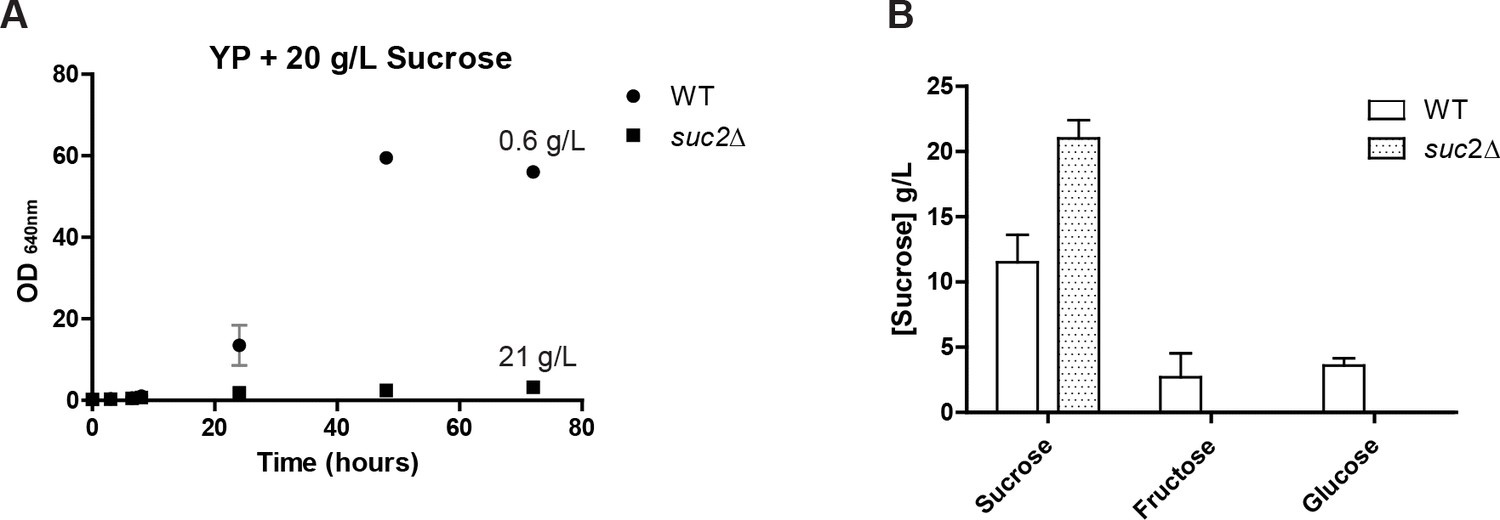
Growth and consumption of sucrose in St.
bombicola wt and suc2Δ mutant.
Figure 5 with 3 supplements
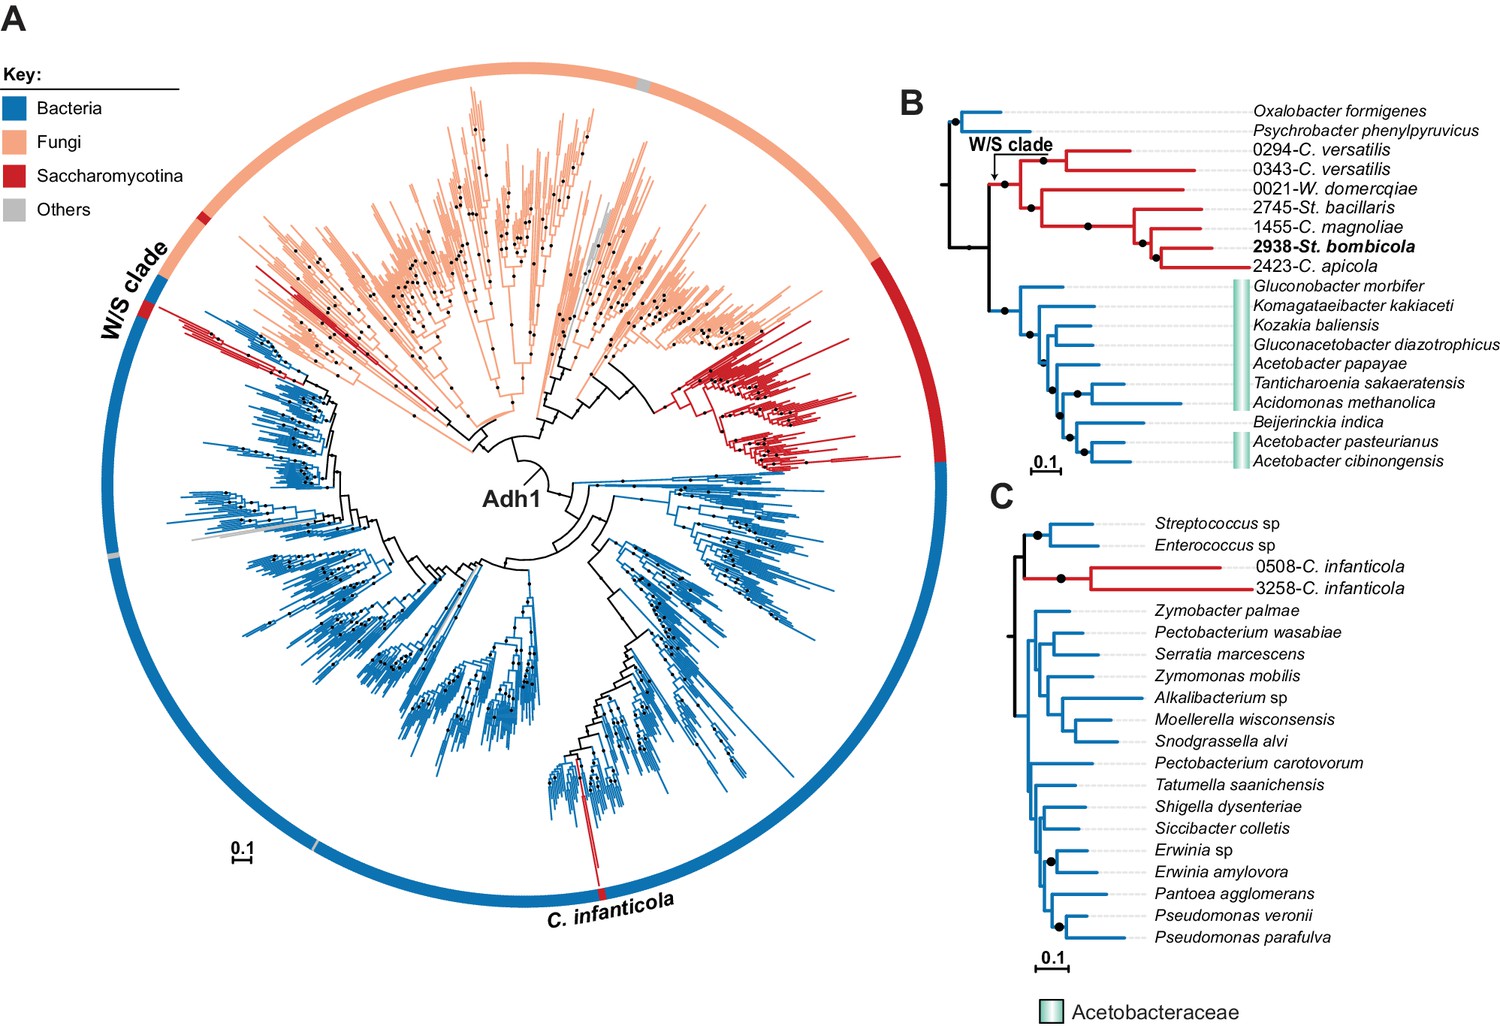
ML phylogeny of fungal and bacterial Adh1 proteins.
(A) ML phylogeny of Adh1 proteins (top 4000 phmmer hits). W/S-clade species and C. infanticola are highlighted. The different lineages are represented with different branch colors (red for Saccharomycotina, blue for bacteria, and orange for other Fungi (i.e. non-Saccharomycotina)). Branches with bootstrap support higher than 90% are indicated by black dots. Poorly represented lineages (<10 sequences) are shown in grey. (B, C) Pruned ML phylogenies of Adh1 depicting the phylogenetic relationship between the W/S clade and Acetobacteraceae (B) and between C. infanticola and other groups of bacteria (C). For W/S-clade sequences, the protein ID is indicated before the abbreviated species name.
Figure 5—figure supplement 1
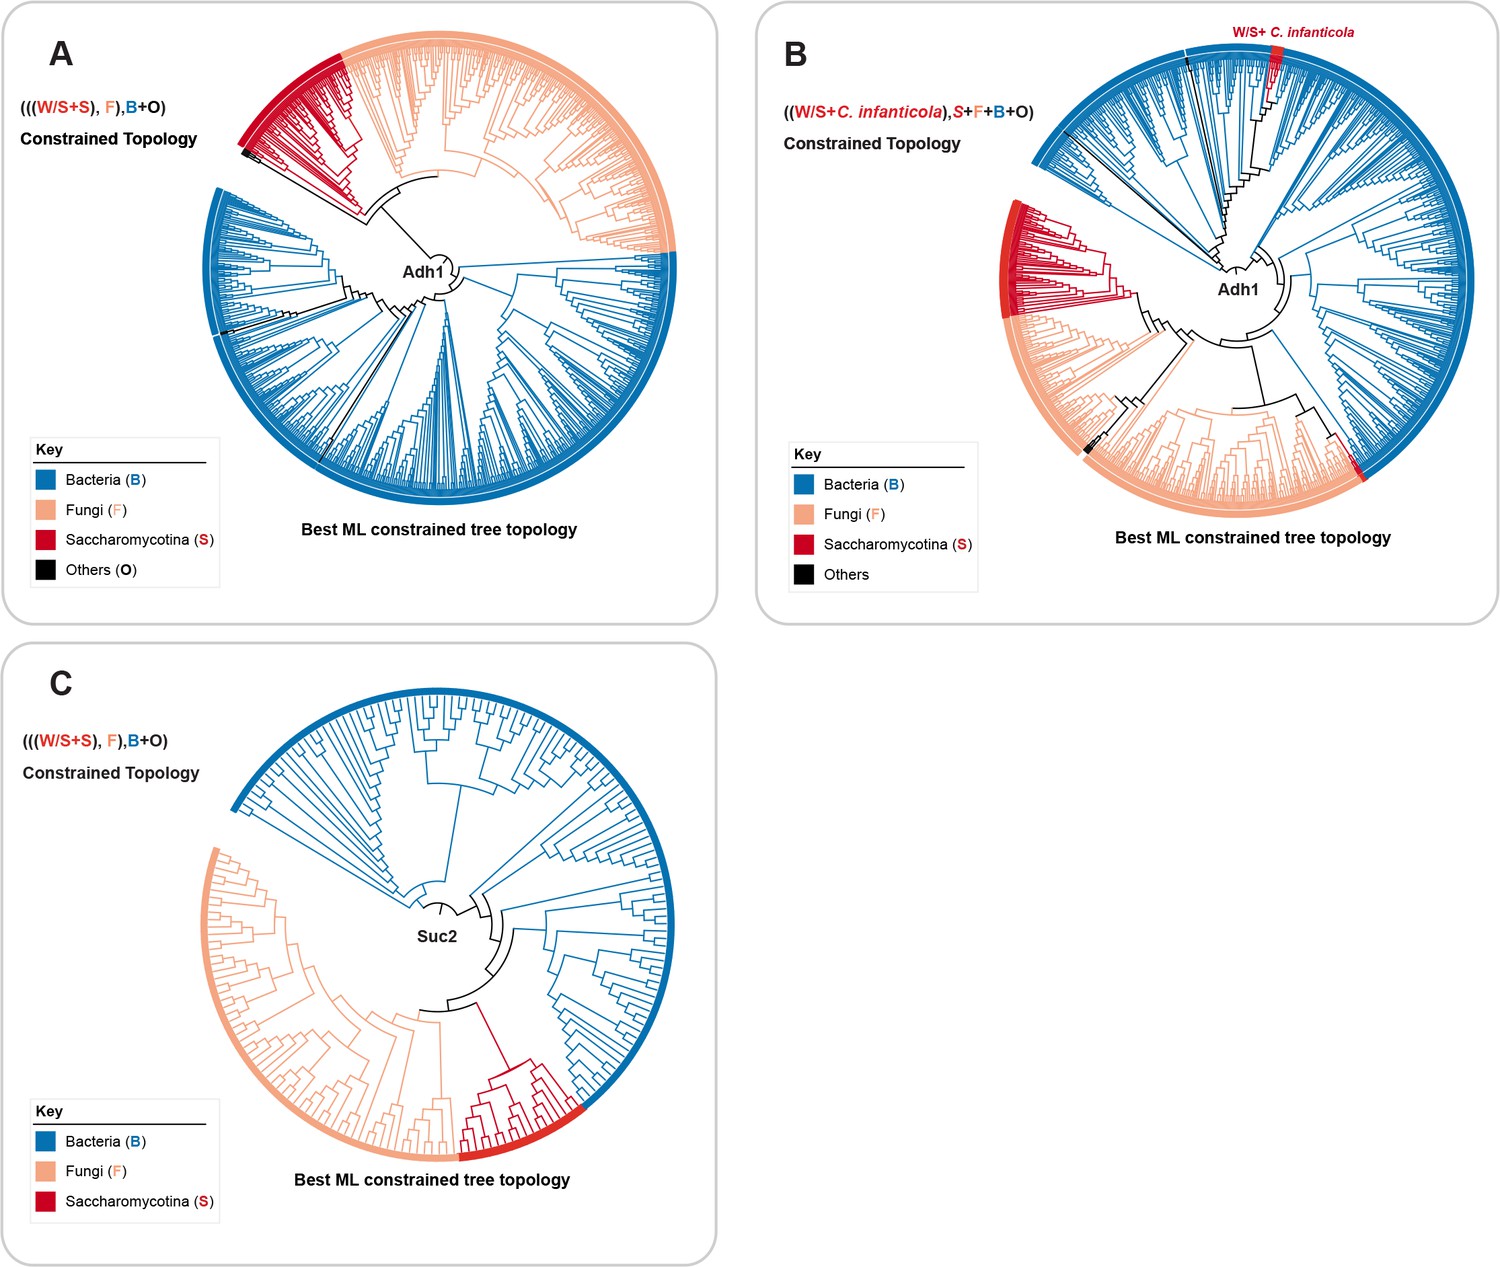
Topology test analyses for Adh1 and Suc2.
https://doi.org/10.7554/eLife.33034.015
Figure 5—figure supplement 2
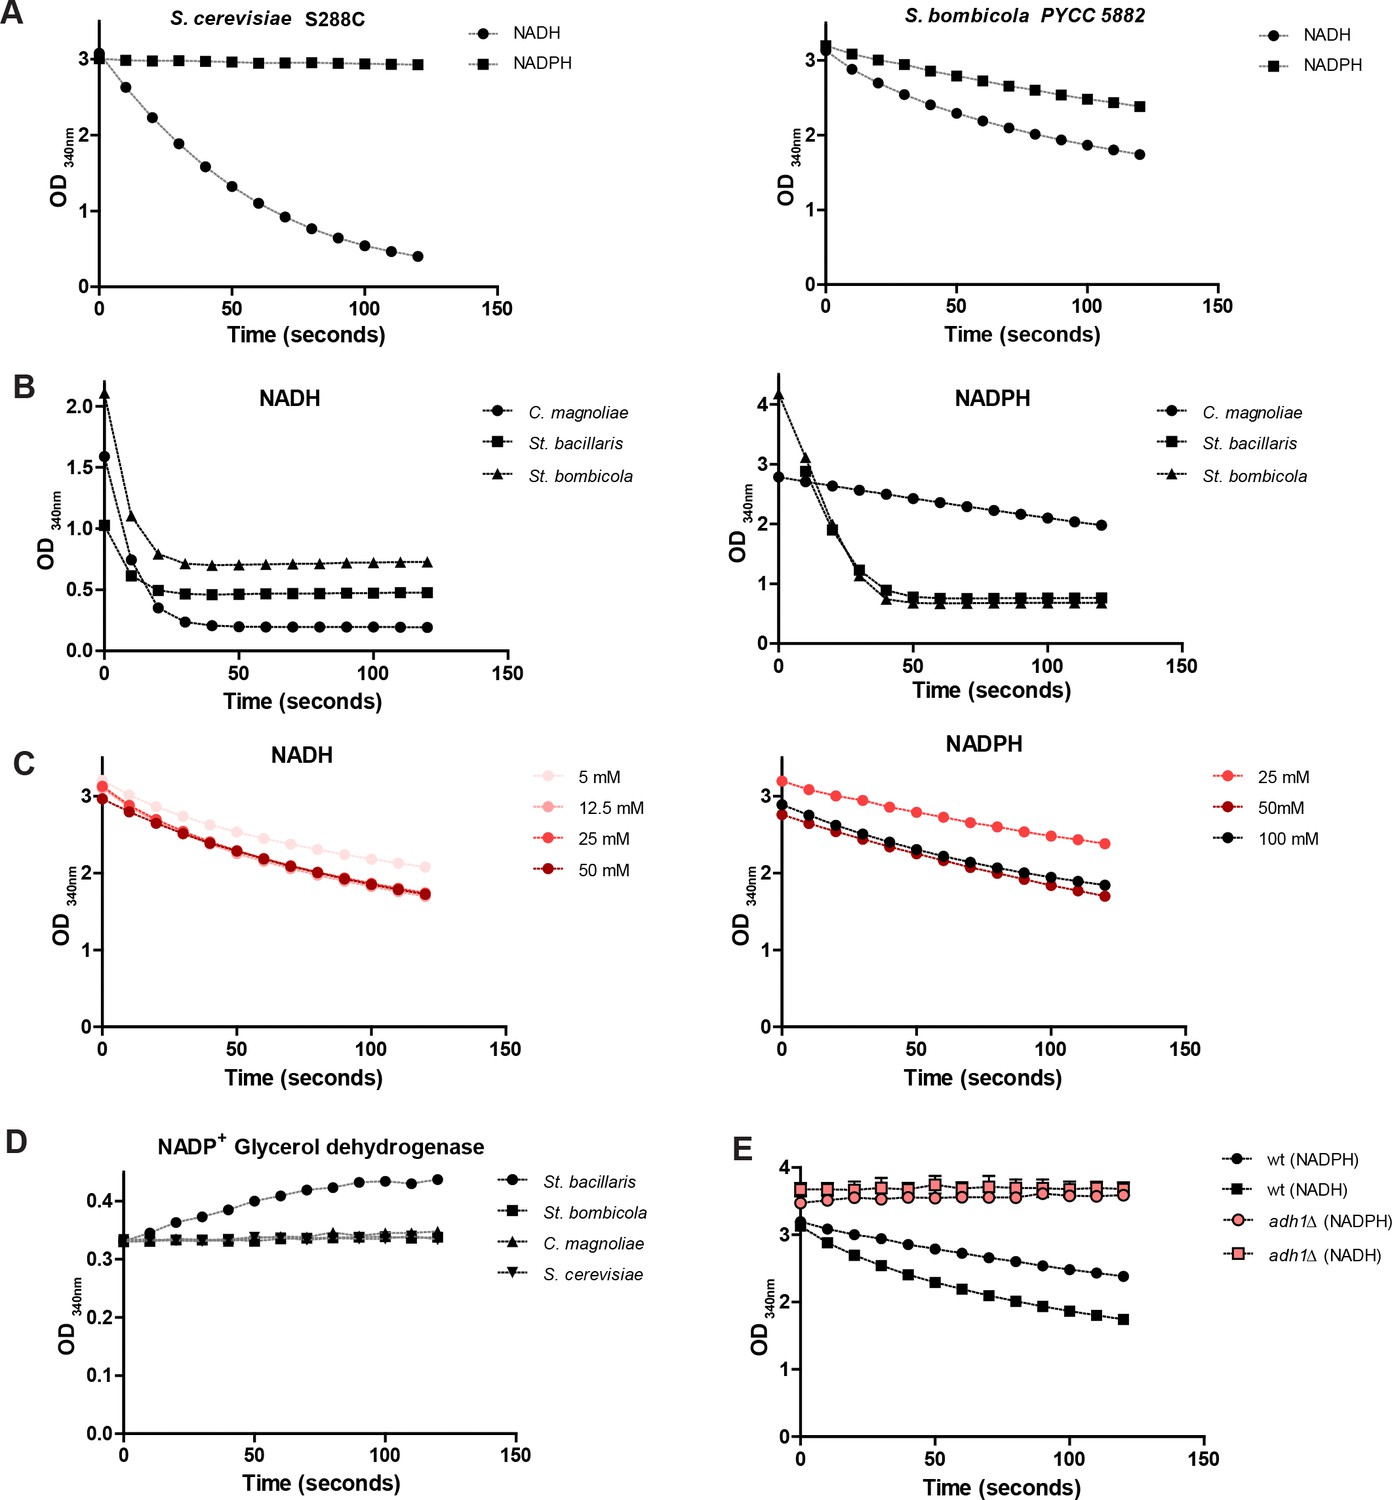
Alcohol dehydrogenase (Adh) activities.
https://doi.org/10.7554/eLife.33034.016
Figure 5—figure supplement 3
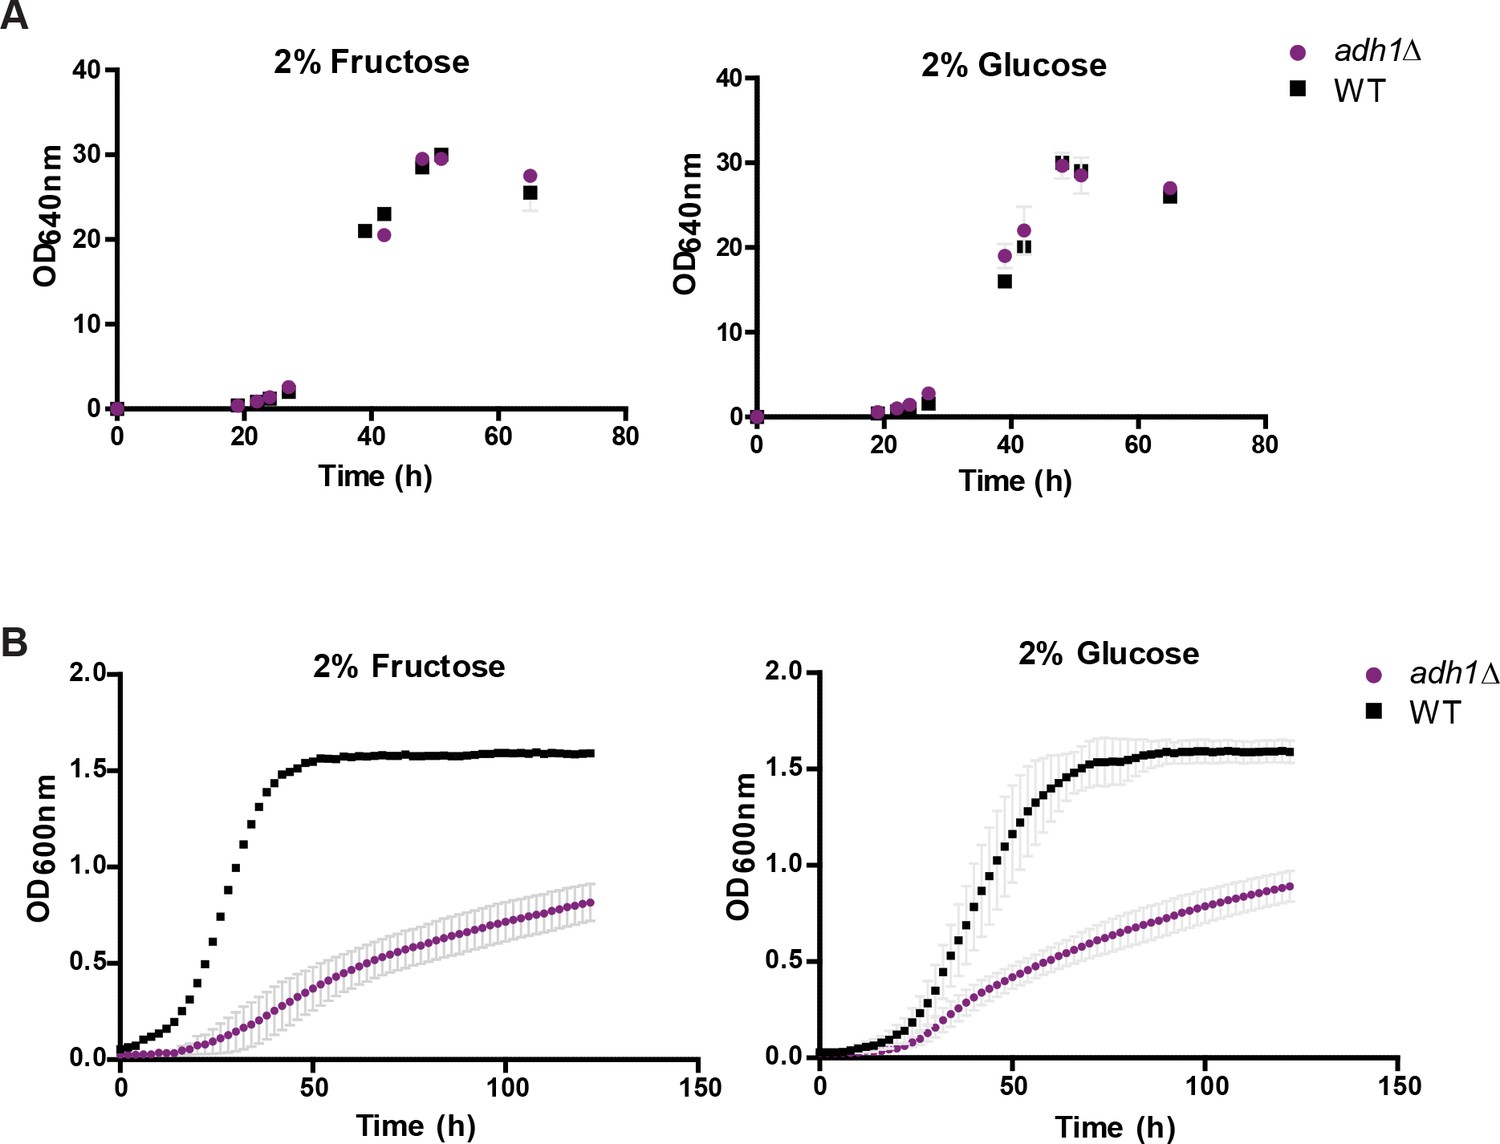
Growth of wt and adh1∆ under aeration and microaeration.
https://doi.org/10.7554/eLife.33034.017
Figure 6
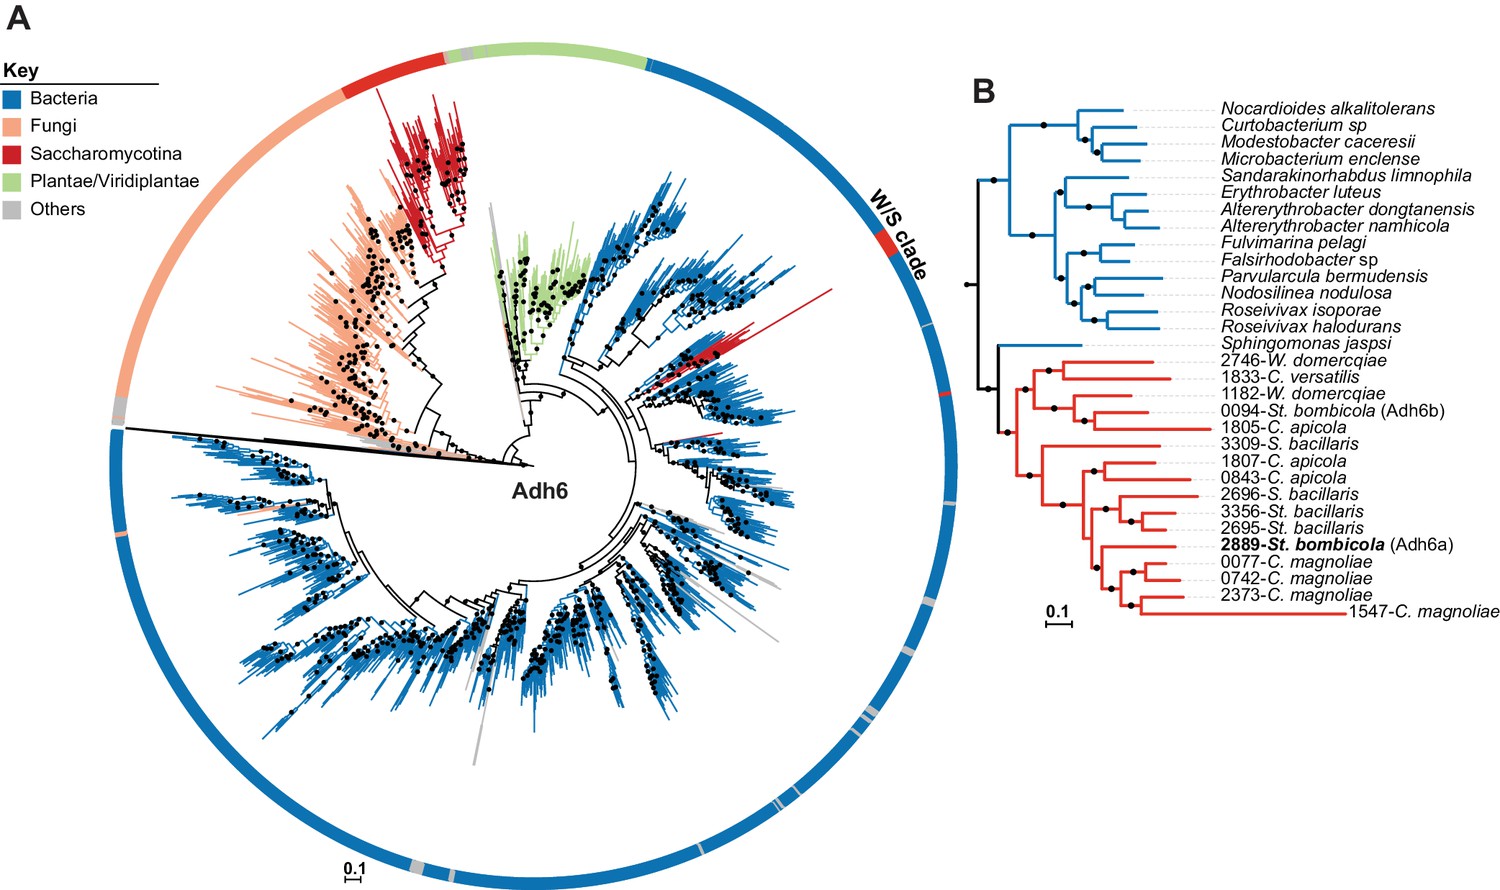
ML Phylogeny of Adh6 proteins.
(A) The phylogeny was constructed with the top 10,000 phmmer hits using St. bombicola Adh6 as a query (in bold, Panel B). Sequences with more than 80% similarity were eliminated. Branches with bootstrap support higher than 90% are indicated by black dots. Poorly represented lineages (<10 sequences) are shown in grey. The different lineages are represented with different branch colors (red for Saccharomycotina, blue for bacteria, and orange for other Fungi (i.e. non-Saccharomycotina)). Adh1-like sequences were collapsed as indicated. (B) Pruned ML phylogeny depicting the phylogenetic relationship between Adh6 sequences from the W/S clade and their closest bacterial relatives. For W/S-clade sequences, the protein ID is indicated before the abbreviated species name.
Figure 7 with 1 supplement
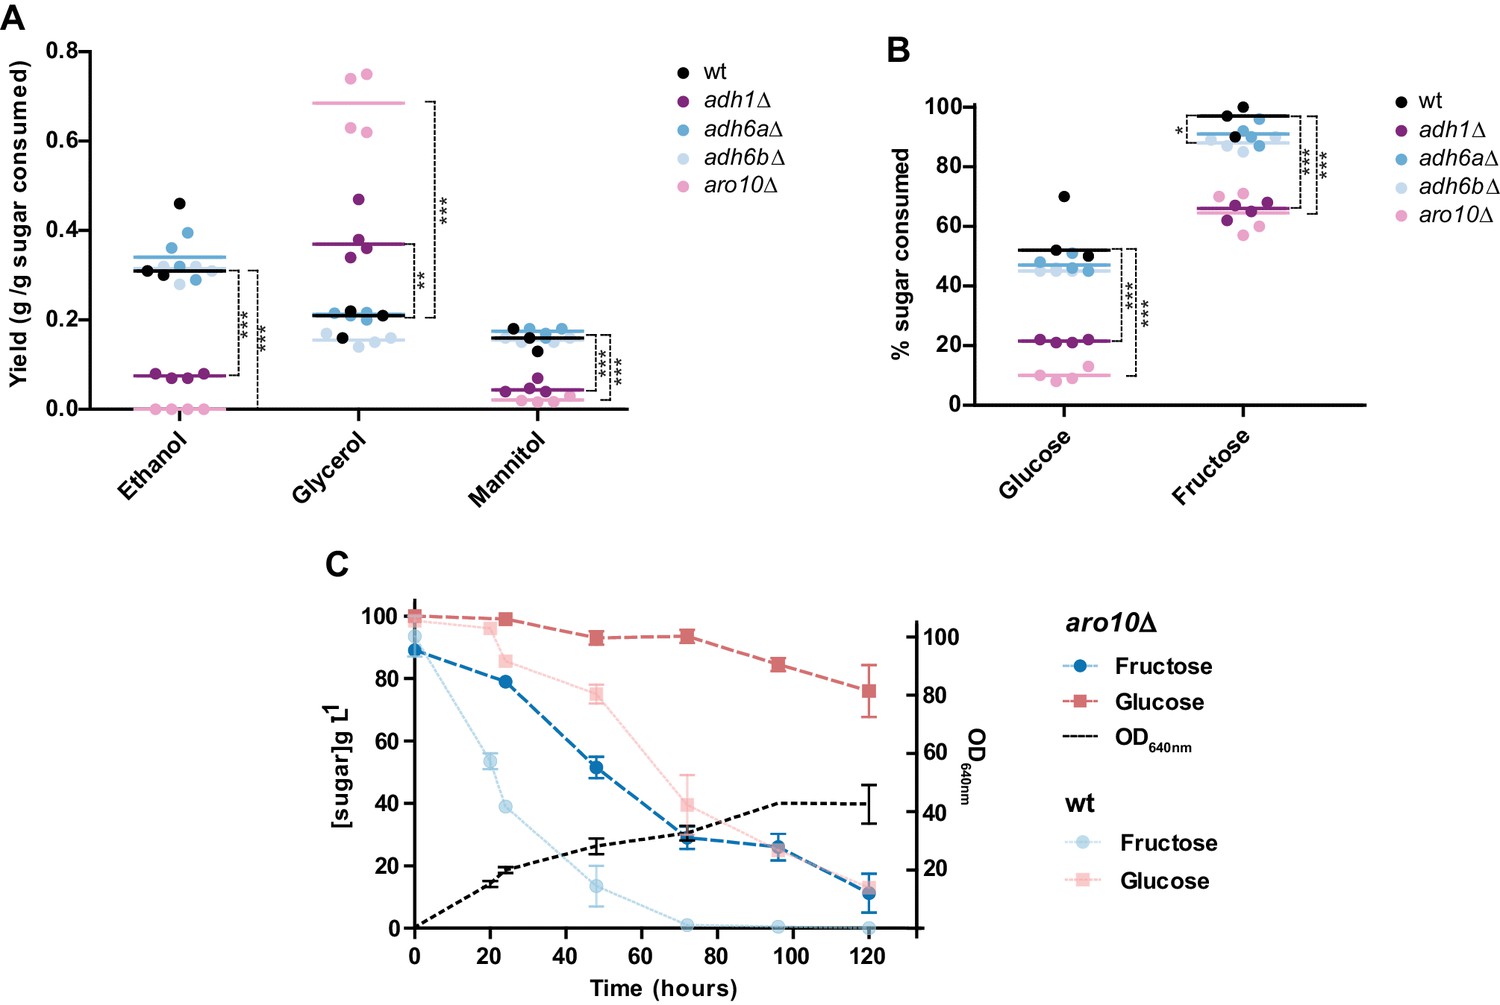
Metabolite production and sugar consumption in St. bombicola wild type (wt) and deletion mutants (adh1Δ, adh6aΔ, adh6bΔ, and aro10Δ).
(A) Ethanol, glycerol, and mannitol yields determined after 72 hr of growth. (B) Percentage of sugar (fructose and glucose) consumed after 72 hr of growth. Mean values are represented by the colored horizontal lines. Assays were performed in duplicate in two biological replicates. All strains were grown in 20FG medium at 30°C with aeration. Statistically significant differences (one way ANOVA, using the Bonferroni’s correction) between wt and deletion mutants for sugar consumption and metabolite production are shown (* p-value<0.05; ** p-value<0.01; *** p-value<0.001). Additional p-values for other pairwise comparisons are shown in Figure 7—source data 1. (C) Sugar consumption profile of aro10∆ mutant grown in 20FG medium. Sugar consumption profile is also shown for the wt strain as indicated in the key and was previously reported in Figure 1. Error bars represent standard deviation of assays performed in duplicate in two biological replicates.
-
Figure 7—source data 1
p-Values and data used to construct the plots.
- https://doi.org/10.7554/eLife.33034.021
-
Figure 7—source data 2
Primers and strategies used to construct the deletion mutants.
- https://doi.org/10.7554/eLife.33034.022
Figure 7—figure supplement 1
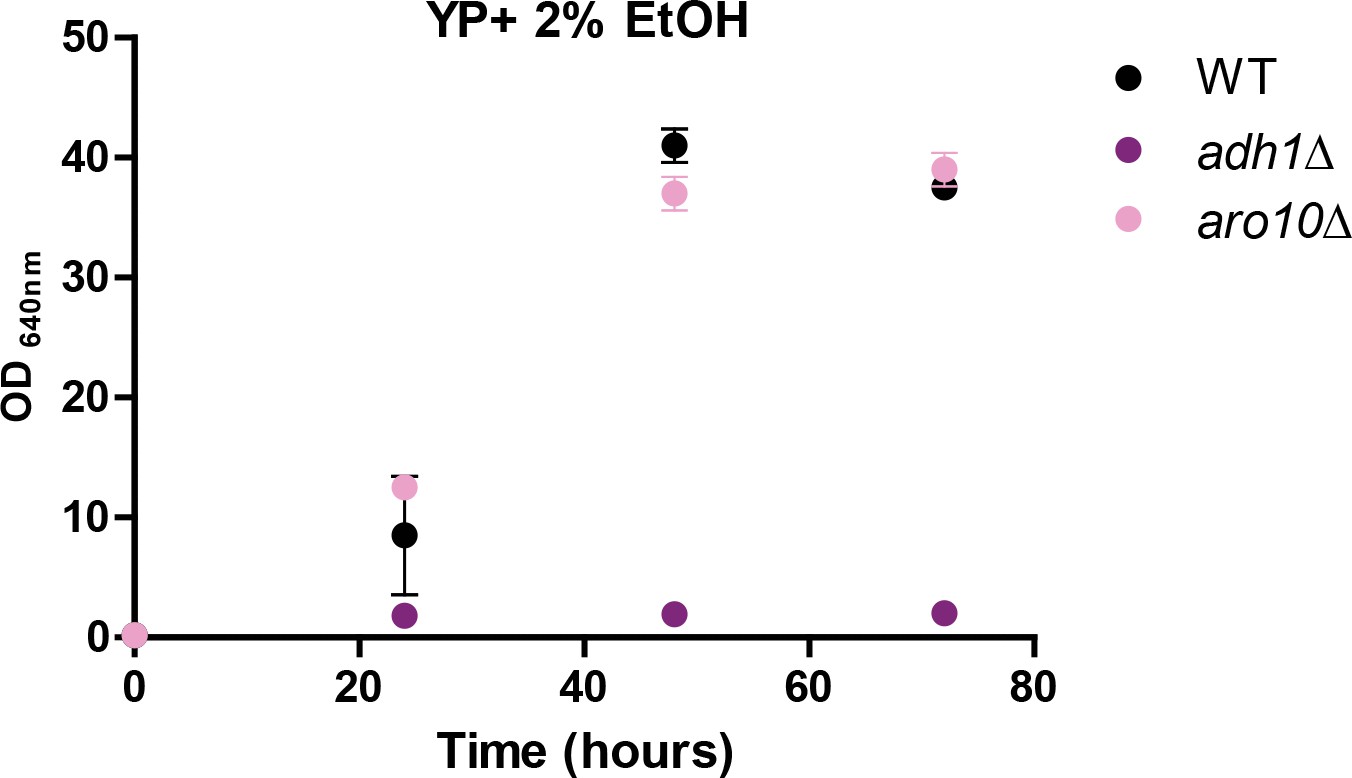
Growth of wt and mutants (adh1∆ and aro10∆) in ethanol-based medium.
https://doi.org/10.7554/eLife.33034.020
Figure 8
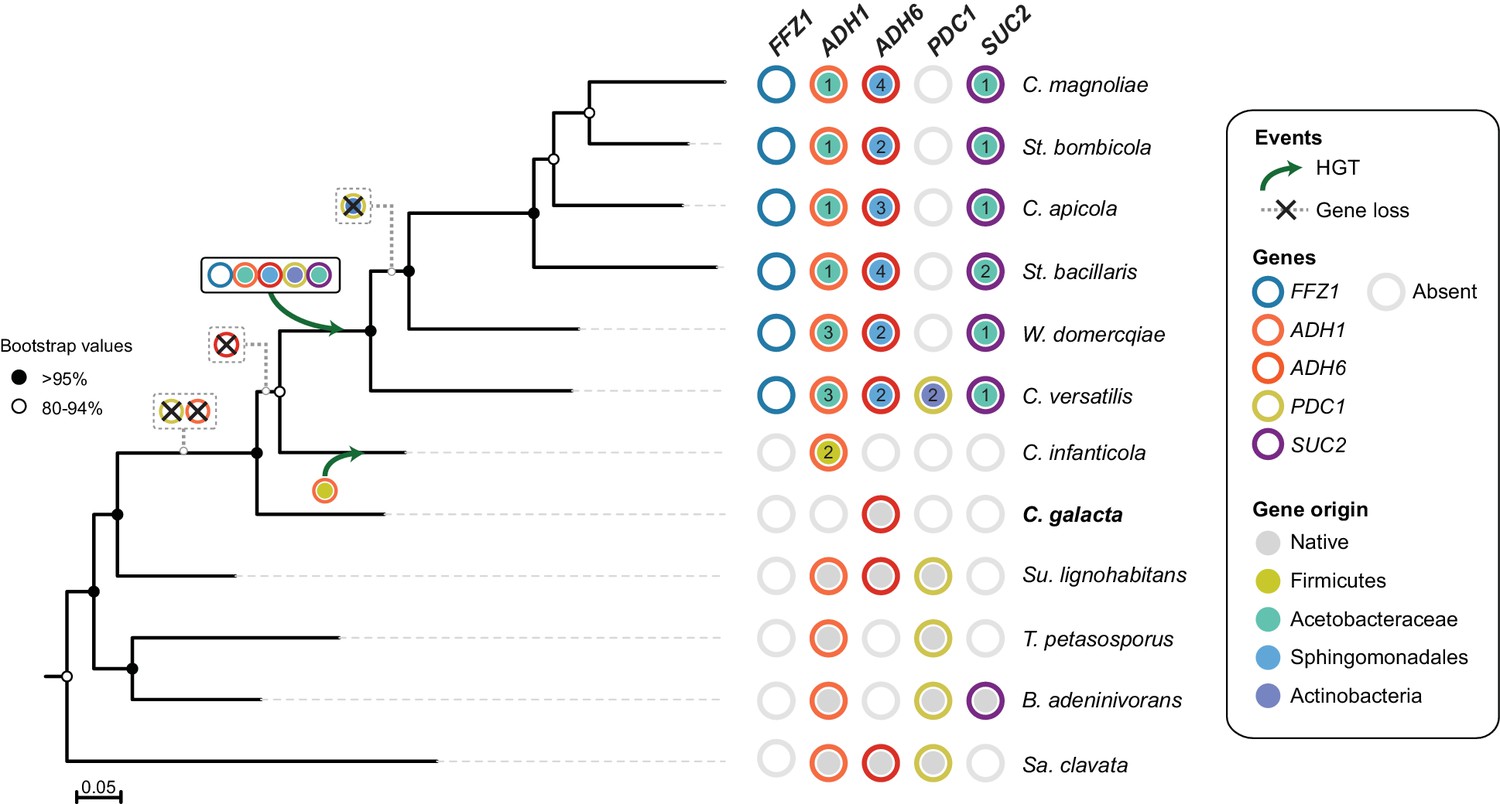
Loss and acquisition of sugar metabolism related genes in the W/S clade and closely related lineages.
Phylogenetic relationship between W/S species and closest relatives are depicted based on the ML phylogeny using the same dataset as in Figure 2A, but with the addition of C. galacta. For each of the four relevant genes: ADH1, ADH6, SUC2, and PDC1, presence, absence, and the native or bacterial origin of the orthologs found in the cognate draft genomes are shown for each species next to the respective branch of the tree. Each gene is represented by circles with different line colors (blue for previously studied FFZ1 (Gonçalves et al., 2016), orange for ADH1, red for ADH6, yellow for PDC1, and purple for SUC2). For xenologs, the different predicted bacterial donor lineages are denoted by different fill colors as indicated in the key. For W/S-clade species, the number of paralogs found in the cognate draft genome is also shown. Inferred gene losses (cross) and HGTs events (arrows) are indicated in the tree using the same color codes.
Tables
Key resources table
| Reagent type (species) or resource | Designation | Source or reference | Identifiers | Additional information |
|---|---|---|---|---|
| Strain, strain background | Starmerella bombicola PYCC 5882 | Portuguese Yeast Culture Collection | ||
| Strain, strain background | Candida magnoliae PYCC 2903 | Portuguese Yeast Culture Collection | ||
| Strain, strain background | Starmerella bacillaris PYCC 3044 | Portuguese Yeast Culture Collection | ||
| Strain, strain background | Saccharomyces cerevisiae PYCC 7186 (S288C) | Portuguese Yeast Culture Collection | ||
| Genetic reagent (Starmerella bombicola) | adh1∆ (adh1∆::HYG) | This paper | Constructed as described in the materials and methods section; primers used are described in Figure 7—source data 2 | |
| Genetic reagent (Starmerella bombicola) | aro10∆ (aro10∆::HYG) | This paper | Constructed as described in the materials and methods section; primers used are described in Figure 7—source data 2 | |
| Genetic reagent (Starmerella bombicola) | adh6a∆ (adh6a∆::HYG) | This paper | Constructed as described in the materials and methods section; primers used are described in Figure 7—source data 2 | |
| Genetic reagent (Starmerella bombicola) | adh6b∆ (adh6b∆::HYG) | This paper | Constructed as described in the materials and methods section; primers used are described in Figure 7—source data 2 | |
| Genetic reagent (Starmerella bombicola) | ffz1∆ (ffz1∆::HYG) | This paper | Constructed as described in the materials and methods section; primers used are described in Figure 7—source data 2 |
Additional files
-
Transparent reporting form
- https://doi.org/10.7554/eLife.33034.024
Download links
A two-part list of links to download the article, or parts of the article, in various formats.
Downloads (link to download the article as PDF)
Open citations (links to open the citations from this article in various online reference manager services)
Cite this article (links to download the citations from this article in formats compatible with various reference manager tools)
Evidence for loss and reacquisition of alcoholic fermentation in a fructophilic yeast lineage
eLife 7:e33034.
https://doi.org/10.7554/eLife.33034


