Single-cell RNA-seq reveals hidden transcriptional variation in malaria parasites
- Wellcome Sanger Institute, United Kingdom
- University of Cambridge, United Kingdom
Figures
Figure 1
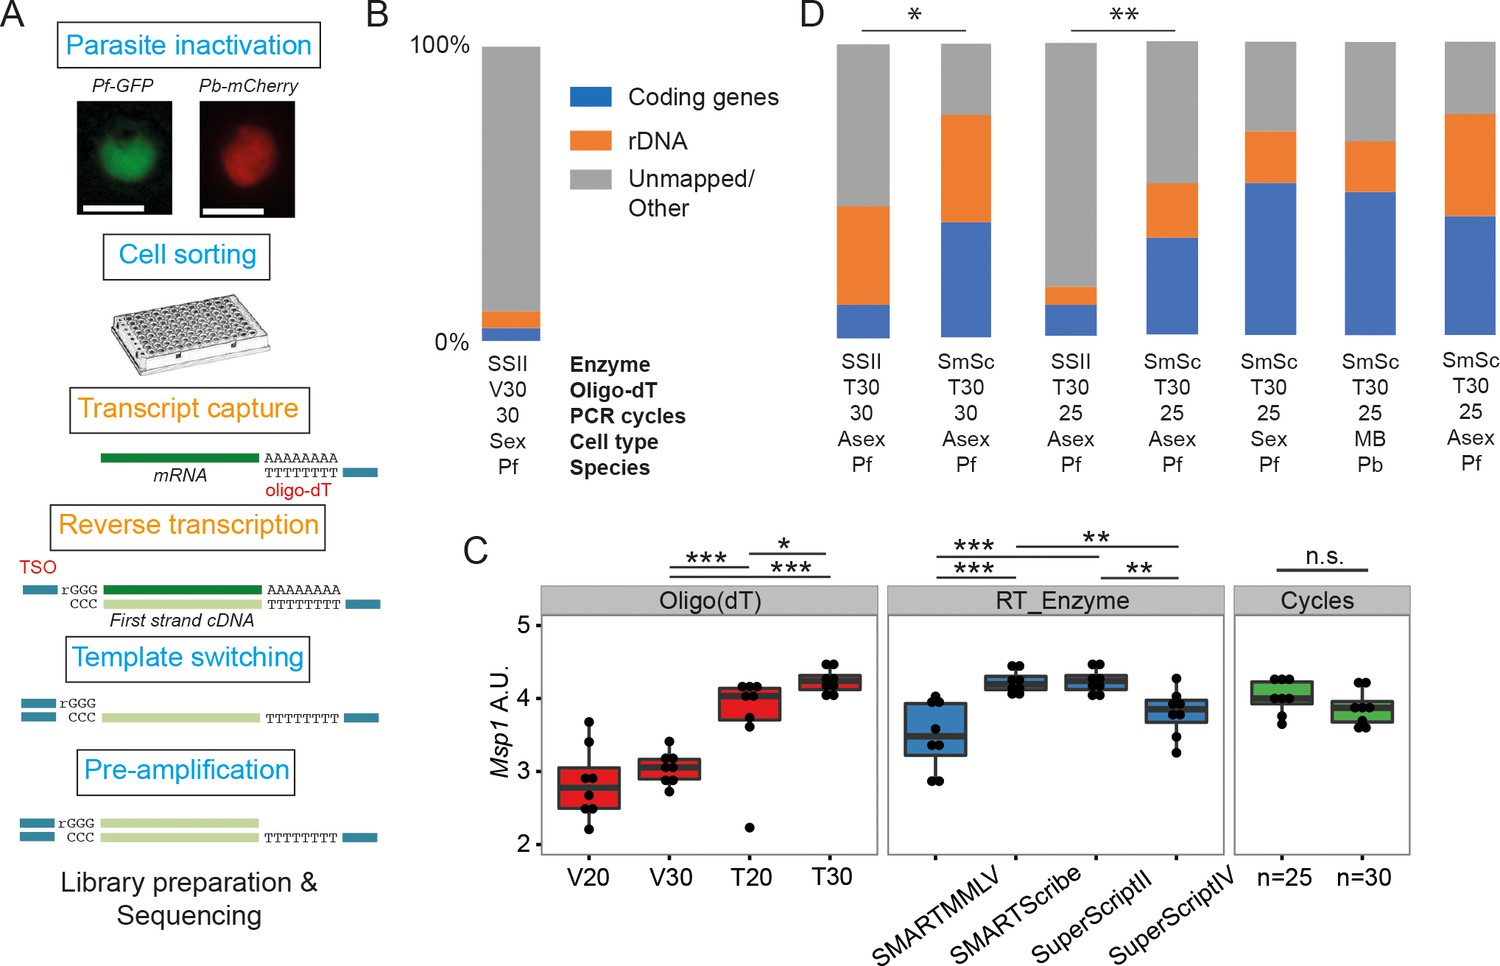
Establishment of a robust protocol for single-cell transcriptomic analysis of Plasmodium parasites.
(A) Overview of the single-cell RNAseq protocol. Steps in the original Smart-seq2 protocol (Picelli et al., 2013) that resulted in significant gains are highlighted in orange. (B) Relative numbers of reads mapping to coding RNA and rDNA for our initial sequencing trial, averaged over all cells in that trial (n = 5). (C) The protocol was evaluated using qPCR of the msp-1 transcript (PF3D7_09303000) on sorted pools of 10 asexual parasites (n = 8) (significance from Mann-Whitney test, p≤0.05 *p≤0.01 **p≤0.001 ***). The following reagents were tested: Oligo(dT)s containing a terminal anchoring base (A,G,C; V) or not (T) and of varying lengths (20 Ts vs. 30 Ts); four reverse transcriptase enzymes; 25 or 30 cycles of preamplification. (D) Relative numbers of reads mapping to coding RNA and rDNA for optimisation trials (6, 5, 6, 6 cells, respectively) and the main P. falciparum gametocyte (n = 237), P. berghei mixed blood (n = 182) and P. falciparum asexual (n = 189) datasets (final three bars). Asterisks indicate selected significant differences between proportions of reads mapping to coding genes, calculated using Mann-Whitney U (p≤0.05 *p≤0.01 **).
Figure 2 with 2 supplements
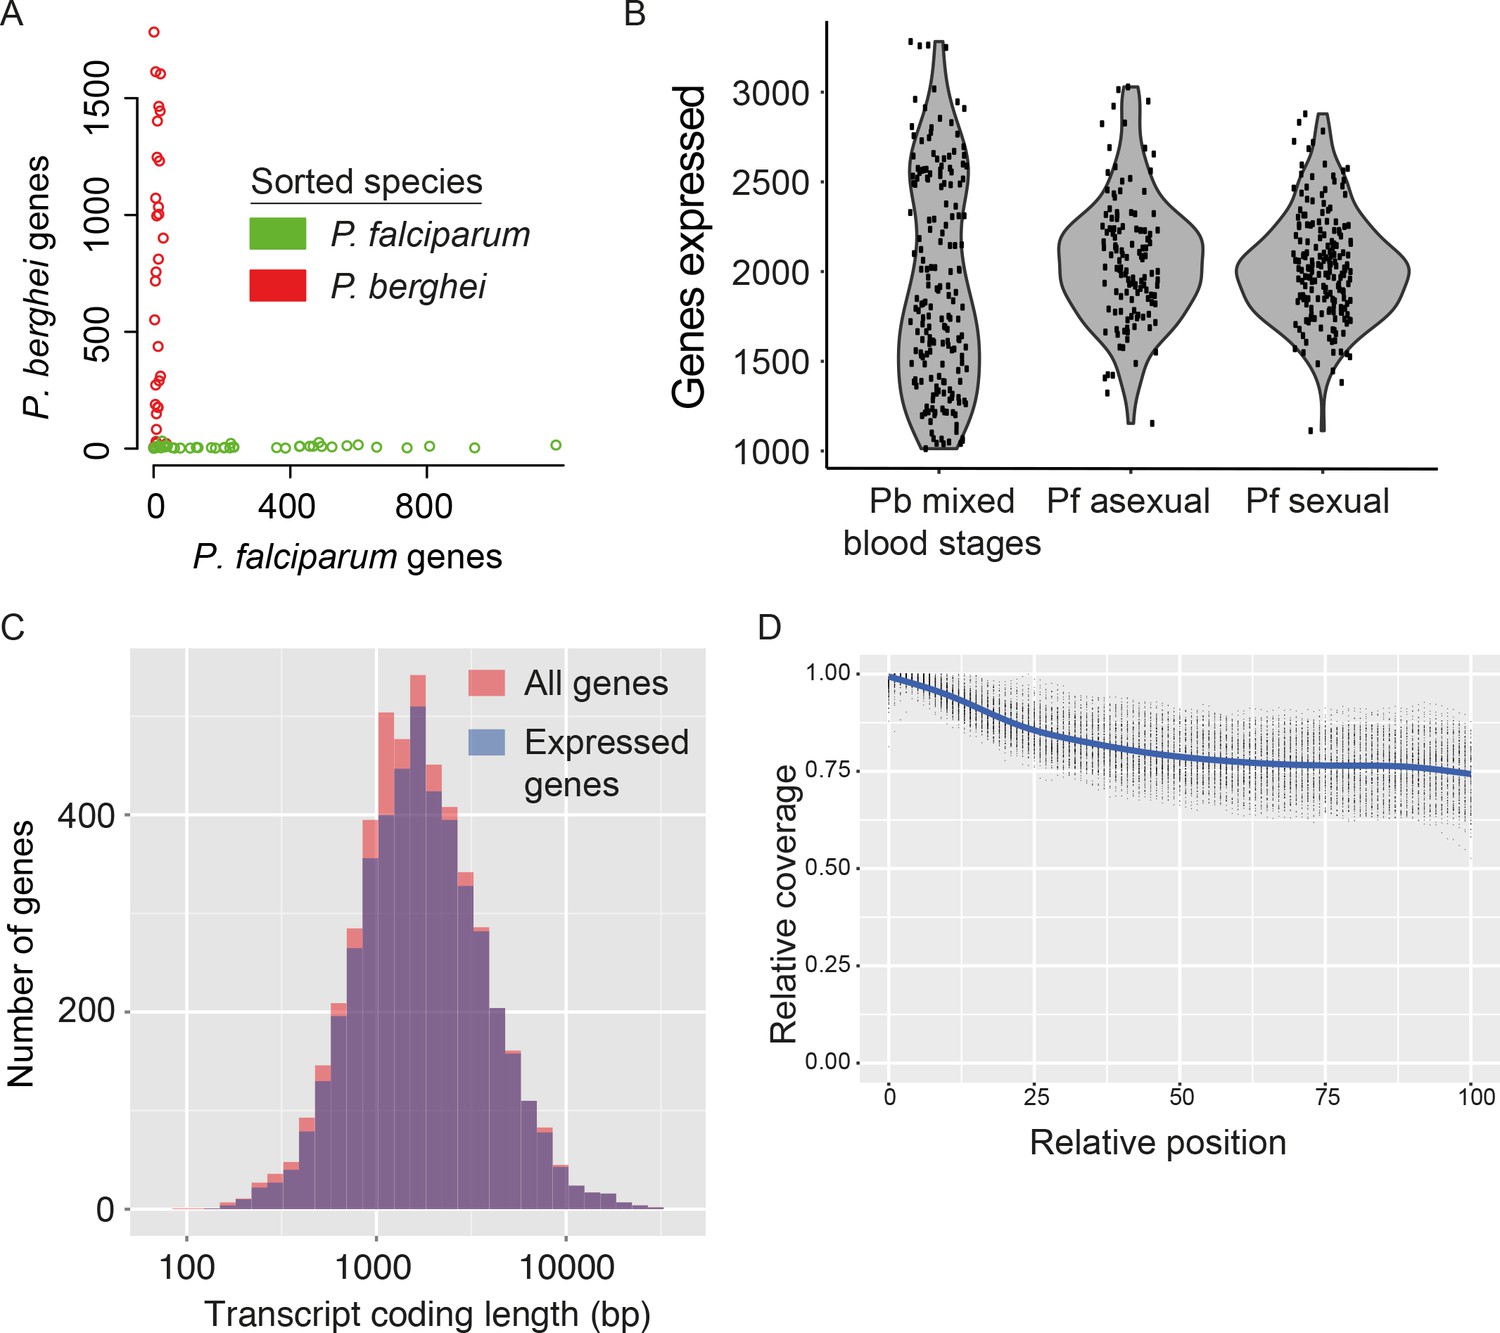
Assessment of single-cell transcriptome sequence purity, diversity and accuracy.
(A) Individually sorted P. falciparum and P. berghei cells from a mixed pool revealed no doublets and little contamination. (B) Distributions of numbers of genes identified as expressed in our three main datasets. (C) Expressed genes (those with at least 10 reads in at least five cells) were representative of average gene length, suggesting that although the reverse transcriptase might not copy the whole of long transcripts, fragments of long genes are still detected. (D) Sequencing library preparation often introduces end bias, where either the 5’ or 3’ end of transcripts tend to be better covered. Our protocol introduced a small 5’-bias, which could be attributable to the reverse transcription sometimes initiating within transcripts in internal polyA regions, rather than in the 3’ poly-A tail.
Figure 2—figure supplement 1
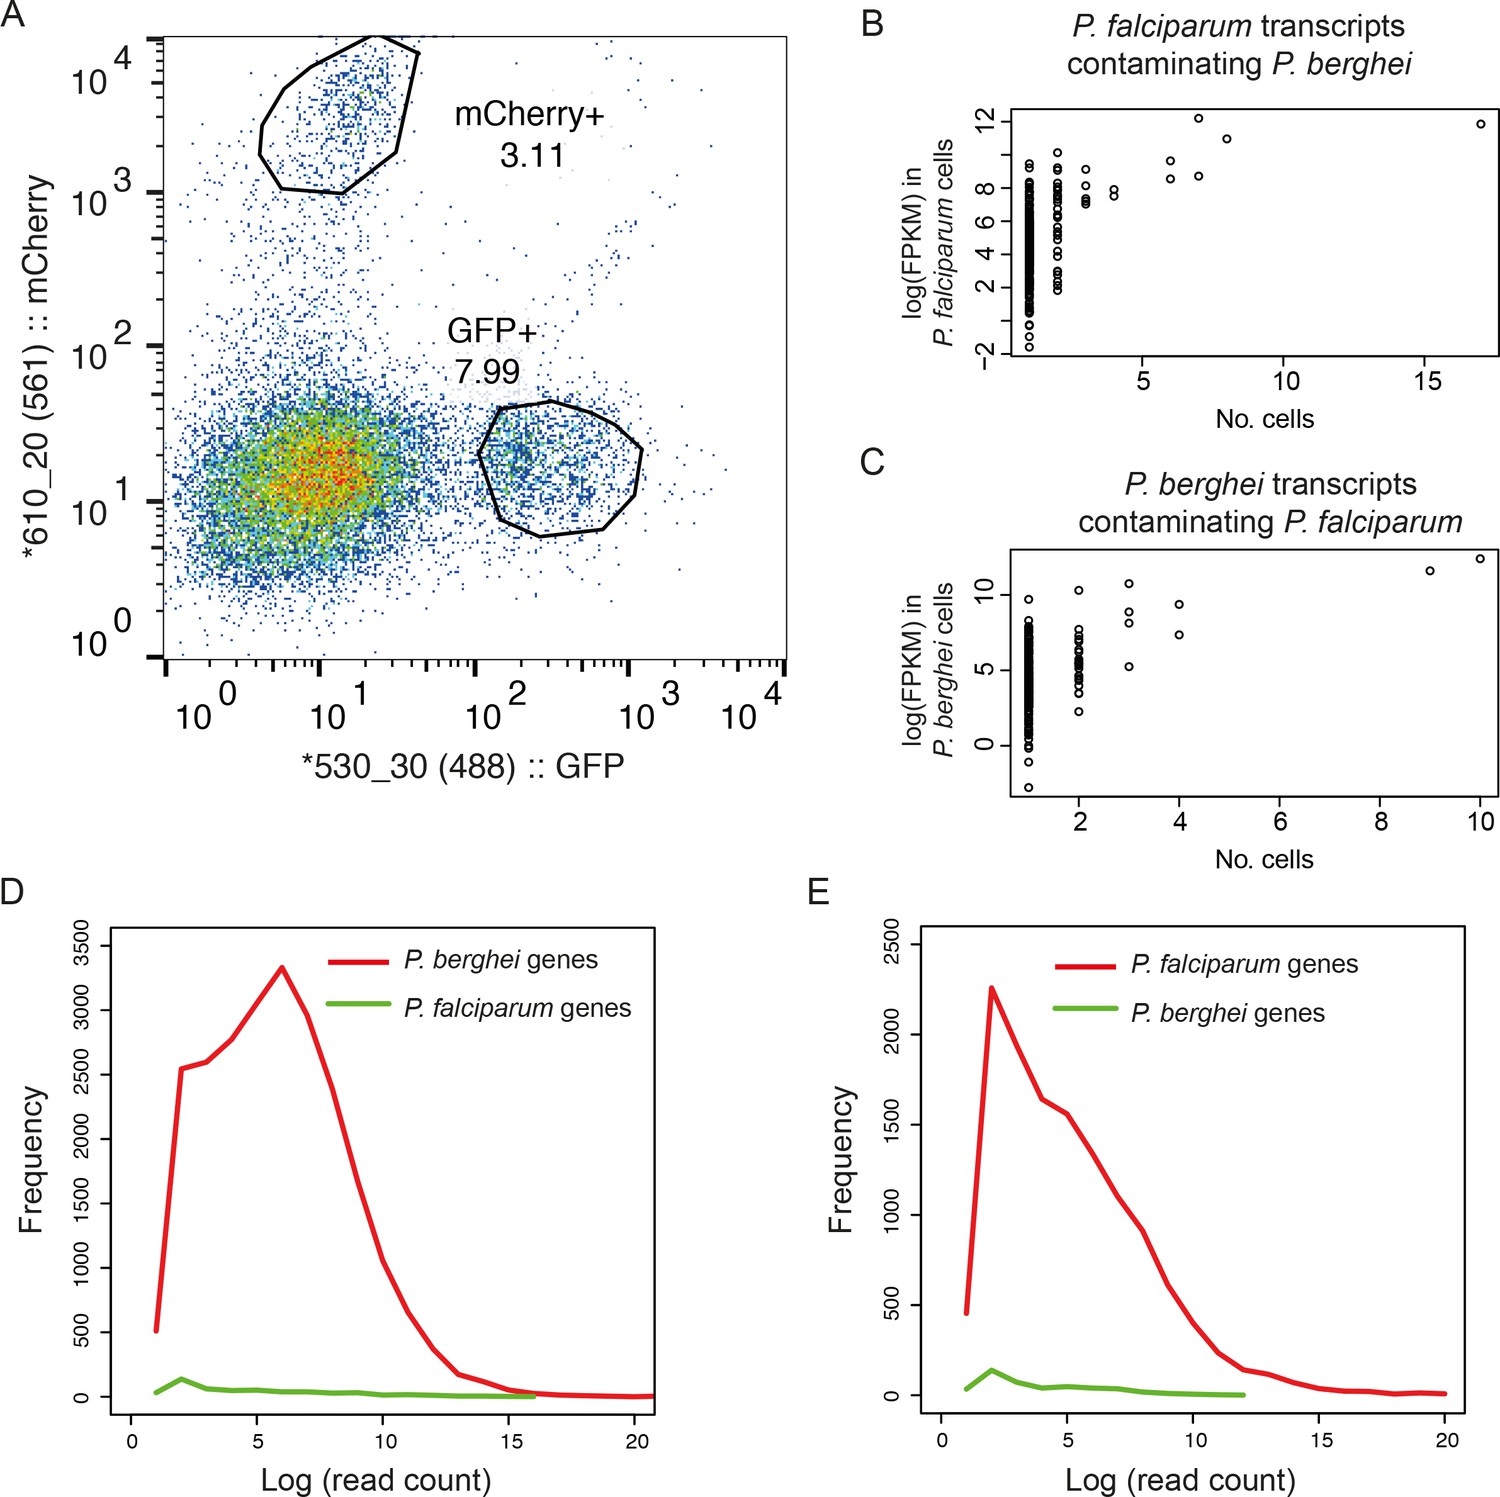
Dual sorting of P. berghei and P. falciparum cells shows that contamination from ambient RNA is low.
(A) Purified asexual late blood stage of GFP P. falciparum and mCherry P. berghei were mixed at a 1:1 ratio, inactivated in RNAlater, and sorted individually by flow cytometry, gated on respective fluorescent channels. (B) P. falciparum transcripts contaminating P. berghei cells and (C) P. berghei transcripts contaminating P. falciparum cells suggesting that contaminants reflect leakage from lysed cells (D) Histogram of the number of reads (log-transformed) from P. berghei cells that mapped to genomes of P. berghei and P. falciparum. A small proportion of detected genes were from the incorrect species and these tended to be expressed at low levels. (E) Histogram of the number of reads (log-transformed) from P. falciparum cells that mapped to P. falciparum and P. berghei.
Figure 2—figure supplement 2
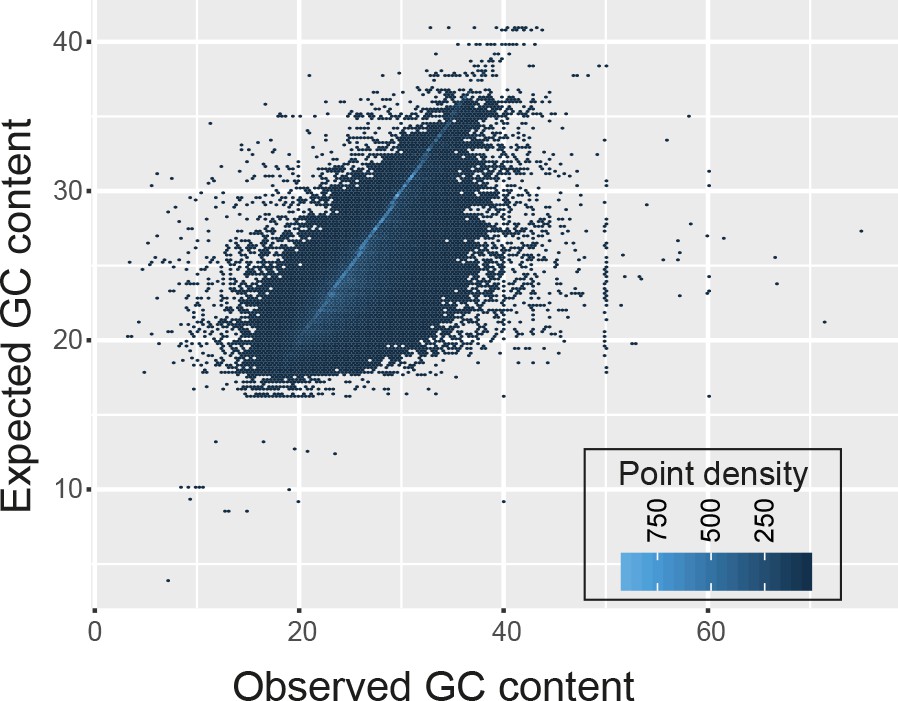
The GC content of transcript fragments agreed well with the GC content of genes.
There was no apparent over- or under-representation of GC-rich regions.
Figure 3 with 2 supplements
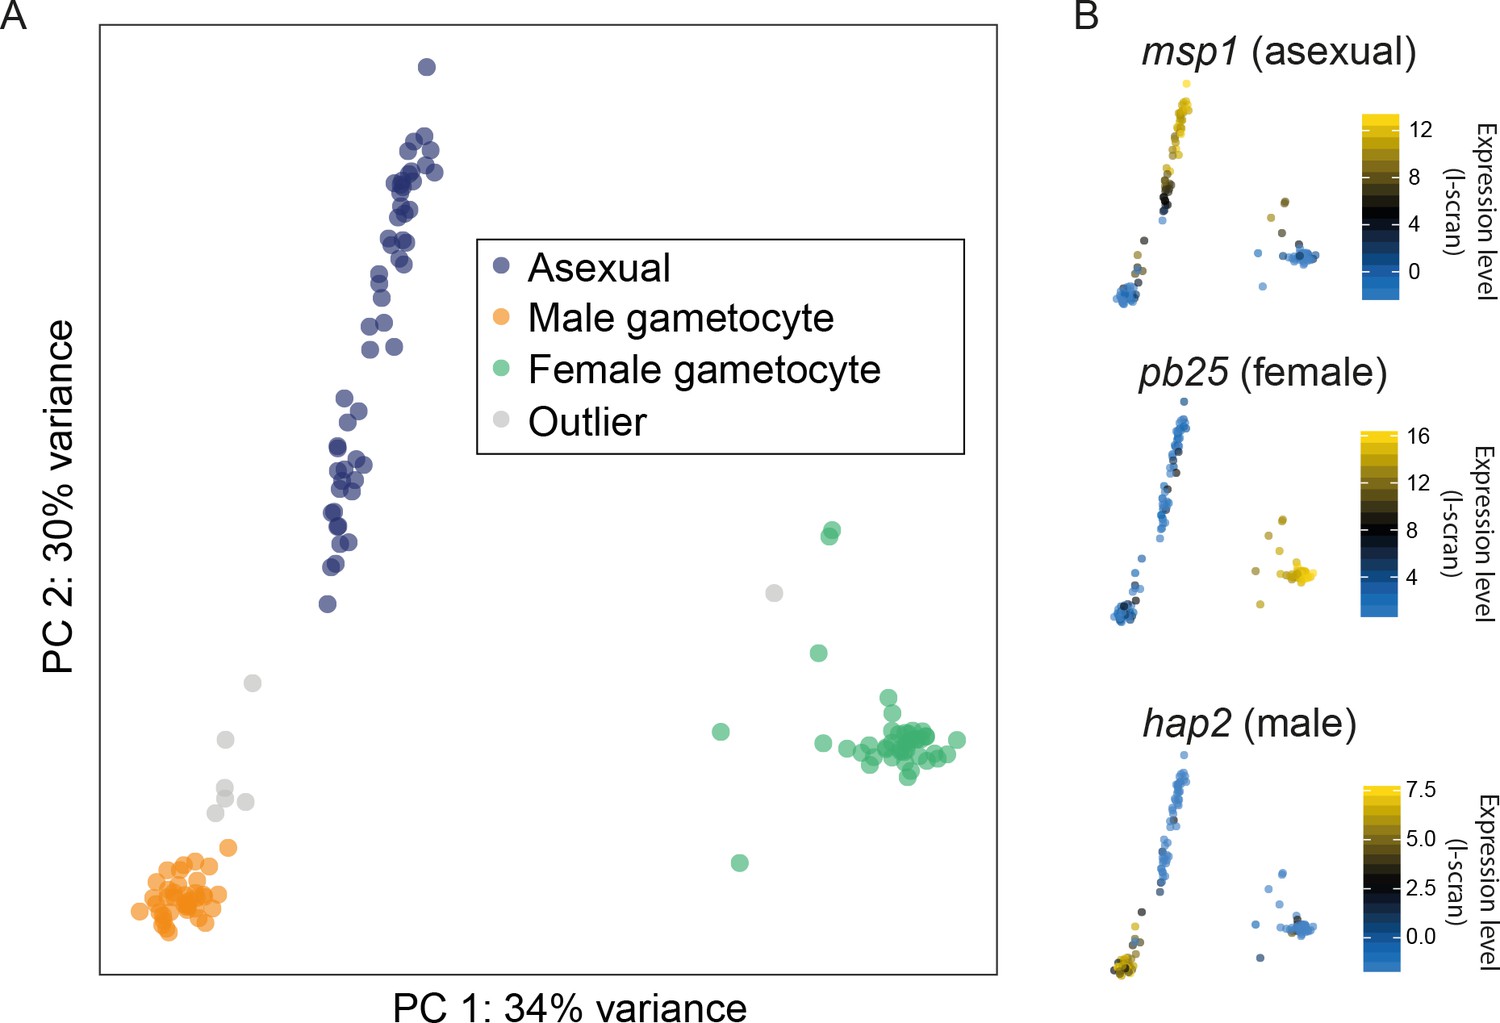
Different cell types were successfully resolved using single-cell transcriptome.
(A) A combination of Principal Components Analysis (PCA), k-means clustering and comparison to bulk RNA-seq datasets was used to classify 144 high-quality P. berghei single cells, and revealed three distinct subpopulations. Outliers may represent erythrocytes infected with both sexual and asexual stages or early stages in gametocyte development. (B) Three well-established markers of the male, female and asexual lineages (Mair et al., 2006; Liu et al., 2008; Moss et al., 2012) are concordant with our classification.
Figure 3—figure supplement 1
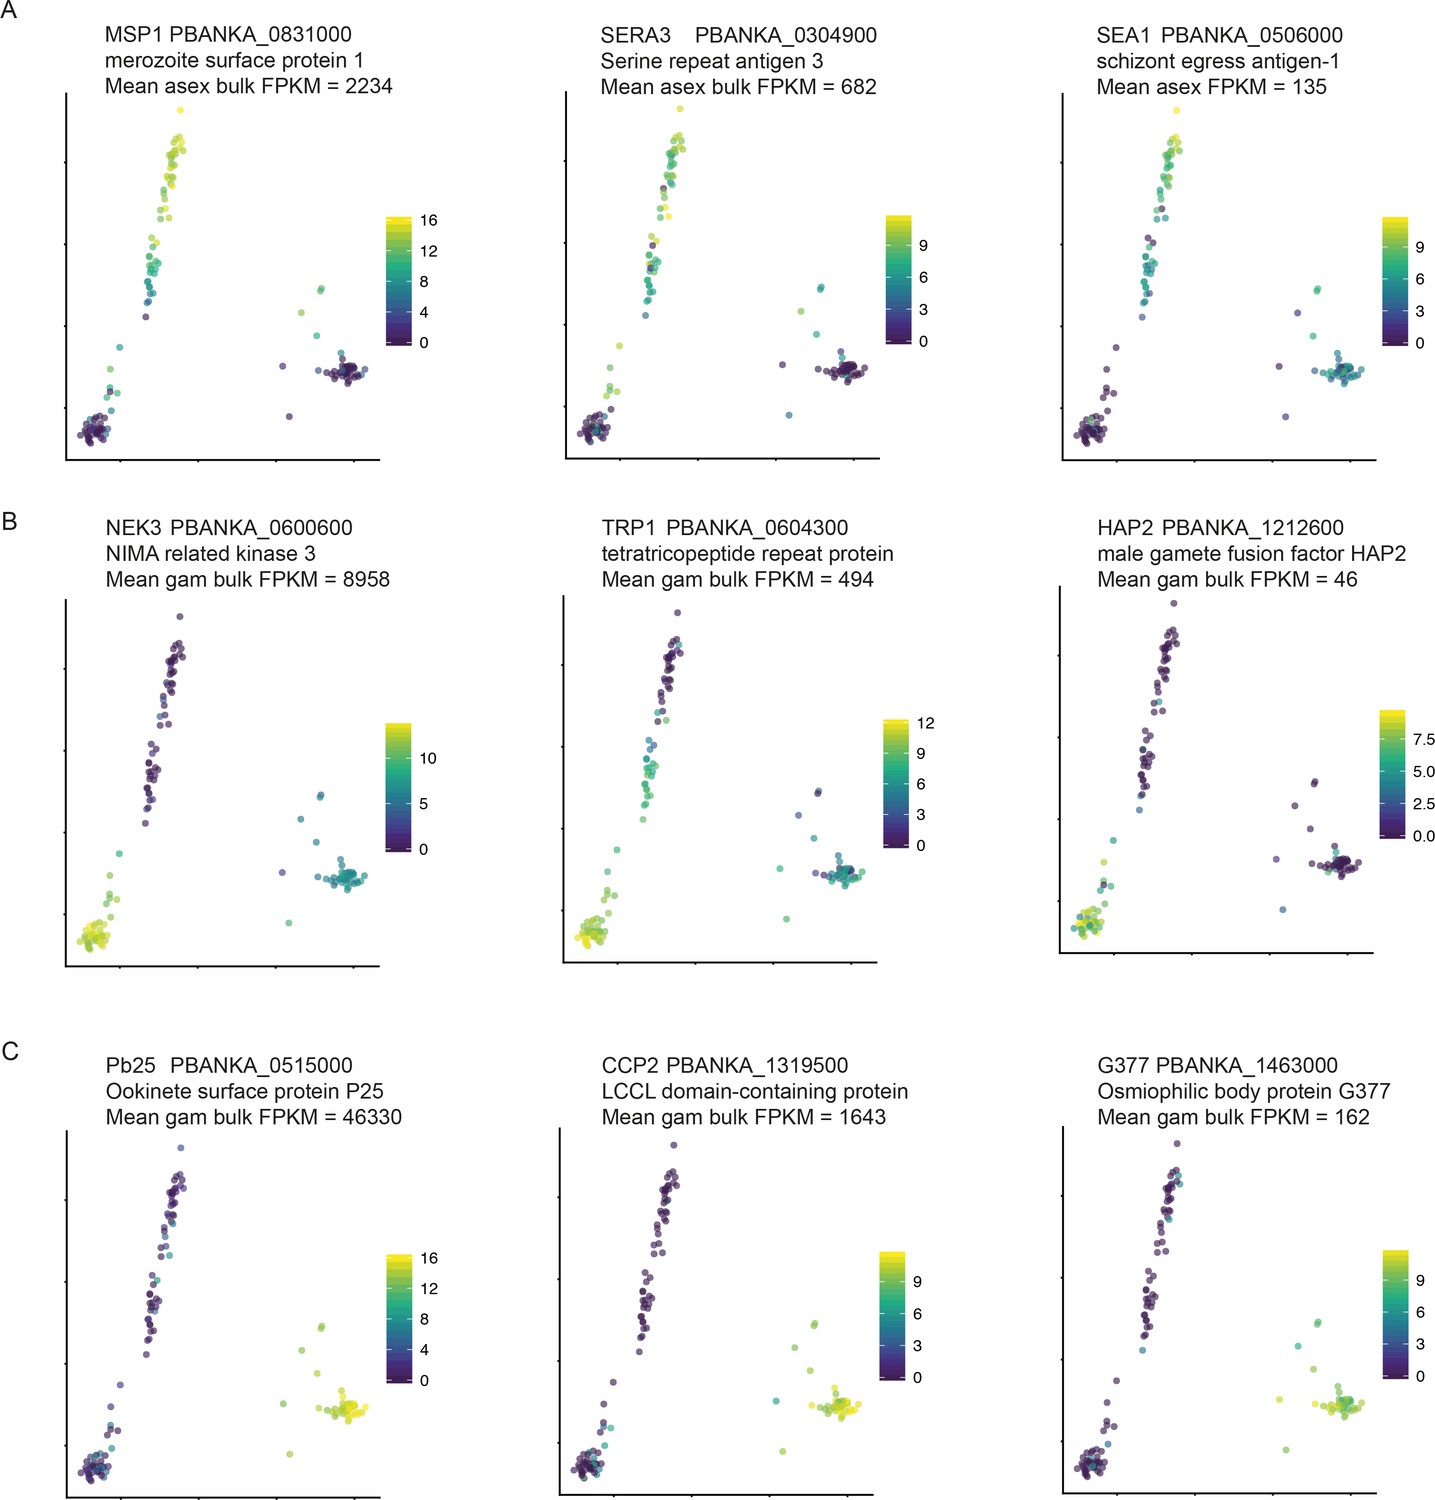
We detect stage-specific transcripts at a variety of expression levels.
Stage-specific genes at different expression levels, were identified from RNA-seq data from (Otto et al., 2014) for (A) asexual stages, (B) male gametocytes and (C) female gametocytes. Mean FPKM between replicate samples is displayed here.
Figure 3—figure supplement 2

Principal Components Analysis and classification of P. falciparum gametocyte cells.
(A) A combination of Principal Components Analysis (PCA), k-means clustering and comparison to bulk RNA-seq datasets was used to classify 191 high-quality P. falciparum gametocytes. A consensus of clustering and comparison to bulk RNA-seq allowed us to distinguish male gametocytes and female gametocytes. (B) A PCA plot showing single-cell transcriptomes of P. falciparum asexual cells annotated using bulk transcriptome datasets from Lopez et al. and Otto et al.
Figure 4 with 4 supplements
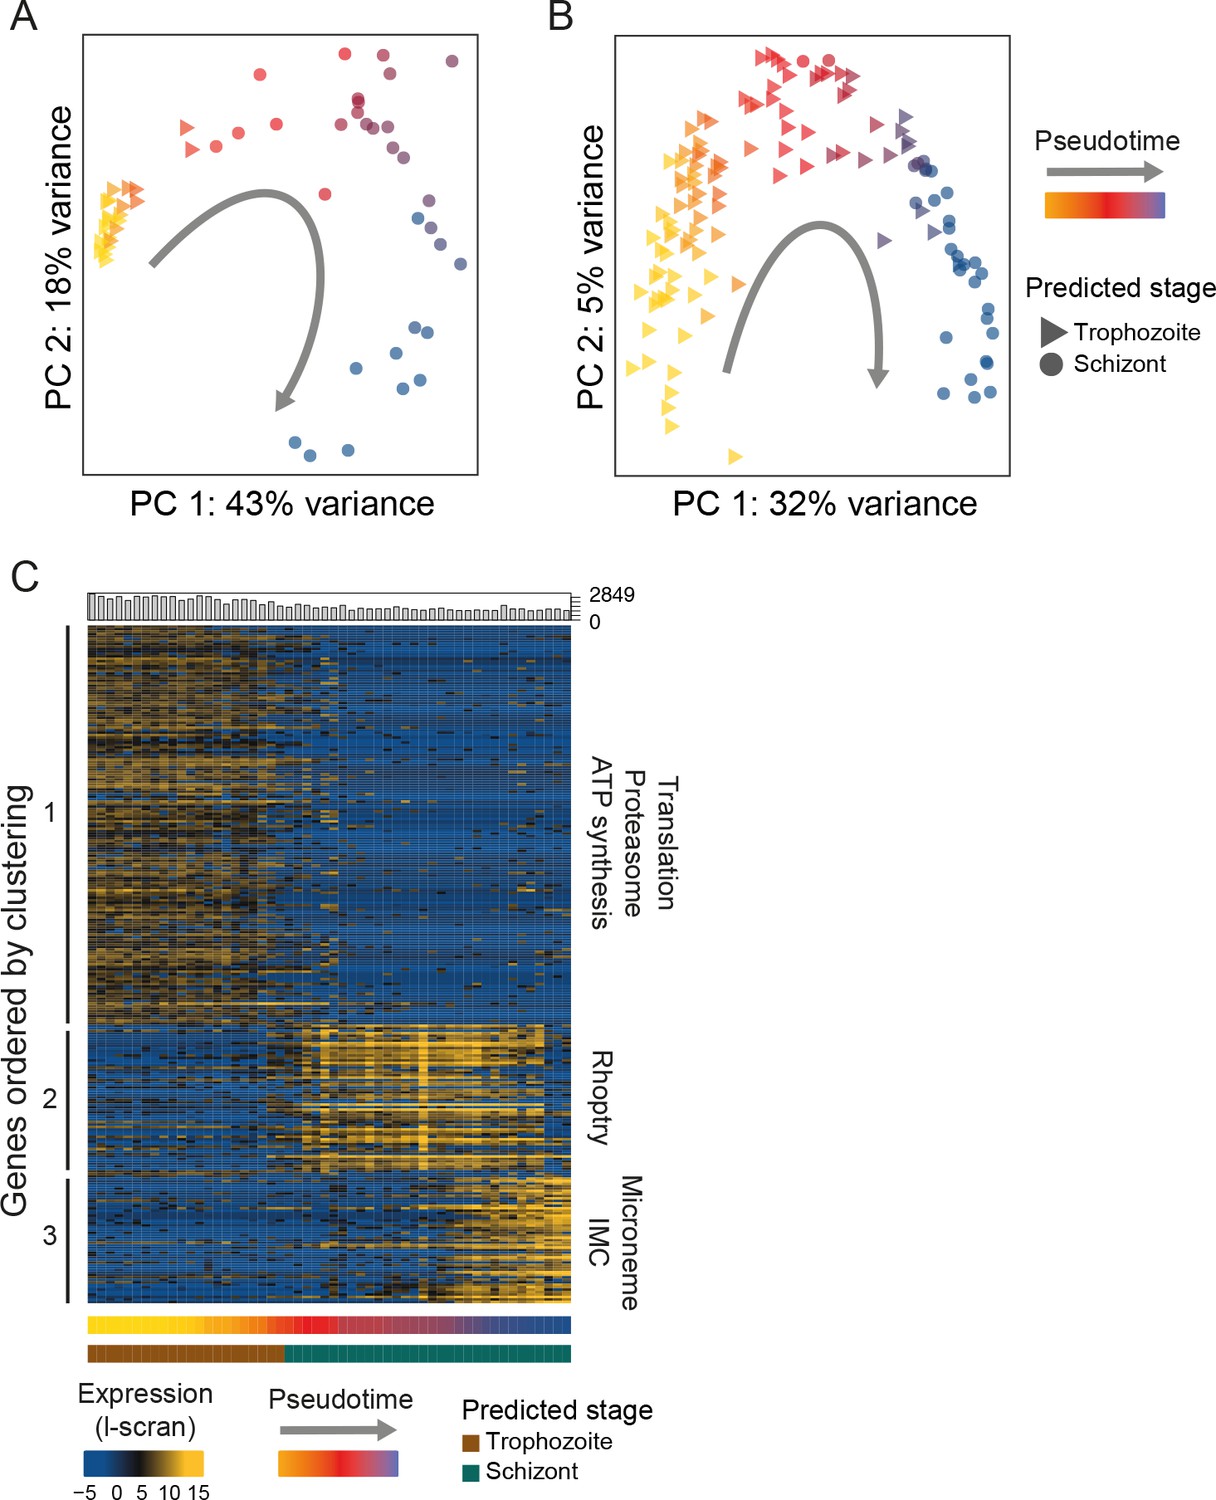
Single-cell RNA-seq reveals hidden transcriptional variation in the asexual cell cycle.
(A) Pseudotime ordering (using [Trapnell et al., 2014]) of the asexual cells in was in close agreement with bulk RNA-seq datasets (predicted stage = consensus; see Materials and methods). (B) Pseudotime ordering (using [Trapnell et al., 2014]) of the 125 P. falciparum late asexual cells was in close agreement with bulk RNA-seq datasets (predicted timepoint from [Otto et al., 2010], predicted stage = consensus; see Materials and methods). (C) Differentially expressed genes (identified using M3Drop [Andrews and Hemberg, 2016]) were clustered along pseudotime revealing groups of genes with abrupt expression profile changes during late asexual cycle. Functional enrichment in the clusters was in agreement with the expected shift from the growing trophozoite to the budding schizont (IMC = Inner Membrane Complex; micronemes and rhoptries are secretory organelles). ‘Hoo’ is the most similar timepoint in development in the Hoo et al. (2016) dataset.
Figure 4—figure supplement 1
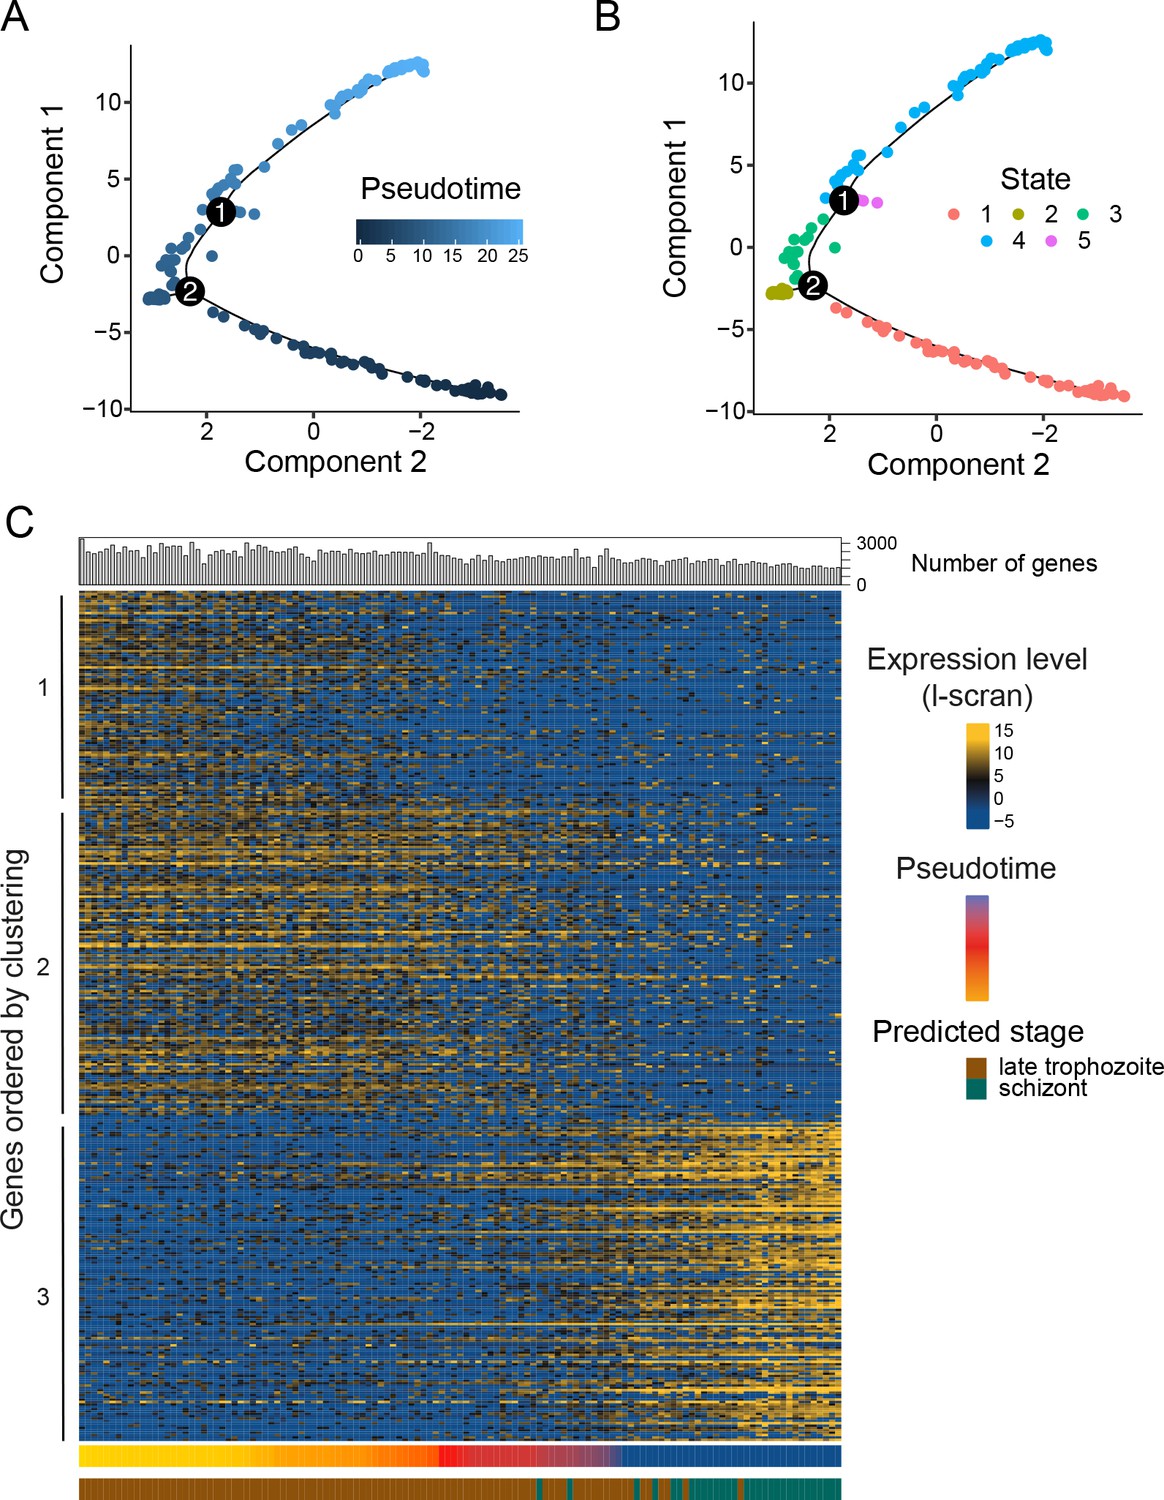
Pseudotime reconstruction of the late asexual trajectory of P. falciparum.
PCA of 155 P. falciparum cells colored by pseudotime (A) or Monocle state (B); identified trajectory branches are displayed as circled numbers 1 and 2. (C) Differentially expressed genes were plotted along pseudotime for cells in the main trajectory (States 1, 3 and 4). The number of genes per cell is displayed on top of the heat map, whilst the pseudotime and the stage prediction (Otto et al., 2010) displayed on the side of the heatmap. The transition between trophozoites and schizonts is associated with a hard transcriptional shift, as seen for P. berghei.
Figure 4—figure supplement 2

The same subsets of transcripts show different patterns of expression around the end of the asexual cell cycle in conventional bulk RNA-seq data and pseudotime reconstructions of single cell RNAseq data.
A shared set of 651 genes identified as following a sigmoidal expression pattern through the intraerythrocytic developmental cycle (see Materials and methods) are shown in both bulk transcriptome data (Hoo et al., 2016) (A) and single-cell data ordered by pseudotime (B) for P. berghei. A much more dramatic shift in gene expression is observed in the single-cell transcriptome data. A similar pattern is observed between P. falciparum bulk (Otto et al., 2010) (C) and single-cell (D) RNA-seq. In panels b and d, gene expression patterns are mean-normalised l-scran values. Only late stage parasites (grey arrows in bulk reference datasets) are expected to be present in the single-cell datasets.
Figure 4—figure supplement 3

Recently published low-coverage, high-throughput single-cell RNA-seq data supports our finding of step changes in gene expression in the P. falciparum asexual cycle.
A heatmap showing logged, mean-normalised expression values for late asexual parasites from (Poran et al., 2017) ordered by pseudotime. Genes were ordered as for Figure 4—figure supplement 2A showing that this data also exhibits a discontinuous expression pattern, unlike bulk RNA-seq data of the same part of the cycle.
Figure 4—figure supplement 4

Analysis of the co-expression pattern of the ApiAP2 family of transcription factors (TFs) in asexual parasites.
(A) Expression of Plasmodium ApiAP2 genes in asexual parasites. Orthologous genes are presented on the same rows. (B) A co-expression network for P. berghei was built using significant positive and negative correlations (p<0.05 by Pearson’s correlation) between TFs and weighted according to their correlation coefficient. Numbers on the network refers to the TFs as presented in A.
Figure 5 with 1 supplement
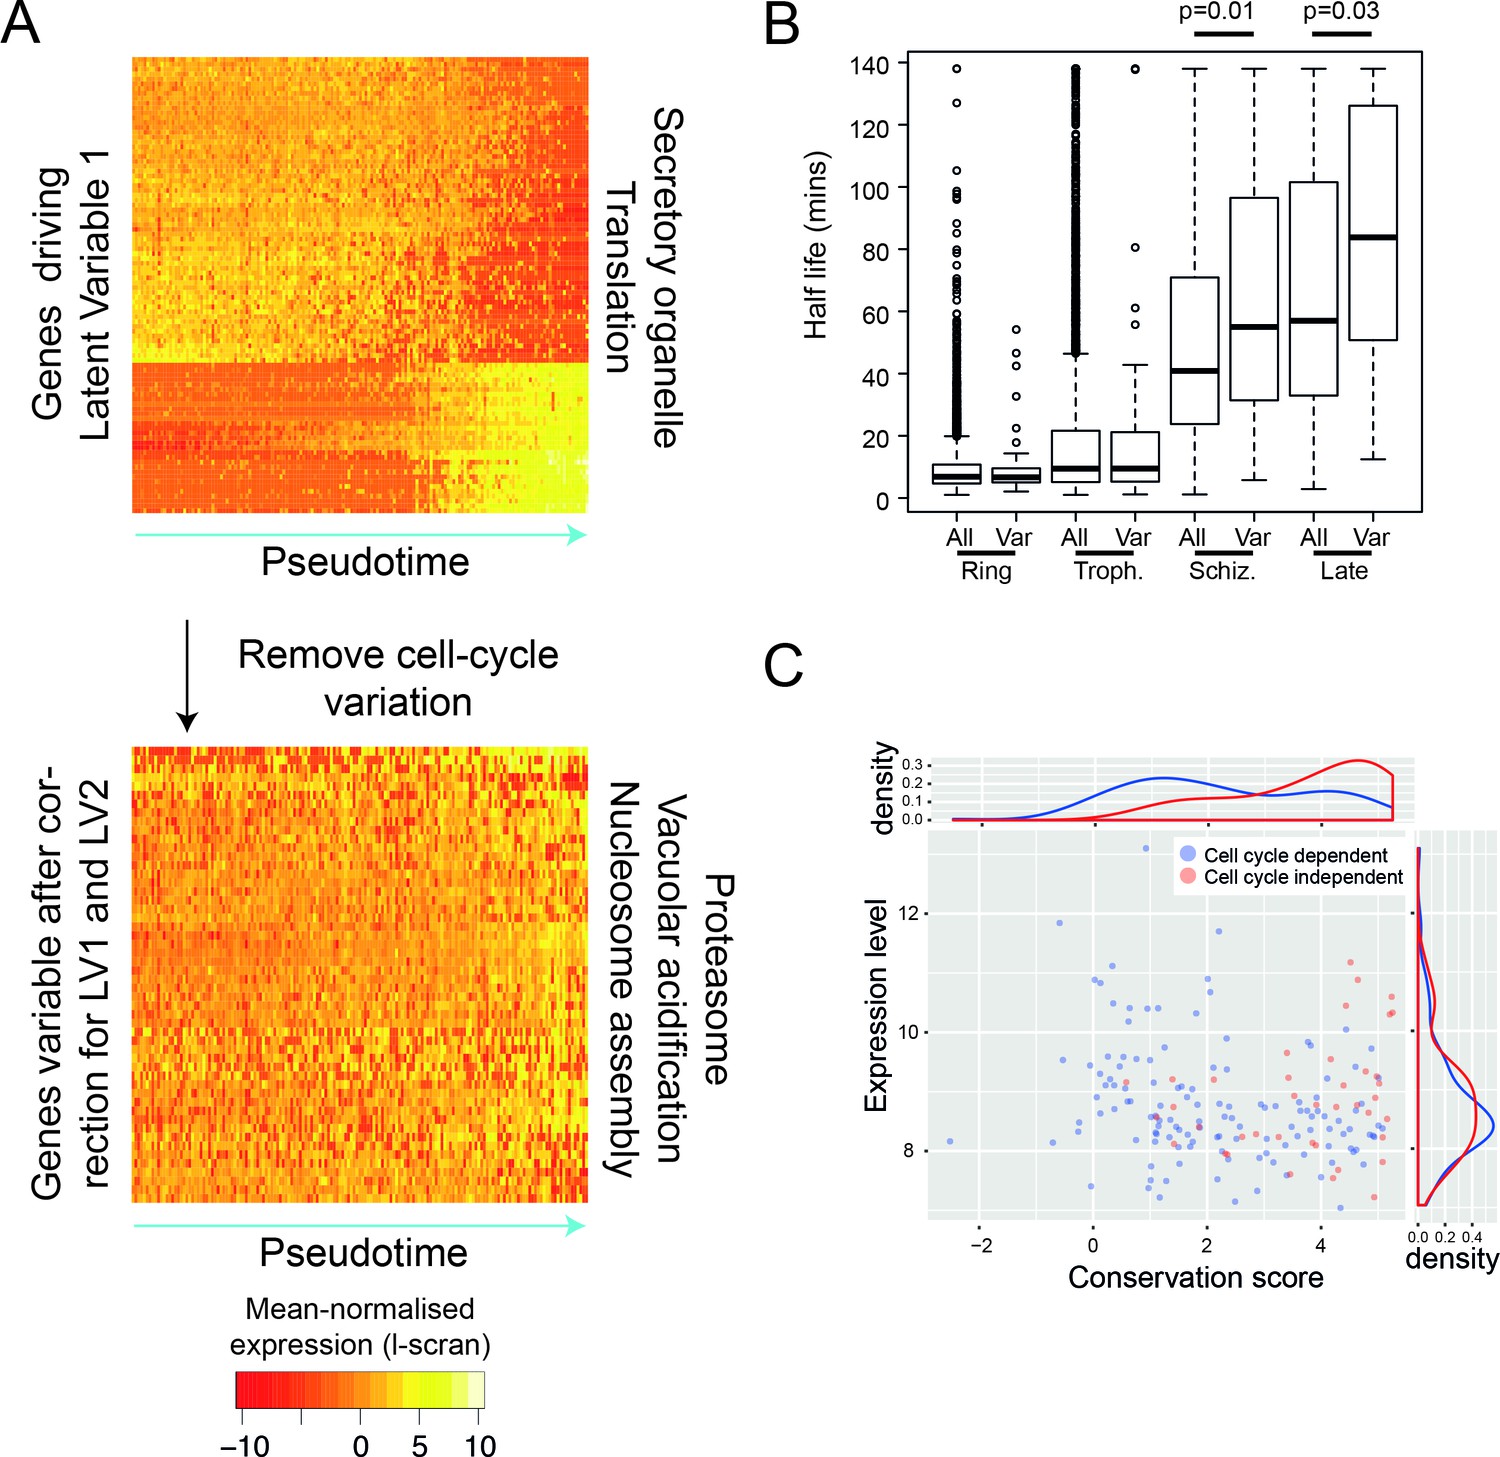
After removing the signal of cell cycle progression, we identify a new class of cell-cycle independent variable genes.
(A) P. falciparum genes with >= 50% of their variance attributed to cell-cycle associated latent variable one vary in pseudotime. After removing variation associated with the cell cycle, 56 genes with >= 50% of their variance remained. Highly enriched functional terms associated with the two sets of genes are shown. (B) Here, we show that cell-cycle independent variable transcripts have similar half lives to genes in general during the ring and trophozoite stages. However, during the schizont stage and later, they are significantly longer. The data was derived from (Shock et al., 2007). (C) A conservation score, calculated based on mean amino acid substitution between P. berghei and P. falciparum proteins, was plotted against expression level (scran-l) for each cell-cycle-dependent and each cell-cycle-independent gene in P. falciparum. Density plots show the distributions of each of these parameters, highlighting that cell-cycle-independent genes tend to have higher conservation scores, but similar expression levels.
Figure 5—figure supplement 1
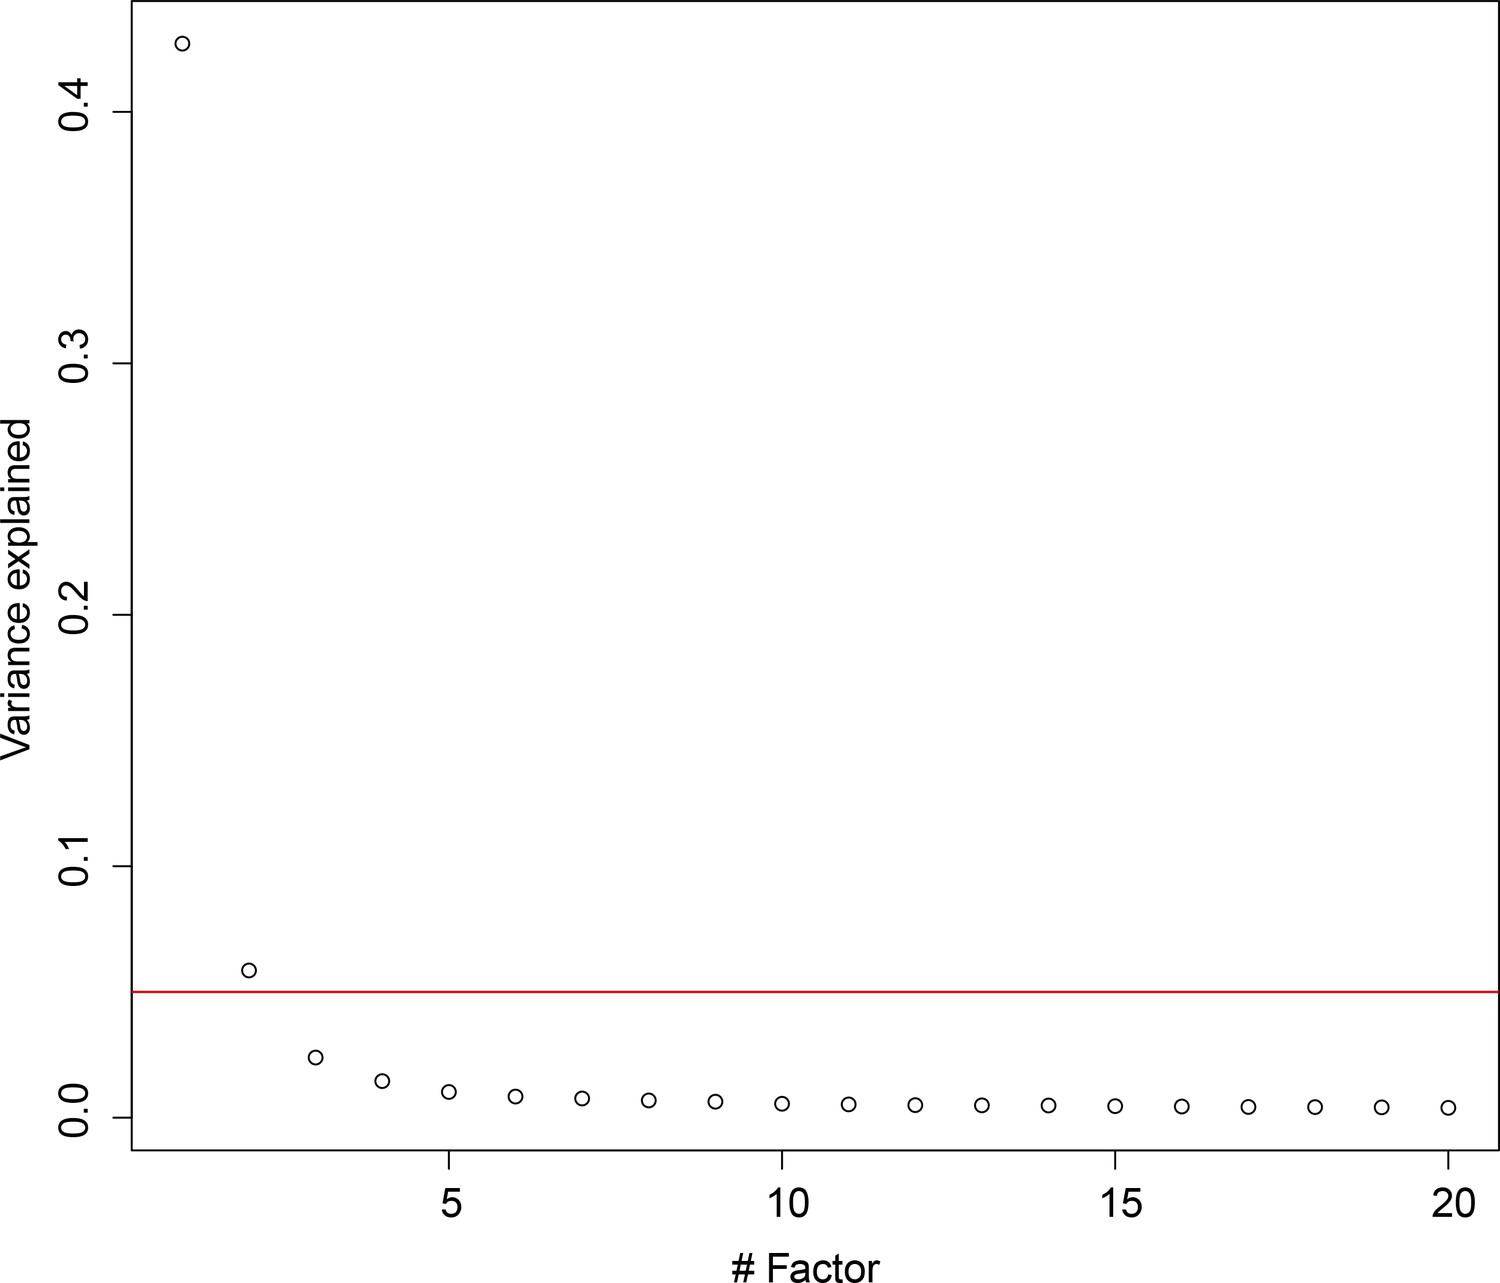
Latent factor analysis of expression variation in cell cycle genes.
We found that only the first two latent variables explained at least 5% of variation in cell cycle genes (red line).
Figure 6 with 2 supplements

Multigene families show variable expression within and between sexual stages of both P.
berghei and P. falciparum. (a) The heatmap shows gene expression levels for multigene family members differentially expressed between male and female P. berghei gametocytes. * gene variably expressed within male (orange) or female (green), Lpl = lysophospholipase, ema1 = erythrocyte membrane antigen 1, (b) Read counts for var mRNAs in P. falciparum female gametocyte single cells and female and male gametocyte populations from bulk RNA-seq data. Only reads which spanned the var introns and only genes with at least two such reads were included. There were insufficient male single cells for analysis.
Figure 6—figure supplement 1
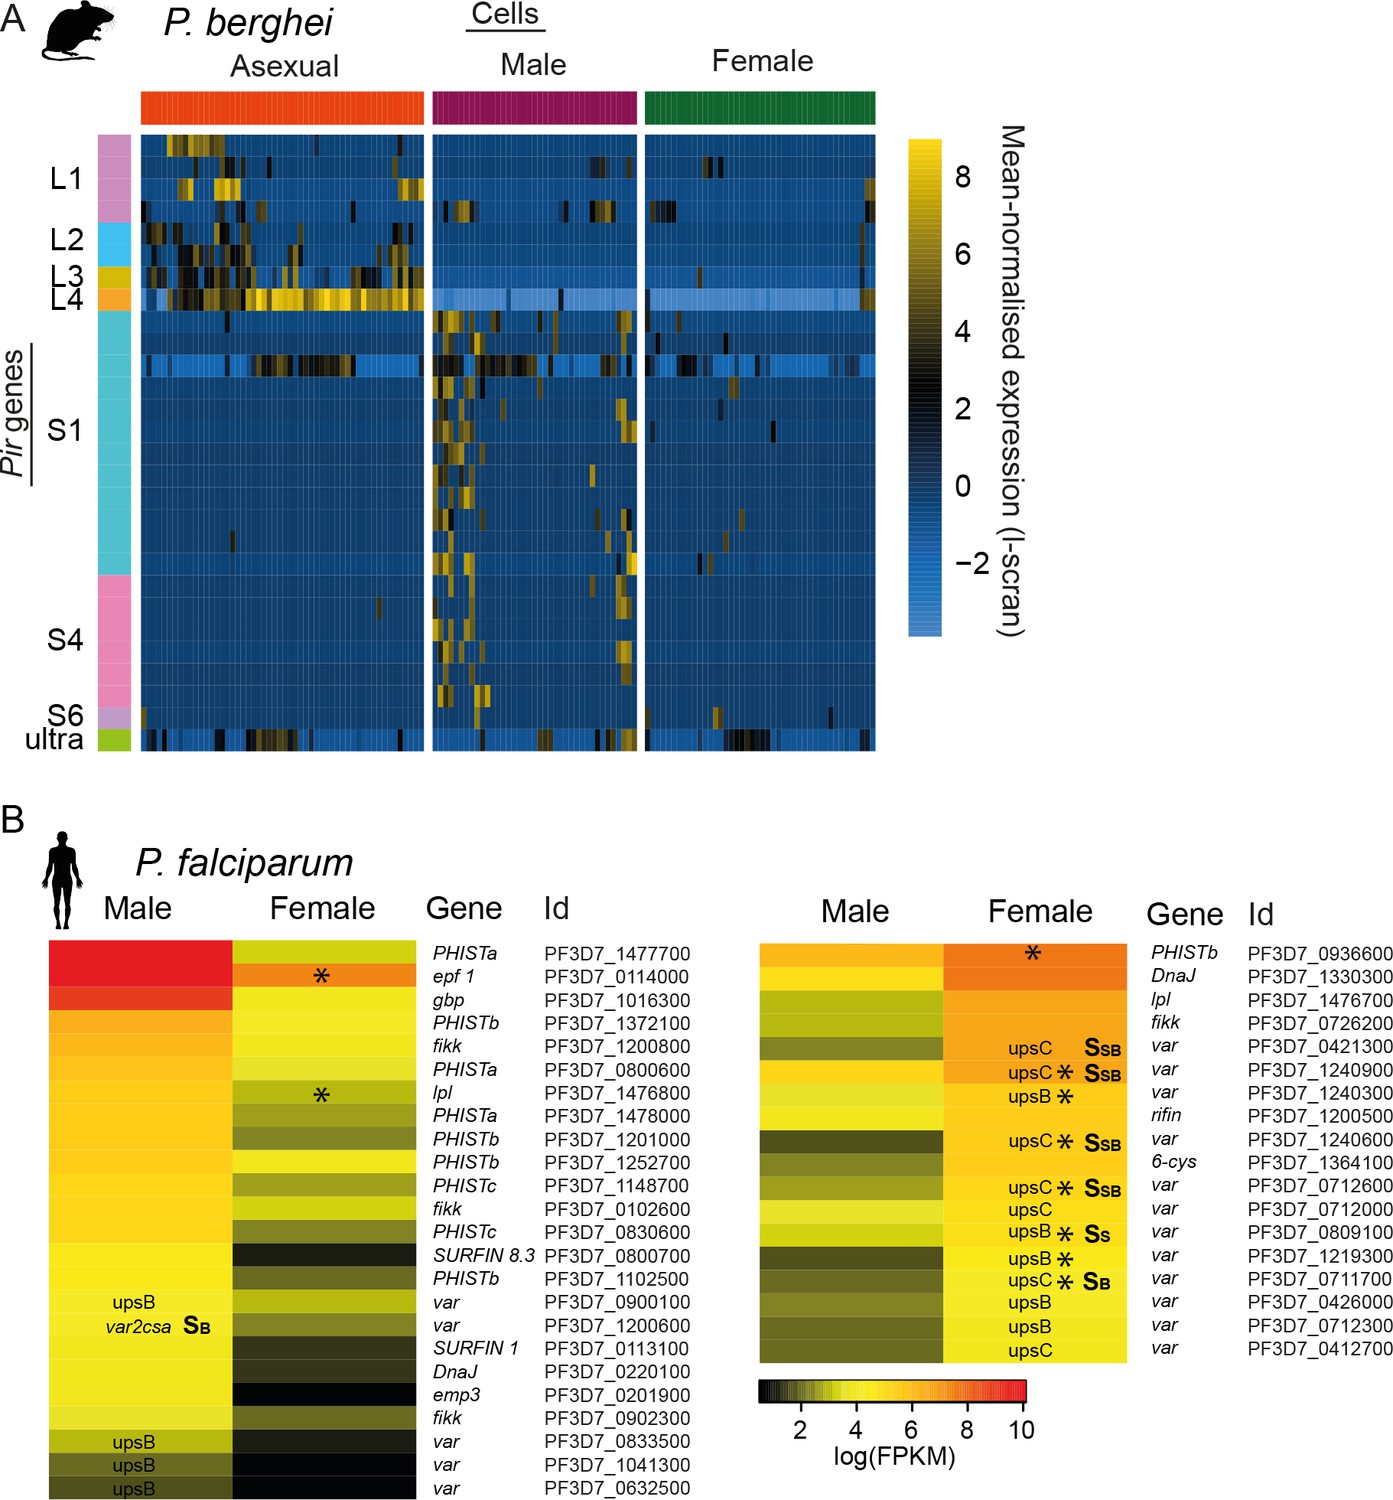
Multigene families show variable expression in sexual stages of both P.
berghei and P. falciparum, respectively. (A) Pir gene expression was highly variable across male gametocytes. In addition, more pir genes were expressed in males than females. These are distinct subfamilies of pir genes from those variably expressed in asexual stages. (B) Read counts for var mRNAs in P. falciparum female gametocyte single cells and female and male gametocyte populations from bulk RNA-seq data. Only reads which spanned the var introns and only genes with at least two such reads were included. There were insufficient male single-cells for analysis. For var genes, we highlight the type (e.g. upsB, upsC or var2csa) and whether we found evidence for expression of the mRNA, rather than reads that might represent ncRNAs known to be expressed from these genes. Epf1 = exported protein family 1, gbp = glycophorin binding protein, emp3 = erythrocyte membrane protein 3.
Figure 6—figure supplement 2
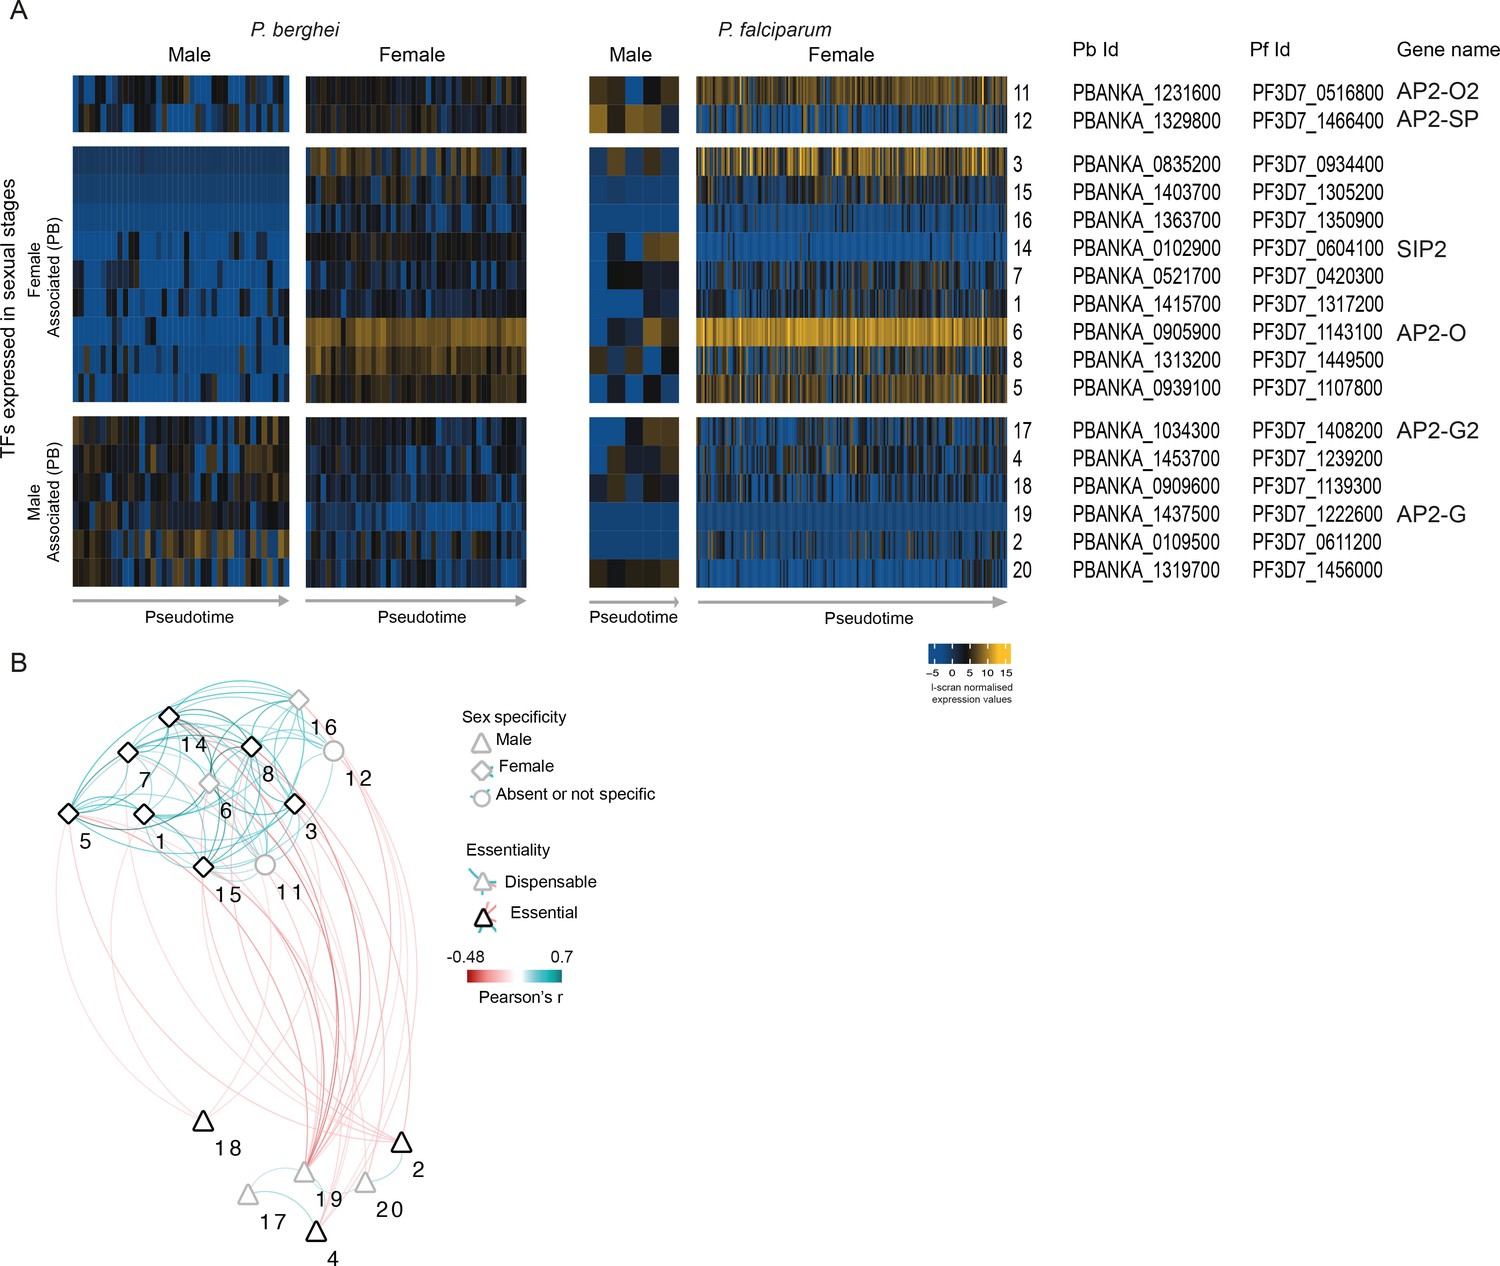
Analysis of the co-expression pattern of the ApiAP2 family of transcription factors (TFs) in sexual parasites.
(A) Expression of Plasmodium ApiAP2 genes in sexual parasites. Orthologous genes are presented on the same rows. (B) A co-expression network for P. berghei was built using significant positive and negative correlations (p<0.05 by Pearson’s correlation) between TFs and weighted according to their correlation coefficient. Numbers on the network refers to the TFs as presented in A.
Author response image 1

Many reads map uniquely to similar pir genes.
Despite being very similar in identity (88% at the nucleotide level), most reads deriving from these transcripts map uniquely. It is notable here that there appears to be variable splicing of coding regions of PBANKA_1246400. This is a novelty which we are currently following up. Genes are shown in yellow. Reads (blue and green lines) are shown mapped to the genes, Green reads represent collapsed duplicates for the purpose of easier visualisation. Grey lines are where reads are split e.g. across introns. Red marks represent mismatches between reads and the reference.
Author response image 2
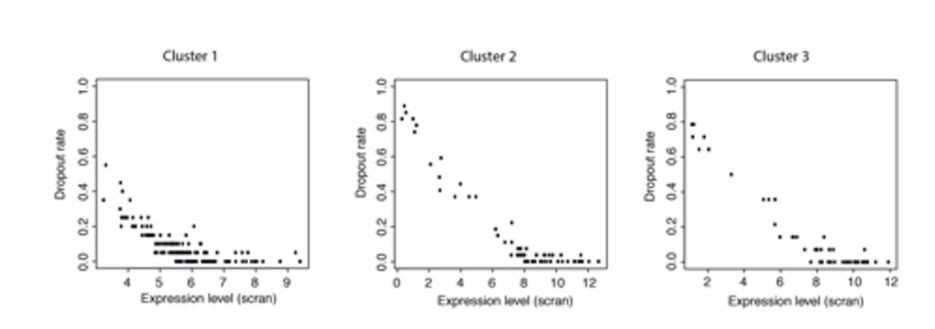
Plots of expression level against dropout rate for each cluster.
These data show that dropout rates within each cluster are generally very low and expression levels are high but cover a range of values. This makes it unlikely that all the genes in a cluster would become detectable or undetectable at the same time due to small changes in expression levels.
Tables
Table 1
Reagents permuted during optimisation of the single cell RNAseq protocol and stats of each treatment condition after sequencing.
Different combinations of the protocol were tested by sequencing. Initial trials were performed with 2 µl of lysis buffer, this was increased to 4 µl to augment capture efficiency. Permutations of the protocol that were tested were a terminal anchoring base (A,G,C; V) or not (T), two reverse transcriptase enzymes (Smartscribe (SmSc); Superscript II (SII)) and 25 or 30 cycles of preamplification. Both sexual and asexual cells of P. berghei and P. falciparum were tested. For each sequenced dataset, we calculated the mean percentages of rRNA, mRNA and other reads across the cells. For some samples we also downsampled the data to 50,000 reads per cell to allow comparison of the number of genes detected. This was done to determine differences in the complexity of each library. For the three larger datasets produced (P. falciparum gametocytes, P. berghei mixed blood stages, and P. falciparum asexual stages), we provide the numbers of pre- and post-filtered cells and median number of genes in those filtered cells.
| Conditions tested | Protocol | SSII, V30, 30 cycles | SSII, T30, 30 cycles | SmSc, T30, 30 cycles | SSII, T30, 25 cycles | SmSc, T30, 25 cycles | SmSc, T30, 25 cycles | SmSc, T30, 25 cycles | SmSc, T30, 25 cycles |
|---|---|---|---|---|---|---|---|---|---|
| Cells | Sexual | Asexual | Asexual | Asexual | Asexual | Sexual | Mixed blood | Asexual | |
| Species | Pf | Pf | Pf | Pf | Pf | Pf | Pb | Pf | |
| Lysis buffer volume | 2 µl | ✓ | |||||||
| 4 µl | ✓ | ✓ | ✓ | ✓ | ✓ | ✓ | ✓ | ||
| Oligo Dt (IDT) | Anchored 30 bp | ✓ | |||||||
| Non-Anchored 30 bp | ✓ | ✓ | ✓ | ✓ | ✓ | ✓ | ✓ | ||
| Reverse transcriptase | Superscript II (Life Technologies) 10U | ✓ | ✓ | ✓ | |||||
| Smartscribe (Clontech) 5U | ✓ | ✓ | ✓ | ✓ | ✓ | ||||
| Cycle number | 25 | ✓ | ✓ | ✓ | ✓ | ✓ | |||
| 30 | ✓ | ✓ | ✓ | ||||||
| Sequencing machine | HiSeq | ✓ | ✓ | ✓ | |||||
| MiSeq | ✓ | ✓ | ✓ | ✓ | ✓ | ||||
| Sequencing results summary | % rRNA | 5.7 | 33.5 | 36.2 | 6.4 | 18.4 | 17.8 | 16.7 | 34.8 |
| % coding genes | 4.4 | 11.3 | 39.3 | 10.5 | 33 | 51.7 | 49 | 40.5 | |
| % other | 90 | 55.2 | 24.4 | 83.1 | 48.6 | 30.5 | 34.2 | 24.6 | |
| Median genes detected for 50k reads | 25 | 84 | 145 | 174 | 181 | 502.5 | NA | NA | |
| Total cells | 5 | 6 | 6 | 6 | 6 | 237 | 182 | 174 | |
| Cells passing filters | NA | NA | NA | NA | NA | 191 | 144 | 161 | |
| Median gene count | NA | NA | NA | NA | NA | 2011 | 1922.5 | 1793 |
Additional files
-
Supplementary file 1
Marker genes identifying P. berghei mixed stage k-means clusters.
- https://doi.org/10.7554/eLife.33105.021
-
Supplementary file 2
Genes identified as variable in asexual stage parasites
(a) Clusters of P. berghei genes in pseudotime. (b) GO term enrichment for clusters of P. berghei genes in pseudotime. GO class: bp = biological process, mf = molecular function, cc = cellular component. (c) Clusters of P. falciparum genes in pseudotime. (d) GO term enrichment for clusters of P. falciparum genes in pseudotime. (e) P. falciparum genes identified as variant independently of the cell cycle. Cell cycle variance is the proportion of the variance for that gene associated with the first two latent variables and therefore the cell cycle. Technical variance is the proportion of variance for that gene attributed technical noise. Biological variance is the variance left over and attributable to cell-cycle-independent variation. (f) GO term enrichment for P. falciparum cell-cycle-independent genes. (g) P. berghei genes identified as variant independently of the cell cycle.
- https://doi.org/10.7554/eLife.33105.022
-
Supplementary file 3
Highly variable genes and enriched functions in P. berghei and P. falciparum gametocytes.
(a) Genes identified as variable in P. berghei female gametocytes. The p and q values were calculated using M3Drop. (b) GO term enrichment amongst gene from (a). (c) Genes identified as variable in P. berghei male gametocytes. (d) GO term enrichment amongst gene from (c). (e) Genes identified as variable in P. falciparum female gametocytes. (f) GO term enrichment amongst gene from (e).
- https://doi.org/10.7554/eLife.33105.023
-
Supplementary file 4
Gene expression data for multigene families.
(a) Gene expression data for pirs in P. berghei cells underlying Figure 6—figure supplement 1A. (b) Gene expression data for vars in P. falciparum cells underlying Figure 3b. (c) Multigene family members differentially expressed between P. berghei male and females gametocytes. (d) Multigene family members differentially expressed between P. falciparum male and females gametocytes, based on bulk RNA-seq data from Lasonder et al. (2016).
- https://doi.org/10.7554/eLife.33105.024
-
Supplementary file 5
Samples sequenced in this study
(a) Description of samples generated with the initial, unmodified Smart-seq2 protocol. (b) Description of samples generated with variants of the Smart-seq2 protocol, e.g. differing numbers of PCR cycles and different reverse transcriptases. (c) Samples used to assess contamination of single cells due to lysis. (d) Description of samples for P. berghei mixed blood stages. Sc3_k4 = clustering results for SC3 clustering of all cells with k = 4, sc3_k3 = SC3 clustering of all cells with k = 3, sc3_sex_k3 = SC3 clustering of only male and female gametocytes with k = 3 (used to identify outliers). Hoo is the best correlated timepoint from the Hoo et al. (2016) microarray data for each cell. Otto is the best correlated timepoint from the Otto et al RNA-seq data (Otto et al., 2014) for each cell. Consensus is our consensus call between the clustering and the correlations against these bulk datasets. Pass_filter is TRUE if that cell passed our filtering criteria. (e) Description of samples for P. falciparum asexual parasites. Lopez is the best correlated timepoint from the López-Barragán et al. (2011) bulk RNA-seq data. Otto is the best correlated timepoint from the Otto et al. (2010) bulk RNA-seq data. Pseudotime state is the path within pseudotime identified by Monocle. This was used to filter out minor paths. Pass_filter is TRUE if that cell passed our filtering criteria. (f) Description of samples for P. falciparum gametocytes. Lasonder is the best correlated samples from Lasonder et al. (2016) bulk RNA-seq data.
- https://doi.org/10.7554/eLife.33105.025
-
Supplementary file 6
Gene count tables for the three large datasets included in the study.
(a) Read counts for P. berghei mixed blood stages. (b) Read counts for P. falciparum asexual parasites. (c) Read counts for P. falciparum gametocytes
- https://doi.org/10.7554/eLife.33105.026
-
Transparent reporting form
- https://doi.org/10.7554/eLife.33105.027
Download links
A two-part list of links to download the article, or parts of the article, in various formats.
Downloads (link to download the article as PDF)
Open citations (links to open the citations from this article in various online reference manager services)
Cite this article (links to download the citations from this article in formats compatible with various reference manager tools)
Single-cell RNA-seq reveals hidden transcriptional variation in malaria parasites
eLife 7:e33105.
https://doi.org/10.7554/eLife.33105


