Ventral pallidal encoding of reward-seeking behavior depends on the underlying associative structure
- Krieger School of Arts and Sciences, Johns Hopkins University, United States
- Johns Hopkins School of Medicine, Johns Hopkins University, United States
- Johns Hopkins University, United States
Figures
Figure 1 with 1 supplement
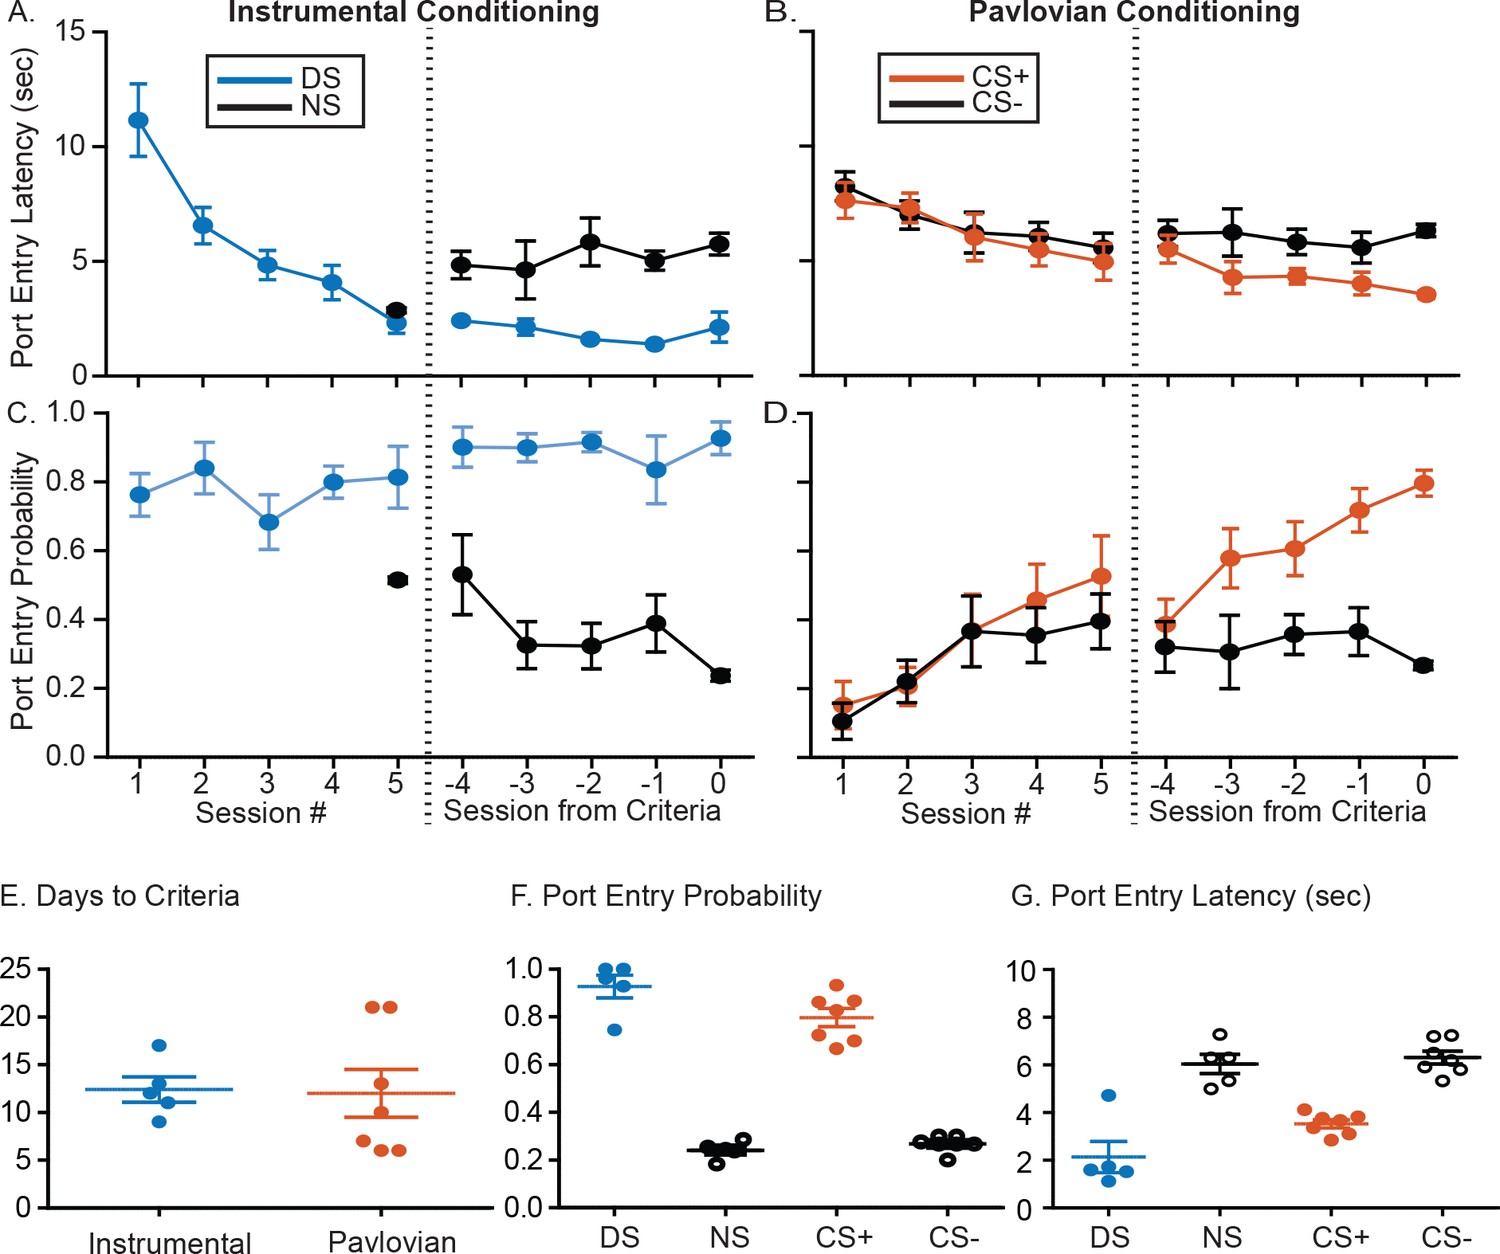
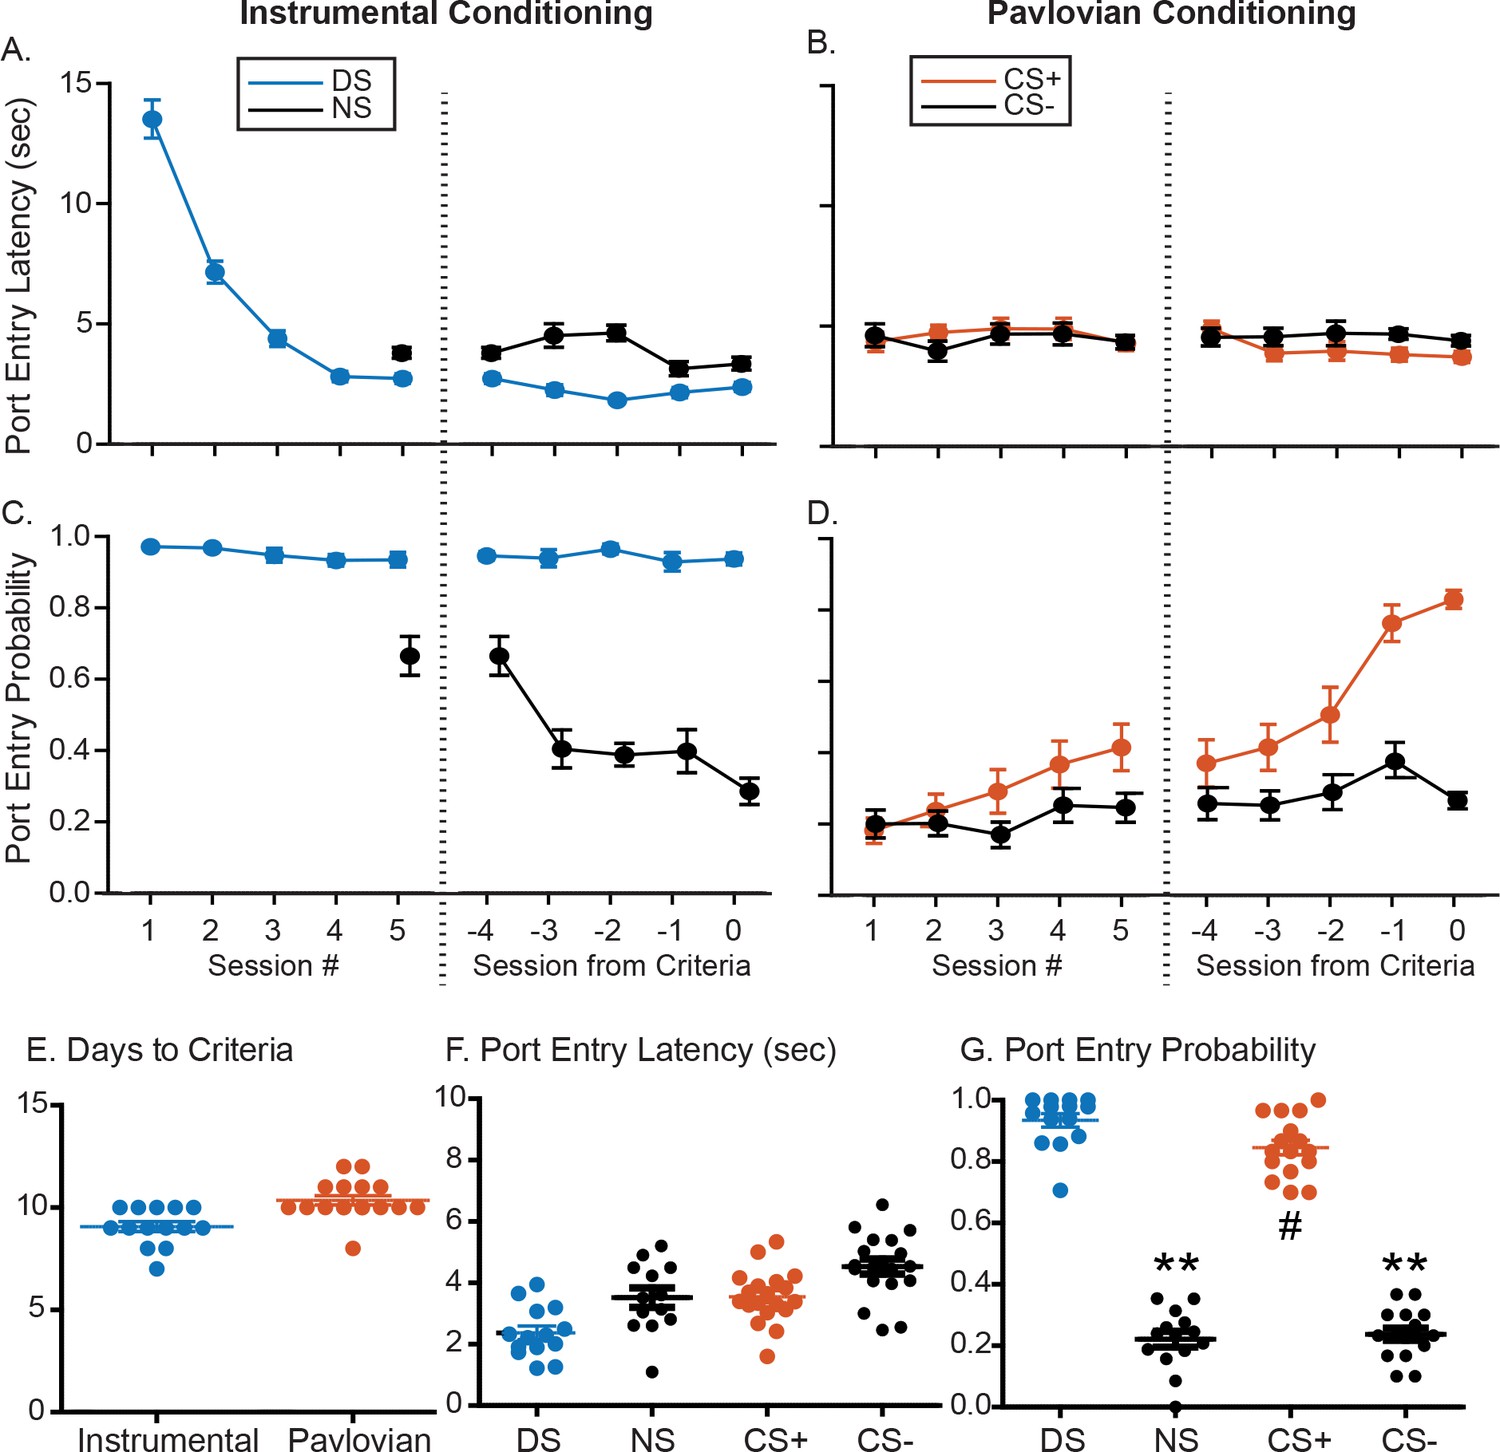
Summary of training behavior in the instrumental and Pavlovian tasks.
Mean (± SEM) latency to enter the port during the instrumental DS (A, blue) or the Pavlovian CS+ (B, orange), and during the control cues (NS or CS-, black) during the initial 5 days of training and the last 5 days of training prior to meeting response criteria for electrode implantation. Mean (± SEM) probability of port entry during the instrumental DS (A, blue) or the Pavlovian CS+ (B, orange), and during the control cues (NS or CS-, black) during the initial 5 days of training and the last 5 days of training prior to meeting response criteria. Individual data points, and mean ± SEM for (E) days to reach response criteria, (F) final port entry probability, and (G) final port entry latency (sec) prior to electrode array implantation.
Figure 1—figure supplement 1
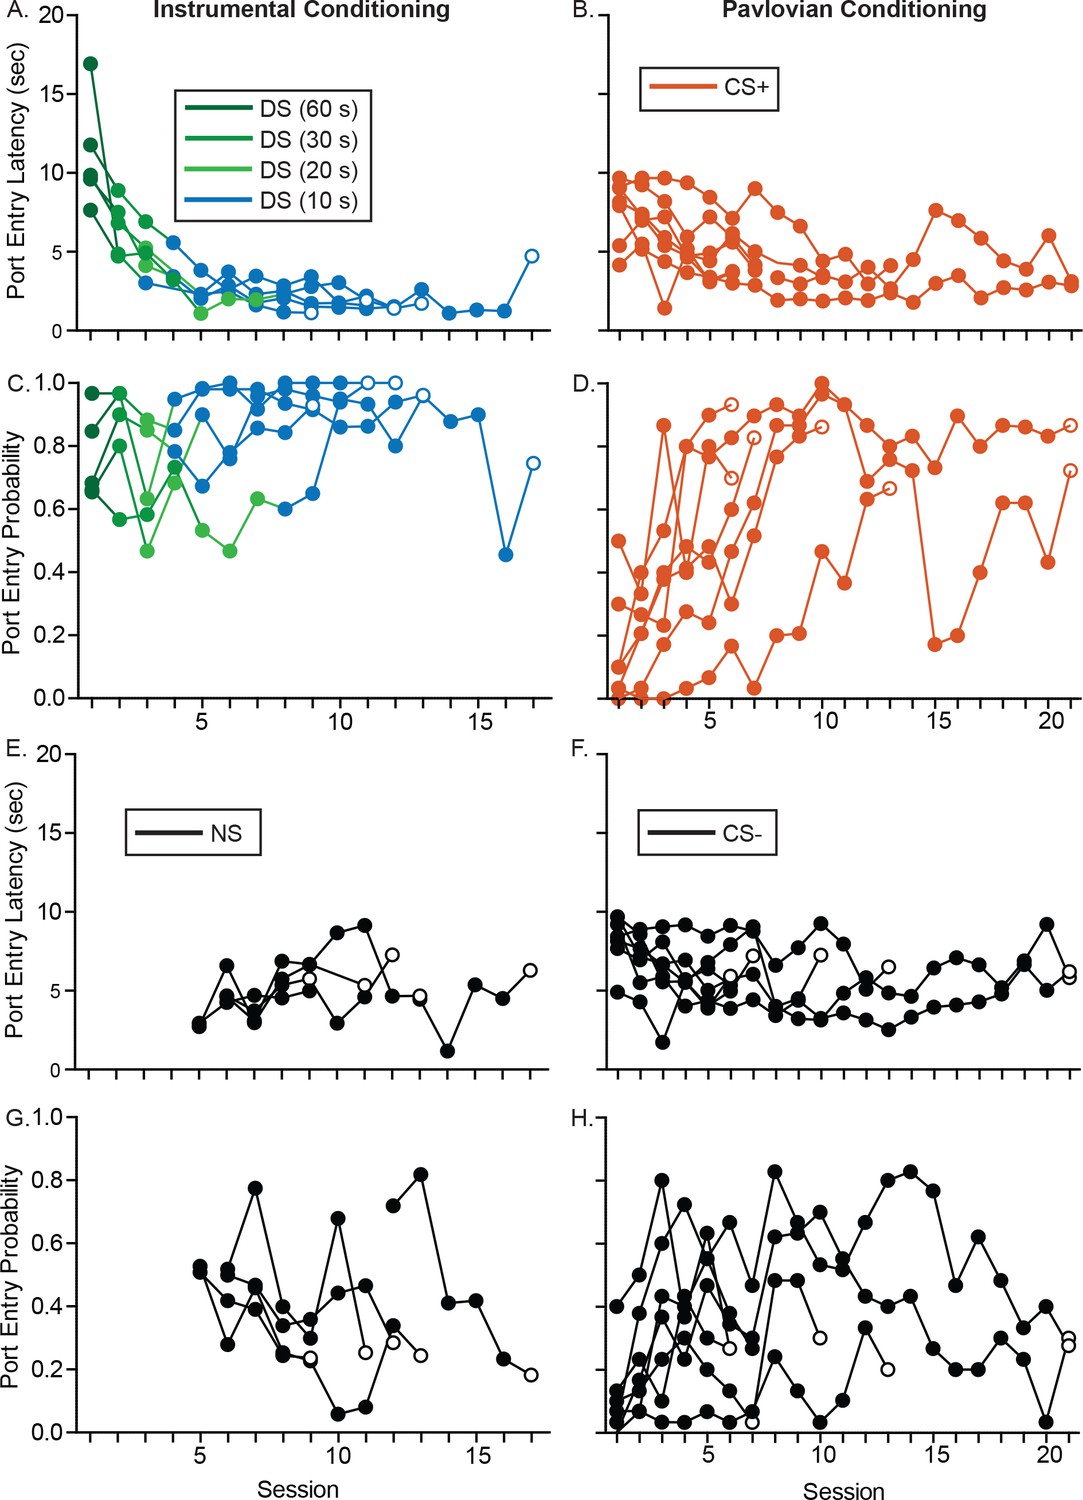
Training performance from individual rats prior to electrode implantation.
(A) Port entry latency of individual rats as they progressed through training in the instrumental DS task from a 60 s DS to a 10 s DS. (B) Port entry latency of individual rats across Pavlovian conditioning sessions. (C) Port entry probability of individual rats as they progressed through training in the instrumental DS task from a 60 s DS to a 10 s DS. (D) Port entry probability of individual rats across Pavlovian conditioning sessions. (E) Port entry latency of individual rats during the NS control cue across training sessions; the NS was introduced once rats responded to at least 60% of presentations of the 10 s DS. (F) Port entry latency of individual rats during the CS– control cue. (G) Port entry probability of individual rats during the NS control cue across training sessions. (H) Port entry latency of individual rats during the CS– control cue.
Figure 2 with 1 supplement
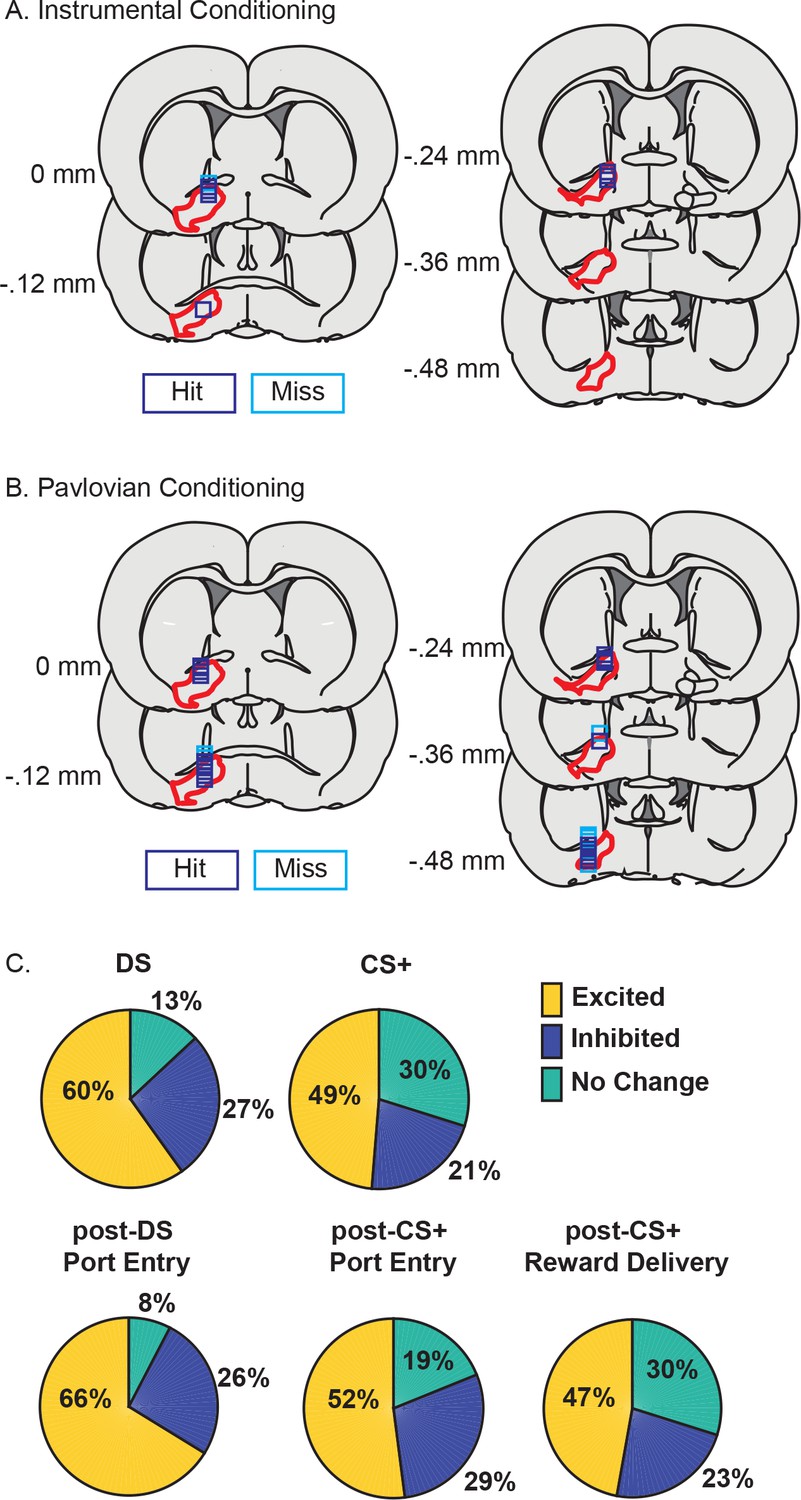
VP neurons respond to cues and reward seeking in both tasks.
(A) Histological reconstruction of electrode array placements in the instrumental task, shown on coronal slices, marked relative to bregma (mm), with the boundaries of VP demarcated in red. Purple squares mark array locations contained within VP, and blue squares mark array locations that were not contained within VP. (B) Electrode array placements in the Pavlovian task. (C) Pie charts showing the proportion of neurons (labels indicated percentage of units) for which we detected an increase (yellow) or decrease (dark blue) in firing following the DS, CS+, post-DS port entry, post-CS+ port entry or post-CS+ reward delivery response windows.
Figure 2—figure supplement 1
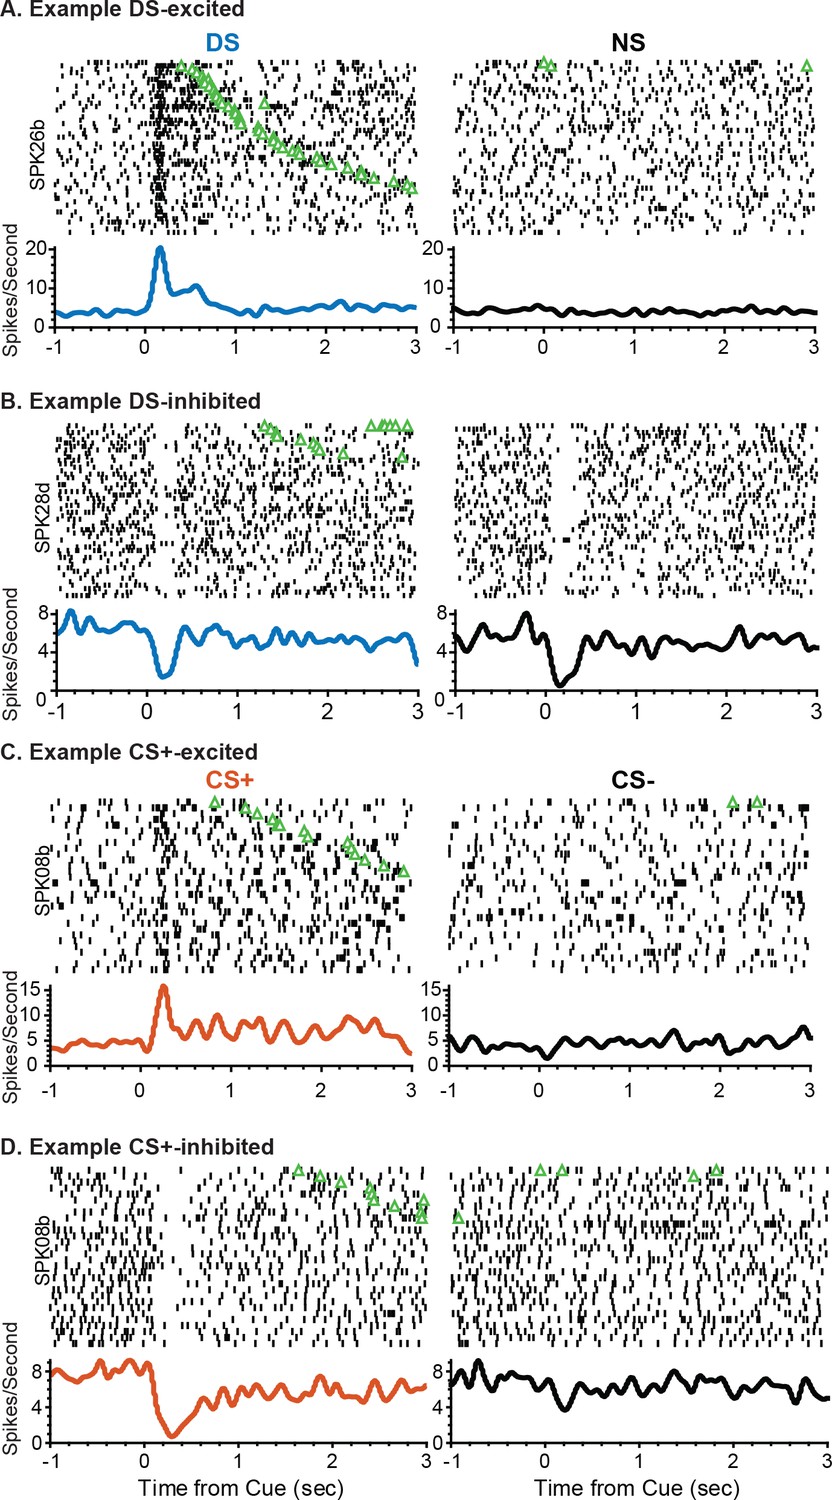
Example VP cue responses after instrumental and Pavlovian training.
(A) Example rasters and corresponding histograms from a DS excited unit aligned to either DS onset (left) or NS onset. (B) Example rasters and corresponding histograms from a DS– inhibited unit aligned to either DS onset (left) or NS onset. (C) Example rasters and corresponding histograms from a CS+ excited unit aligned to either CS+ onset (left) or CS– onset. (D) Example rasters and corresponding histograms from a CS+ inhibited unit. Individual trials in all rasters are sorted by port entry (green triangle) latency.
Figure 3
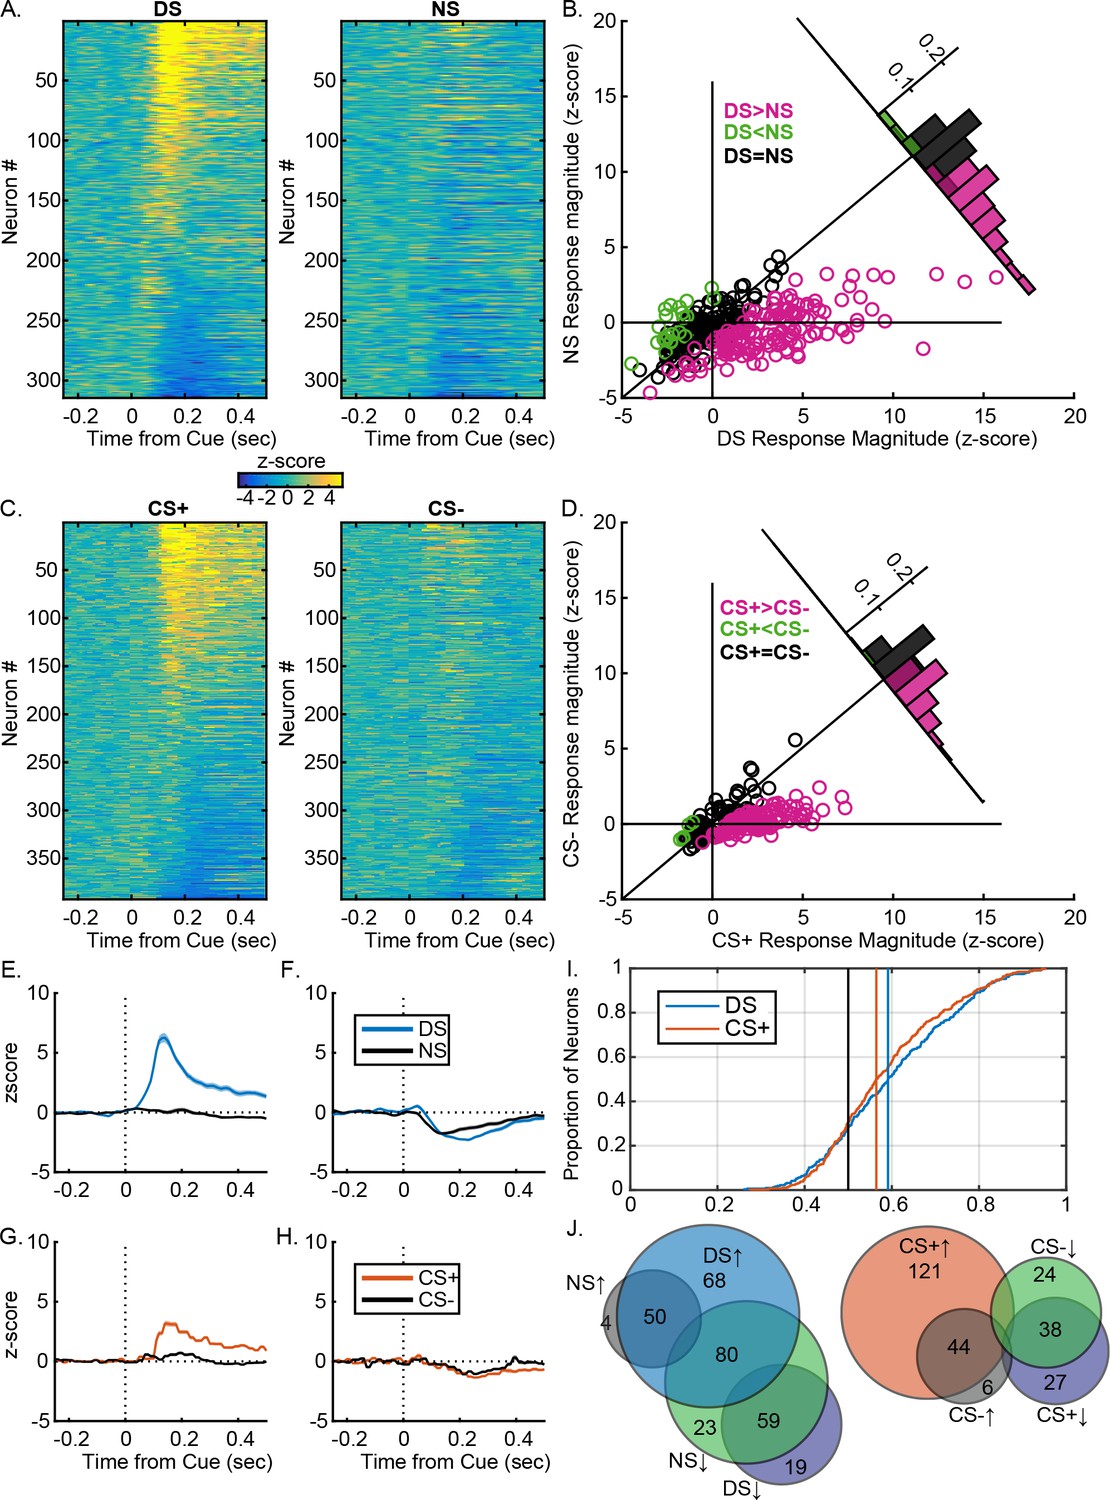
VP neural response are similarly predictive of the learned value of reward-related cues after instrumental or Pavlovian training.
(A) Heatmaps of responses to the DS and NS from all neurons, sorted by the magnitude and direction of their response to the DS. Each line represents the peristimulus time histogram (PSTH) of an individual neuron, normalized (z-score) and color coded. (B) Scatterplot of normalized (mean z-score) responses to the DS versus the NS, showing neurons that fire significantly more following the DS (pink), the NS (green) or neither cue (black). Inset histogram shows the distribution of units based on the difference in their normalized response to the DS versus the NS. (C) Heatmaps of responses to the CS+ and CS– from all neurons, sorted by the magnitude and direction of their response to the CS+. Each line represents the PSTH of an individual neuron, normalized (z-score) and color coded. (B) Scatterplot of normalized (mean z-score) responses to the CS+ versus the CS–, showing neurons that fire significantly more following the CS+ (pink), the CS– (green) or neither cue (black). Inset histogram shows the distribution of units based on the difference in their normalized response to the CS+ versus the CS–. Average (mean ± SEM) normalized response to the DS (blue) and NS (black) in DS excited (E) or DS inhibited (F) neurons. Average (mean ± SEM) normalized response to the CS+ (orange) and CS– (black) in CS+ excited (G) or CS+ inhibited (CS–) neurons. (I) Distribution of auROCs for the assessment of encoding of cue identity for the DS versus the NS (blue) and the CS+ versus the CS (orange). (J) Venn diagrams showing the degree of overlap between units with excitations or inhibitions to the DS and NS (left) or the CS+ and CS– (right). Numbers within each circle indicate the number of units that had a particular response pattern.
Figure 4

VP responses to cues more robustly predict response likelihood after instrumental training.
(A) Scatterplot of normalized (mean z-score) responses to the DS on trials when it was followed by a port entry versus responses to the DS on trials when it was not followed by a port entry, showing neurons that fire significantly more on trials with a response (pink), on trials with no response (green) or on neither trial type (black). Inset histogram shows the distribution of units based on the difference in their normalized response on the two trial types. (B) Scatterplot of normalized (mean z-score) responses to the CS+ on trials when it was followed by a port entry versus responses to the CS+ on trials when it was not followed by a port entry, showing neurons that fire significantly more on trials with a response (pink), on trials with no response (green) or on neither trial type (black). Inset histogram shows the distribution of units based on the difference in their normalized response on the two trial types. (C) Distribution of auROCs for the assessment of response likelihood prediction following the DS (blue) or the CS+ (orange), with vertical lines showing the mean auROC for each distribution, and the mean from the control distribution (black). (D) Mean ROC curve for the DS (blue) and the CS+ (orange). Average (mean ± SEM) normalized response to the DS on trials with a port entry (blue) and without a port entry (black) in DS excited neurons (E) and DS inhibited neurons (F), shown from 0.5 s prior to 1 s after cue onset. Average (mean ± SEM) normalized response to the CS+ on trials with a port entry (orange) and without a port entry (black) in CS+ excited neurons (G) and CS+ inhibited neurons (H), shown from 0.5 s prior to 1 s after cue onset. (I) Box plots of normalized responses to the DS (blue) on trials with (left) and without (right) a port entry in DS excited (top) and DS inhibited (bottom) neurons. (J) Box plots of normalized responses to the CS+ (orange) on trials with (left) and without (right) a port entry in CS+ excited (top) and CS+ inhibited (bottom) neurons. **=p < 0.01.
Figure 5 with 5 supplements
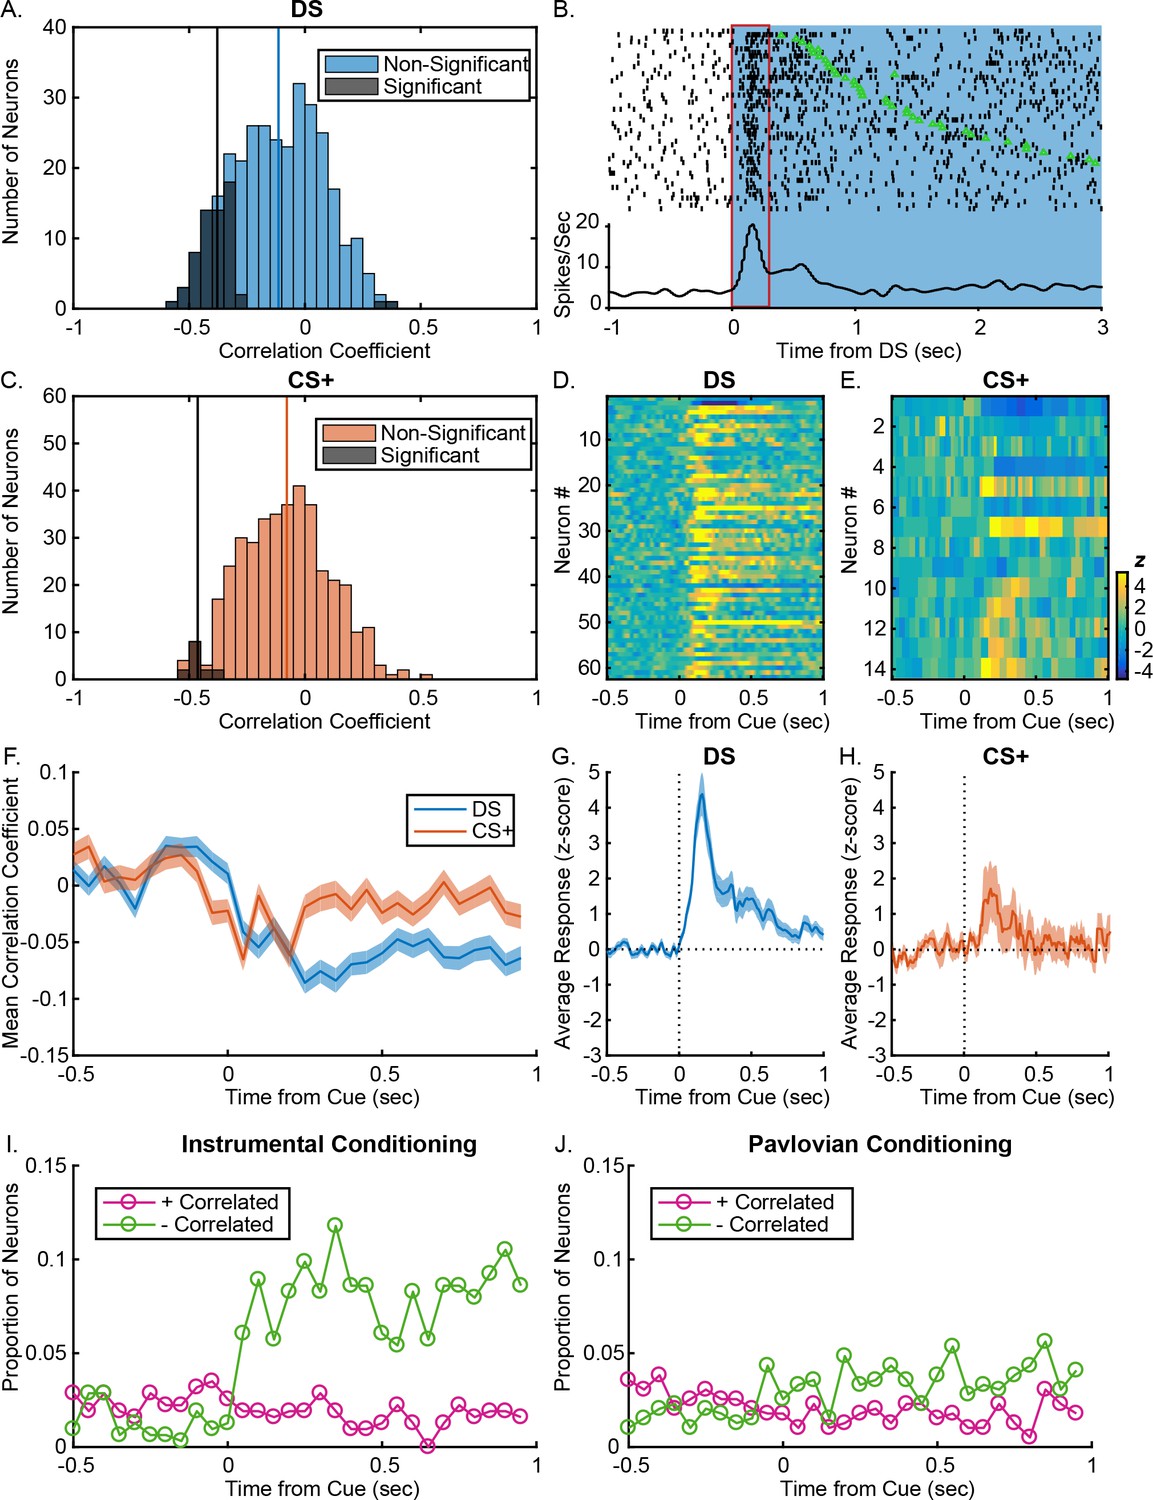
VP responses to cues predict response latency after instrumental, but not Pavlovian training.
(A) Distribution of Spearman rank correlation coefficient relating firing (0–300 ms after DS onsets) to the rats’ latency to enter the reward port on a trial-by-trial basis. Bars shaded in dark grey show neurons with significant correlations; bars shaded in light blue show neurons without significant correlations. (B). Example DS-excited neuron with a significant negative correlation between firing rate and latency. Individual trials are sorted by latency between the onset of the DS (blue) and the time over the port entry (green triangle). The red box indicates the time window during which firing rate was assessed. The rasters and corresponding histogram are aligned to DS onset (time 0). (C) Distribution of Spearman rank correlation coefficient relating firing (0–300 ms after CS+ onsets) to the rats’ latency to enter the reward port on a trial-by-trial basis. Bars shaded in dark grey show neurons with significant correlations; bars shaded in orange show neurons without significant correlations. Heatmaps of responses to the DS (D) and CS+ (E) from all neurons with post-cue firing rates that significantly predict response latency, sorted by correlation coefficient. Each line represents the PSTH of an individual neuron, normalized (z-score) and color coded. Average (mean ± SEM) normalized responses are shown below the heatmaps for the DS (G) and CS+ (H). Mean (± SEM) correlation coefficients (F) during 50 ms windows, from 0.5 s to 1 s after the DS (blue) or the CS+ (orange). Proportion of neurons with firing rates that are significantly negatively (green) or positively (pink) correlated with latency to enter the port during 50 ms windows starting 0.5 s before 1 s after the DS (I) or the CS+ (J).
Figure 5—figure supplement 1
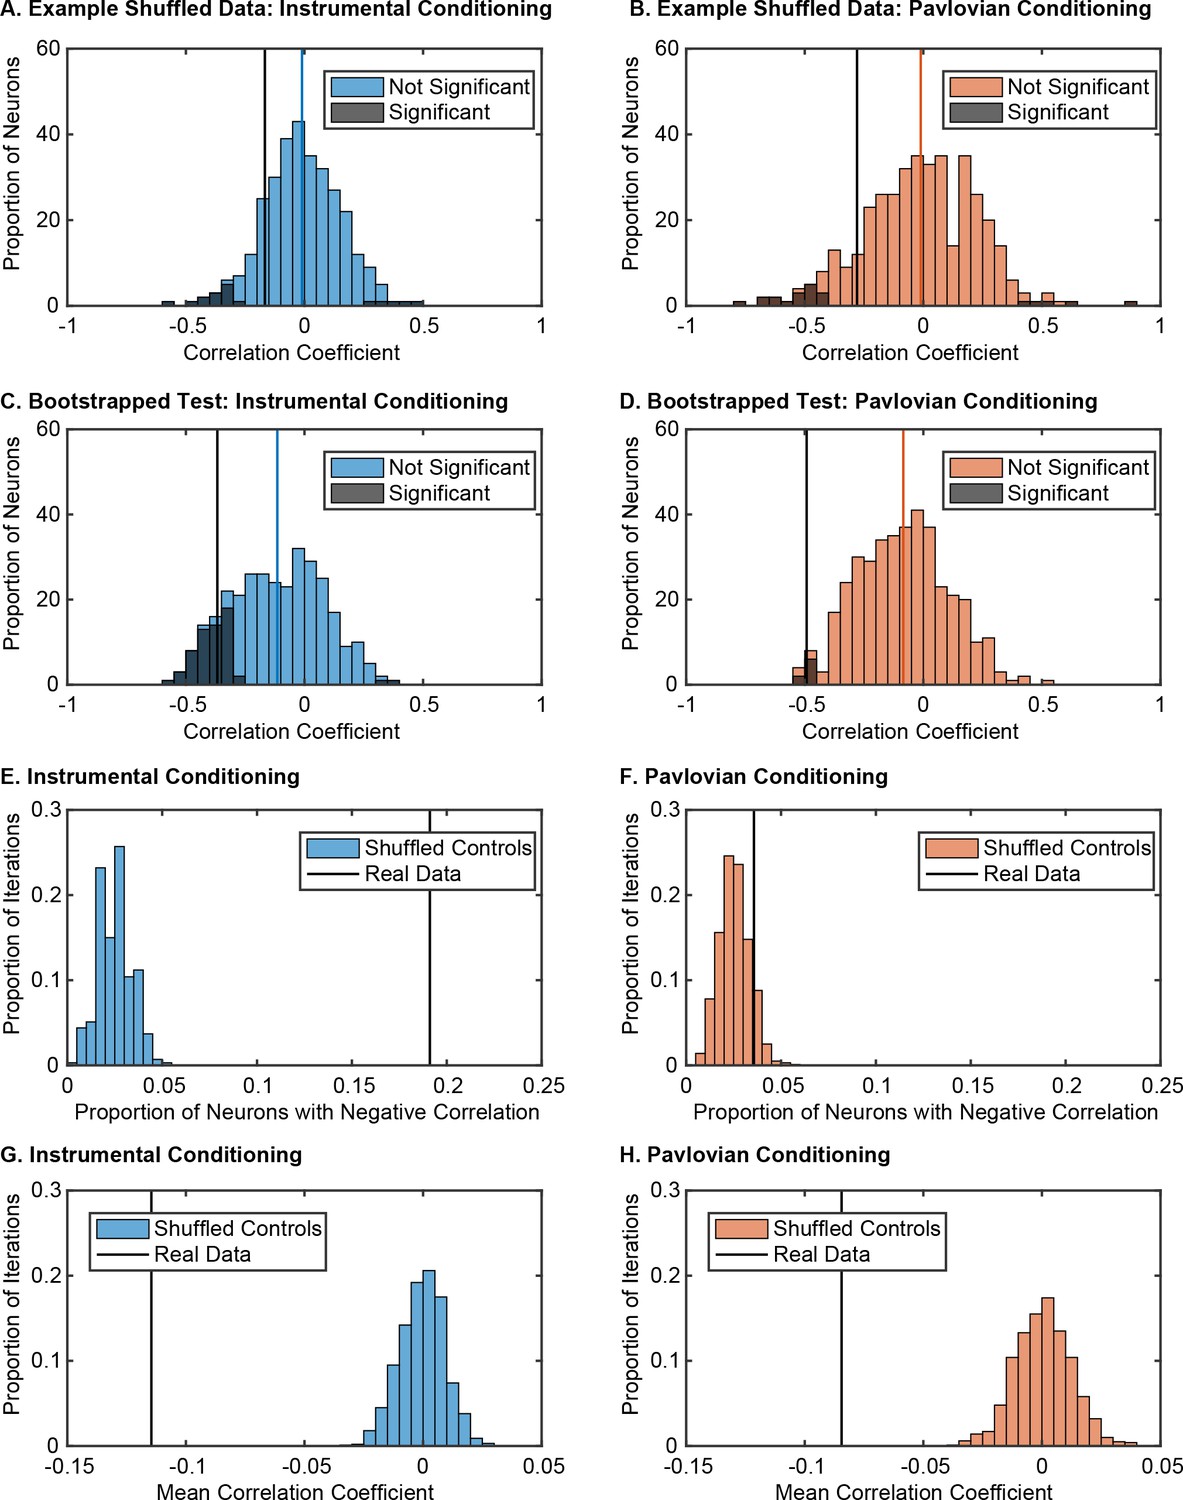
Characterizing correlations between DS and CS+ evoked firing and responses latency in comparison to shuffled data controls.
(A) Example distribution of Spearman rank correlation coefficients from one iteration of the shuffled data, relating shuffled firing 0–300 msec after DS onset to the animal’s latency to press the lever on a trial-by-trial basis. Bars shaded in dark grey show neurons with significant correlations; bars shaded in light blue show neurons without significant correlations. (B) Example distribution of Spearman rank correlation coefficients from one iteration of the shuffled data, relating shuffled firing 0–300 msec after CS+ onset to the animal’s latency to press the lever on a trial-by-trial basis. Bars shaded in dark grey show neurons with significant correlations; bars shaded in orange show neurons without significant correlations. (C) Distribution of Spearman rank correlation coefficients from the real data, relating firing 0–300 msec after DS onset to the animal’s latency to press the lever on a trial-by-trial basis, with significance determined by assessment of whether the real correlation coefficient was greater than the absolute value of all the correlation coefficients from the shuffled data. (D) Distribution of Spearman rank correlation coefficients from the real data, relating firing 0–300 msec after CS+ onset to the animal’s latency to press the lever on a trial-by-trial basis, with significance determined by assessment of whether the real correlation coefficient was greater than the absolute value of all the correlation coefficients from the shuffled data. (E) Distribution of the number of significantly correlated units from 1000 shuffled iterations of the data from the instrumental task. The number of significant Spearman correlation coefficients from real instrumental data is marked with a vertical black line. (F) Distribution of the number of significantly correlated units from 1000 shuffled iterations of the data from the Pavlovian task. The number of significant Spearman correlation coefficients from real instrumental data is marked with a vertical black line. (G) Distribution of mean Spearman correlation coefficients from 1000 shuffled iterations of firing rate post-DS and latency on a trial-by-trial basis. The mean correlation coefficient from the real data is marked in black. (H) Distribution of mean Spearman correlation coefficients from 1000 shuffled iterations of firing rate post-CS+ and latency on a trial-by-trial basis. The mean correlation coefficient from the real data is marked in black.
Figure 5—figure supplement 2
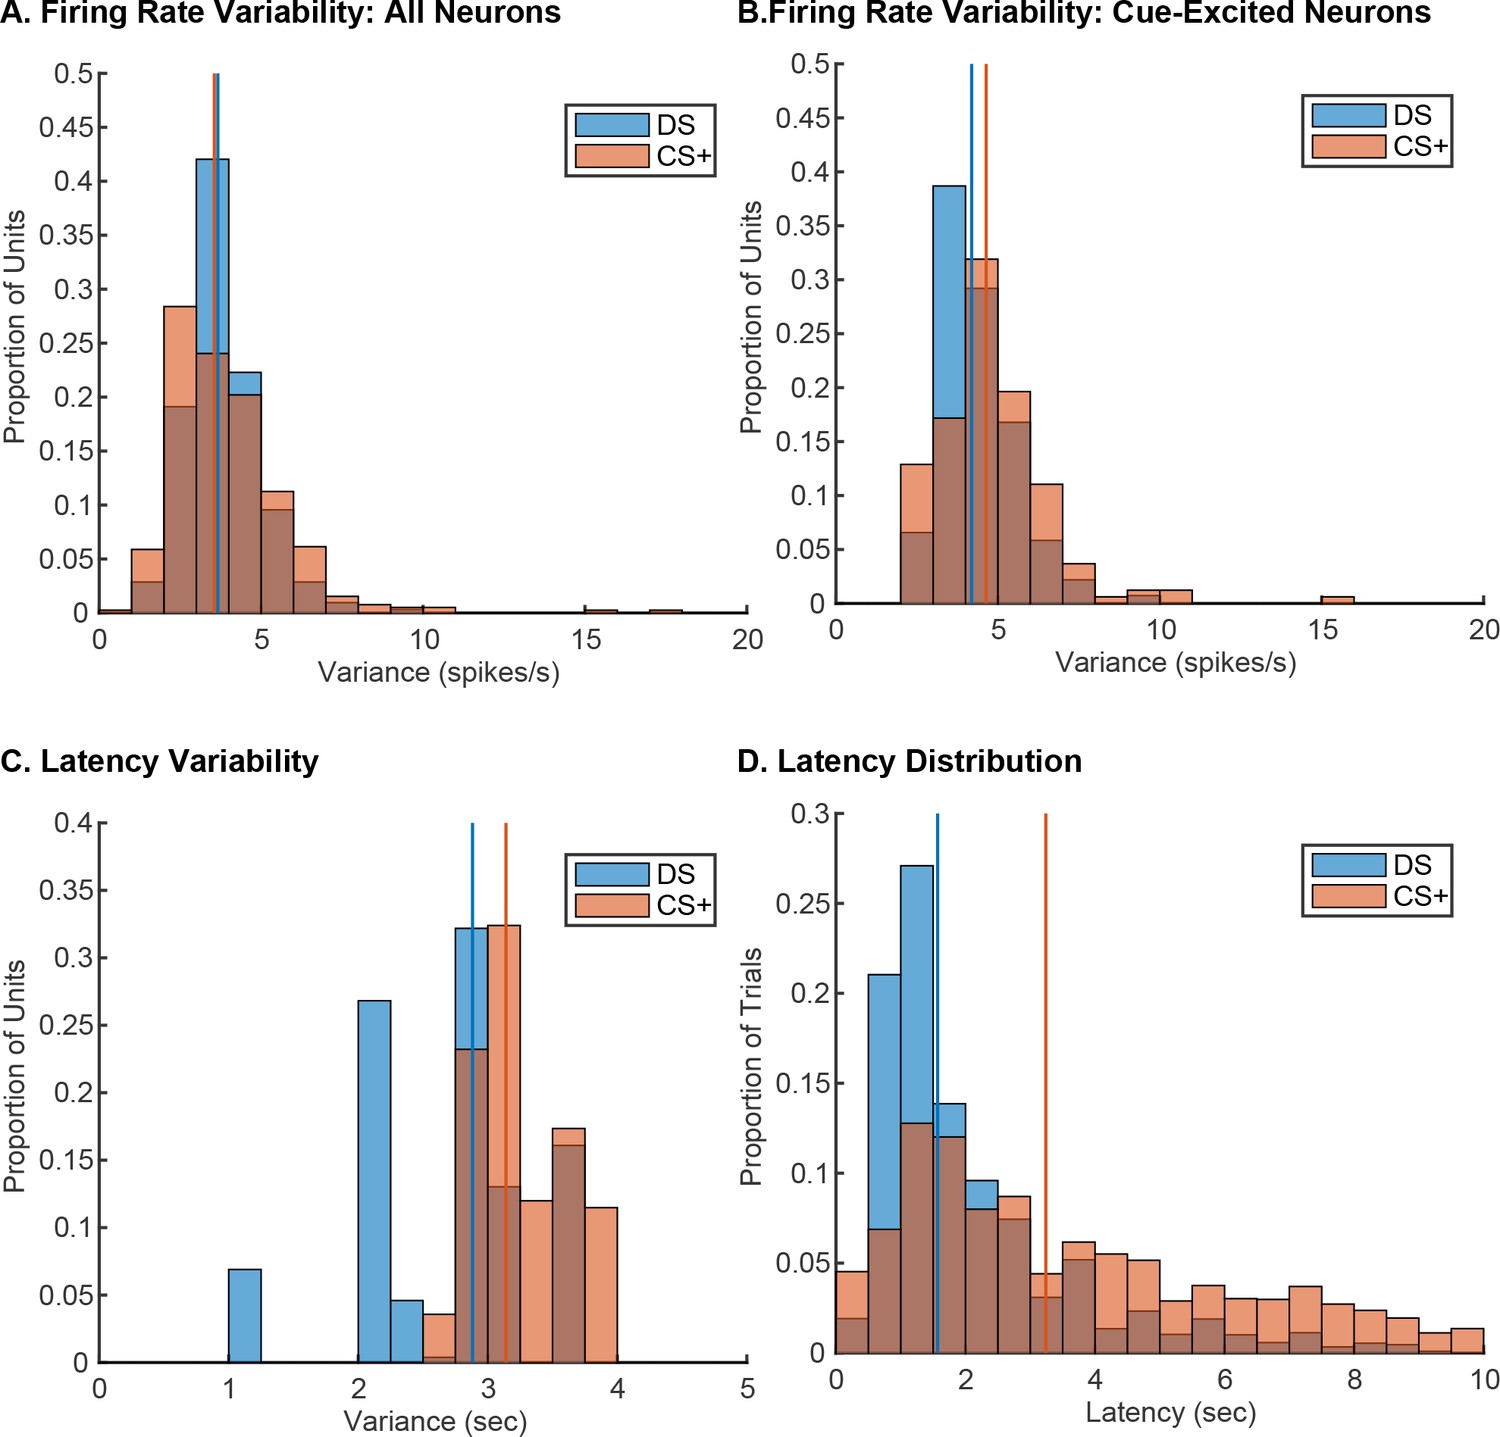
The absence of robust latency encoding in the Pavlovian task is not due to decreased variability in either post-cue firing or behavioral latency.
(A) Distribution of mean post-cue variance in spike rate following the DS (blue) and the CS+ (orange) in all units. (B) Distribution of mean post-cue variance in spike rate following the DS (blue) and the CS+ (orange) in cue-excited neurons. (C) Distribution of variance in latency to enter the reward port following the DS (blue) and the CS+ (orange) based on the behavioral variance associated with each unit (i.e. weighted based on the number of units from each recording session). (D) Distribution of latencies to enter the reward port following the DS (blue) and the CS+ (orange); mean latencies in response to each cue are marked by vertical lines.
Figure 5—figure supplement 3
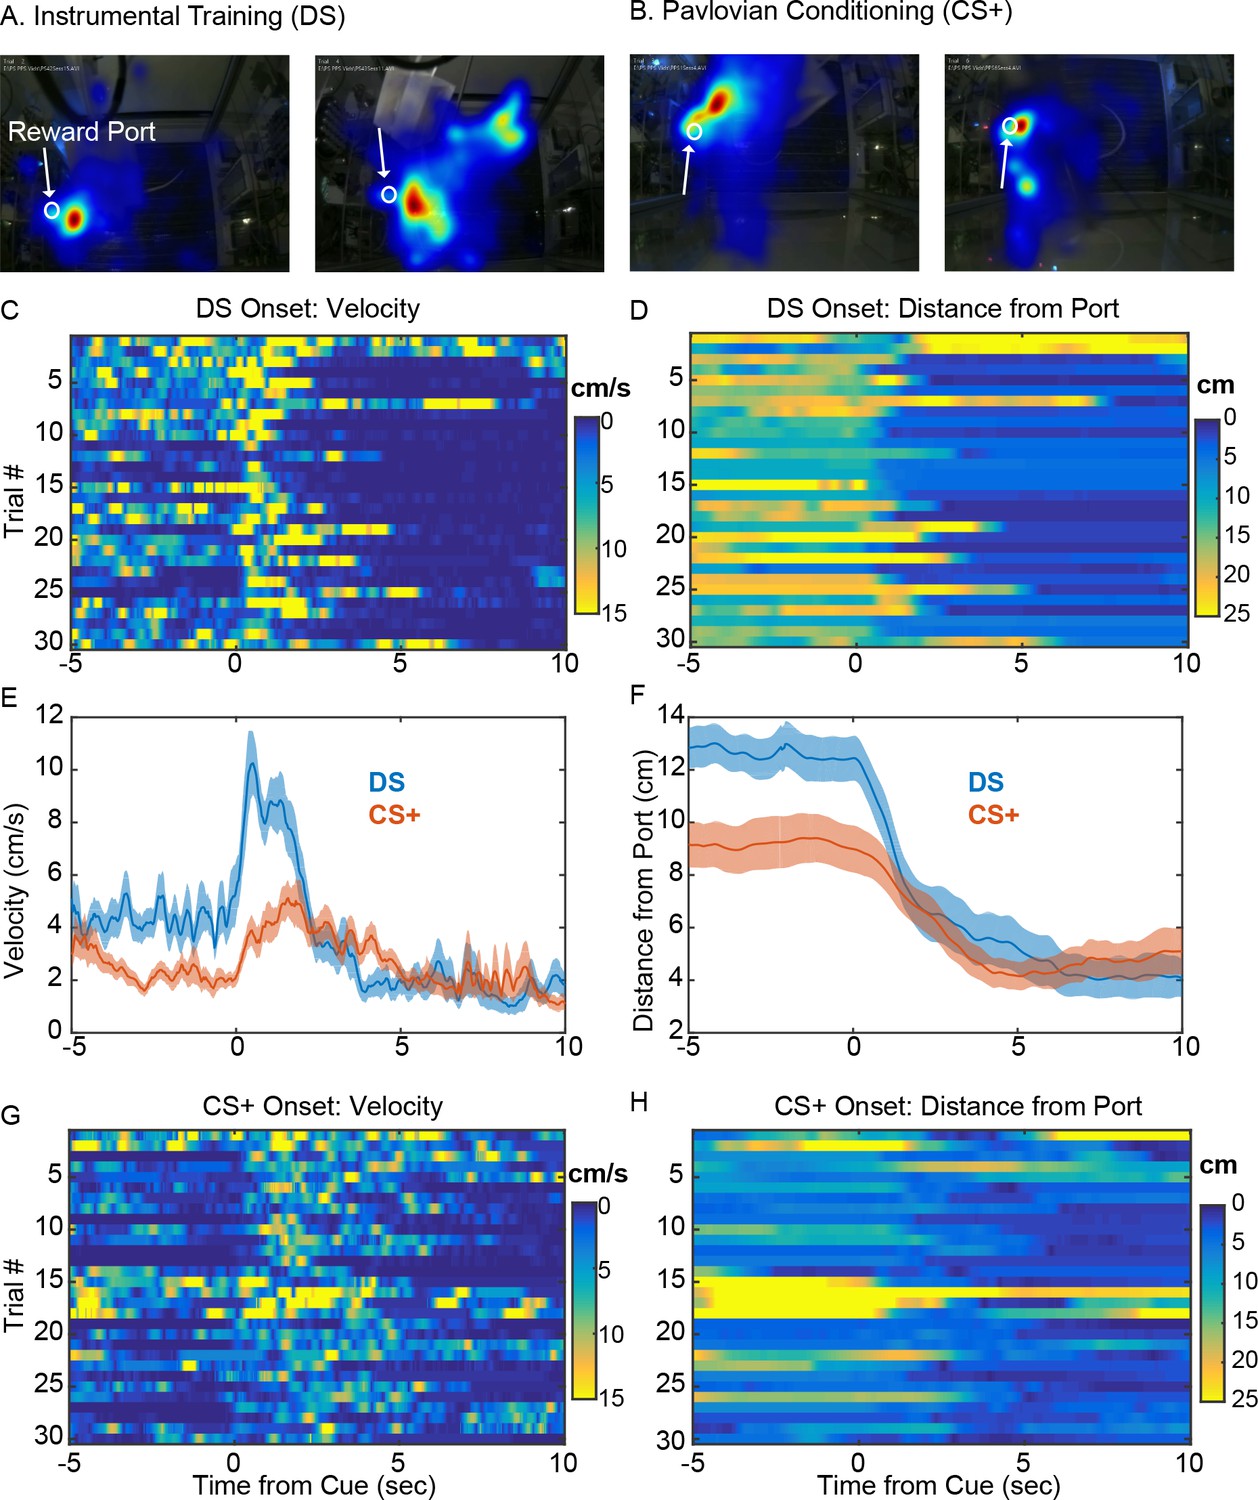
Analysis of velocity and distance from reward port.
Overhead video examples and heatmaps of location trends from rats in the instrumental training (A) and Pavlovian conditioning (B) groups. Representative heatmaps showing trial-by trial velocity (left) and distance from port (right) from rats in the instrumental training (C and D) and Pavlovian conditioning (G and H) groups. Traces showing mean velocity (E) and distance from port (F) in response to the DS (blue) or CS+ (orange). Shaded areas indicate standard error.
Figure 5—figure supplement 4
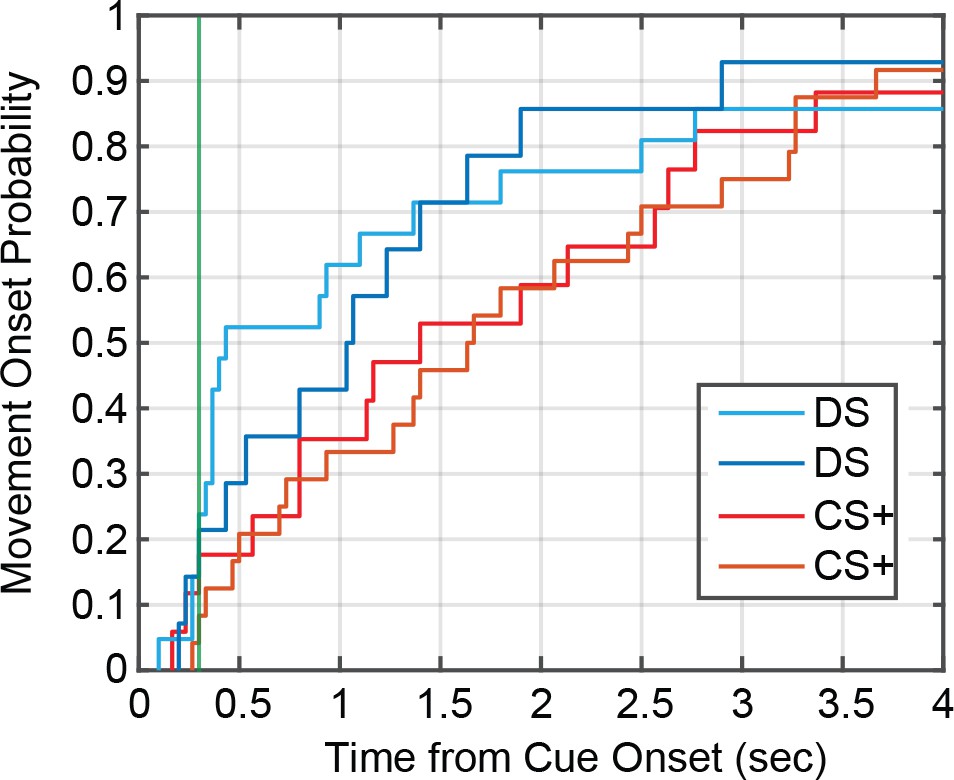
Movement onsetdistributions.
Cumulative distribution plot showing movement onset distributions from two rats trained under an instrumental contingency (DS, dark and light blue) and two rats trained under a Pavlovian contingency (CS+, red and orange). The green line indicates the end of the post-cue period used for neural analysis (300 ms).
Figure 5—figure supplement 5
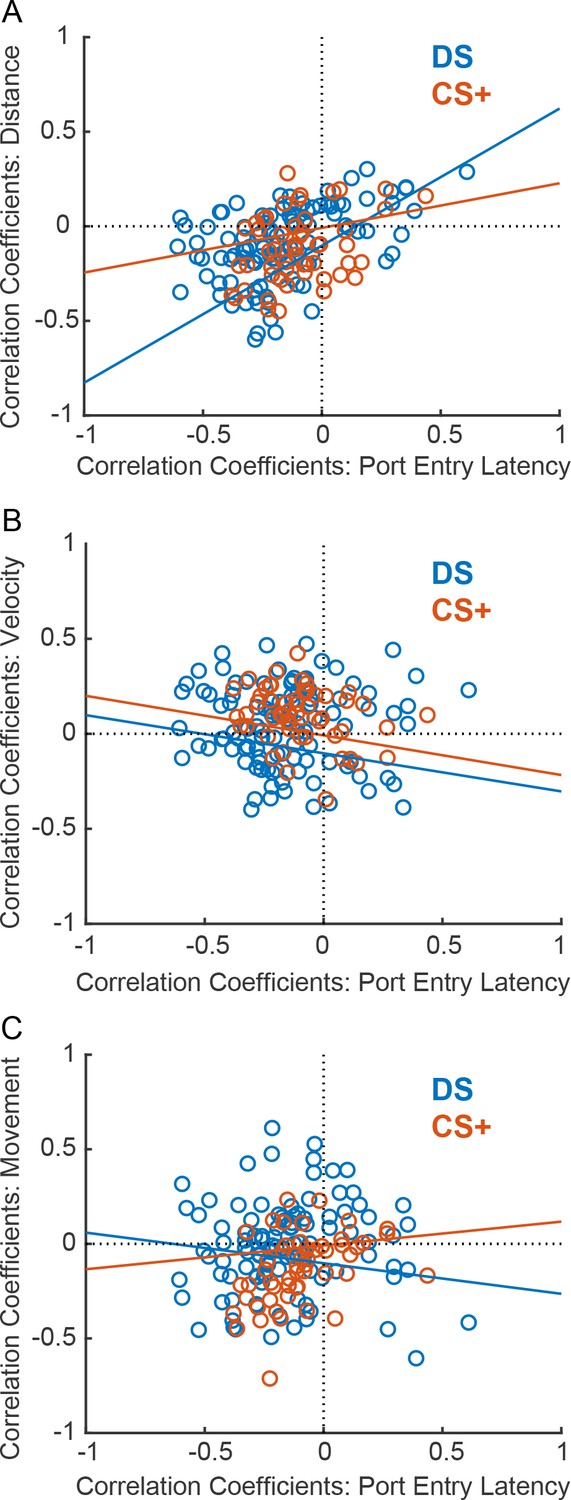
Relationship between latency encoding and encoding of distance, velocity and movement onsets.
(A) Scatterplot of Spearman rank correlation coefficients relating individual neural firing after the DS (blue) or CS+ (orange) to port entry latency versus those relating firing to distance from port at cue onset. (B) Scatterplot of Spearman rank correlation coefficients relating individual neural firing after the DS (blue) or CS+ (orange) to port entry latency versus those relating firing to velocity after cue onset (0 to 0.5 s). (C) Scatterplot of Spearman rank correlation coefficients relating individual neural firing after the DS (blue) or CS+ (orange) to port entry latency versus those relating firing to movement onset latency.
Figure 6 with 3 supplements

VP inactivation or disruption of local glutamate or dopamine signaling impacts reward-seeking latency after instrumental, but not Pavlovian training.
(A) Histological reconstruction of microinjection sites in the instrumental task (diamonds) and in Pavlovian (circles) experiments shown on coronal slices, marked relative to bregma (mm), with the boundaries of VP demarcated in red. Purple markers indicate microinjection locations contained within VP, and blue markers indicate microinjection locations that were not contained within VP. (B) Change from vehicle in the probability of a port entry during the CS+ (left) or CS– (right) in the instrumental task, following each drug treatment. (C) Change from vehicle in the probability of a port entry during the DS (left) or NS (right) in the Pavlovian task, following each drug treatment. (D) Change from vehicle in port entry latency during the CS+ (left) or CS– (right) in the instrumental task, following each drug treatment. (E) Change from vehicle in port entry latency during the DS (left) or NS (right) in the Pavlovian task, following each drug treatment. *, p<0.05, *p<0.01 pairwise comparison with Sidak corrections.
Figure 6—figure supplement 1
Summary of training behavior in the instrumental and Pavlovian tasks in the microinjection groups.
(A,B) Mean (± SEM) latency to enter the port during the instrumental DS (A, blue) or the Pavlovian CS+ (B, orange), and during the control cues (NS or CS-, black) during the initial 5 days of training and the last 5 days of training prior to meeting response criteria for electrode implantation. (C,D) Mean (± SEM) probability of port entry during the instrumental DS (A, blue) or the Pavlovian CS+ (B, orange), and during the control cues (NS or CS-, black) during the initial 5 days of training and the last 5 days of training prior to meeting response criteria. Individual data points, and mean ± SEM for (E) days to reach response criteria, (F) final port entry probability, and (G) final port entry latency (sec) prior to microinjection test days.
Figure 6—figure supplement 2
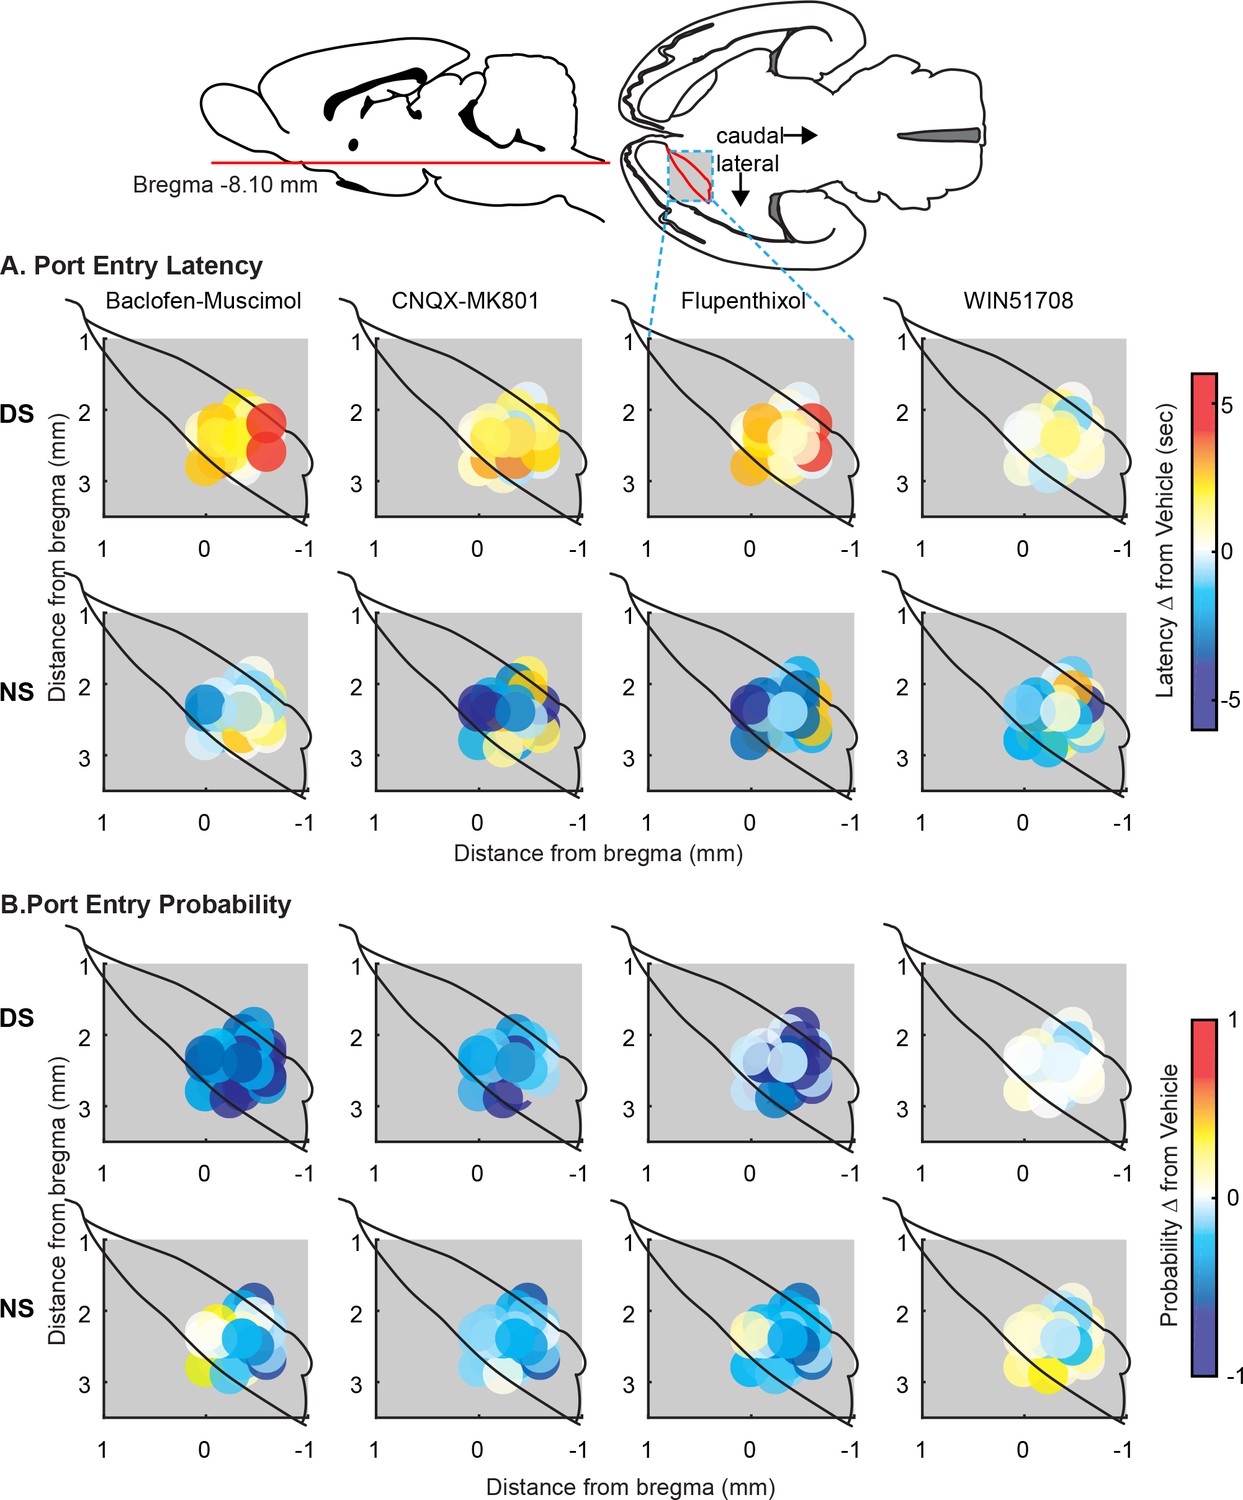
Maps of microinjection effects after instrumental training.
(A) Port entry latency. Maps showing the effect of VP inactivation with baclofen-muscimol (left), glutamate receptor antagonism (CNQX-MK801; left middle), dopamine receptor antagonism (flupenthixol; right middle), or NK-1 receptor antagonism (WIN51708; right) on port entry latency during the DS (top) or NS (bottom). (B) Port entry probability. Maps showing the effect of VP inactivation with baclofen-muscimol (left), glutamate receptor antagonism (CNQX-MK801; left middle), dopamine receptor antagonism (flupenthixol; right middle), or NK-1 receptor antagonism (WIN51708; right) on port entry probability during the DS (top) or NS (bottom). Placements were mapped on the horizontal plane, and color coded for changes in behavior.
Figure 6—figure supplement 3
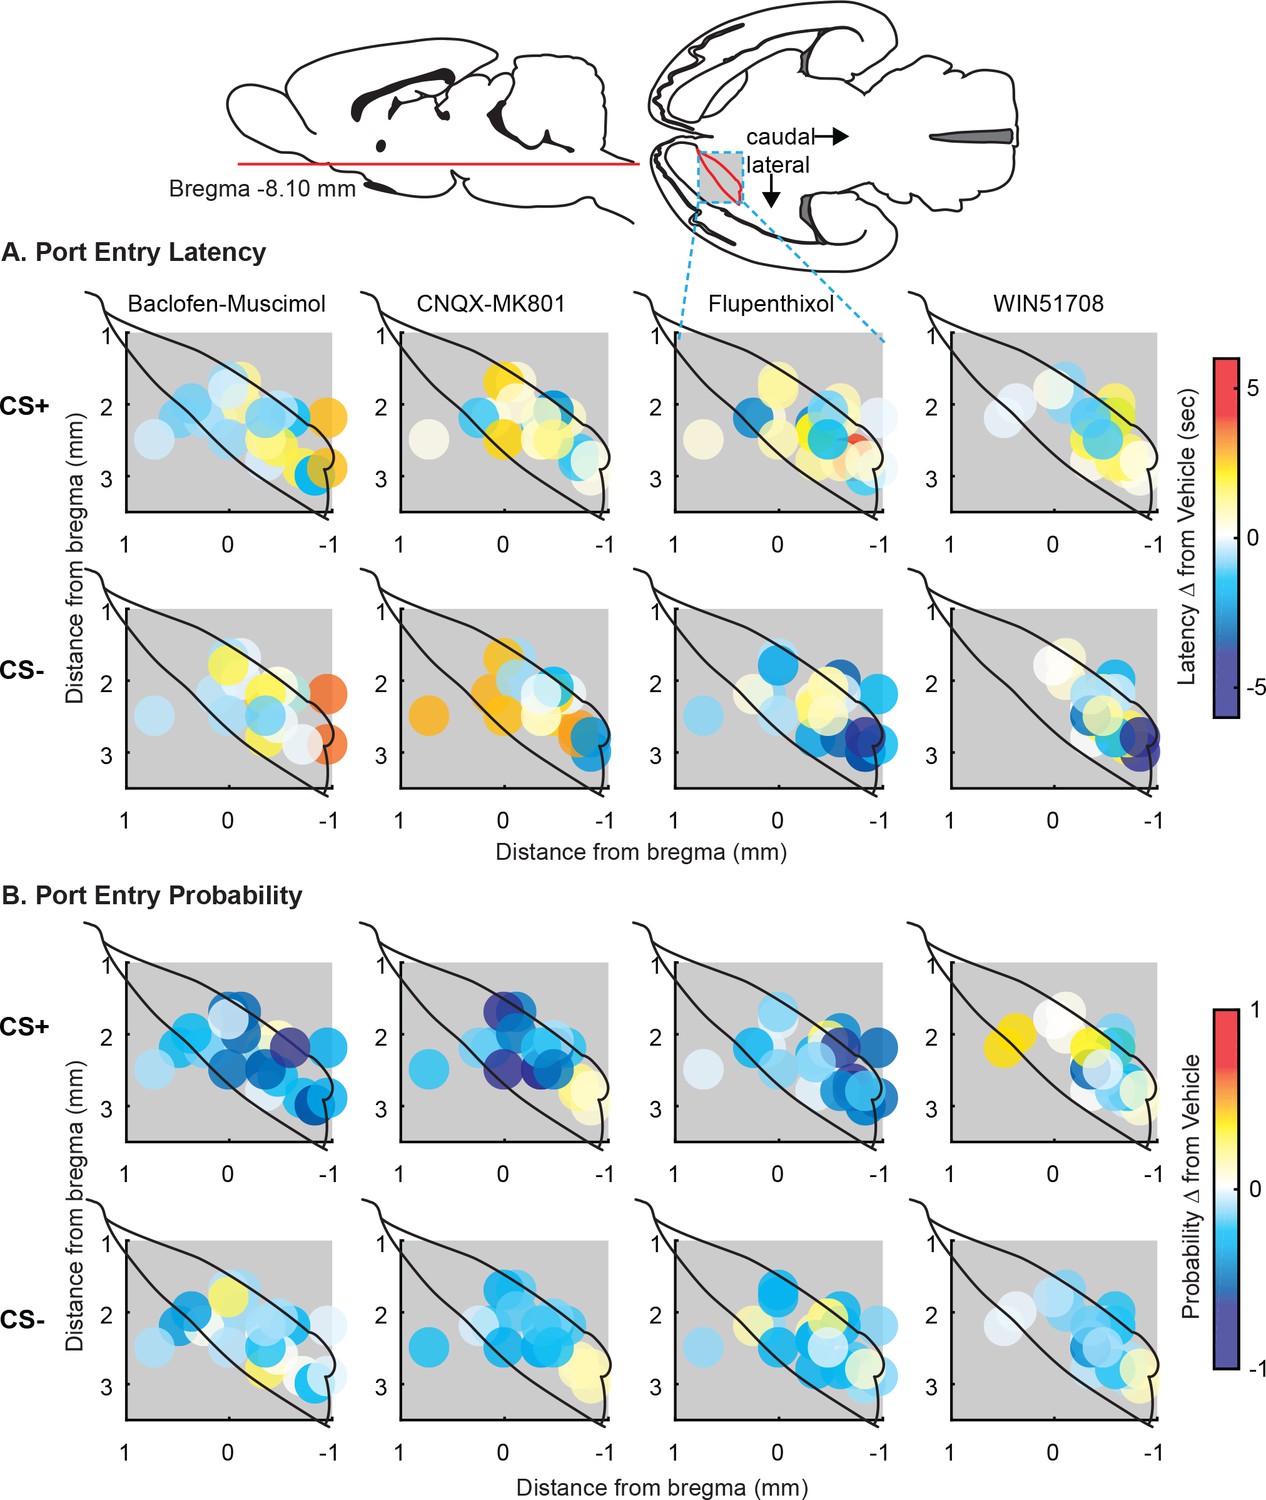
Maps of microinjection effects after Pavlovian training.
(A) Port entry latency. Maps showing the effect of VP inactivation with baclofen-muscimol (left), glutamate receptor antagonism (CNQX-MK801; left middle), dopamine receptor antagonism (flupenthixol; right middle), or NK-1 receptor antagonism (WIN51708; right) on port entry latency during the CS+ (top) or CS- (bottom). (B) Port entry probability. Maps showing the effect of VP inactivation with baclofen-muscimol (left), glutamate receptor antagonism (CNQX-MK801; left middle), dopamine receptor antagonism (flupenthixol; right middle), or NK-1 receptor antagonism (WIN51708; right) on port entry probability during the CS+ (top) or CS- (bottom). Placements were mapped on the horizontal plane, and color coded for changes in behavior.
Author response image 1
Author response image 2

Author response image 3
Additional files
-
Transparent reporting form
- https://doi.org/10.7554/eLife.33107.019
Download links
A two-part list of links to download the article, or parts of the article, in various formats.
Downloads (link to download the article as PDF)
Open citations (links to open the citations from this article in various online reference manager services)
Cite this article (links to download the citations from this article in formats compatible with various reference manager tools)
Ventral pallidal encoding of reward-seeking behavior depends on the underlying associative structure
eLife 7:e33107.
https://doi.org/10.7554/eLife.33107


