A transient cortical state with sleep-like sensory responses precedes emergence from general anesthesia in humans
- Harvard University, United States
- Massachusetts General Hospital, United States
- Massachusetts General Hospital and Harvard Medical School, United States
- Harvard Medical School, United States
- Brigham and Women’s Hospital, United States
- Massachusetts Institute of Technology, Unites States
- Massachusetts Institute of Technology, United States
- University of California, San Diego, United States
Figures
Figure 1 with 1 supplement
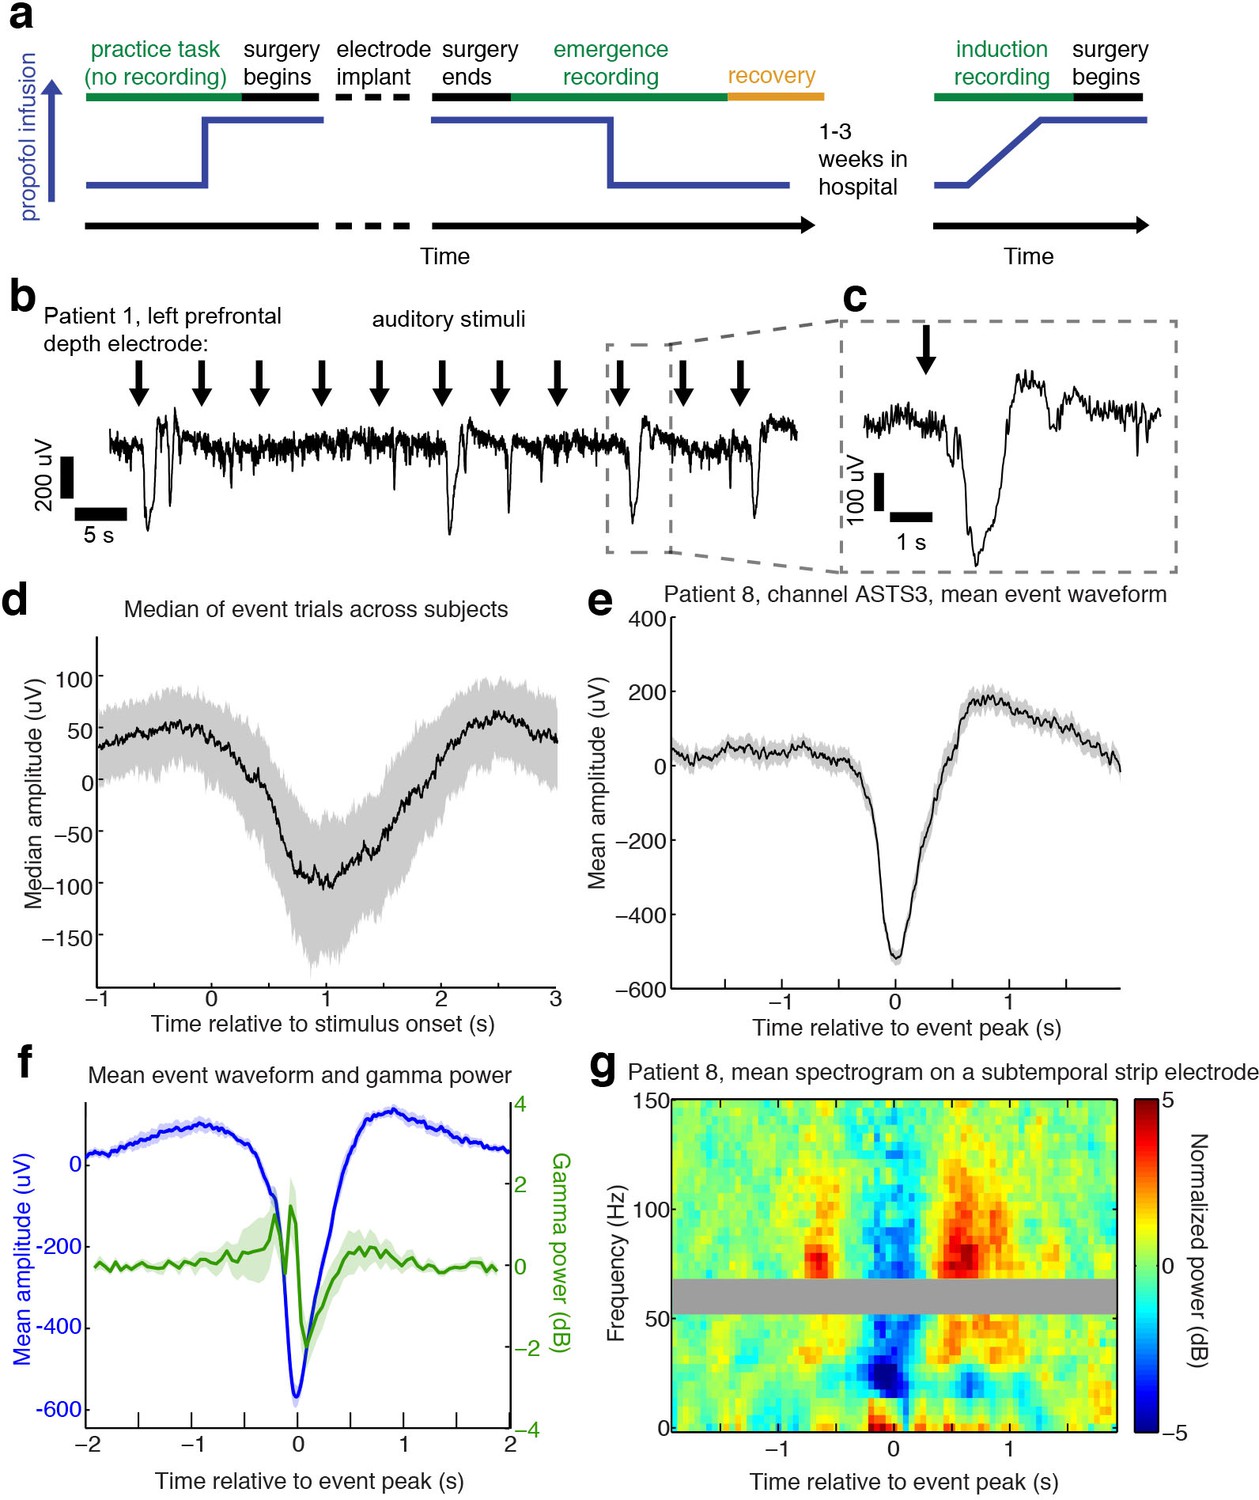
Auditory stimuli can evoke large, slow, asymmetric events during emergence from general anesthesia.
(A) Schematic of experimental procedures for intracranial study. (B) Example trace from a single subject shows that a subset of auditory trials induce large evoked potentials. Data were lowpass filtered at 40 Hz and downsampled to 100 Hz for display. (C) Zoomed-in view of one event, with gray box highlighting region in zoomed-out view. (D) Median of events within 2 s of stimulus onset across all subjects, including all channels with at least five event trials (n = 190 channels). Shaded region is quartiles. Sign has been flipped to be negative across all channels. (E) Mean waveform in channel with the most events for an example subject, aligned to the event peak (n = 38 events). Shaded region is standard error. (F) Mean waveform aligned to peak across all subjects and mean gamma power during the event (n = 13 sessions, 13 channels, 1339 events). Shaded region is standard error. (G) Normalized spectrogram of high frequencies in same subject and channel as panel E, shows large drop in gamma power during events detected in individual subjects. Gray bar placed around frequency range with 60 Hz line noise.
-
Figure 1—source data 1
Mean processed LPs for each intracranial subject during emergence.
- https://doi.org/10.7554/eLife.33250.005
Figure 1—figure supplement 1
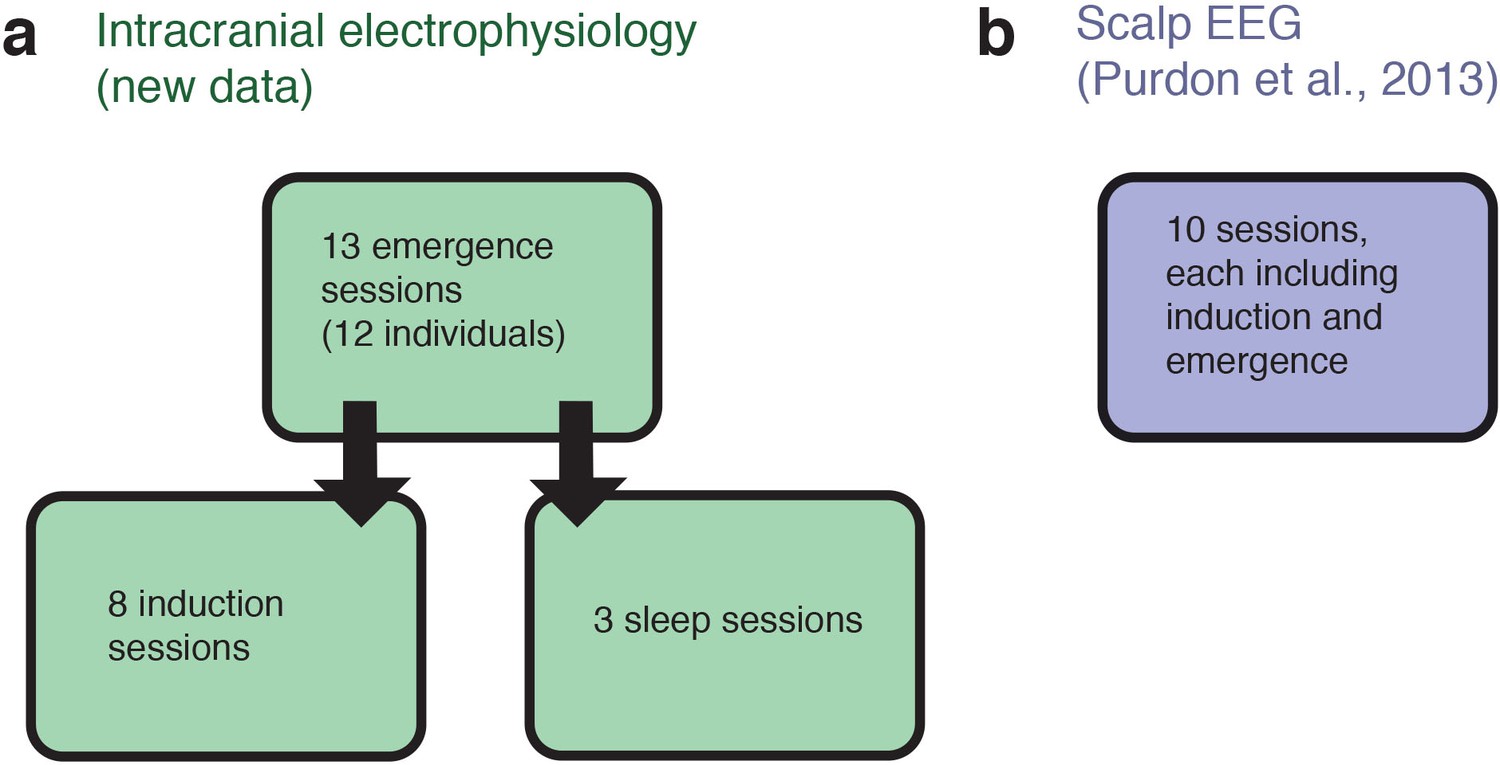
Schematic of datasets used.
(A) The analyses of intracranial data analyzed 13 sessions acquired from 12 individuals, while emerging from general anesthesia. Eight of these individuals returned for a slow, ramped induction of general anesthesia within the following weeks. For three of these individuals we also obtained stage two sleep recordings. (B) The analyses of scalp EEG data used an independently acquired dataset: novel analyses of a previously published high-density EEG data in healthy volunteers (the sensory-evoked potentials were not analyzed or reported in the previous study). Each volunteer underwent a gradual, stepped increase and decrease in propofol plasma concentration, meaning that a long-duration induction and emergence recording was present for each of the ten subjects.
Figure 2
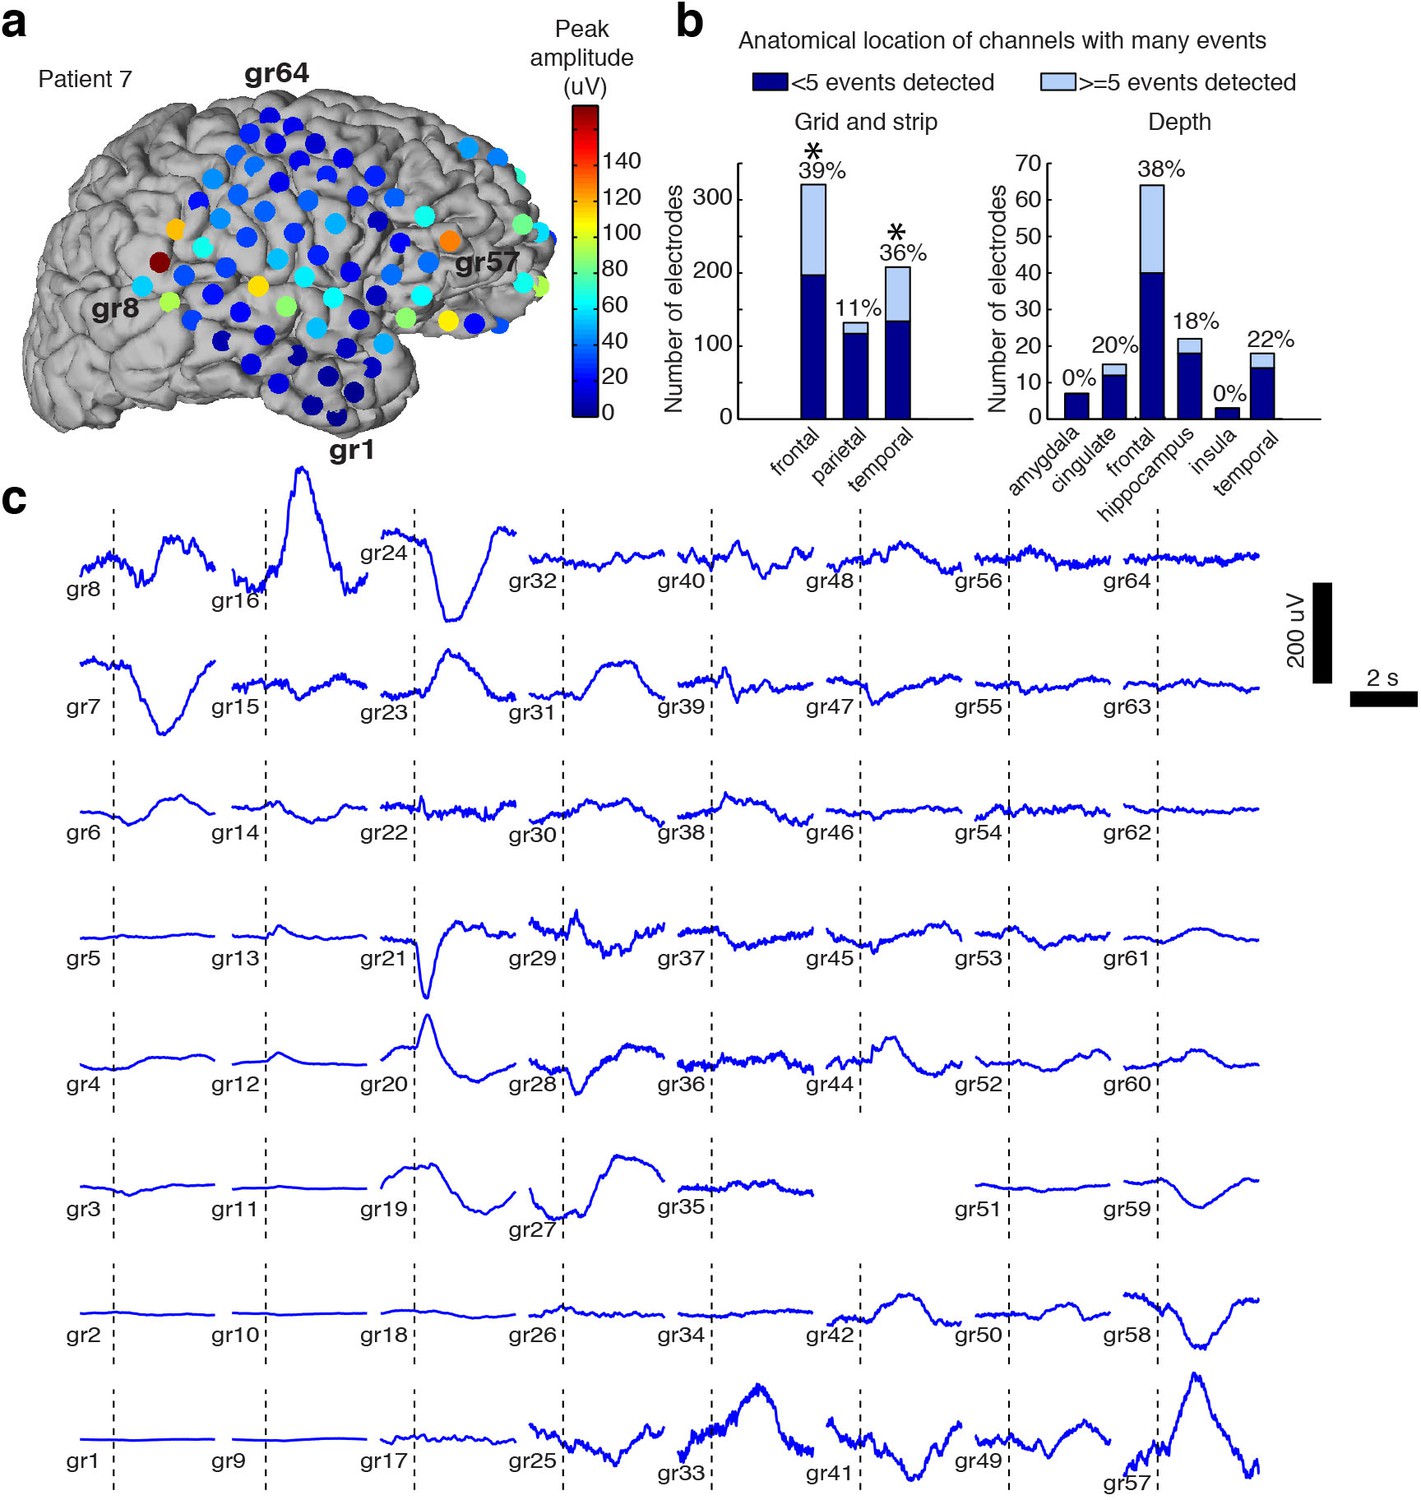
Spatial distribution of the large evoked potential.
(A) Example surface reconstruction of a single subject, where color indicates absolute value of the amplitude of the mean potential over all ‘event trials’. (B) Number of electrodes exhibiting LP occurrence across regions (excluding white matter and regions with <= 5 electrodes). Stars indicate regions with significantly higher proportions of high-LP channels than the mean rate (alpha = 0.05, Bonferroni corrected). (C) Timecourse of the mean stimulus-evoked potential across a grid of electrodes in Patient seven shows that evoked potentials can occur on a large number of channels (black dashed line shows time of stimulus onset).
Figure 3
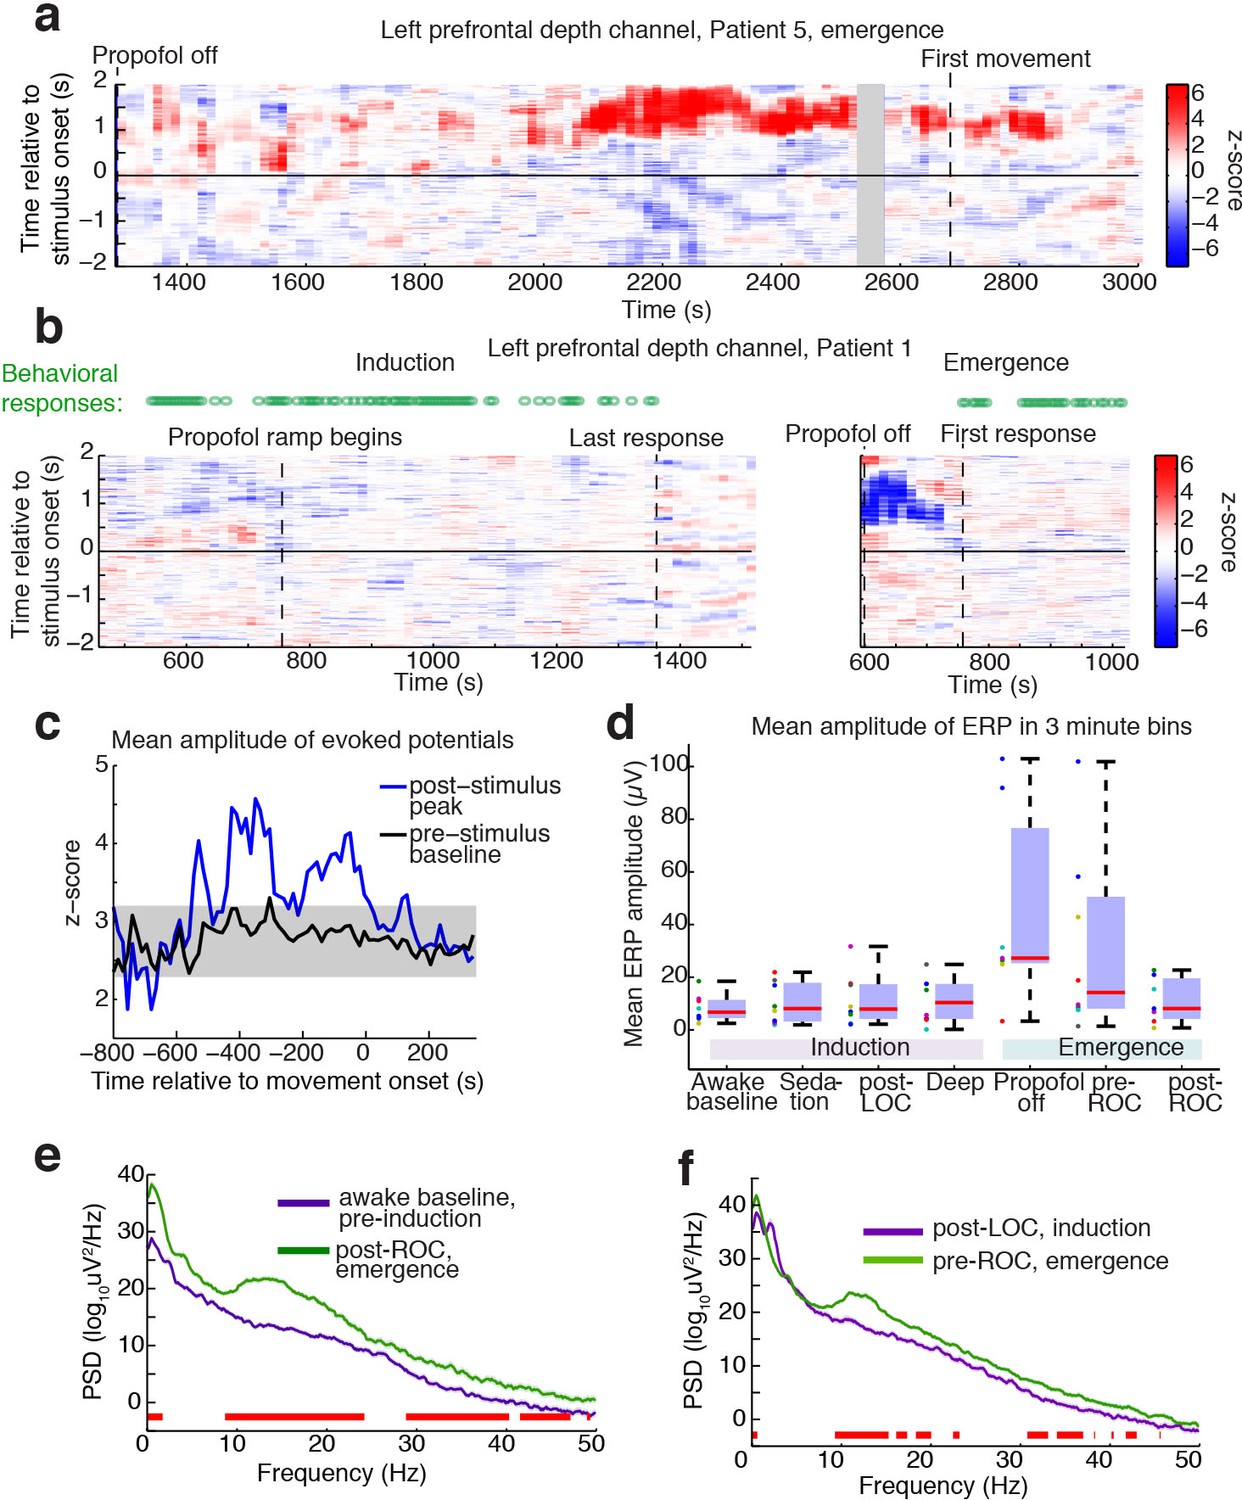
Large evoked potentials occur during a brief transitional state.
(A) Evoked potentials in a patient with a long emergence recording, shows that LPs appear as the propofol concentration declines, and then subside shortly after the patient's first spontaneous movement (seen at ~2200–2900 s). Z-scored ERPs averaged in sliding window of 60 s every 15 s. Gray shading covers window with insufficient (<8) events for averaging. (B) Normalized evoked potentials in a patient with both an emergence and an induction recording. The pattern is asymmetric, with stimulus-locked LPs occurring only during emergence. Z-score shows mean ERP normalized to the pre-stimulus baseline in each time window. This patient was under light anesthesia at the end of surgery and LPs appeared even before the propofol infusion was turned off. (C) Amplitude of the peak ERP across all subjects, locked to ROC (movement onset) and normalized to pre-stimulus baseline. Evoked potential amplitude across all subjects peaks in the 400 s prior to ROC, and then returns to baseline after ROC, indicating that LPs mostly occur in the minutes preceding ROC. As a control, the peak pre-stimulus baseline z-score across subjects is plotted in black, with gray shading indicating its mean value ±3*st.dev. over time. (D) Boxplot of absolute value of mean ERP amplitude at 0.5–1 s post-stimulus in the eight subjects with both induction and emergence recordings. ERPs are small at baseline, sedation, and post-LOC. They are largest in the bin after propofol is turned off and before ROC. (E) Mean spectra across patients within the same 3 min time bins, red bars indicate frequency bands with significant difference (p<0.05, bootstrap). The post-ROC state has greater low-frequency (<2 Hz), alpha/beta (~10–24 Hz) and gamma (~30–50 Hz) power than the awake pre-anesthesia baseline (n = 7 subjects). (F) Same, demonstrates a broadband increase in power above 10 Hz in the emerging state, relative to immediately after LOC during induction (n = 8 subjects). Red bars indicate significant differences at p<0.05 (bootstrap).
-
Figure 3—source data 1
Mean amplitudes of the ERP for each intracranial subject across conditions.
- https://doi.org/10.7554/eLife.33250.008
Figure 4 with 1 supplement
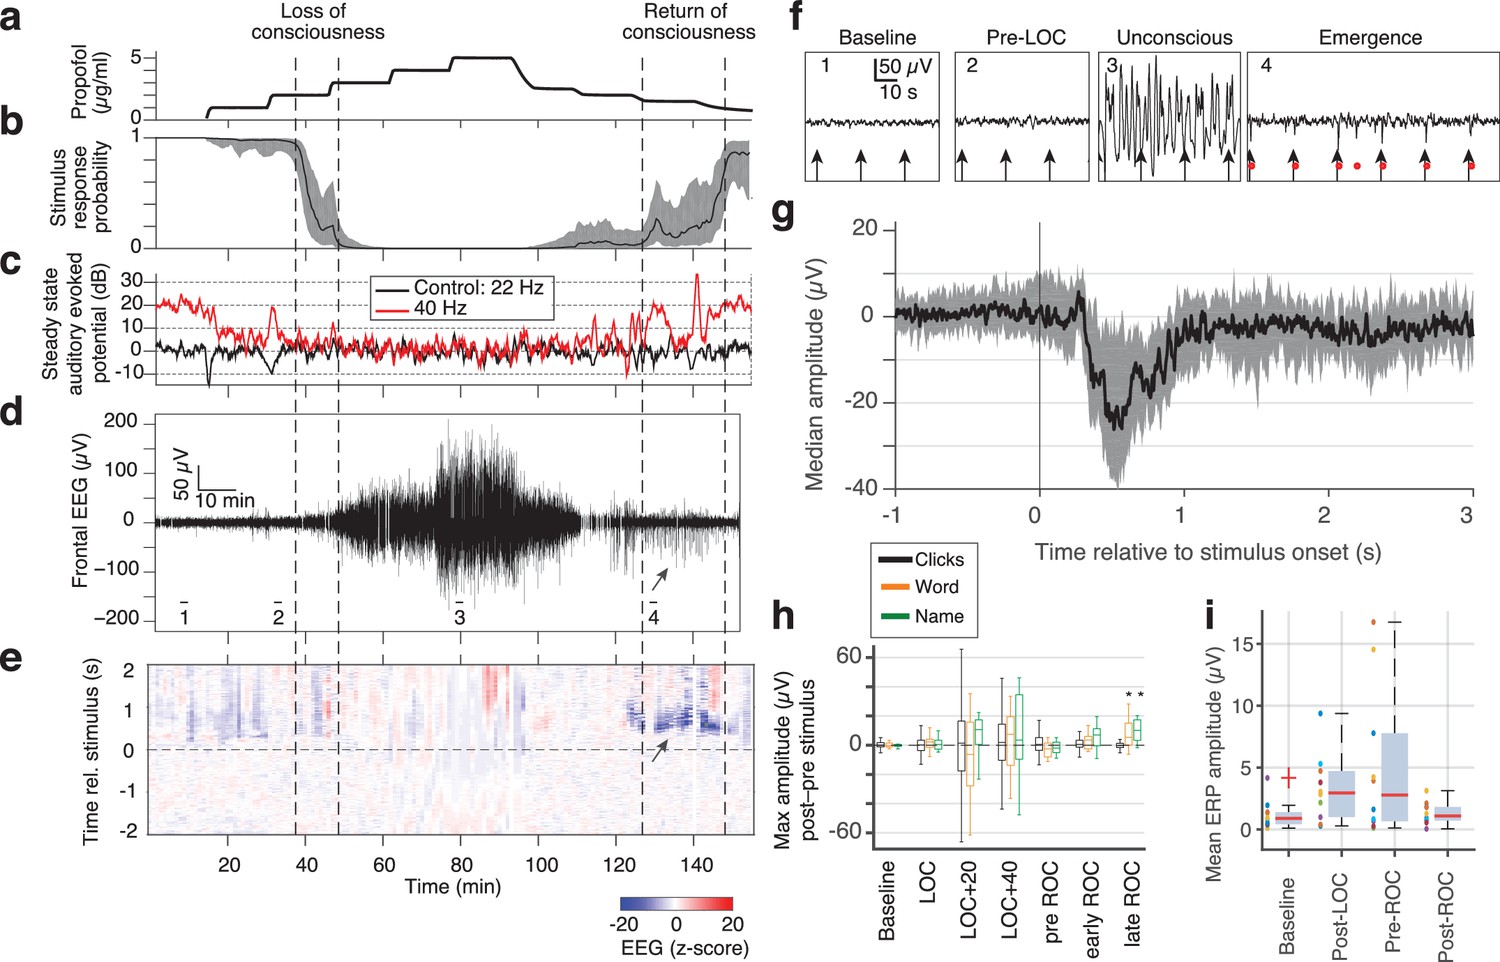
Large evoked potentials can be detected during emergence in scalp EEG recordings.
(A) Experimental design for scalp EEG volunteer study: target propofol plasma concentration increased and decreased as a controlled step function. (B) Behavioural response rate in one subject shows times of loss of consciousness (LOC) and recovery of consciousness (ROC). (C) Steady state auditory evoked potential (SSAEP) at lateral electrodes to the click train stimulus (repetition rate 40 Hz, red) declines during propofol general anesthesia; the control frequency (22 Hz) shows no SSAEP. (D) EEG at a central electrode over the entire recording shows high-amplitude, low-frequency power during the anesthetized period. Prior to ROC (around 120 min, marker 4), large unipolar negative potentials are observed (arrow). (E) Stimulus-triggered average exhibits large, slow potentials prior to return to the awake state, but not during induction or during maintenance. (F) Example records from the epochs marked in panel D show that sensory-evoked LPs in the scalp EEG occur during emergence (4), but not pre-anesthesia baseline (1), pre-LOC (2) or profound unconsciousness (3). (G) Median of events in a central channel occurring during ROC following click stimuli. Shaded region is interquartile range. (H) Timecourse of ERP amplitudes in the same individual subject: boxplot indicates variability of mean ERP amplitude across individual trials. LPs selectively appear during emergence, and are evoked by the infrequent word and name stimuli (orange, green), but not by the frequent noise bursts (black). Stars indicate significance at p<0.01 with Wilcoxon signed-rank test. This subject exhibits a slow emergence with LPs appearing around and after the initial onset of ROC. (I) Boxplot of absolute value of mean ERP amplitude across all subjects estimated within 5 min windows during each epoch. Colored points show individual subjects.
-
Figure 4—source data 1
Mean ERP for each EEG subject (baseline).
- https://doi.org/10.7554/eLife.33250.011
-
Figure 4—source data 2
Mean ERP for each EEG subject (post LOC).
- https://doi.org/10.7554/eLife.33250.012
-
Figure 4—source data 3
Mean ERP for each EEG subject (post ROC).
- https://doi.org/10.7554/eLife.33250.013
-
Figure 4—source data 4
Mean ERP for each EEG subject (pre ROC).
- https://doi.org/10.7554/eLife.33250.014
Figure 4—figure supplement 1
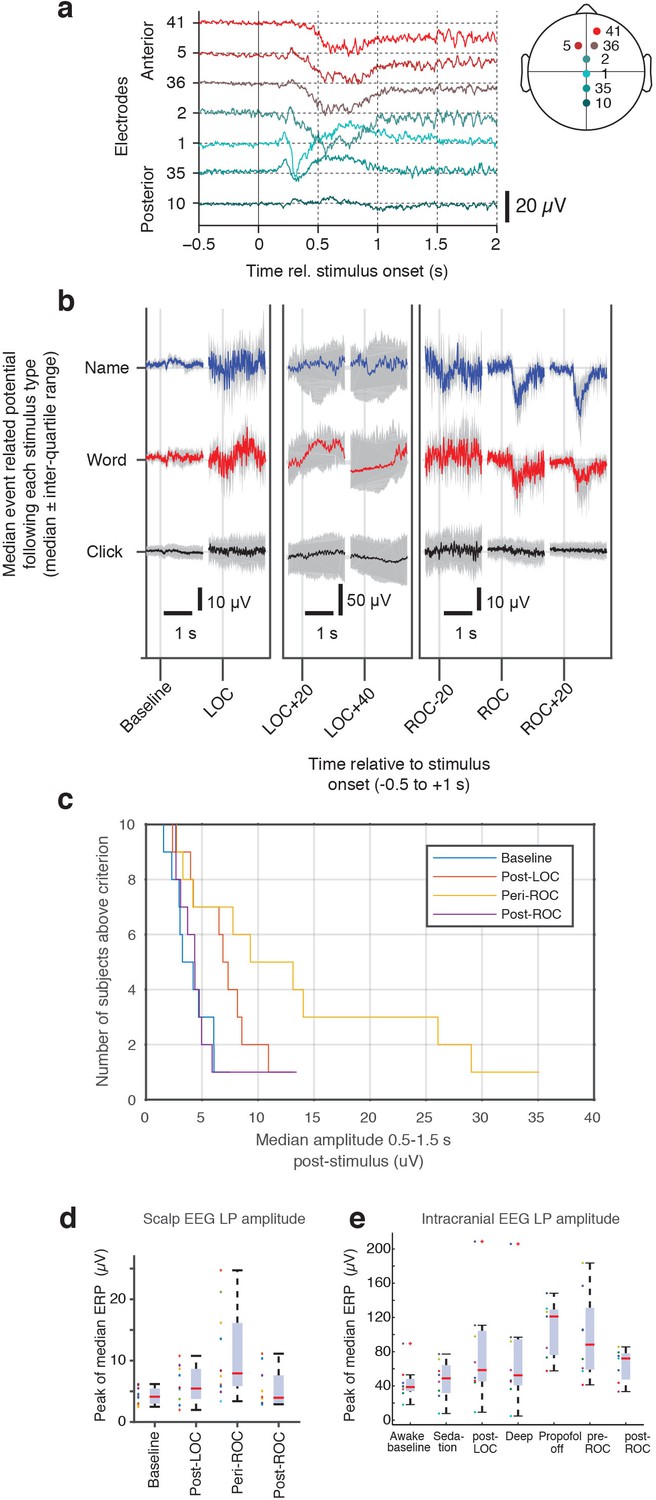
Evoked potentials in scalp EEG dataset.
(A) Anterior-posterior spatial distribution of mean stimulus-evoked scalp LP during ROC. (B) Median stimulus-evoked potential in a representative subject who exhibited LPs: LPs are observed selectively during ROC in response to name and word stimuli, as seen by the median potential (red and blue, right panel). During LOC and anesthesia, variability is high and no mean evoked response is observed. (C) Distribution of number of subjects who exhibit LPs as the threshold for detection is varied. LPs are primarily observed around ROC, and lowering the threshold allows them to be detected in additional subjects (but with less selectivity for the high-LP state during the ROC epoch). (D) LP magnitude across all subjects in the scalp EEG dataset, calculated as the peak magnitude of the median ERP, shows increased LP appearance around the time of ROC. (E) The same peak calculation across all subjects in the intracranial EEG dataset also exhibits the largest LPs during emergence and around the time of ROC. One subject shows large peak values after LOC as well; this is due to insufficient trial numbers in this dataset for averaging away the effect of large spontaneous slow oscillations, biasing the peak computation.
Figure 5 with 1 supplement
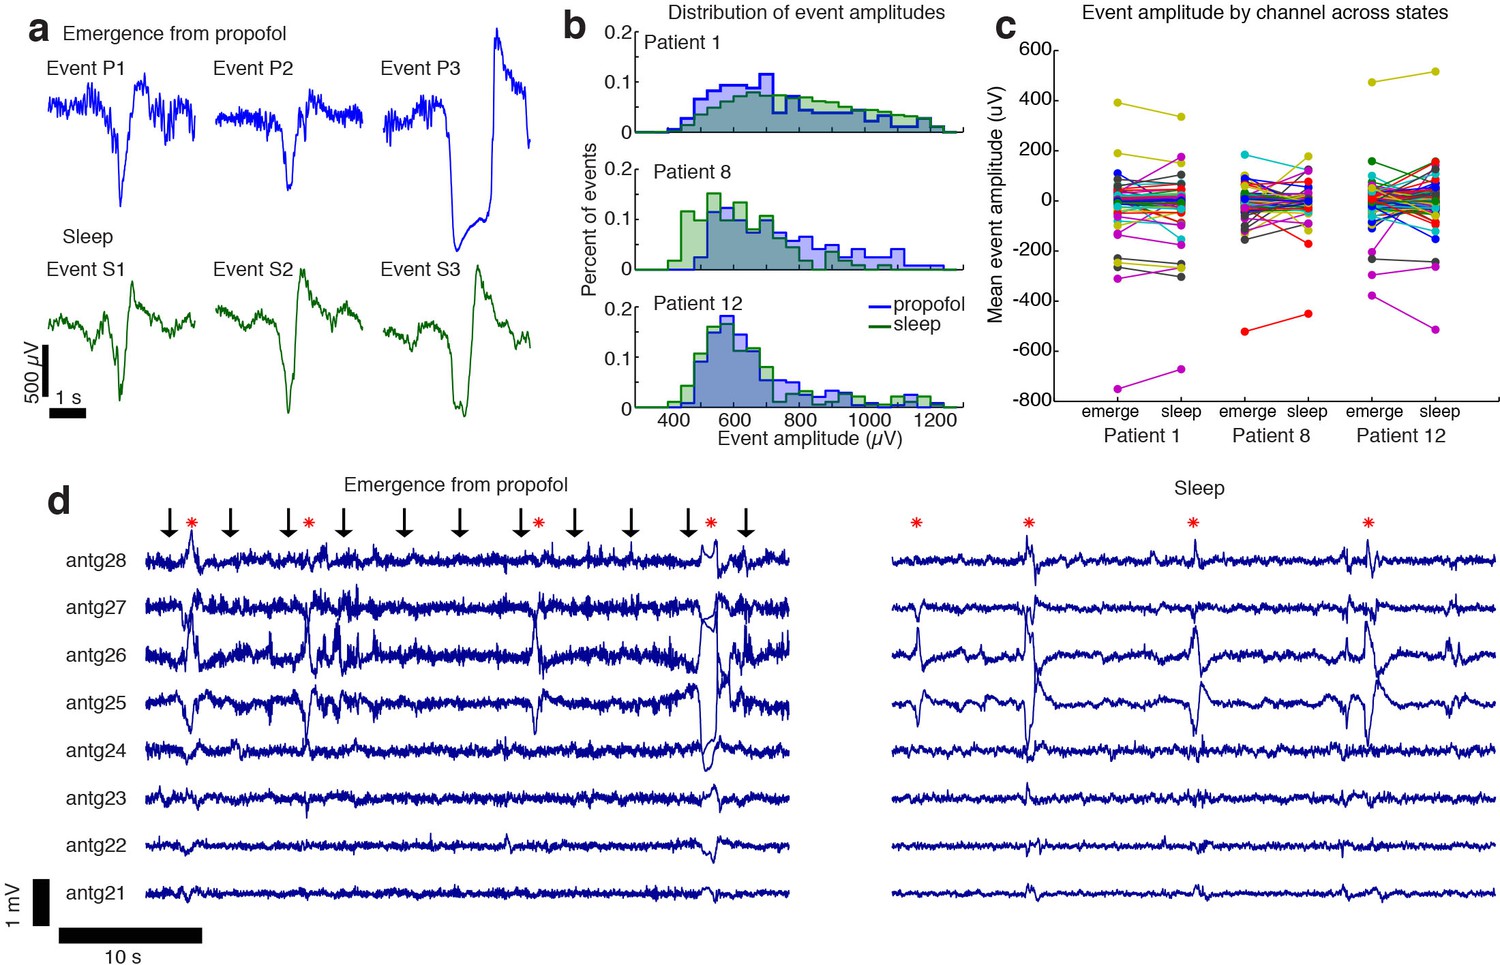
The events observed during propofol emergence resemble K-complexes seen during natural sleep.
(A) Example traces of automatically detected events on a single channel during propofol emergence and during sleep in the same subject. (B) Distribution of absolute value of event amplitudes in emergence and in sleep. Waveform distributions are very similar across the two datasets. (C) The amplitude of the mean event on individual channels is highly consistent across sleep and emergence; large values are the channels with large LPs. Channels with large LPs consistently also show large KCs; channels with no LPs (near-zero amplitudes) do not have large KCs during sleep. In each patient, the spatial profile of events is highly consistent across sleep and emergence. (D) Timeseries across eight grid channels during emergence and during sleep demonstrates that the LPs typically occur on the same channels and with the same polarity as the KCs seen in natural sleep. Red stars indicate events detected on multiple channels; black arrows show timing of auditory stimuli.
-
Figure 5—source data 1
Channelwise peak amplitudes (Patient 1).
- https://doi.org/10.7554/eLife.33250.017
-
Figure 5—source data 2
Channelwise peak amplitudes (Patient 8).
- https://doi.org/10.7554/eLife.33250.018
-
Figure 5—source data 3
Channelwise peak amplitudes (Patient 12).
- https://doi.org/10.7554/eLife.33250.019
Figure 5—figure supplement 1
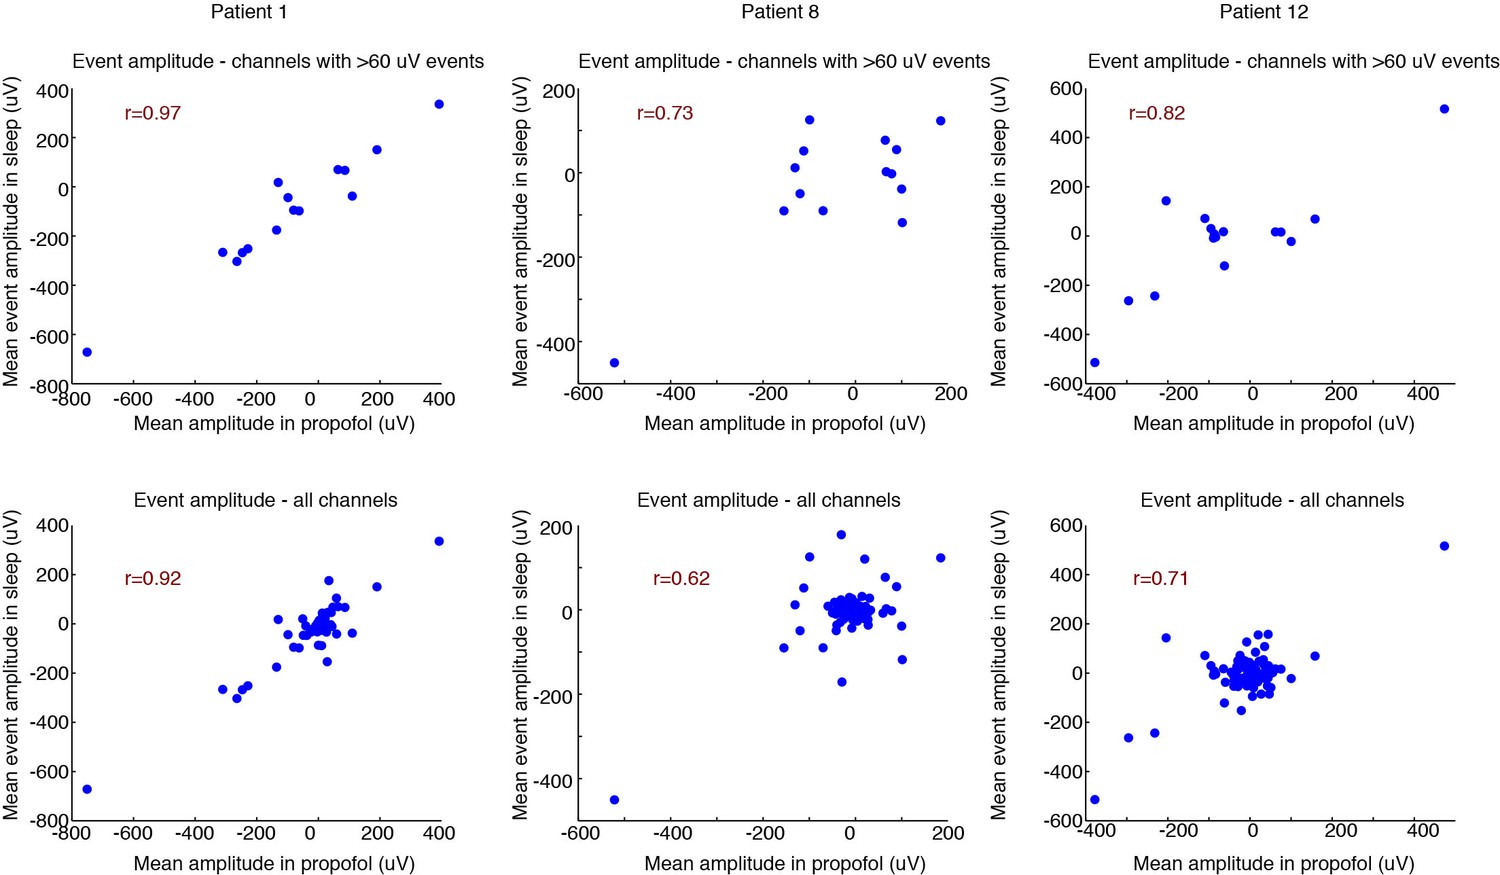
Correlated spatial properties of events across emergence and sleep.
Top row: correlation for each patient of the mean event amplitude across electrodes in emergence vs. sleep. This analysis includes only channels where the mean event in the propofol condition was > 60 µV, indicating channels that exhibited a robust LP. Consistent correlations demonstrate that the spatial distribution of LPs in emergence is very similar to KCs during sleep. In this context, channels with large values are channels with large LP signals (rather than noisy or outliers). 95% confidence intervals from bootstrap are significant in 2/3 subjects; Pearson’s test significant in 3/3 subjects (95% bootstrap CIs: [0.87 1], [−0.26 0.94], [0.25 0.95]; 95% Pearson CIs: [0.90 0.99], [0.33 0.91], [0.56 0.94]). Bottom row: same analysis, including all channels. 95% confidence intervals from bootstrap are significant in 2/3 subjects; Pearson’s test significant in 3/3 subjects (95% bootstrap CIs: [0.74 0.97], [−0.15 0.87], [0.15 0.88]; 95% Pearson CIs: [0.88 0.95], [0.47 0.74], [0.60 0.79]). Central cloud demonstrates channels with no LP. These channels also tend to exhibit no KCs (near-zero value on y-axis), demonstrating that channels without LPs also tend to be channels without KCs.
Figure 6
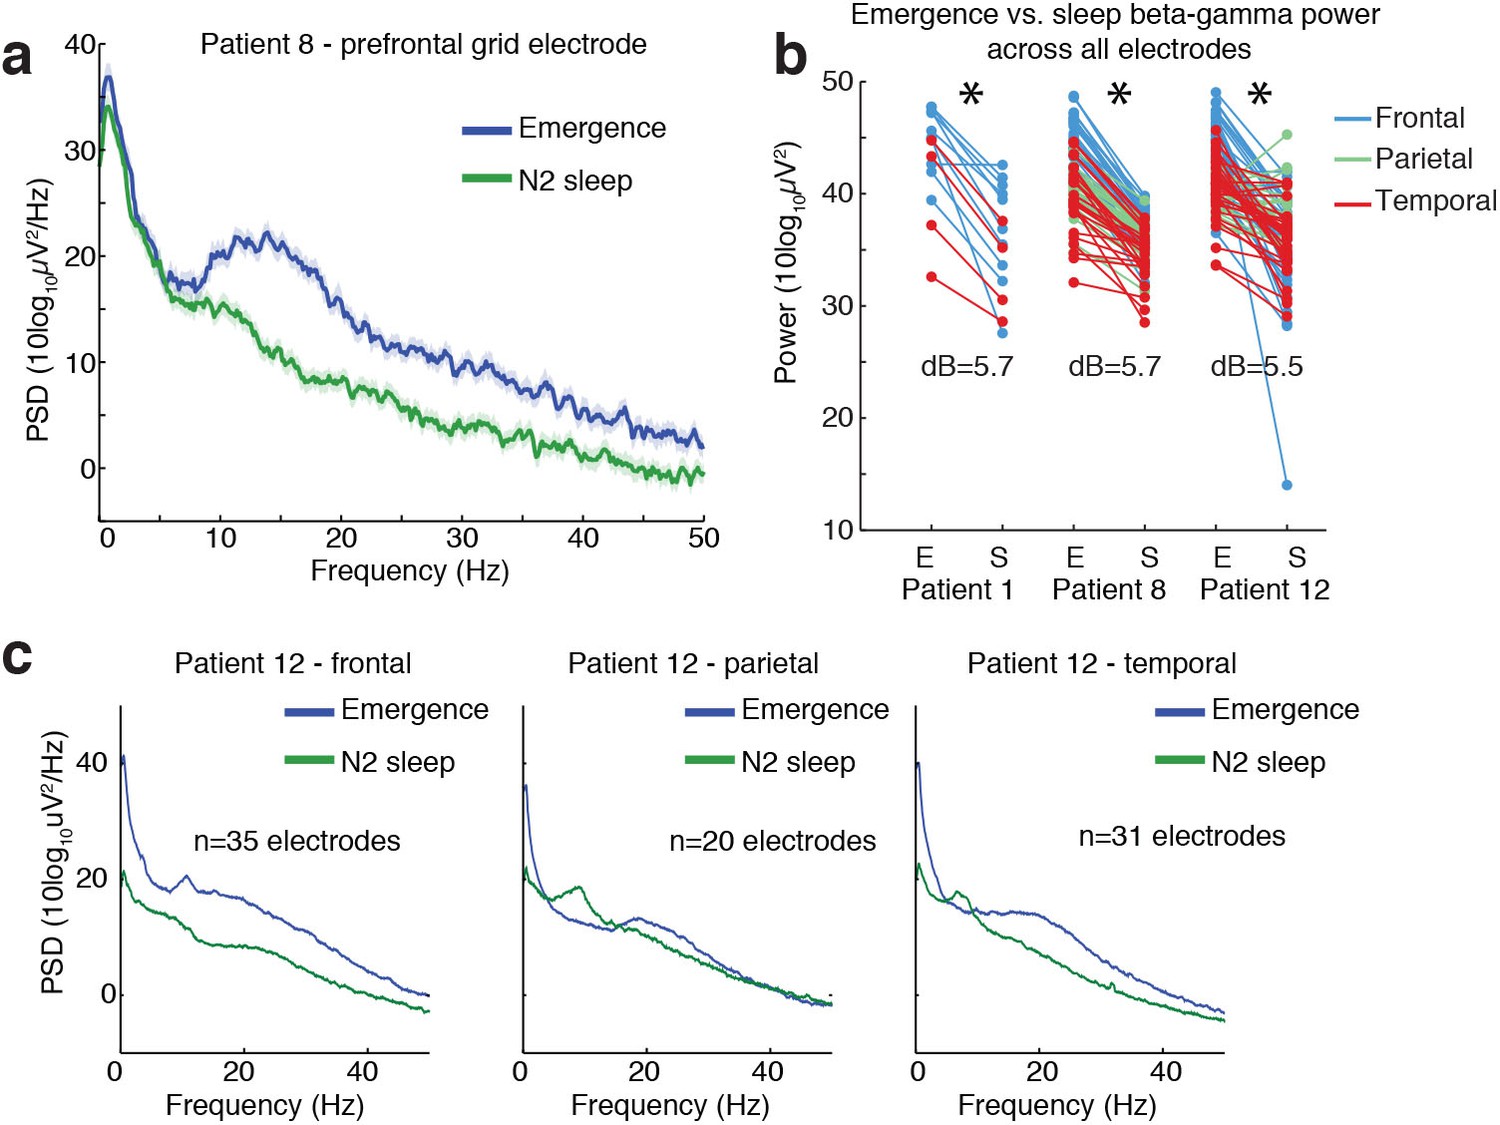
Ongoing electrophysiological dynamics differ between sleep and emergence.
(A) Example spectrum from a single channel: emergence is associated with stronger broadband power at frequencies >10 Hz than N2 sleep. (B) Difference in 10–40 Hz power across all electrodes in emergence (E) vs. N2 sleep (S), categorized by anatomical location: power is significantly lower across all electrodes during sleep in each subject (p<0.001, signed-rank test). (C) Spatial profile of dynamics in a single patient categorized by spatial location: while alpha and spindle dynamics vary spatially, 10–40 Hz power is elevated during emergence across a broad cortical region.
Additional files
-
Transparent reporting form
- https://doi.org/10.7554/eLife.33250.021
Download links
A two-part list of links to download the article, or parts of the article, in various formats.
Downloads (link to download the article as PDF)
Open citations (links to open the citations from this article in various online reference manager services)
Cite this article (links to download the citations from this article in formats compatible with various reference manager tools)
A transient cortical state with sleep-like sensory responses precedes emergence from general anesthesia in humans
eLife 7:e33250.
https://doi.org/10.7554/eLife.33250


