Multiple kinases inhibit origin licensing and helicase activation to ensure reductive cell division during meiosis
- Massachusetts Institute of Technology, United States
- Howard Hughes Medical Institute, United States
- Columbia University Medical Center, United States
Figures
Figure 1 with 3 supplements
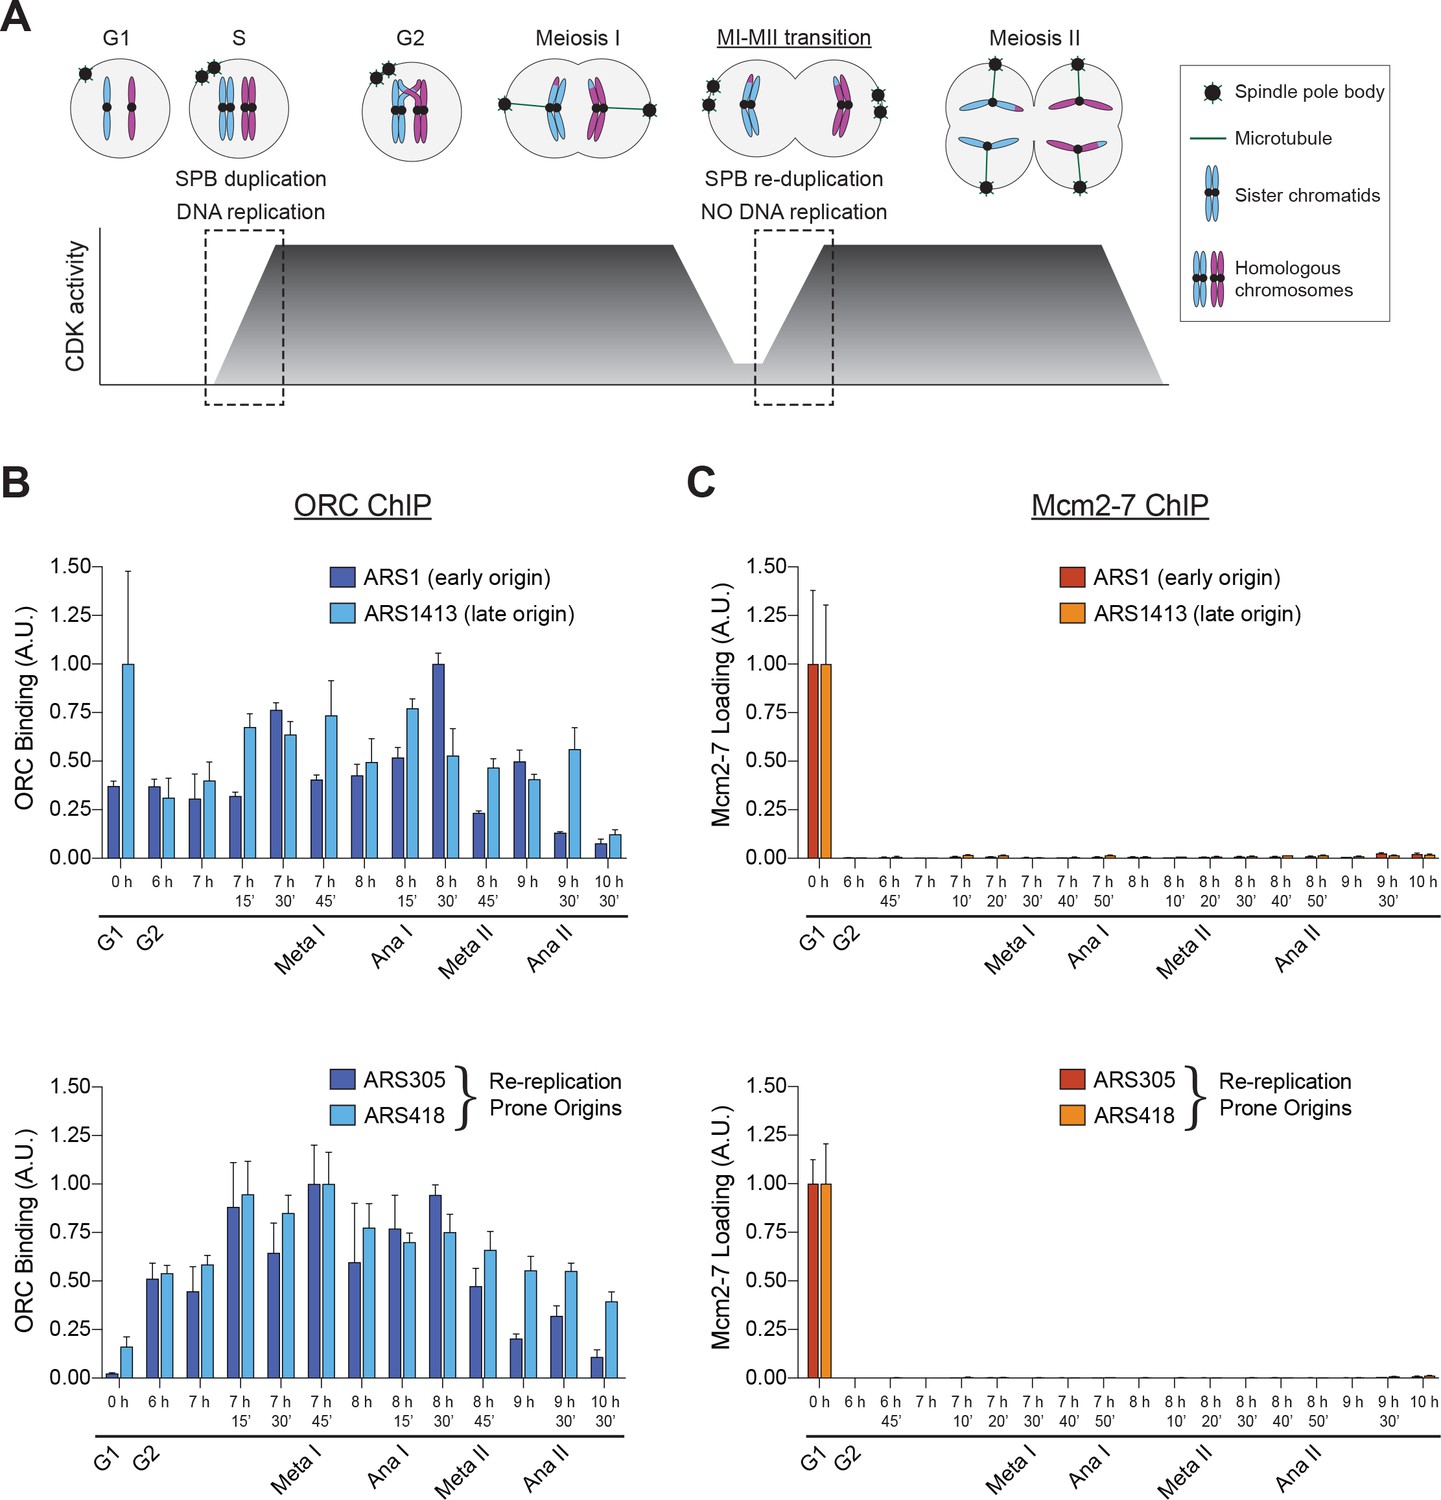
Mcm2–7 loading onto replication origins is inhibited during the MI–MII transition.
(A) The DNA replication program and chromosome segregation program are uncoupled during the MI–MII transition. Relative CDK activity at various stages of the meiotic cell cycle are shown (Carlile and Amon, 2008). The dashed boxes highlight the oscillations of low-to-high CDK activity during meiosis, and show the discrepancy between CDK-regulation of SPB duplication and DNA replication. See text for details. (B) ORC is bound to origins of replication throughout the meiotic divisions. The strain yDP71 was put through meiosis. ChIP–qPCR was used to detect ORC binding at the early–firing origin ARS1 (top graph, dark blue), the late–firing origin ARS1413 (top graph, light blue), and at the re–replication prone origins ARS305 (bottom graph, dark blue) and ARS418 (bottom graph, light blue). The time after transfer into sporulation medium and the associated meiotic stages are indicated below each lane. For cell–cycle stage quantification for this experiment, see Figure 1—figure supplement 1A. The peak % of input DNA immunoprecipitated (set to arbitrary unit (A.U.) =1.0) was 9.1% for ARS1, 2.2% for ARS1413, 46.7% for ARS305, and 10.9% for ARS418. (C) Mcm2–7 is bound to origins of replication in G1 phase but does not reassociate with origins during or between the meiotic divisions. The strain yDP71 was put through meiosis. ChIP–qPCR was used to detect Mcm2–7 binding at the early–firing origin ARS1 (top graph, red), the late–firing origin ARS1413 (top graph, orange), and at the re–replication prone origins ARS305 (bottom graph, red) and ARS418 (bottom graph, orange). The time after transfer into sporulation medium and the associated meiotic stages are indicated below each lane. For cell–cycle stage quantification for this experiment, see Figure 1—figure supplement 1B. The peak % of input DNA immunoprecipitated (set to A.U. = 1.0) was 7.4% for ARS1, 5.0% for ARS1413, 35% for ARS305, and 19.5% for ARS418.
-
Figure 1—source data 1
Raw values used for the quantification of Figure 1B and C.
- https://doi.org/10.7554/eLife.33309.006
Figure 1—figure supplement 1
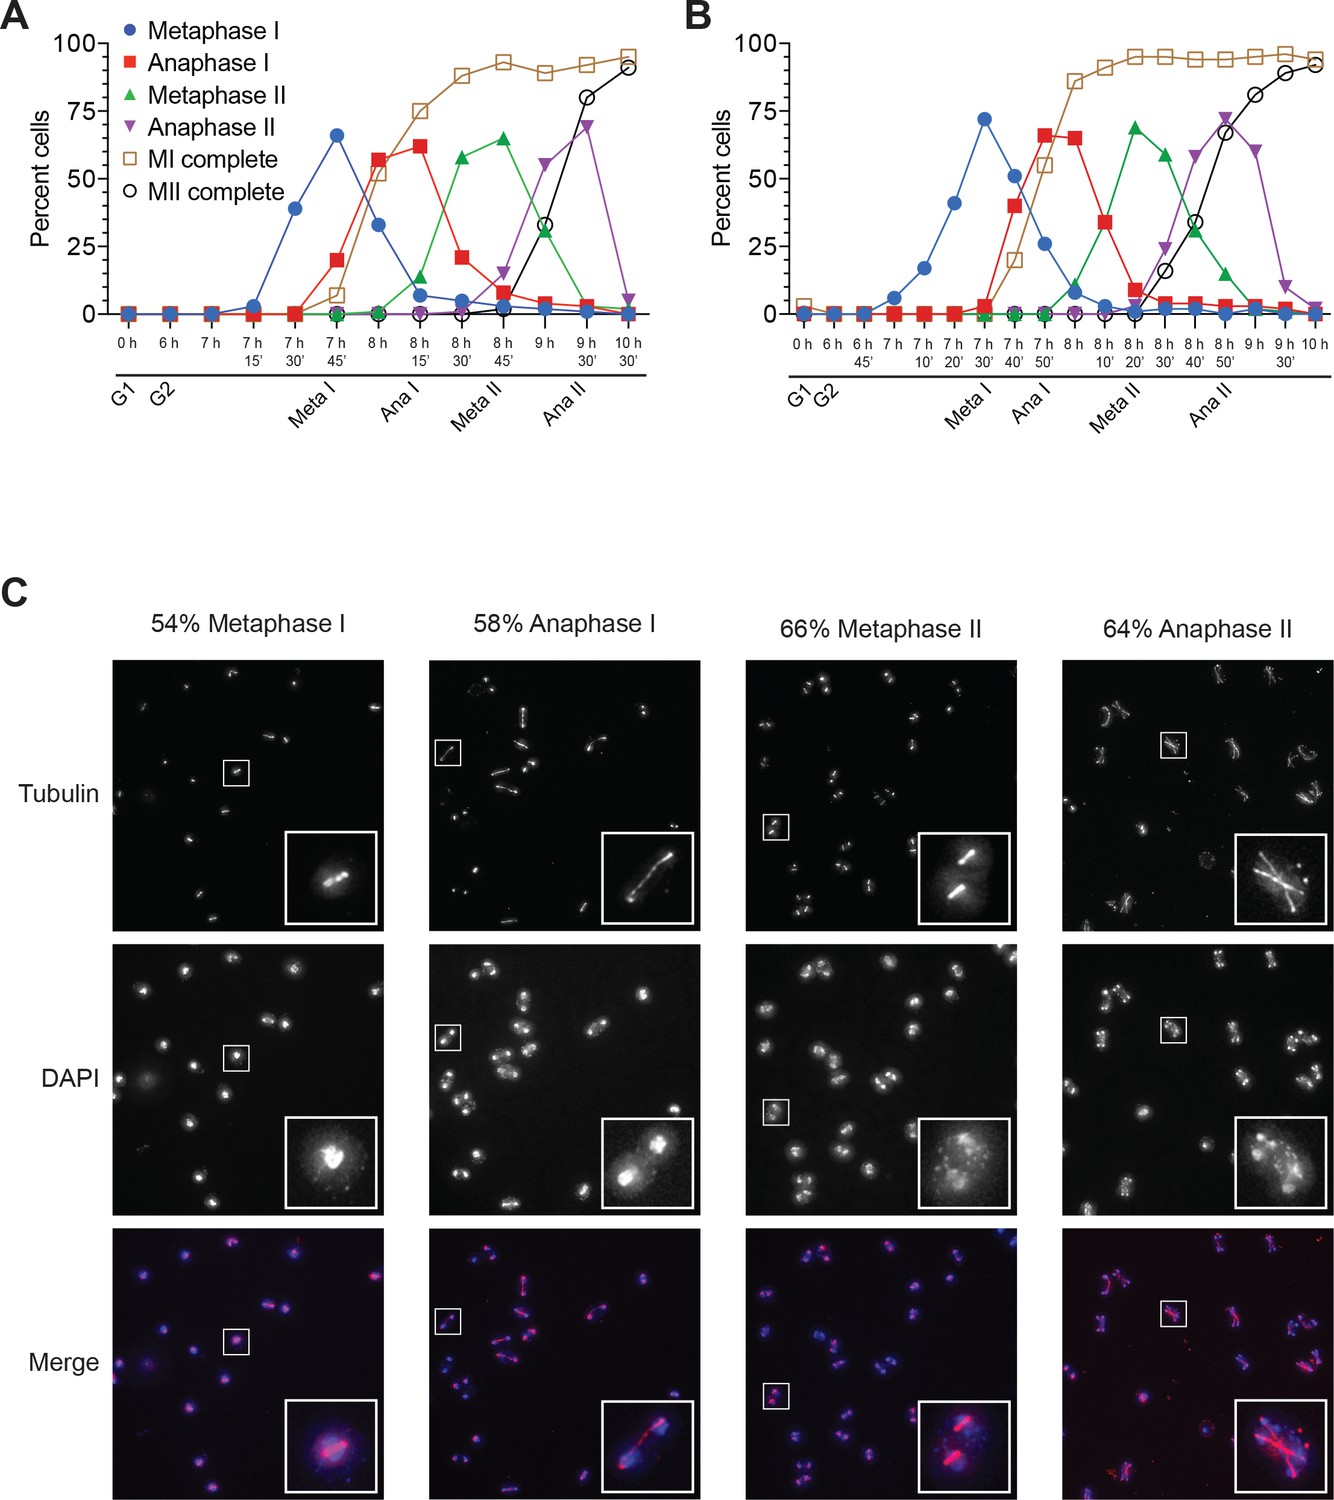
Cells from Figure 1 proceeded synchronously through meiosis.
(A) Cell–cycle stage quantification for Figure 1B. (B) Cell–cycle stage quantification for Figures 1C and 2A. (C) Representative micrographs from a separate experiment showing the peak time point of metaphase I, anaphase I, metaphase II, and anaphase II. Insets show an enlarged cell from that cell-cycle stage. Percent of cells in that stage written above the micrographs (based on counting 100 cells). Top: tubulin, middle: DAPI, bottom: merge (red = tubulin, blue = DAPI).
Figure 1—figure supplement 2
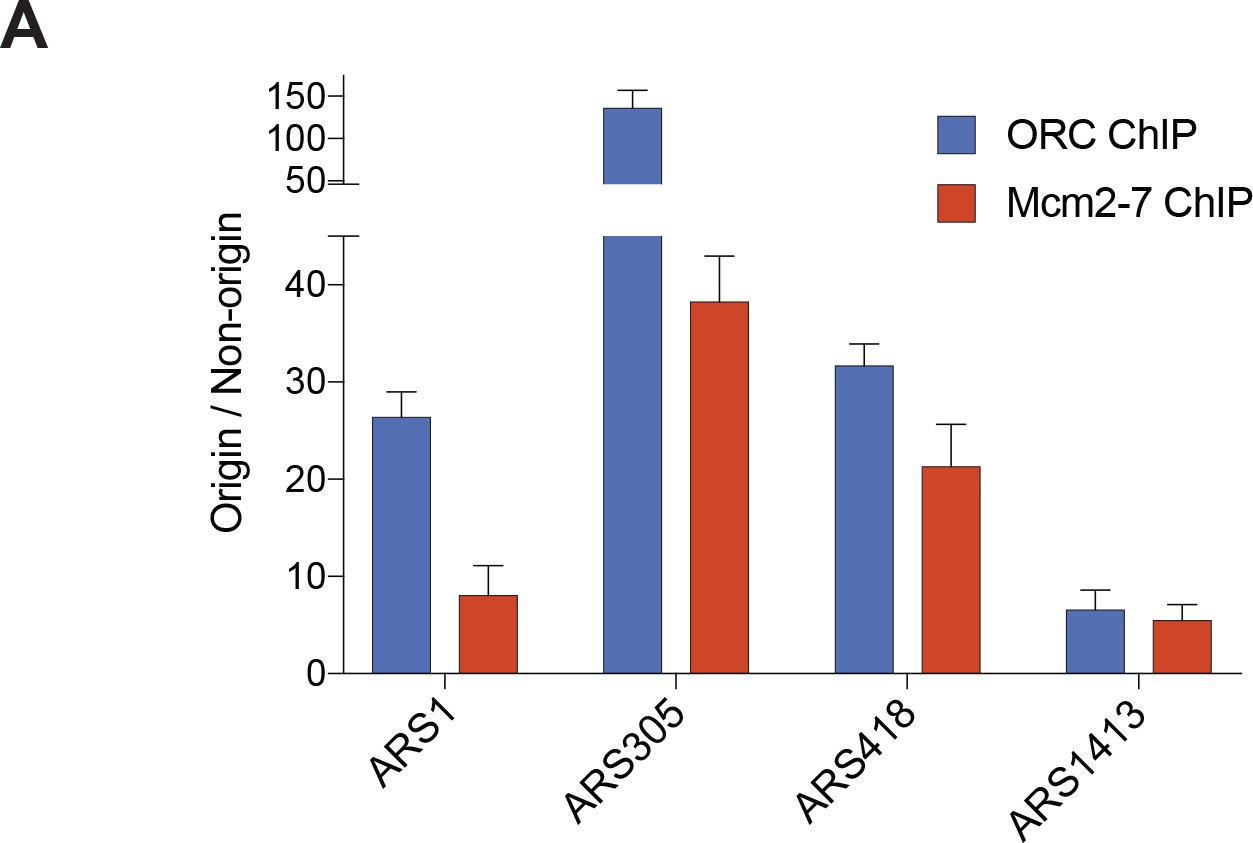
Both ORC and Mcm2-7 associate specifically with origins of replication compared to non-origin DNA.
(A) Enrichment of DNA immunoprecipitated (as a percent of input) was compared at different origins of replication relative to non-origin control DNA (URA3 locus). For ORC, the G2 ChIP was compared between each replication origin and URA3. For Mcm2-7, the G1 ChIP was compared between each replication origin and URA3.
Figure 1—figure supplement 3

Mcm2–7, Cdt1, and Orc1 proteins are present throughout meiosis.
(A) Top: Immunoblots showing that Mcm2, Mcm3, Mcm6, Mcm7, Cdt1, and Orc1 are present at constant levels throughout meiosis (strain yDP71). Pgk1 and Ponceau are shown as loading controls. Bottom: Cell–cycle stage quantification.
Figure 2 with 1 supplement
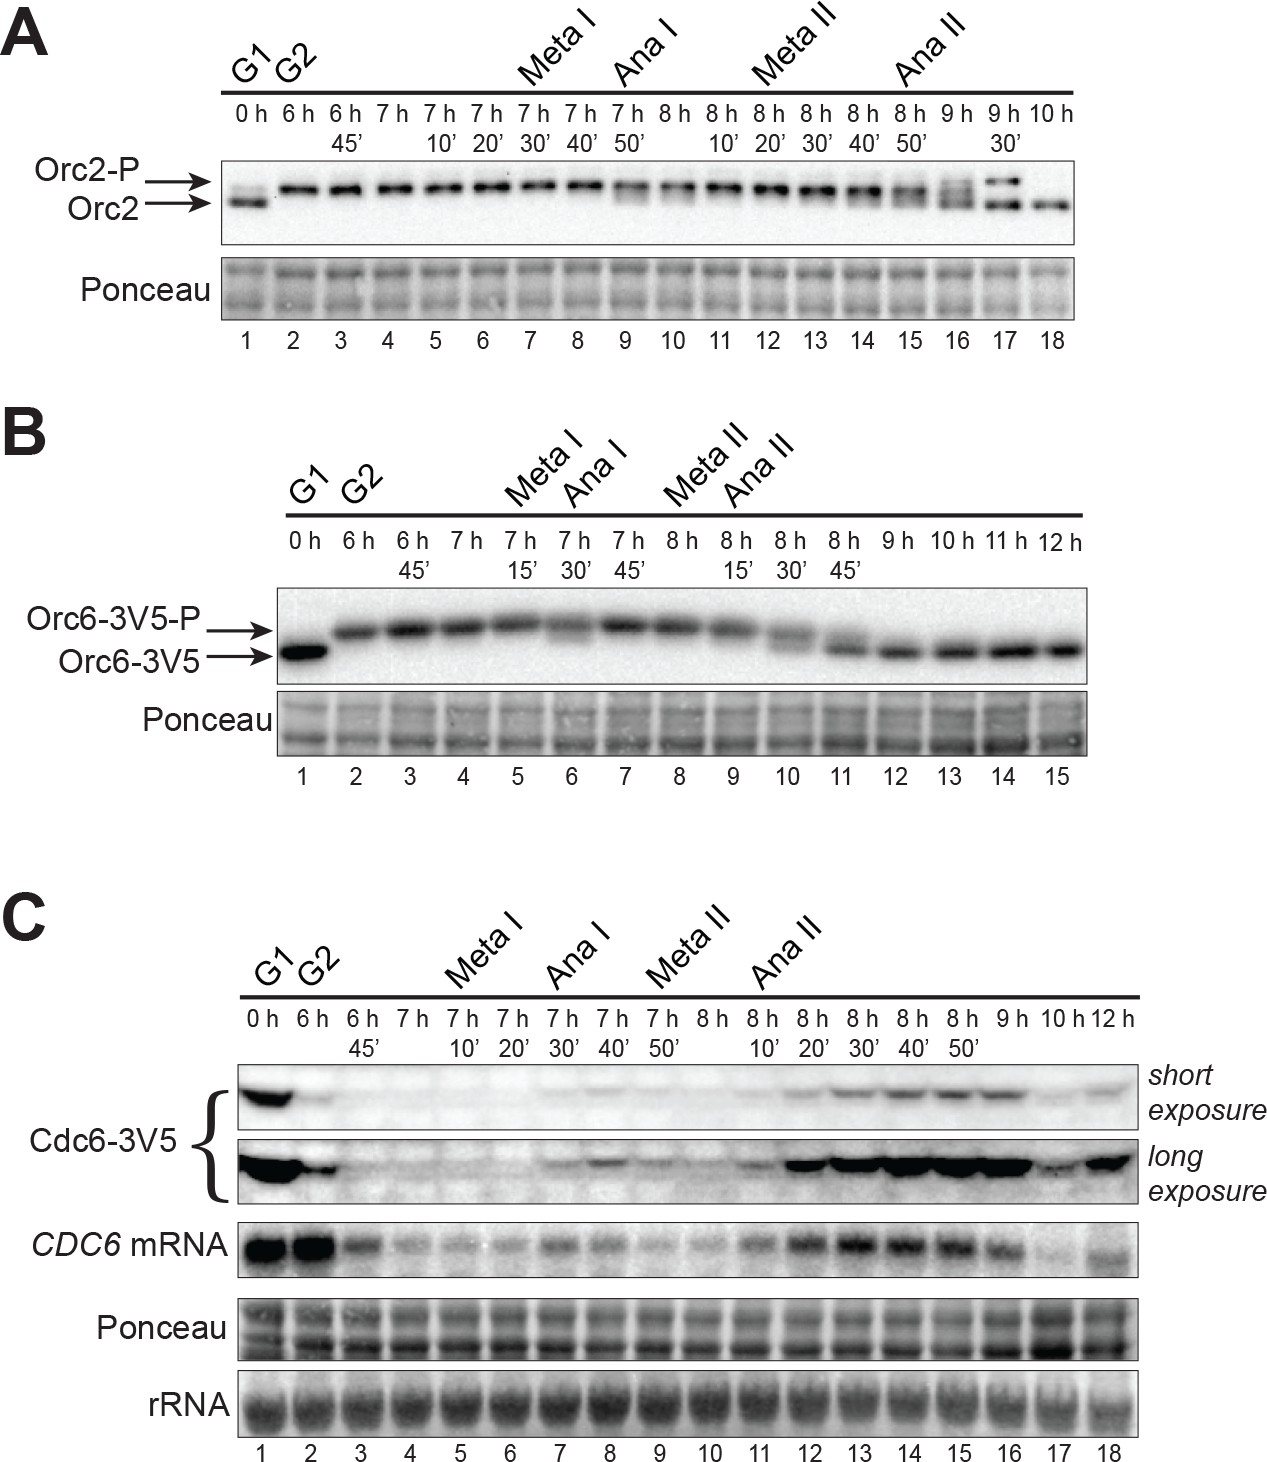
CDK-dependent inhibitory mechanisms are weakened during the MI–MII transition.
(A) Orc2 (strain yDP71) and (B) Orc6 (strain yDP120) are both transiently dephosphorylated during the MI–MII transition. ORC was detected by immunoblot during meiosis. A phosphorylation–dependent shift in electrophoretic-mobility reveals Orc2 and Orc6 phosphorylation states. The time after transfer into sporulation medium and the associated meiotic stages are indicated above each lane. For cell–cycle stage quantification, see Figure 1—figure supplement 1B (Orc2) and Figure 2—figure supplement 1A (Orc6). (C) CDC6 protein and mRNA transiently reaccumulate during the MI–MII transition (strain yDP71). Top: Cdc6 immunoblots (short and long exposures) during meiosis. Bottom: CDC6 mRNA levels were detected by northern blots during meiosis. The time after transfer into sporulation medium and the associated meiotic stages are indicated above each lane. For cell–cycle stage quantification, see Figure 2—figure supplement 1B.
Figure 2—figure supplement 1
Cells from Figure 2 proceeded synchronously through meiosis.
(A) Cell–cycle stage quantification for Figure 2B. (B) Cell–cycle stage quantification for Figure 2C.
Figure 3 with 2 supplements
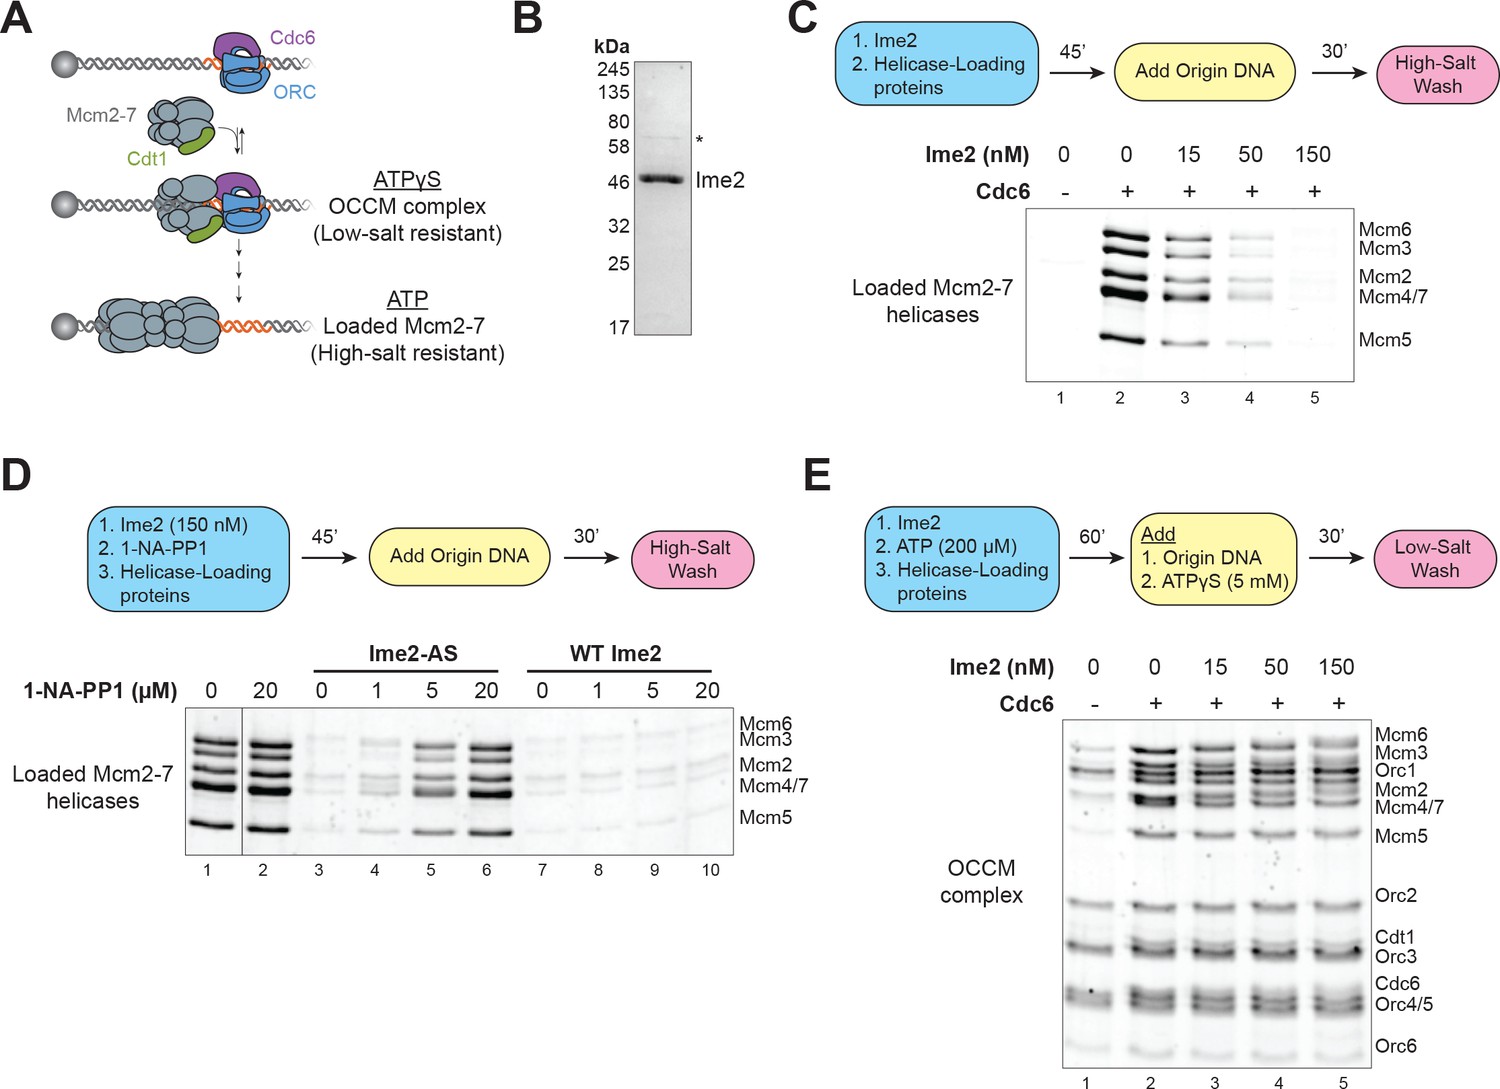
Ime2 is sufficient to inhibit helicase loading in vitro.
(A) Diagram of helicase–loading and OCCM–complex–formation assays. Origin–containing DNA (red) is bound to a magnetic bead. Origin bound ORC–Cdc6 complexes recruit Cdt1–Mcm2–7 heptamers to form the OCCM complex. In ATPγS, the reaction stops at this point, and the whole complex is stable in low–salt washes. In ATP, helicase loading proceeds to completion resulting in Mcm2–7 complexes encircling the DNA that are stable in high–salt washes. (B) Purification of Ime2stable–3XFlag. Asterisk (*) marks a slight contaminant. (C) Pre–incubation of Ime2 with the helicase–loading proteins inhibits Mcm2–7 loading onto replication origins in vitro. Top: Flowchart of experiment. Bottom: Helicase–loading assay at the indicated Ime2 concentration. Reaction lacking Cdc6 (lane 1) shows that Mcm2–7 complex DNA association depends on the helicase–loading reaction. (D) Ime2 inhibition of Mcm2–7 loading depends on its kinase activity. Top: Flowchart of experiment. Bottom: Helicase–loading assay. Purified Ime2–AS (150 nM) can inhibit Mcm2–7 loading (lane 3), and this inhibition can be prevented by increasing 1–NA–PP1 concentration (lanes 3–6). Wild–type Ime2 can inhibit Mcm2–7 loading regardless of 1–NA–PP1 concentration (lanes 7–10). (E) Ime2 cannot inhibit Mcm2–7-Cdt1 recruitment to ORC-Cdc6 in ATPγS. Top: Flowchart of experiment. Bottom: OCCM–complex–formation assay at the indicated Ime2 concentration (lanes 2–5). Mcm2–7-Cdt1 recruitment depends on Cdc6 (lane 1).
Figure 3—figure supplement 1
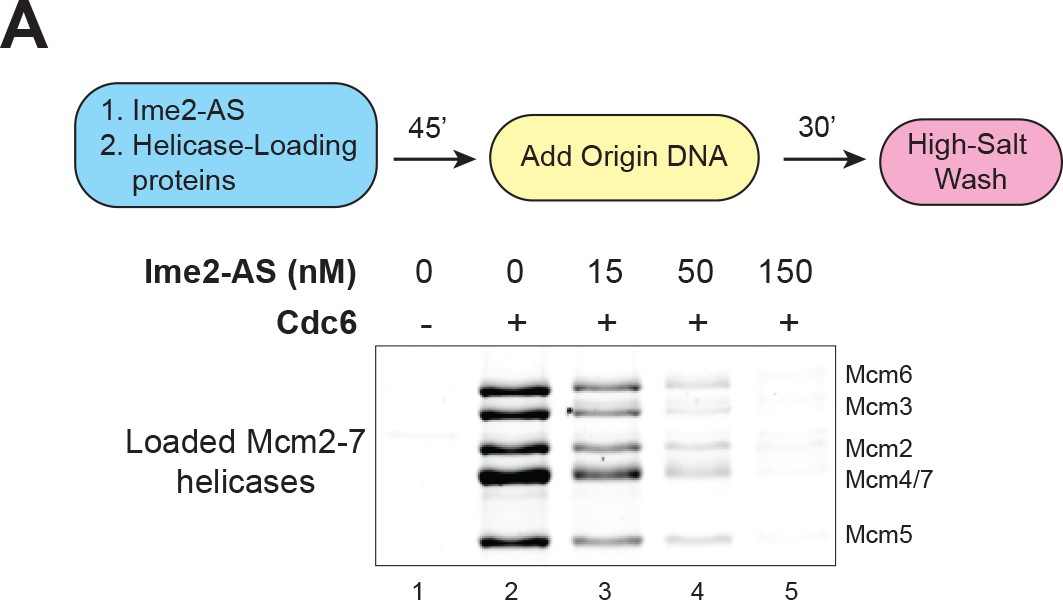
Ime2-AS inhibits helicase loading.
(A) Ime2–AS can inhibit Mcm2–7 loading to a similar extent as wild–type Ime2 (compare to Figure 3C). Top: Flowchart of experiment. Bottom: Helicase–loading assay at the indicated Ime2–AS concentration. Reaction lacking Cdc6 (lane 1) shows that Mcm2–7 DNA association depends on the helicase–loading reaction.
Figure 3—figure supplement 2
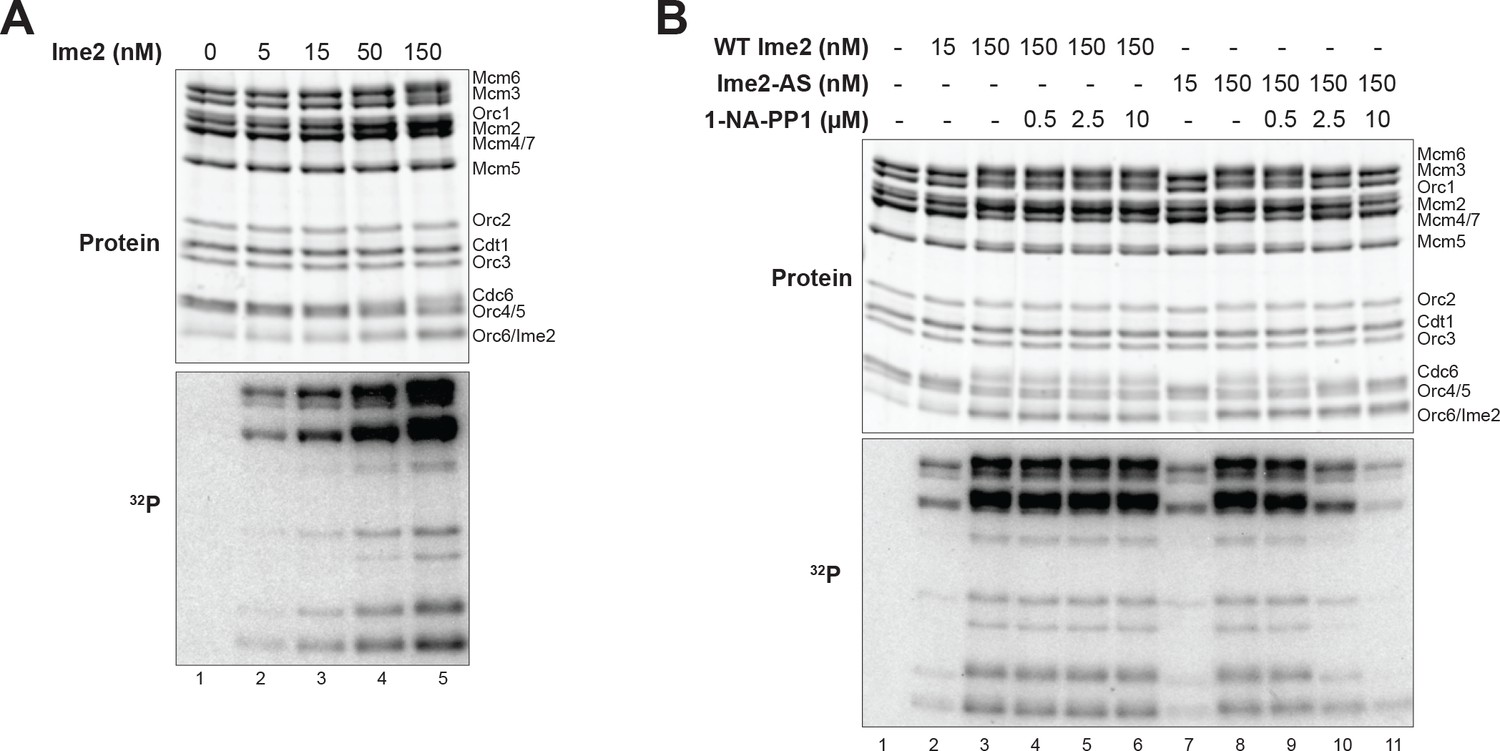
Ime2 kinase activity correlates with inhibition of helicase loading.
(A) Increased Ime2 concentration causes increased phosphorylation of the helicase–loading proteins. Top: total protein (Krypton stain). Bottom: phosphorylated protein (modified with [γ-32P] ATP). (B) In vitro kinase assay with wild-type Ime2 and Ime2–AS, with a titration of 1–NA–PP1. Ime2–AS kinase activity wasinhibited by increasing 1–NA–PP1 concentration (lanes 7–11), but wild-type Ime2 kinase activity was not (lanes 2–6). Top: total protein (Krypton stain). Bottom: phosphorylated protein (modified with [γ-32P] ATP).
Figure 4 with 1 supplement
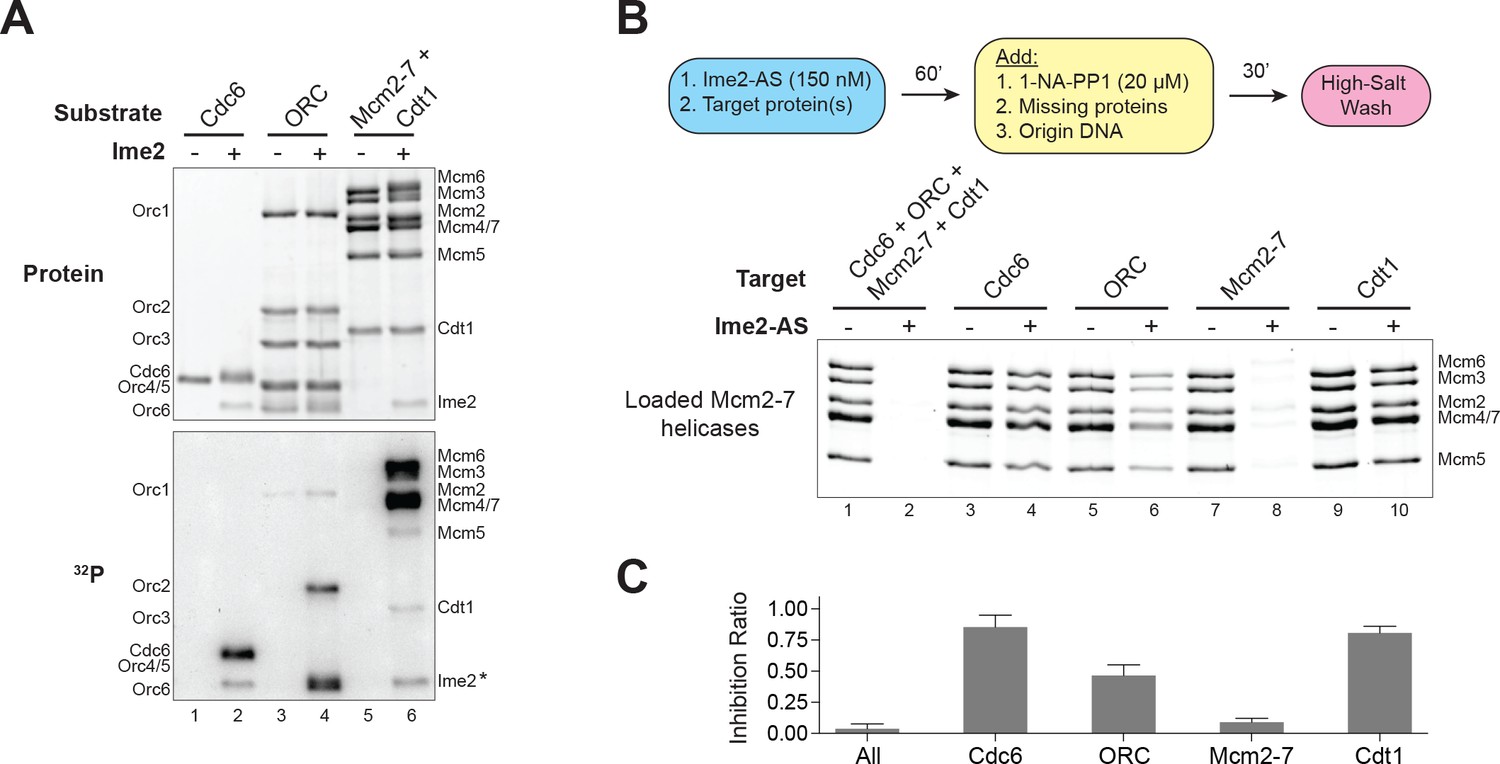
Ime2–phosphorylation of the Mcm2–7 complex intrinsically inhibits its loading onto replication origins.
(A) Ime2 can phosphorylate Cdc6, ORC, Cdt1 and Mcm2–7 in vitro. Buffer control (lanes 1, 3, and 5) or 50 nM Ime2 (lanes 2, 4, and 6) were incubated with the indicated substrate proteins. The substrates were purified Cdc6 (lanes 1 and 2), ORC (lanes 3 and 4) or Mcm2–7–Cdt1 (lanes 5 and 6). Asterisk (*) marks Ime2 autophosphorylation. Top: total protein (Krypton stain). Bottom: phosphorylated protein (modified with [γ-32P] ATP). (B) Ime2–phosphorylation of each protein separately shows that the primary target of Ime2–mediated inhibition is the Mcm2–7 complex (compare lanes 7 and 8). Top: Flowchart of experiment. Bottom: Helicase–loading assay after prior Ime2–phosphorylation of indicated protein. (C) Quantification of (B) from three independent experiments. Inhibition ratio was calculated as total Mcm2–7 loading from the +Ime2 reactions divided by amount of loading in the corresponding reaction lacking Ime2. The mean is represented by the height of the bar. Error bars represent the standard deviation of three independent experiments.
-
Figure 4—source data 1
Raw values used for the quantification of Figure 4C.
- https://doi.org/10.7554/eLife.33309.014
Figure 4—figure supplement 1
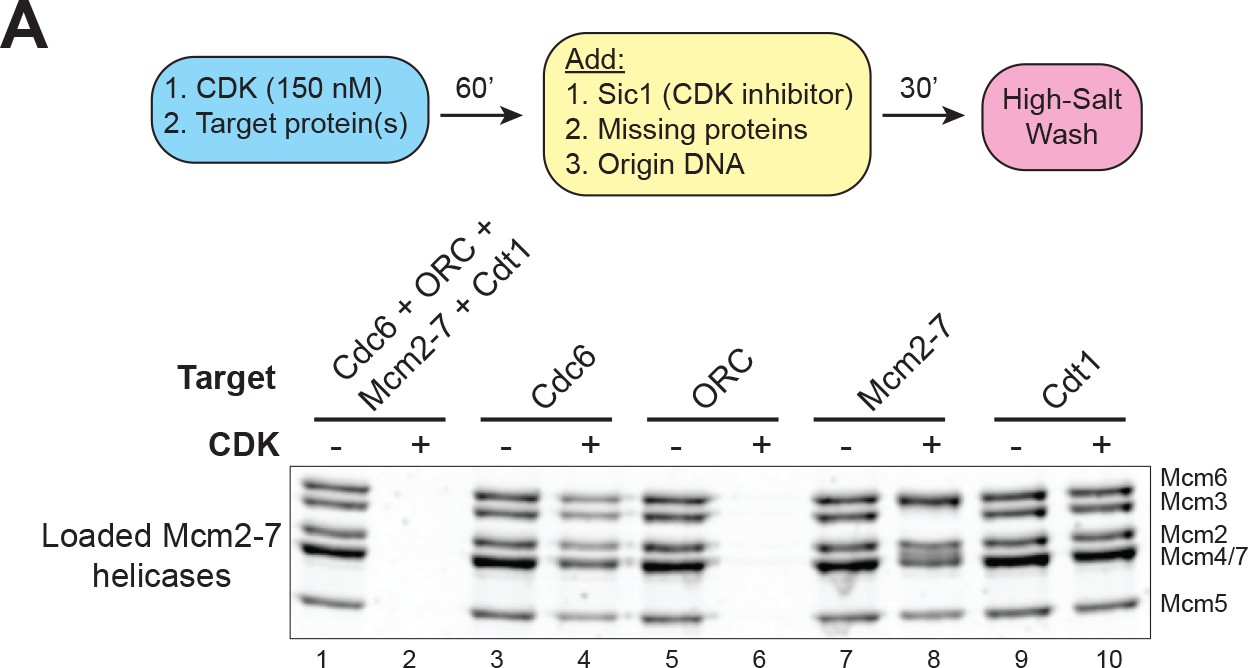
CDK–phosphorylation of ORC intrinsically inhibits helicase loading.
(A) CDK–phosphorylation of each protein separately shows that the primary target of CDK–mediated inhibition is ORC (compare lane 5 and 6). Top: Flowchart of experiment. Bottom: Helicase–loading assay after prior CDK–phosphorylation of the indicated protein.
Figure 5 with 2 supplements
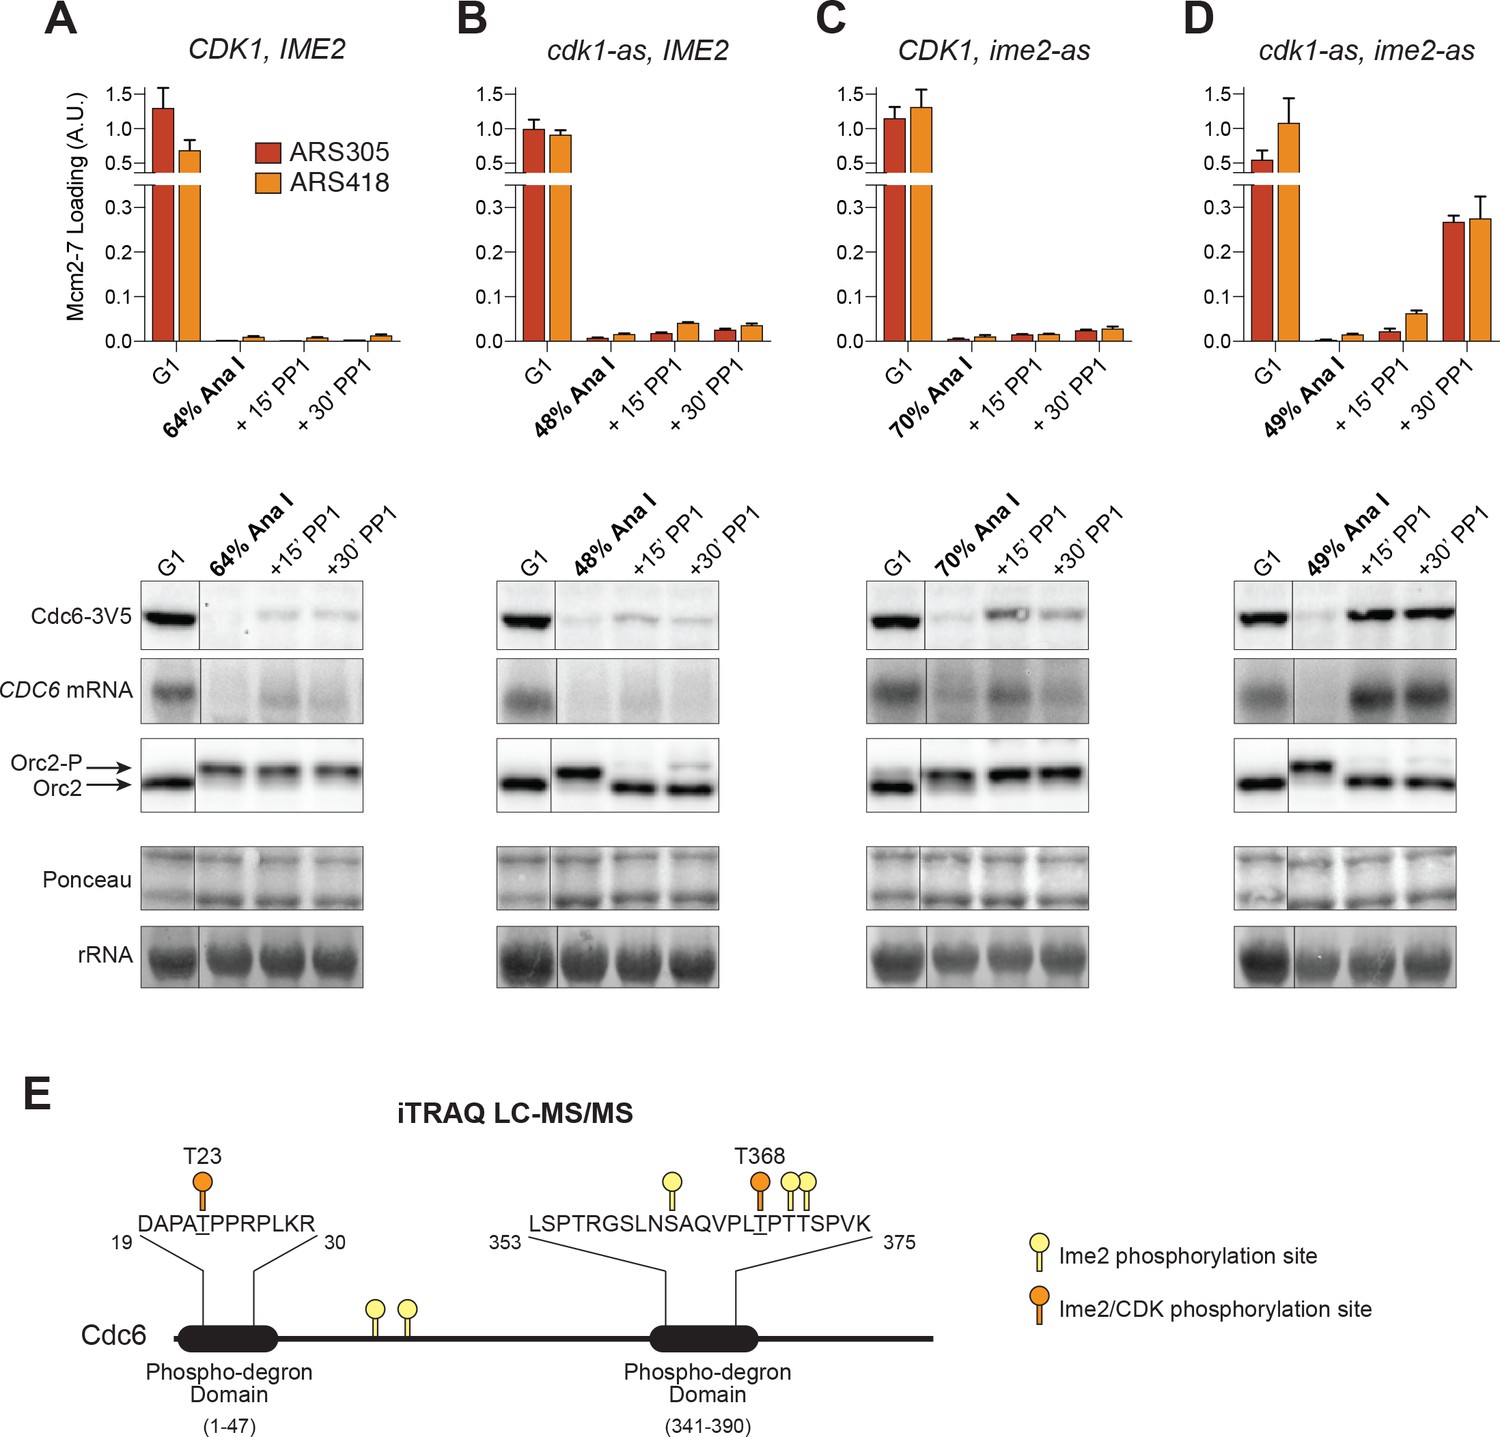
CDK and Ime2 cooperate to prevent Mcm2–7 loading and inhibit CDC6 expression during the MI–MII transition.
Simultaneous inhibition of both CDK and Ime2 is required for robust Mcm2–7 reloading and CDC6 reaccumulation during the MI-MII transition. (A–D): Mcm2–7 loading (ChIP-qPCR), Orc2 phosphorylation (immunoblots), and CDC6 protein and mRNA expression (immunoblots and northern blots) were analyzed in G1 phase as well as at the MI–MII transition. At the MI–MII transition, 10 µM 1–NM–PP1 and 20 µM 1–NA–PP1 were added. Samples were harvested 15 and 30 min after inhibitor addition. (A) Strain yDP71: CDK1, IME2. (B) Strain yDP152: cdk1–as, IME2. (C) Strain yDP176: CDK1, ime2–as. (D) Strain yDP177: cdk1–as, ime2–as. For cell–cycle stage quantification for Figure 5A–5D, see Figure 5—figure supplement 1A–1D, respectively. Mcm2–7 loading was analyzed at ARS305 (red) and ARS418 (orange). The peak % of input DNA immunoprecipitated (set to A.U. = 1.0) was 15.5% for ARS305 and 5.3% for ARS418. (E) Ime2 directly phosphorylates Cdc6 phospho–degron domains. Purified Cdc6 was treated with purified Ime2 or buffer–control in the presence of ATP. Quantitative mass spectroscopy was used to identify Ime2-dependent phosphorylation sites on Cdc6. Phosphorylation sites detected (with >4–fold enrichment upon Ime2 treatment) as well as the location of the Cdc6 phospho–degron domains are illustrated. Yellow markers indicate unique Ime2 sites. Orange markers indicate Ime2 sites that are also CDK sites based on previous work (Calzada et al., 2000; Drury et al., 2000). Phospho-degron domains are based on previous work (Perkins et al., 2001). For phosphorylation–site enrichment values, see Supplementary file 1.
-
Figure 5—source data 1
Raw values used for the quantification of Figure 5A–5D.
- https://doi.org/10.7554/eLife.33309.019
Figure 5—figure supplement 1

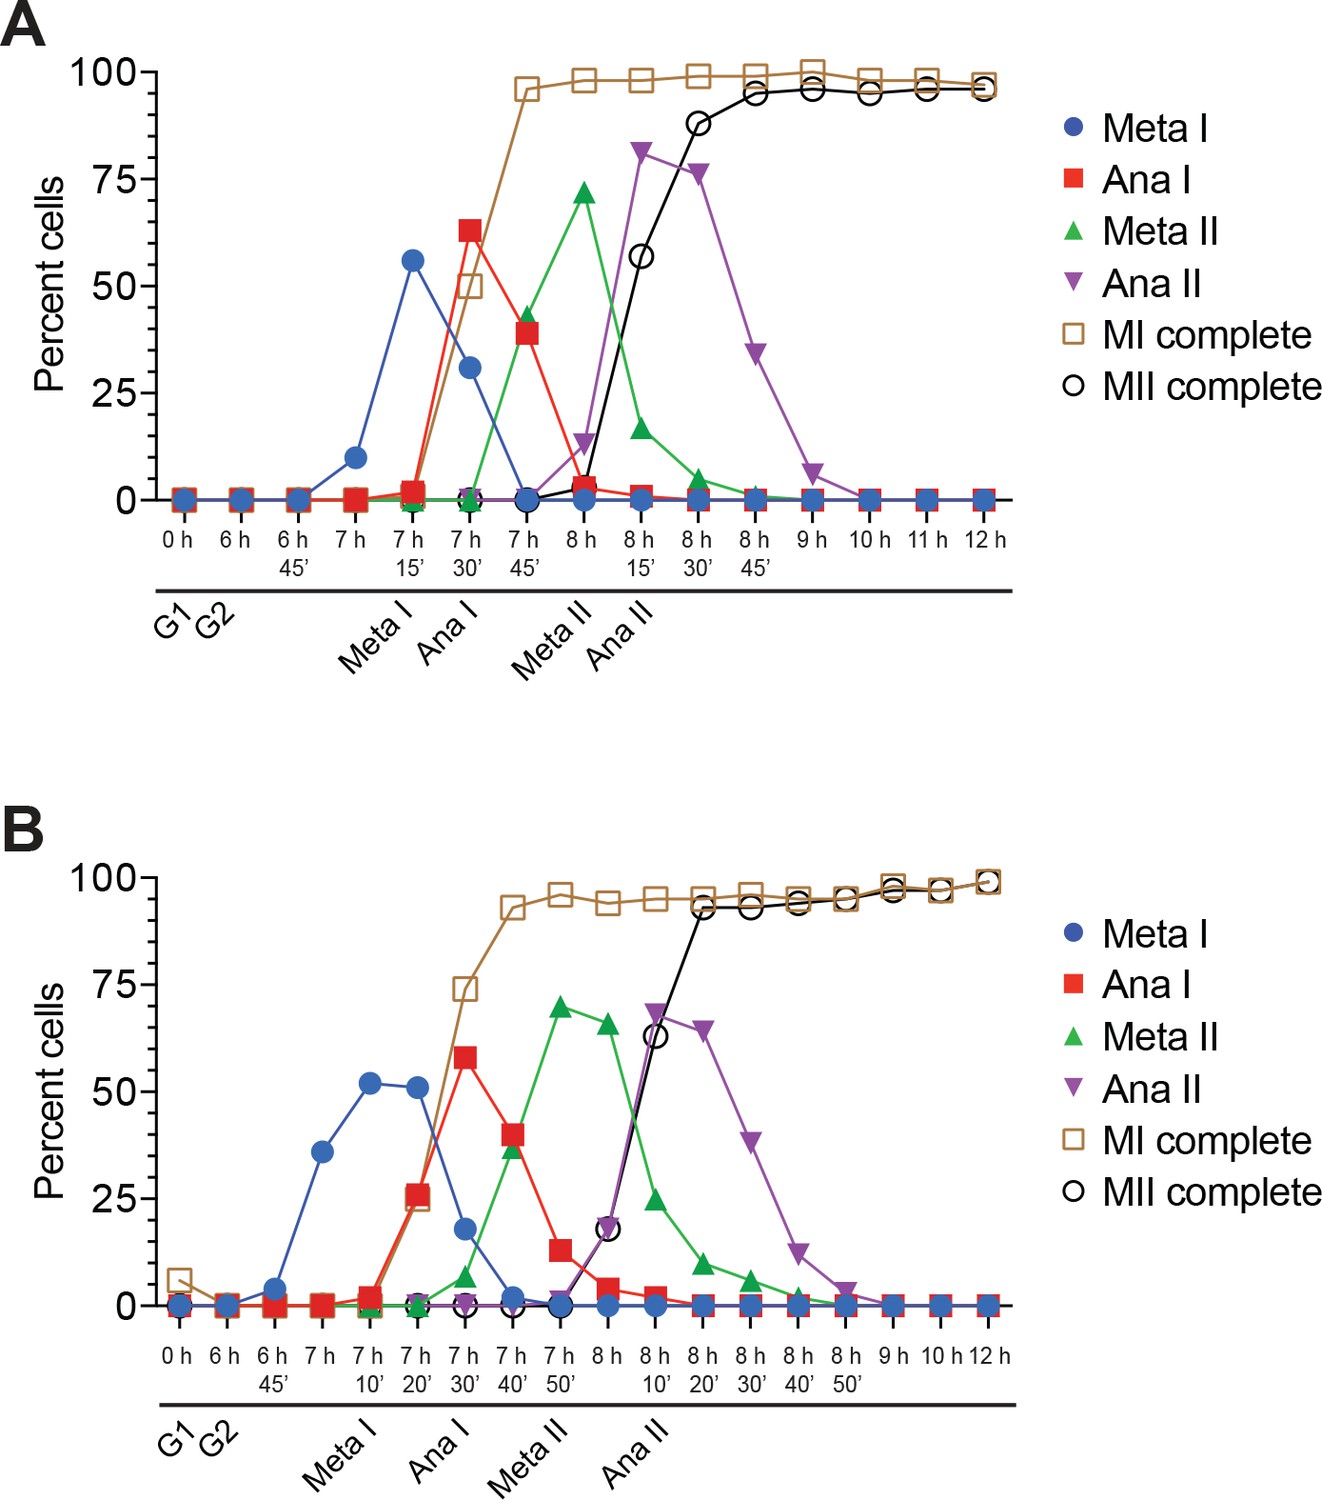
Cells in Figure 5 entered the MI-MII transition at the time of kinase inhibition.
(A–D) Cell–cycle stage quantification for Figure 5A–5D, respectively. At the time of treatment with 10 µM 1–NM–PP1 and 20 µM 1–NA–PP1, all strains had ~50% of cells in Anaphase I. The 8 hr 30’ immunofluorescence time point is from cells in this same experiment that did not receive the kinase-inhibitor treatment, 45 min after the other cells did receive the inhibitor treatment. The purpose of this time point is to demonstrate that all four strains would successfully complete meiosis I had they not been received any kinase inhibitor.
Figure 5—figure supplement 2
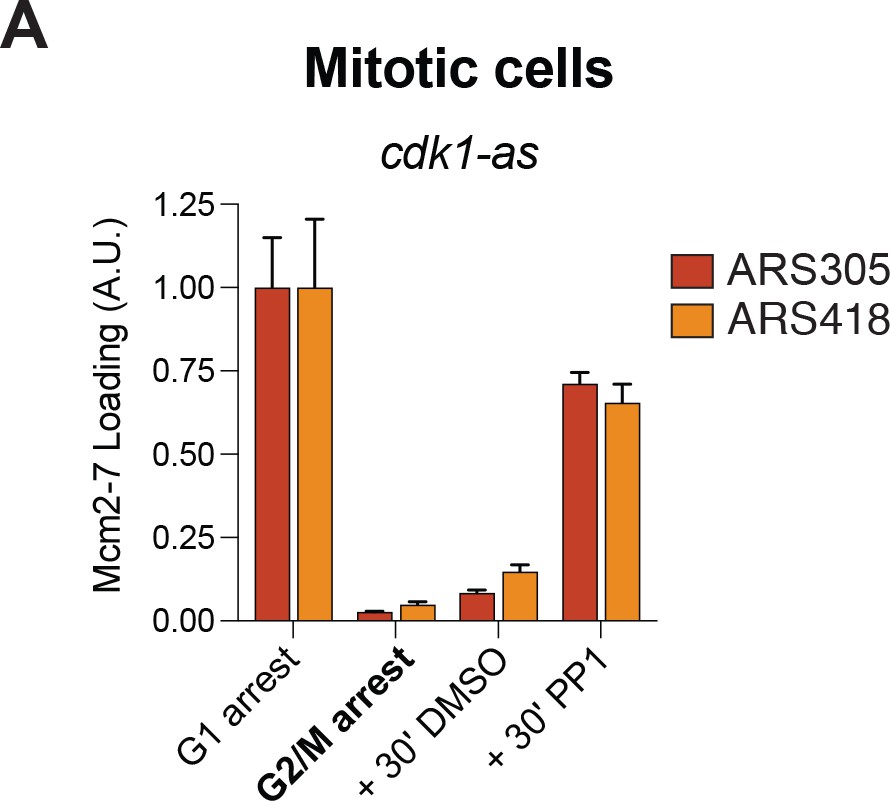
CDK inhibition using a cdk1–as allele is sufficient for Mcm2–7 reloading in mitotic cells.
(A) Inhibition of CDK in G2/M arrested mitotic cells leads to helicase reloading. Cells from strain A4370 (cdk1-as) were arrested in alpha factor (G1) or nocodazole (G2/M). Nocodazole–arrested cells were treated for 30 min with either DMSO (vehicle control) or 10 µM 1–NM–PP1 +20 µM 1–NA–PP1. Mcm2–7 binding to origin DNA was detected by ChIP–qPCR at ARS305 (red) and ARS418 (orange).
-
Figure 5—figure supplement 2—source data 1
Raw values used for the quantification of Figure 5—figure supplement 2.
- https://doi.org/10.7554/eLife.33309.018
Figure 6 with 3 supplements
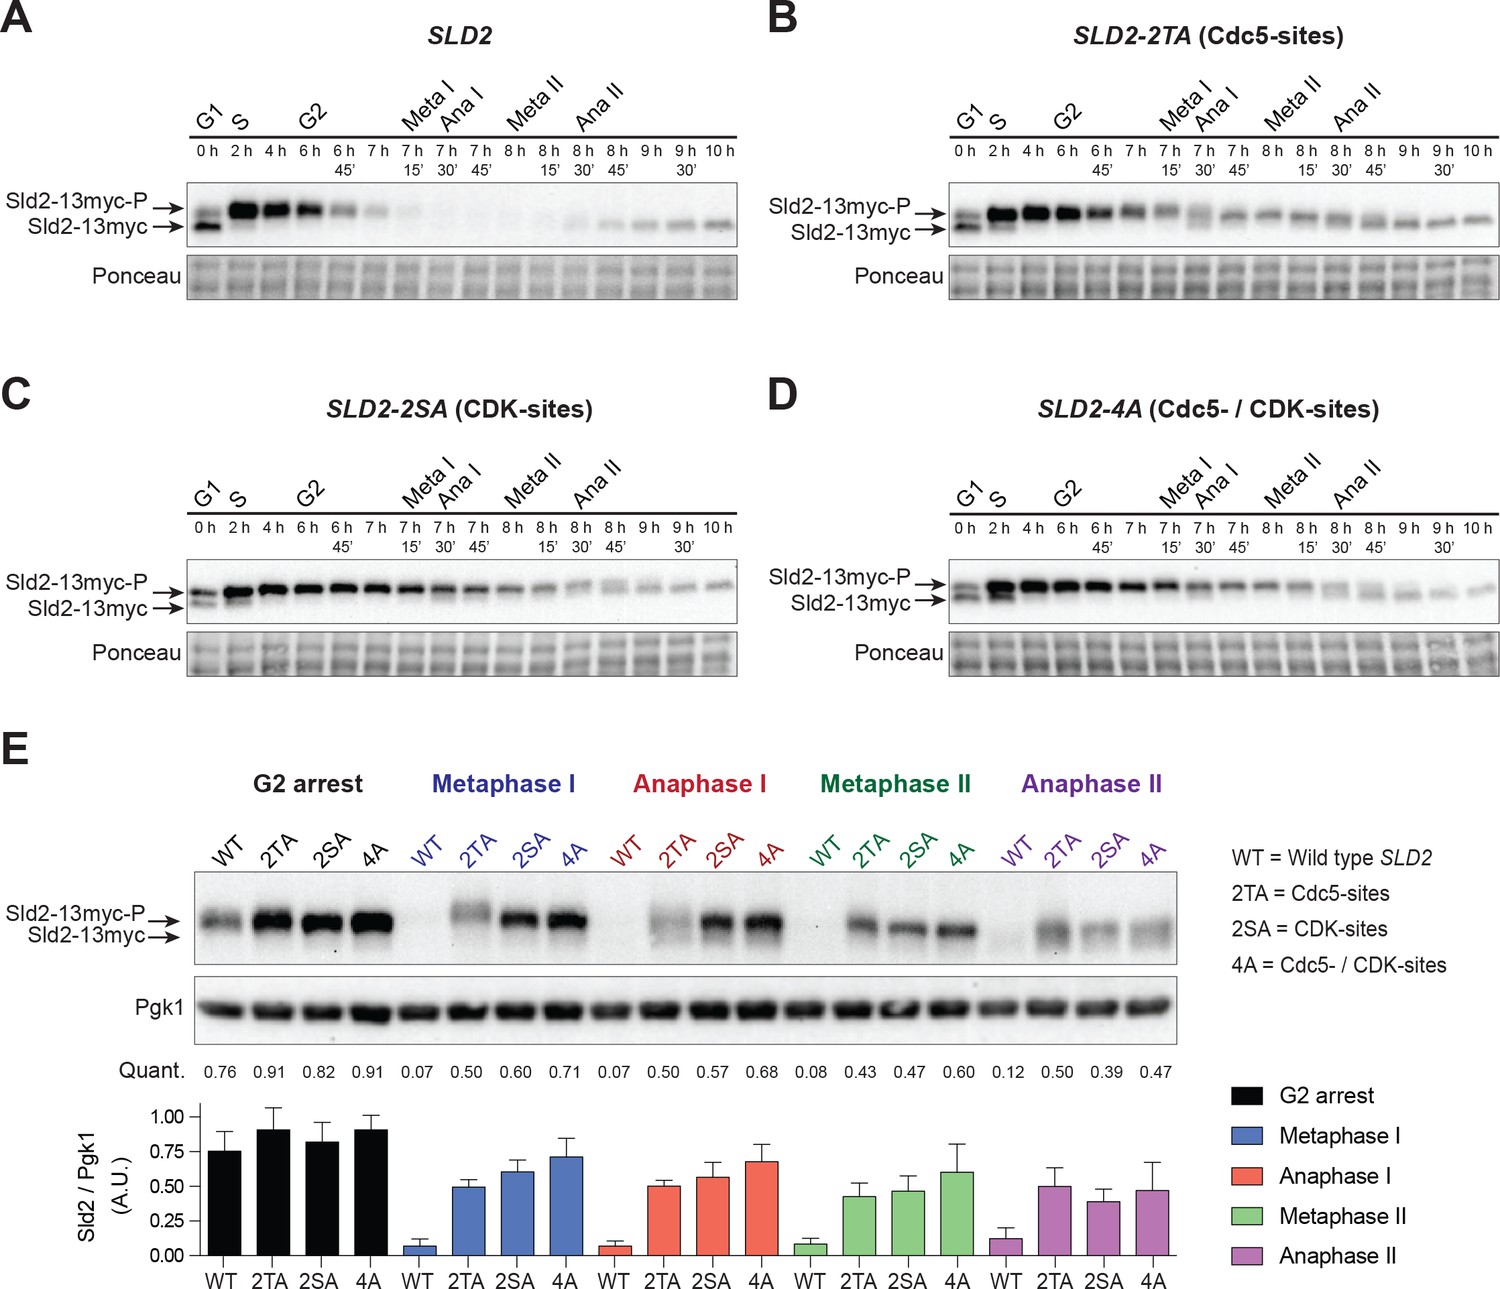
Sld2 is degraded during the meiotic divisions in a manner that depends on Cdc5- and CDK-phosphorylation sites.
(A) Sld2 protein is degraded upon entry into the meiotic divisions. Immunoblots of Sld2–13myc during meiosis from strain yDP336. The time after transfer into sporulation medium and the associated meiotic stages are indicated above each lane. For cell–cycle synchrony, refer to Figure 6—figure supplement 2A. (B–D) Mutation of either Cdc5– or CDK–phosphorylation sites on Sld2 results in stabilization of Sld2 throughout the meiotic divisions: Immunoblots of Sld2–13myc during meiosis with the following mutations: (B) Cdc5–phosphorylation sites (strain yDP473: 2TA – T122A/T143A), (C) CDK–phosphorylation sites (strain yDP642: 2SA – S128A/S138A), or (D) Cdc5– and CDK–phosphorylation sites (strain yDP644: 4A – T123A/S128A/S138A/T143A). The time after transfer into sporulation medium and the associated meiotic stages are indicated above each lane. For cell–cycle synchrony, refer to Figure 6—figure supplement 2B–2D. (E) Top: Samples from (A–D) with the peak number of cells in G2, Metaphase I, Anaphase I, Metaphase II, and Anaphase II were run side–by–side. Middle: Mean of Sld2 levels normalized to PGK1 levels from three independent experiments. Bottom: Graph of Sld2/PGK1 quantification from three independent experiments. The mean is represented by the height of the bar. Error bars represent the standard deviation.
-
Figure 6—source data 1
Raw values used for the quantification of Figure 6E.
- https://doi.org/10.7554/eLife.33309.025
Figure 6—figure supplement 1
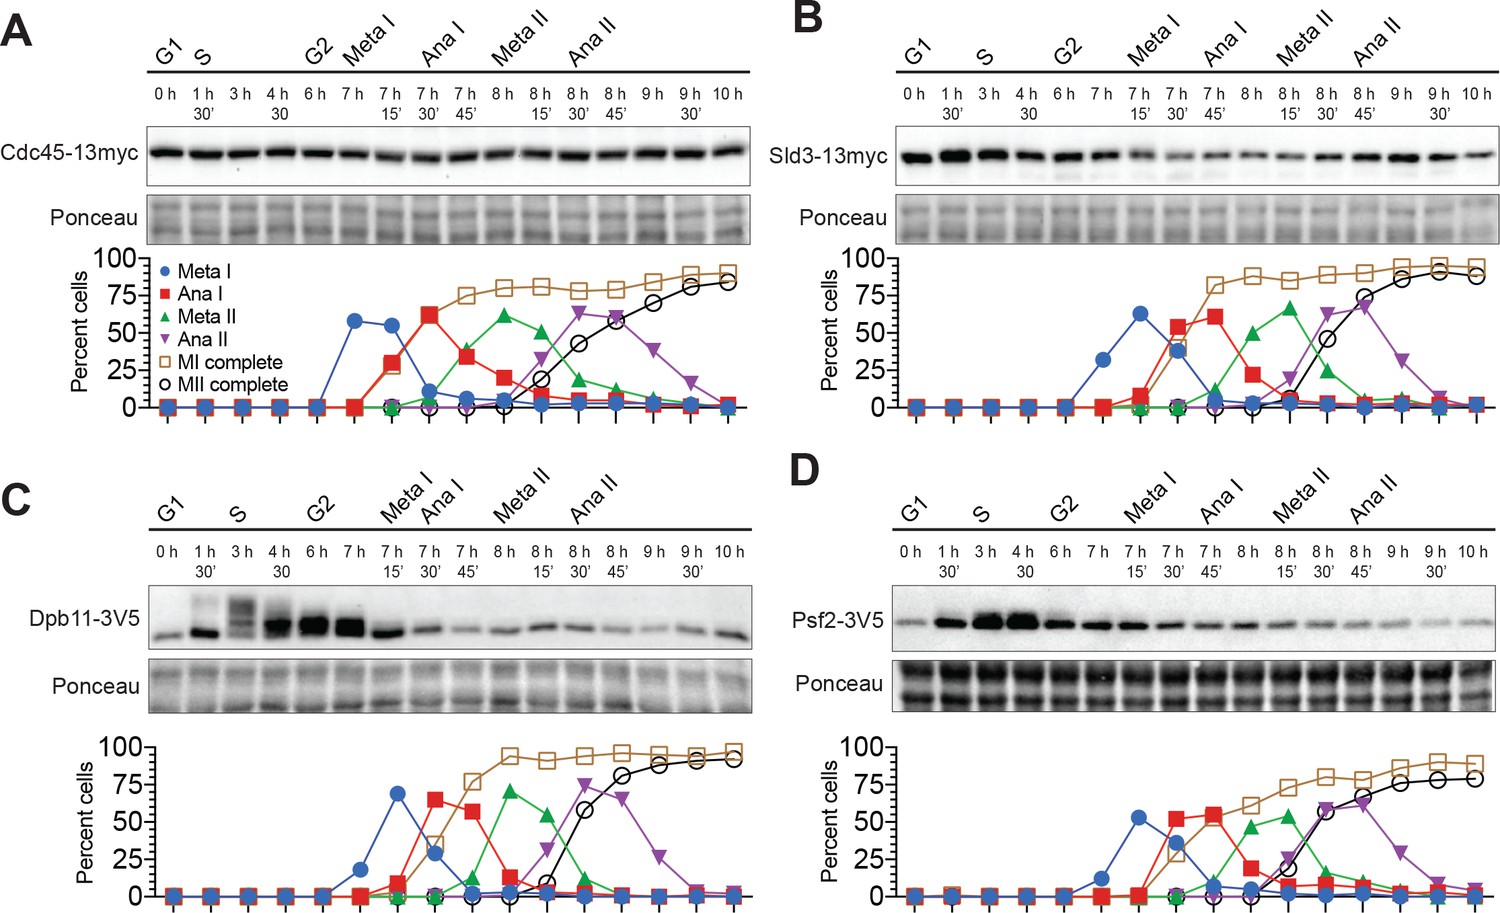
Most helicase–activation proteins are present throughout the meiotic divisions.
(A–D) Top: Immunoblots for Cdc45–13myc, Sld3–13myc, Dpb11–3V5, and Psf2–3V5, respectively. The time after transfer into sporulation medium and the associated meiotic stages are indicated above each lane. Bottom: Cell–cycle stage quantification.
Figure 6—figure supplement 2

Cells from Figure 6 proceeded synchronously through meiosis.
(A–D) Cell–cycle stage quantification for Figure 6A–D, respectively.
Figure 6—figure supplement 3
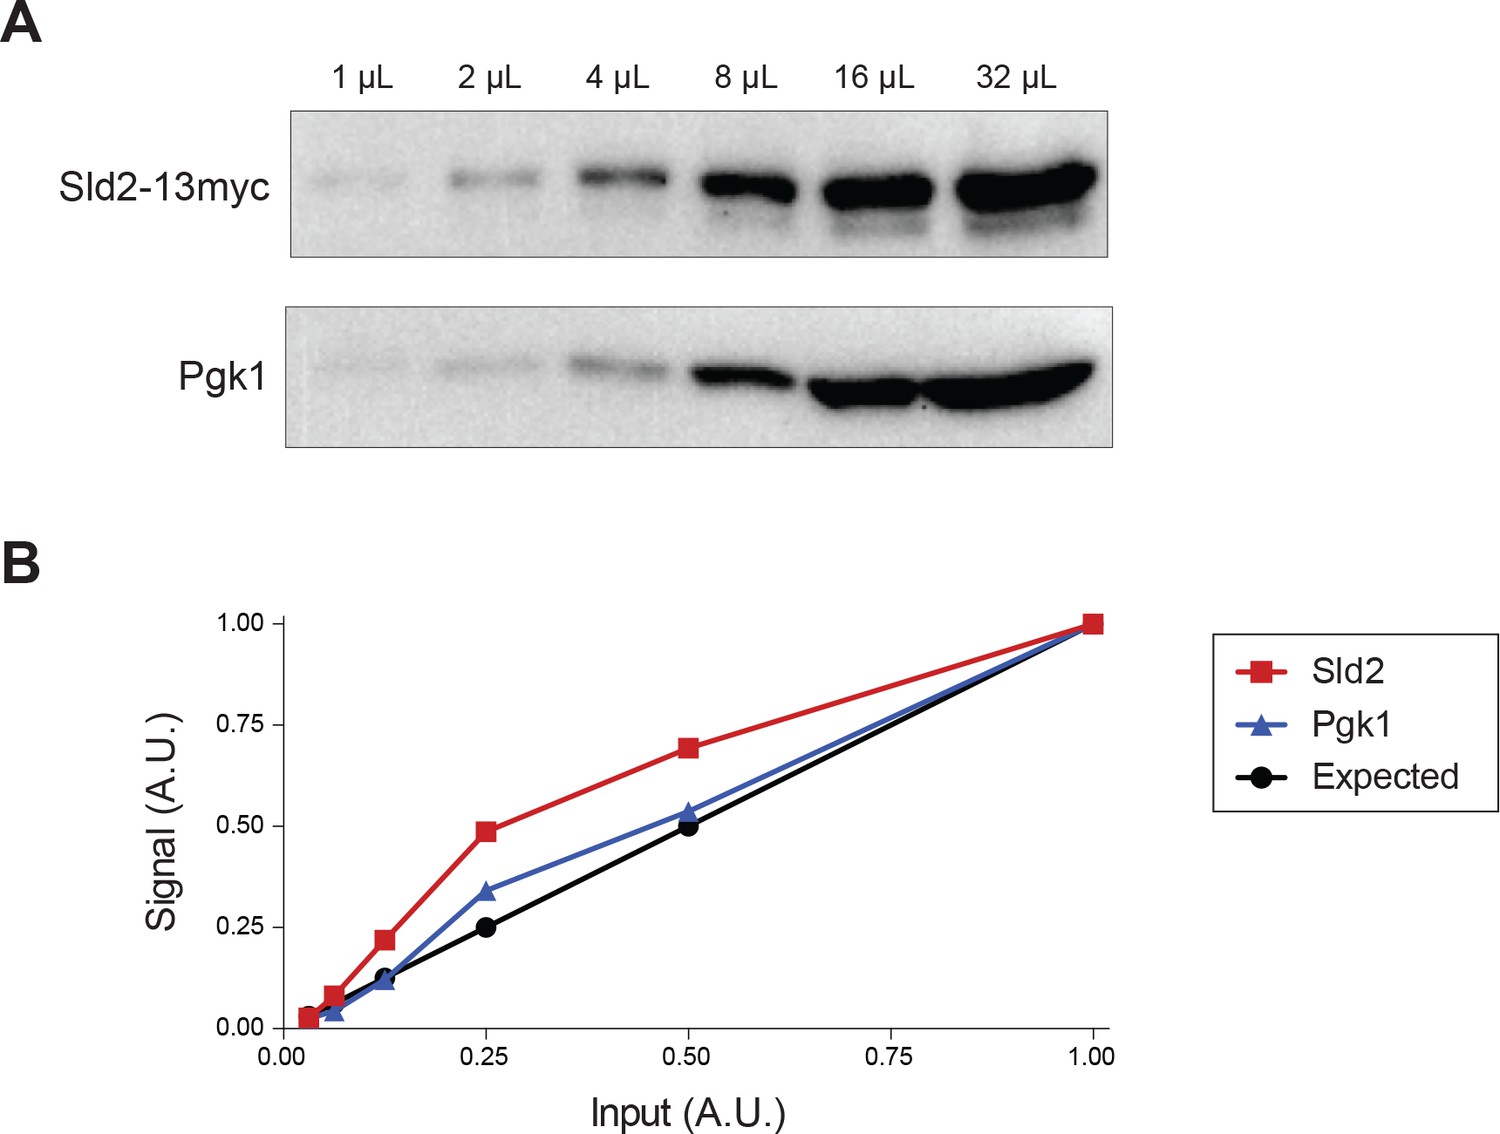
Sld2-13myc and Pgk1 levels are quantifiable across a 32-fold dilution range.
(A) Sld2 and Pgk1 western blots have increased intensity with increased input. (B) Quantification of Sld2 and Pgk1 levels is similar to the expected value based on the relative amount of input.
-
Figure 6—figure supplement 3—source data 1
Raw values used for the quantification of Figure 6—figure supplement 3.
- https://doi.org/10.7554/eLife.33309.024
Figure 7
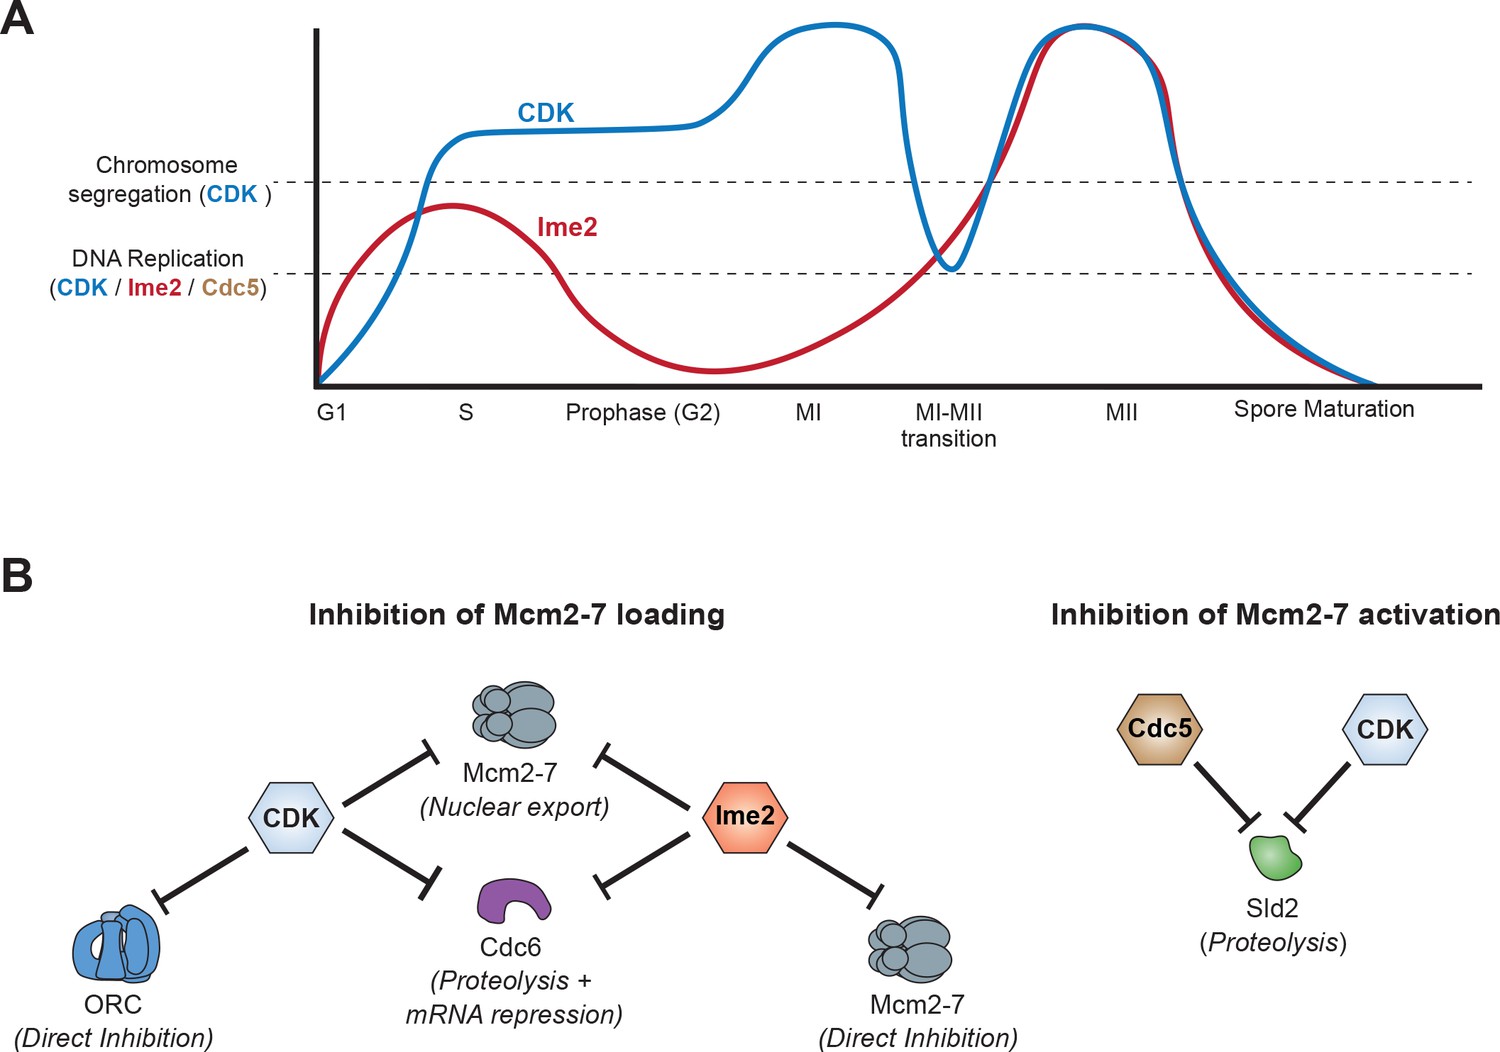
Model of how meiotic cells inhibit DNA replication during the MI–MII transition.
(A) Graphical representation of CDK (blue) (Carlile and Amon, 2008) and Ime2 (red) (Berchowitz et al., 2013) kinase activities during meiosis, and how they regulate the chromosome segregation and DNA replication programs. Chromosome segregation is regulated by CDK, whereas DNA replication is regulated by CDK, Ime2, and Cdc5. During the MI-MII transition, CDK activity decreases enough to reset the chromosome segregation program for MII. Although CDK remains active enough to mostly inhibit the DNA replication program, the decreased activity is a significant threat to the inhibition of origin licensing. Ime2 is also mostly sufficient to inhibit Mcm2-7 loading during the MI-MII transition. Cdc5 activity has not been precisely determined and is thus not shown, but it contributes to the inhibition of DNA replication by limiting Mcm2–7 activation. (B) The mechanisms and effector proteins used to inhibit DNA replication during the meiotic divisions. CDK and Ime2 cooperate to inhibit helicase loading by promoting Mcm2–7 nuclear export and the repression of CDC6 by proteolytic degradation and transcriptional inhibition. Additionally, Ime2 phosphorylates and directly inhibits the Mcm2–7 complex, whereas CDK directly inhibits ORC. To inhibit helicase activation, CDK and Cdc5 promote the proteolytic degradation of Sld2.
Author response image 1
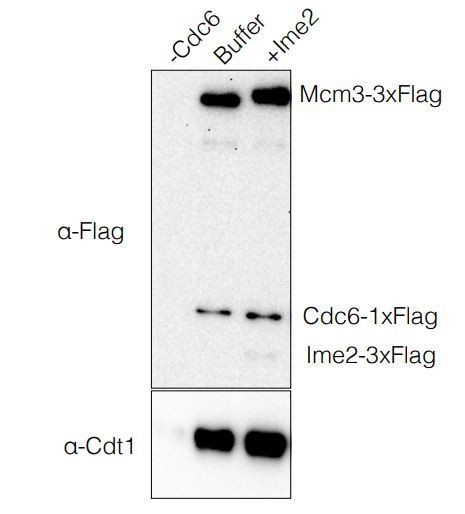
OCCM Formation Assay.
https://doi.org/10.7554/eLife.33309.030Tables
Key resources table
| Reagent type (species) or resource | Designation | Source or reference | Identifiers | Additional information |
|---|---|---|---|---|
| strain, strain background (Saccharomyces cerevisiae SK1) | yDP71 | This paper | Cdc6-3V5 | SK1 MATa/alpha ura3::pGPD1-GAL4(848). ER::URA3/ura3::pGPD1- GAL4(848).ER::URA3 GAL-NDT80::TRP1/GAL-NDT80::TRP1 CDC6-3V5::KANMX6/CDC6-3V5::KANMX6 |
| strain, strain background (S. cerevisiae SK1) | yDP120 | This paper | Orc6-3V5 | SK1 MATa/alpha ura3::pGPD1-GAL4(848). ER::URA3/ura3::pGPD1- GAL4(848).ER::URA3 GAL-NDT80::TRP1/GAL-NDT80::TRP1 ORC6-3V5::KANMX6/ORC6-3V5::KANMX6 |
| strain, strain background (S. cerevisiae SK1) | yDP152 | This paper | cdk1-as, Cdc6-3V5 | SK1 MATa/alpha ura3::pGPD1-GAL4(848). ER::URA3/ura3::pGPD1- GAL4(848).ER::URA3 GAL-NDT80::TRP1/GAL-NDT80::TRP1 cdc28-as1(F88G)/cdc28-as1(F88G) CDC6-3V5::KANMX6/CDC6-3V5::KANMX6 |
| strain, strain background (S. cerevisiae W303) | yDP159 | This paper | Ime2 Purification | W303 MATa bar1::hisG pep4::unmarked LEU2::pGAL1,10-IME2(1–404)−3xFLAG |
| strain, strain background (S. cerevisiae SK1) | yDP176 | This paper | ime2-as, Cdc6-3V5 | SK1 MATa/alpha ura3::pGPD1-GAL4(848). ER::URA3/ura3::pGPD1- GAL4(848).ER::URA3 GAL-NDT80::TRP1/GAL-NDT80::TRP1 ime2-as1(M146G)/ime2-as1(M146G) CDC6-3V5::KANMX6/CDC6-3V5::KANMX6 |
| strain, strain background (S. cerevisiae SK1) | yDP177 | This paper | cdk1-as, ime2-as, Cdc6-3V5 | SK1 MATa/alpha ura3::pGPD1-GAL4(848). ER::URA3/ura3::pGPD1- GAL4(848).ER::URA3 GAL-NDT80::TRP1/GAL-NDT80::TRP1 cdc28-as1(F88G)/cdc28-as1(F88G) ime2-as1(M146G)/ime2-as1(M146G) CDC6-3V5::KANMX6/CDC6-3V5::KANMX6 |
| strain, strain background (S. cerevisiae SK1) | yDP329 | This paper | Dpb11-3V5 | SK1 MATa/alpha ura3::pGPD1-GAL4(848). ER::URA3/ura3::pGPD1- GAL4(848).ER::URA3 GAL-NDT80::TRP1/GAL-NDT80::TRP1 DPB11-3V5::KANMX6/DPB11-3V5::KANMX6 |
| strain, strain background (S. cerevisiae SK1) | yDP330 | This paper | Psf2-3V5 | SK1 MATa/alpha ura3::pGPD1-GAL4(848). ER::URA3/ura3::pGPD1- GAL4(848).ER::URA3 GAL-NDT80::TRP1/GAL-NDT80::TRP1 PSF2-3V5::KANMX6/PSF2-3V5::KANMX6 |
| strain, strain background (S. cerevisiae SK1) | yDP335 | This paper | Cdc45-13myc | SK1 MATa/alpha ura3::pGPD1-GAL4(848). ER::URA3/ura3::pGPD1- GAL4(848).ER::URA3 GAL-NDT80::TRP1/GAL-NDT80::TRP1 CDC45-13myc::KANMX6/CDC45-13myc::KANMX6 |
| strain, strain background (S. cerevisiae SK1) | yDP336 | This paper | Sld2-13myc | SK1 MATa/alpha ura3::pGPD1-GAL4(848). ER::URA3/ura3::pGPD1- GAL4(848).ER::URA3 GAL-NDT80::TRP1/GAL-NDT80::TRP1 SLD2-13myc::KANMX6/SLD2-13myc::KANMX6 |
| strain, strain background (S. cerevisiae SK1) | yDP337 | This paper | Sld3-13myc | SK1 MATa/alpha ura3::pGPD1-GAL4(848). ER::URA3/ura3::pGPD1- GAL4(848).ER::URA3 GAL-NDT80::TRP1/GAL-NDT80::TRP1 SLD3-13myc::KANMX6/SLD3-13myc::KANMX6 |
| strain, strain background (S. cerevisiae SK1) | yDP473 | This paper | Sld2-2TA-13myc | SK1 MATa/alpha ura3::pGPD1-GAL4(848). ER::URA3/ura3::pGPD1- GAL4(848).ER::URA3 GAL-NDT80::TRP1/GAL-NDT80::TRP1 SLD2(T122A T143A)−13myc::KANMX6/ SLD2(T122A T143A)−13myc::KANMX6 |
| strain, strain background (S. cerevisiae W303) | yDP554 | This paper | Ime2-AS Purification | W303 MATa bar1::hisG pep4::unmarked LEU2::pGAL1,10-IME2(1–404, M146G)−3xFLAG |
| strain, strain background (S. cerevisiae SK1) | yDP642 | This paper | Sld2-2SA-13myc | SK1 MATa/alpha ura3::pGPD1-GAL4(848). ER::URA3/ura3::pGPD1- GAL4(848).ER::URA3 GAL-NDT80::TRP1/GAL-NDT80::TRP1 SLD2(S128A S138A)−13myc::KANMX6/ SLD2(S128A S138A)−13myc::KANMX6 |
| strain, strain background (S. cerevisiae SK1) | yDP644 | This paper | Sld2-4A-13myc | SK1 MATa/alpha ura3::pGPD1-GAL4(848). ER::URA3/ura3::pGPD1- GAL4(848).ER::URA3 GAL-NDT80::TRP1/GAL-NDT80::TRP1 SLD2(T122A S128A S138A T143A)−13myc:: KANMX6/SLD2(T122A S128A S138A T143A) −13myc::KANMX6 |
| strain, strain background (S. cerevisiae W303) | ySK119 | Lõoke et al, 2017 (PMID: 28270517) | Cdk1-Clb5 Purification | W303 MATa bar1::hisG pep4::unmarked URA3::pGAL1,10-Cdc28-His,Δ1–95-Clb5-Flag |
| strain, strain background (S. cerevisiae SK1) | yST135 | This paper | Mcm2-7 Purification | W303 MATa bar1::hisG pep4::unmarked TRP1::pSKM003(pGAL1,10-MCM6,MCM7) HIS3::pSKM004-(pGAL1,10-MCM2,Flag-MCM3) LYS2::pSKM002-(pGAL1,10-MCM4,MCM5) |
| strain, strain background (S. cerevisiae W303) | yST144 | Ticau et al. (2015) (PMID: 25892223) | Mcm2-7-Cdt1 Purification | W303 MATa bar1::hisG pep4::unmarked TRP1::pSKM003(pGAL1,10-MCM6,MCM7) HIS3::pSKM004-(pGAL1,10-MCM2,Flag-MCM3) LYS2::pSKM002-(pGAL1,10-MCM4,MCM5) URA3::pALS1(pGAL1,10-Cdt1,GAL4) |
| strain, strain background (S. cerevisiae W303) | A4370 | Angelika Amon | cdk1-as | W303 MATa bar1::hisG cdc28-as1(F88G) |
| strain, strain background (S. cerevisiae W303) | ySDORC | John Diffley | ORC purification | W303 MATa bar1::hyg pep4::kanMX TRP1::pGAL1,10-ORC5,ORC6 HIS3::pGAL1,10-ORC3,ORC4 URA3::pGAL1, 10-CBP-TEV-ORC1,ORC2 |
| antibody | poly ORC (Orc1 and Orc2 western blots and ORC ChIP) | HM1108 (Bell Lab) | ||
| antibody | Cdt1 | HM5353 (Bell Lab) | ||
| antibody | poly MCM (Mcm3 and Mcm6 western blots) | UM174 (Bell Lab) | ||
| antibody | poly MCM (Mcm2-7 ChIP) | UM185 (Bell Lab) | ||
| antibody | Mcm2 | Santa Cruz, yN-19 (code sc-6680) | RRID:AB_648843 | |
| antibody | Mcm7 | Santa Cruz, yN-19 (code SC-6688) | RRID:AB_647936 | |
| antibody | PGK1 | Invitrogen (catalog #459250) | RRID:AB_2532235 | |
| recombinant DNA reagent (plasmid) | pSKM033 | Kang et al. (2014) (PMID: 25087876) | Cdc6 purification | pGEX-GST-3C-FLAG-CDC6 |
| recombinant DNA reagent (plasmid) | pALS16 | This study | Cdt1 purification | pGEX-GST-3C-CDT1 |
| chemical compound, drug | 1-NM-PP1 | Toronto Research Chemicals (catalog #A603003) | ||
| chemical compound, drug | 1-NA-PP1 | Cayman Chemical Co., (catalog #NC1049860) |
Additional files
-
Supplementary file 1
In vitro Ime2–phosphorylation sites on Cdc6 from iTRAQ LC–MS/MS.
Related to Figure 5E. Shown are the phosphorylated Cdc6 peptides, the specific phosphorylated residue(s), the relative amount of those phosphopeptides detected in both biological replicates of buffer–treated and Ime2–treated Cdc6, and the average enrichment upon Ime2–treatment. See Materials and Methods for iTRAQ LC–MS/MS details.
- https://doi.org/10.7554/eLife.33309.027
-
Transparent reporting form
- https://doi.org/10.7554/eLife.33309.028
Download links
A two-part list of links to download the article, or parts of the article, in various formats.
Downloads (link to download the article as PDF)
Open citations (links to open the citations from this article in various online reference manager services)
Cite this article (links to download the citations from this article in formats compatible with various reference manager tools)
Multiple kinases inhibit origin licensing and helicase activation to ensure reductive cell division during meiosis
eLife 7:e33309.
https://doi.org/10.7554/eLife.33309


