Mechanism and consequence of abnormal calcium homeostasis in Rett syndrome astrocytes
- University of Wisconsin-Madison, United States
- National Institute of Mental Health, United States
Figures
Figure 1 with 4 supplements
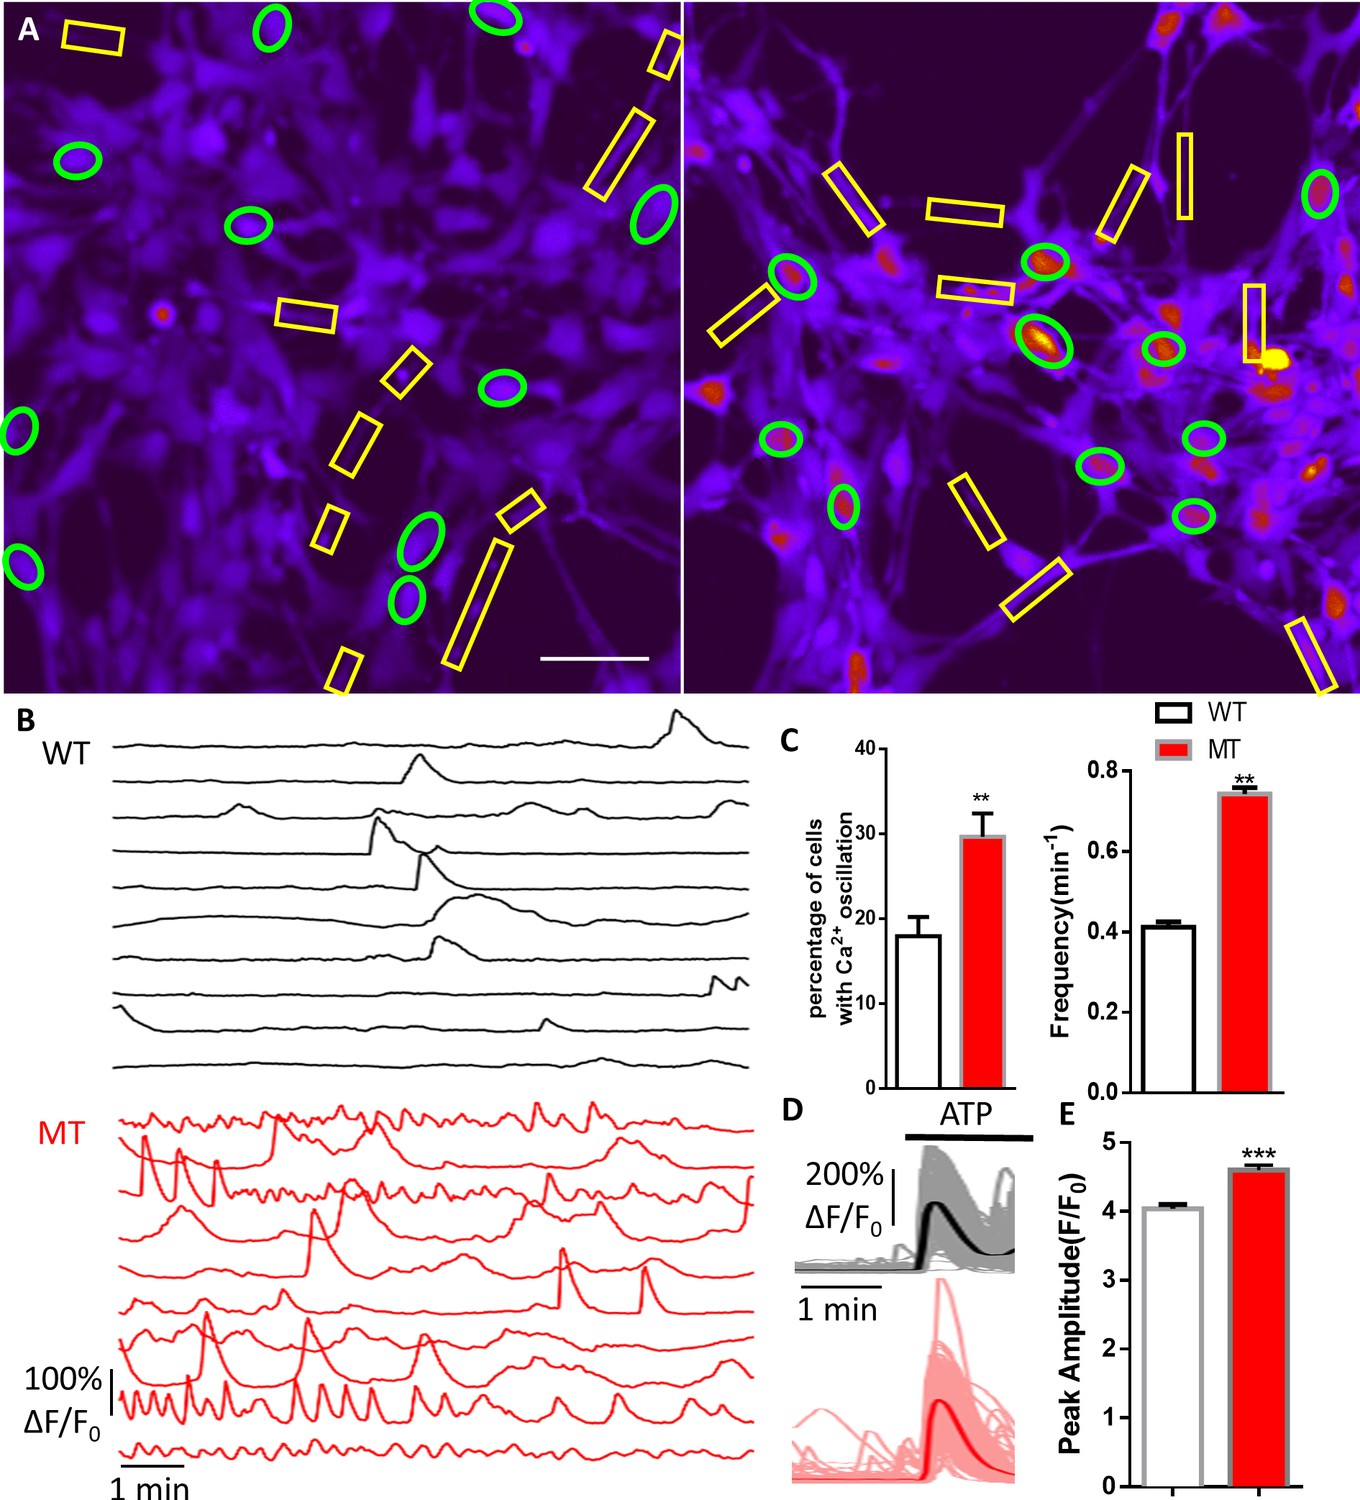
Abnormal Ca2+ activities in mutant human RTT astrocytes.
(A) Pseudocolored Fluo4 fluorescence images from wild type (WT, left) and MeCP2 mutant (MT, right) astrocytes differentiated from human iPSCs. Green ellipses indicate astrocyte cell soma, while yellow rectangles indicate processes. Scale bars = 50 μm. (B) Representative ΔF/F0 traces showing the spontaneous intracellular Ca2+ activity from soma in (A). The black traces are from WT astrocytes and red traces are from MT ones. (C) Quantification of the percentage (left) of astrocytes showing spontaneous Ca2+ oscillations and the frequency (right) of such oscillations. (D) Trace of Fluo4 fluorescence changes in wild type (WT) and mutant (MT) human astrocytes stimulated by 10 μM ATP. Average traces are shown with the solid lines. (E) Quantification of the peak amplitude of the ATP-evoked Ca2+ elevations in wild type (WT) and mutant (MT) human astrocytes.
-
Figure 1—source data 1
The numerical data for the graphs shown in Figure 1C and E.
- https://doi.org/10.7554/eLife.33417.011
Figure 1—figure supplement 1
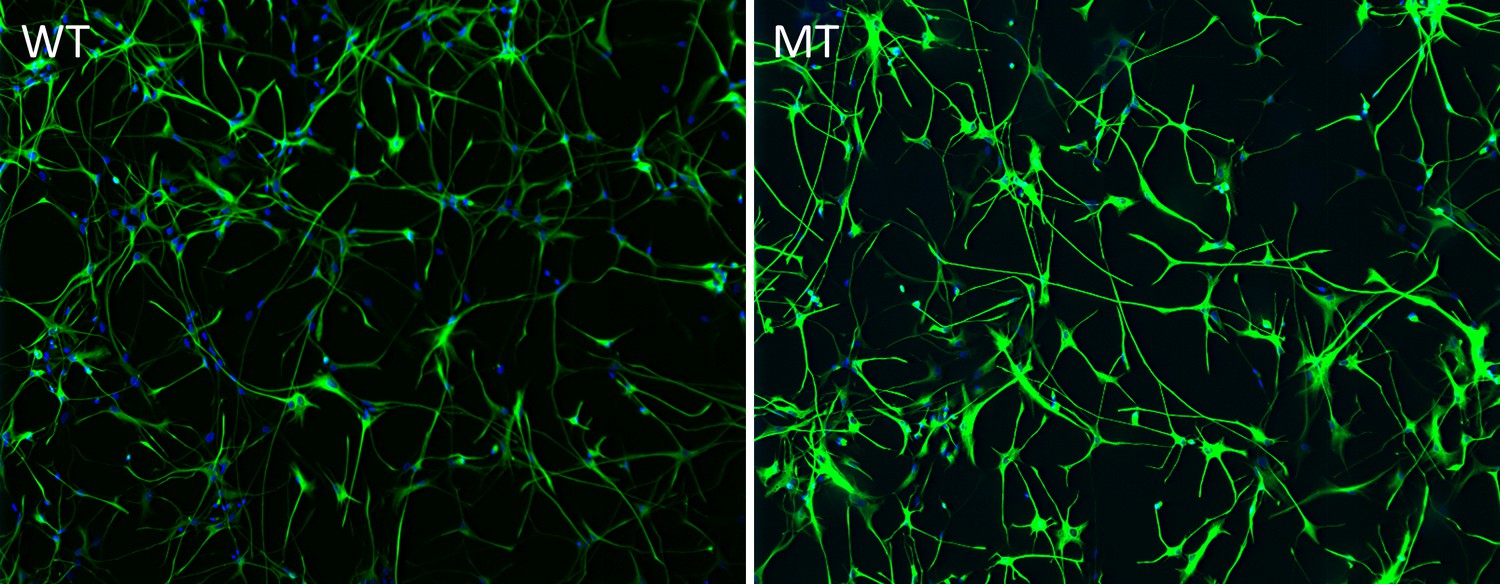
Representative images of quantification of astrocyte differentiation efficiency from human iPSCs by co-staining with GFAP (green) and DAPI (blue) followed by stereological analysis.
On average, more than ~90% of the DAPI labeled cells are GFAP positive (See Table 1).
Figure 1—figure supplement 2
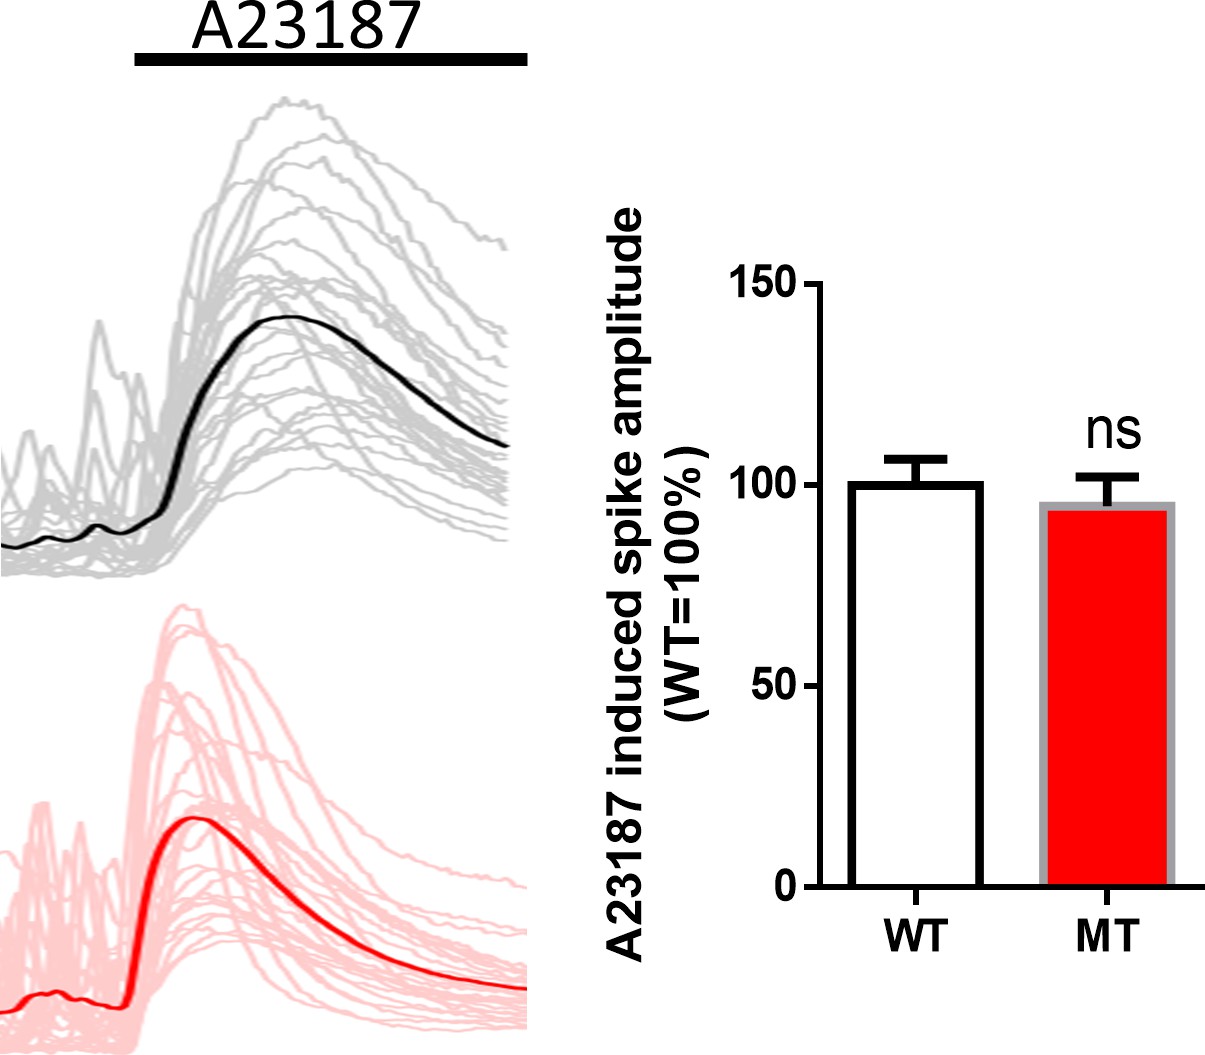
Ionophore A23187 induced Ca2+elevations from WT and MT astrocytes.
Left, sample traces of Ca2 +elevation from WT (top) and MT (bottom) astrocytes. Average traces are shown in the solid line. Right, Quantification of the amplitude of A23187 induced Ca2 +elevations.
Figure 1—figure supplement 3

Spontaneous Ca2+ activity from processes of R294X wild-type (WT) and mutant (MT) human iPSC derived astrocytes.
(A) Sample traces from WT and MT astrocytic processes marked by boxes in Figure 1A. (B) Quantification of the frequency (left) and amplitude (right) of the spontaneous Ca2 +activity from WT and MT astrocytic processes. **p<0.01.
Figure 1—figure supplement 4
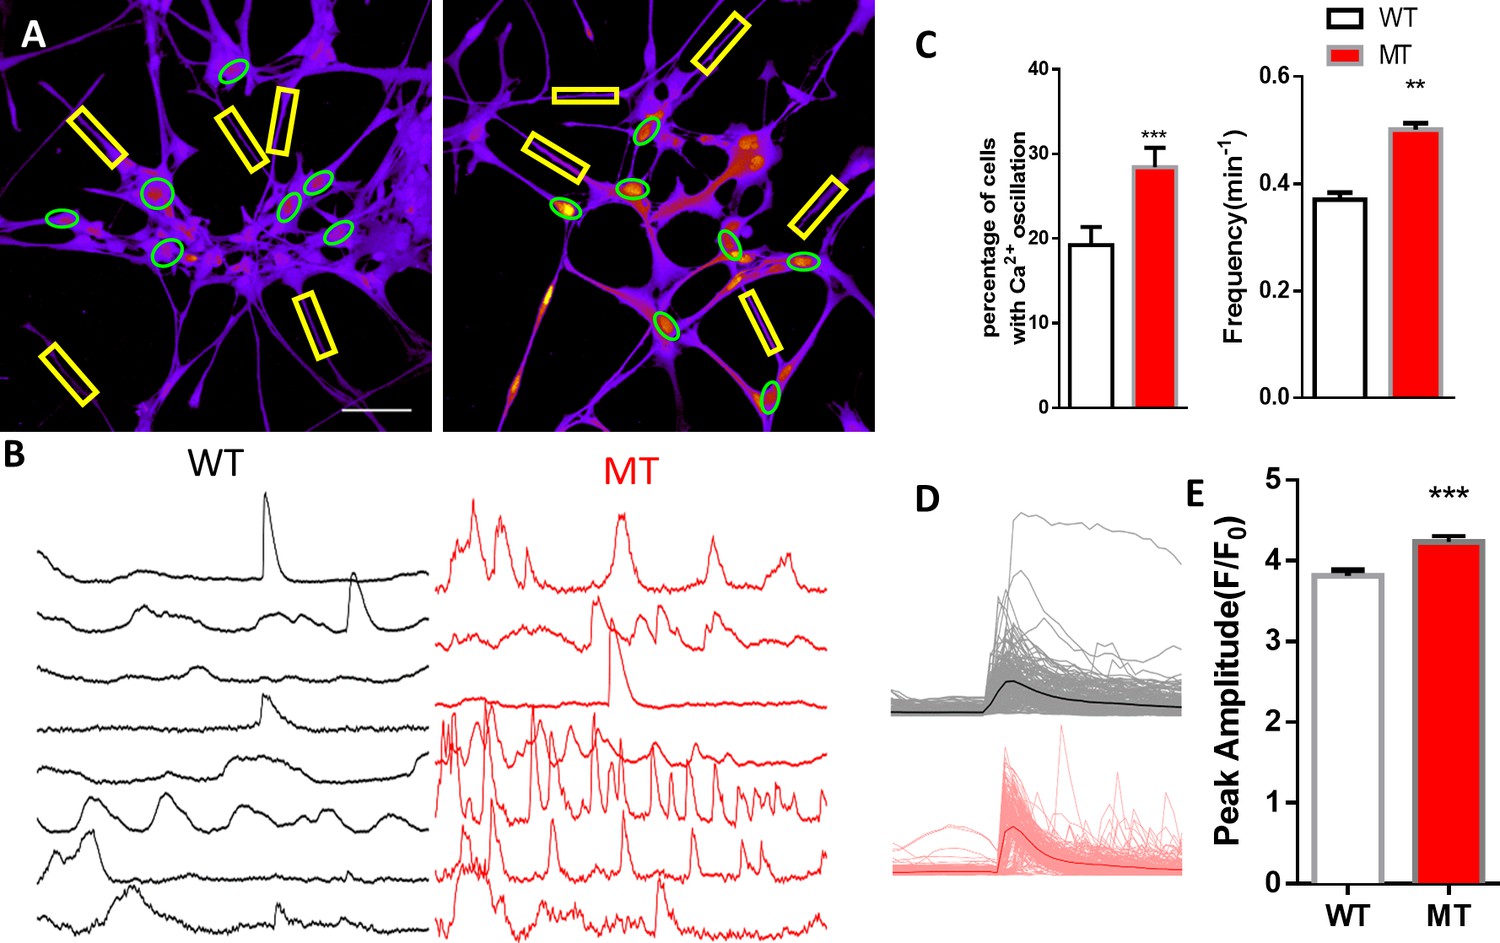
Abnormal spontaneous Ca2+ activities in V247fs mutant human RTT astrocytes.
(A) Representative pseudocolored Fluo4 fluorescence images from wild type (WT, left) and MECP2 V247fs mutant (MT, right) astrocytes differentiated from human iPSCs. Green ellipses indicate astrocyte cell bodies, while yellow rectangles indicate processes. Scale bars = 50 μm. (B) Representative ΔF/F0 traces showing the spontaneous intracellular Ca2+ activity from the regions of interest (ROIs) in (A). The black traces are form WT astrocytes and red traces are from V247fs MT ones. (C) Quantification of the percentage (left) of astrocytes showing spontaneous Ca2+ oscillations, and the frequency (right). (D) All trace of Fluo4 fluorescence changes in wild type (WT) and V247fs mutant (MT) human astrocytes stimulated by 10 μM ATP. Average traces are shown with the solid lines. (E) Quantification of the peak amplitude of the ATP-evoked Ca2+ elevations in wild type (WT) and V247fs mutant (MT) human astrocytes stimulated by 10 μM ATP. The bar graphs in this figure show the mean ±s.e.m. **p<0.01, ***p<0.001.
Figure 2 with 2 supplements

Exogenous expression of MeCP2 rescues the abnormal calcium activities in RTT astrocytes.
(A) Representative images of mutant human RTT astrocytes infected with lentivirus expressing GFP alone (left) or with lentivirus co-expressing wild type MECP2 and GFP (right). MECP2 immunoreactivity was detected in GFAP positive cells in the right column, but not the left column. Scale bars, 50 μm. (B) Representative ΔF/F0 traces showing the spontaneous intracellular Ca2+ activity in RTT mutant astrocytes infected with lentivirus expressing either GFP alone (GFP) or co-expressing GFP and wild type MECP2 together (MECP2/GFP). (C) Quantification of the percentage (left) of astrocytes showing spontaneous Ca2+ oscillations and the frequency (middle) and amplitude (right) of such oscillations in RTT mutant astrocytes infected with lentivirus expressing either GFP alone (GFP) or co-expressing GFP and wild type MECP2 together (MECP2/GFP). (D) Trace of ATP (10 μM) evoked Fluo4 fluorescence changes in RTT mutant astrocytes infected with lentivirus expressing either GFP alone (GFP) or co-expressing GFP and wild type MECP2 together (MECP2/GFP). Average traces are shown with the solid lines. (E) Quantification of the peak amplitude of the ATP-evoked Ca2+. The bar graphs in this figure show the mean ±s.e.m. *p<0.05, **p<0.01, ***p<0.001.
-
Figure 2—source data 1
The numerical data for the graphs shown in Figure 2C and E.
- https://doi.org/10.7554/eLife.33417.015
Figure 2—figure supplement 1
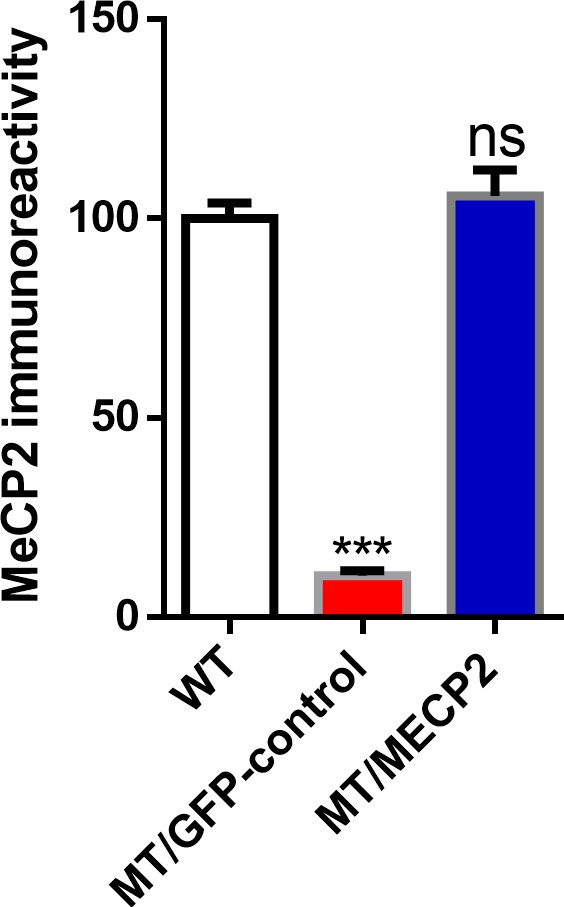
Exogenous expression of MeCP2 in human iPSC derived astrocytes using lentivirus.
Quantification of MeCP2 immunoreactivity in wild type astrocytes (WT), mutant astrocytes infected with Lenti-GFP (MT/GFP-control), and mutant astrocytes infected with Lenti-MeCP2-GFP (MT/MECP2). The bar graphs in this figure show the mean ±s.e.m. ***p<0.001.
Figure 2—figure supplement 2
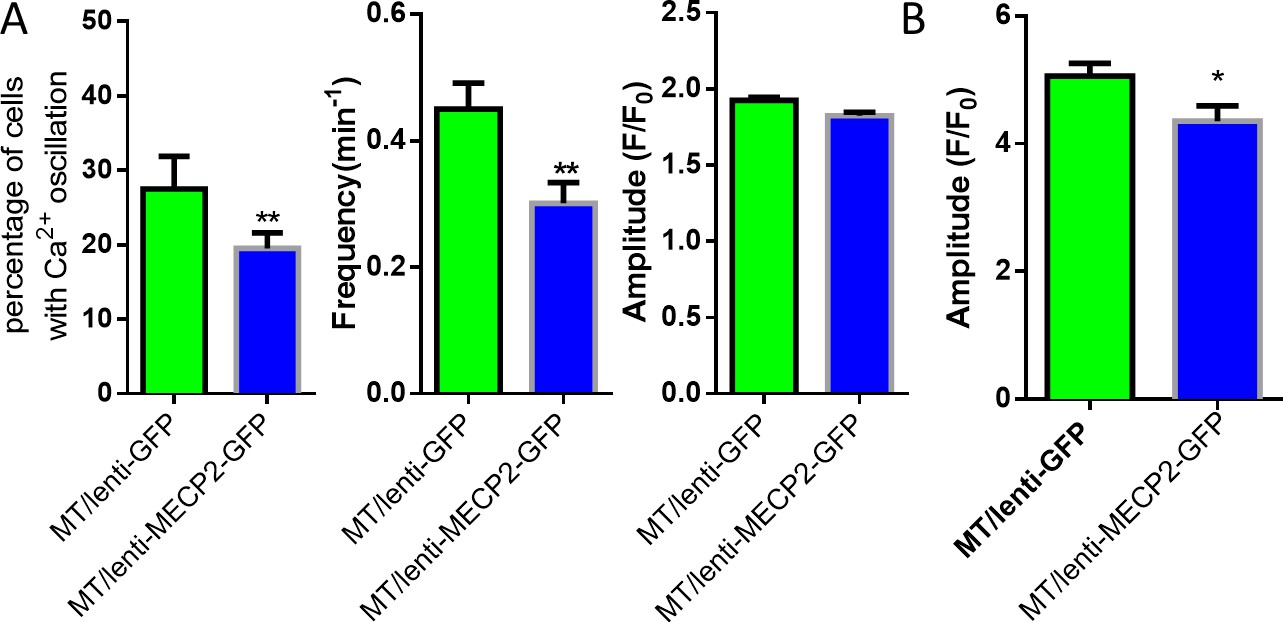
Exogenous expression of MeCP2 rescues the abnormal calcium activities in V247fs mutant astrocytes.
(A) Quantification of the percentage (left) of astrocytes showing spontaneous Ca2+ oscillations, and the frequency (middle) and amplitude (right) of such oscillations in RTT mutant astrocytes infected with lentivirus expressing either GFP alone (GFP) or co-expressing GFP and wild type MECP2 together (MECP2/GFP). (B) Quantification of the peak amplitude of the ATP evoked Ca2+response. The bar graphs in this figure show the mean ±s.e.m. *p<0.05, **p<0.01.
Figure 3
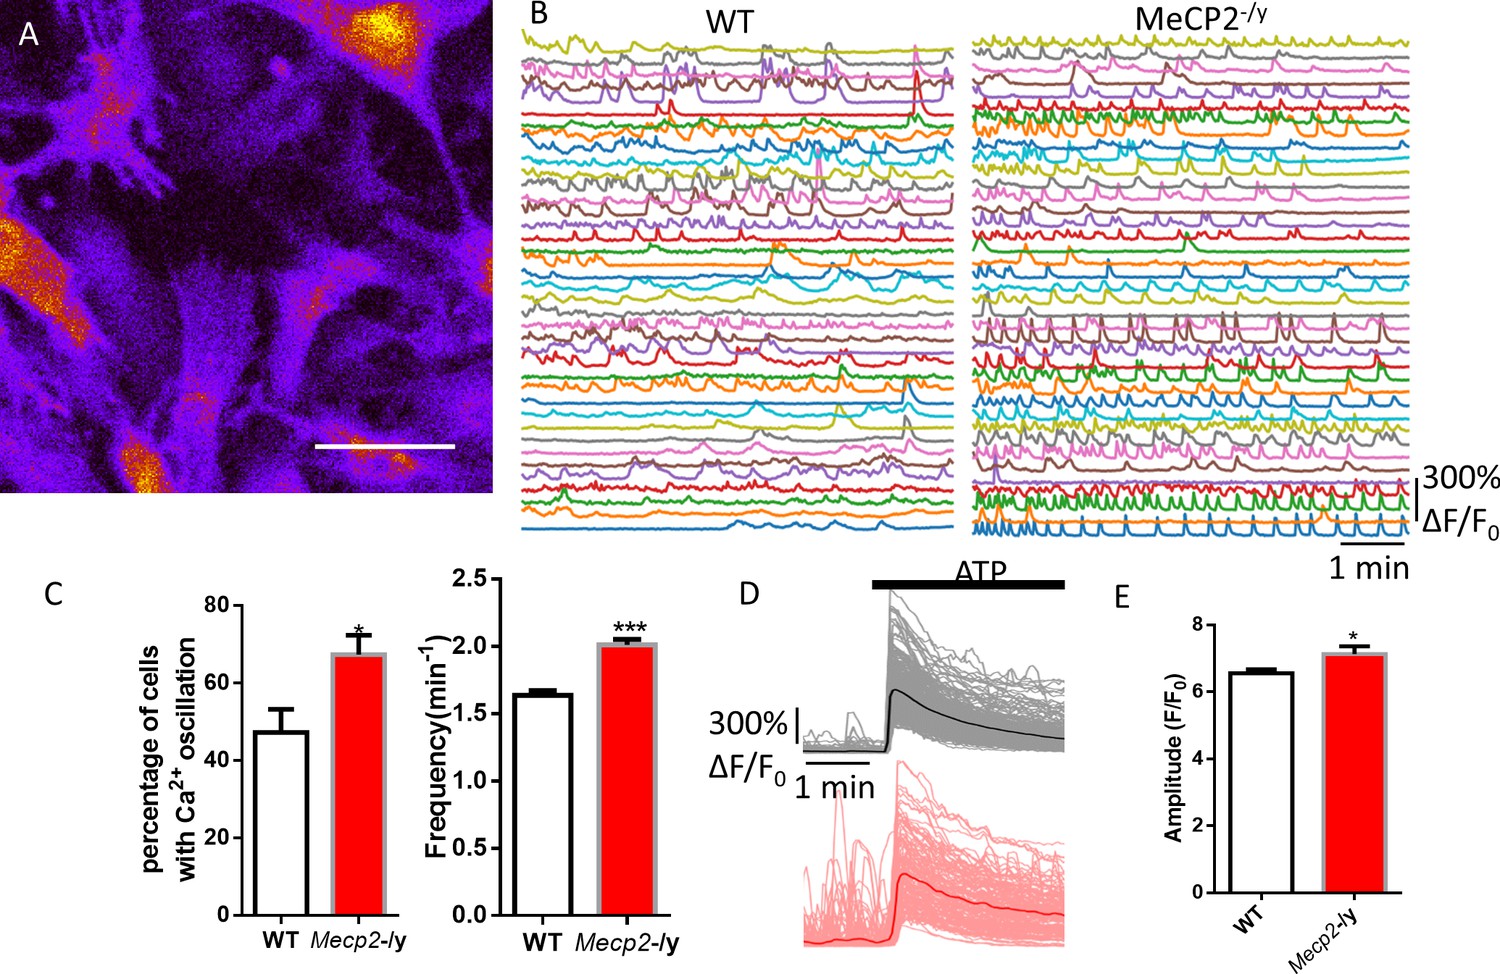
Abnormal Ca2+ activities in primary astrocytes isolated from Mecp2 null mice.
(A) The pseudocolored GCaMP6s fluorescence image from astrocytes. (B) Representative ΔF/F0 traces showing the spontaneous intracellular Ca2+ activity in mouse primary astrocytes from wild type and Mecp2-/y mice. (C) Quantification of the percentage (left) of astrocytes showing spontaneous Ca2+ oscillations and the frequency (right) of such oscillations. (D) Trace of fluorescence changes in wild type and Mecp2-/y astrocytes stimulated by 10 μM ATP. Average traces are shown with the solid lines. (E) Quantification of the peak amplitude of the ATP-evoked Ca2+ elevations from wild type and Mecp2-/y astrocytes.
-
Figure 3—source data 1
The numerical data for the graphs shown in Figure 3C and E.
- https://doi.org/10.7554/eLife.33417.017
Figure 4
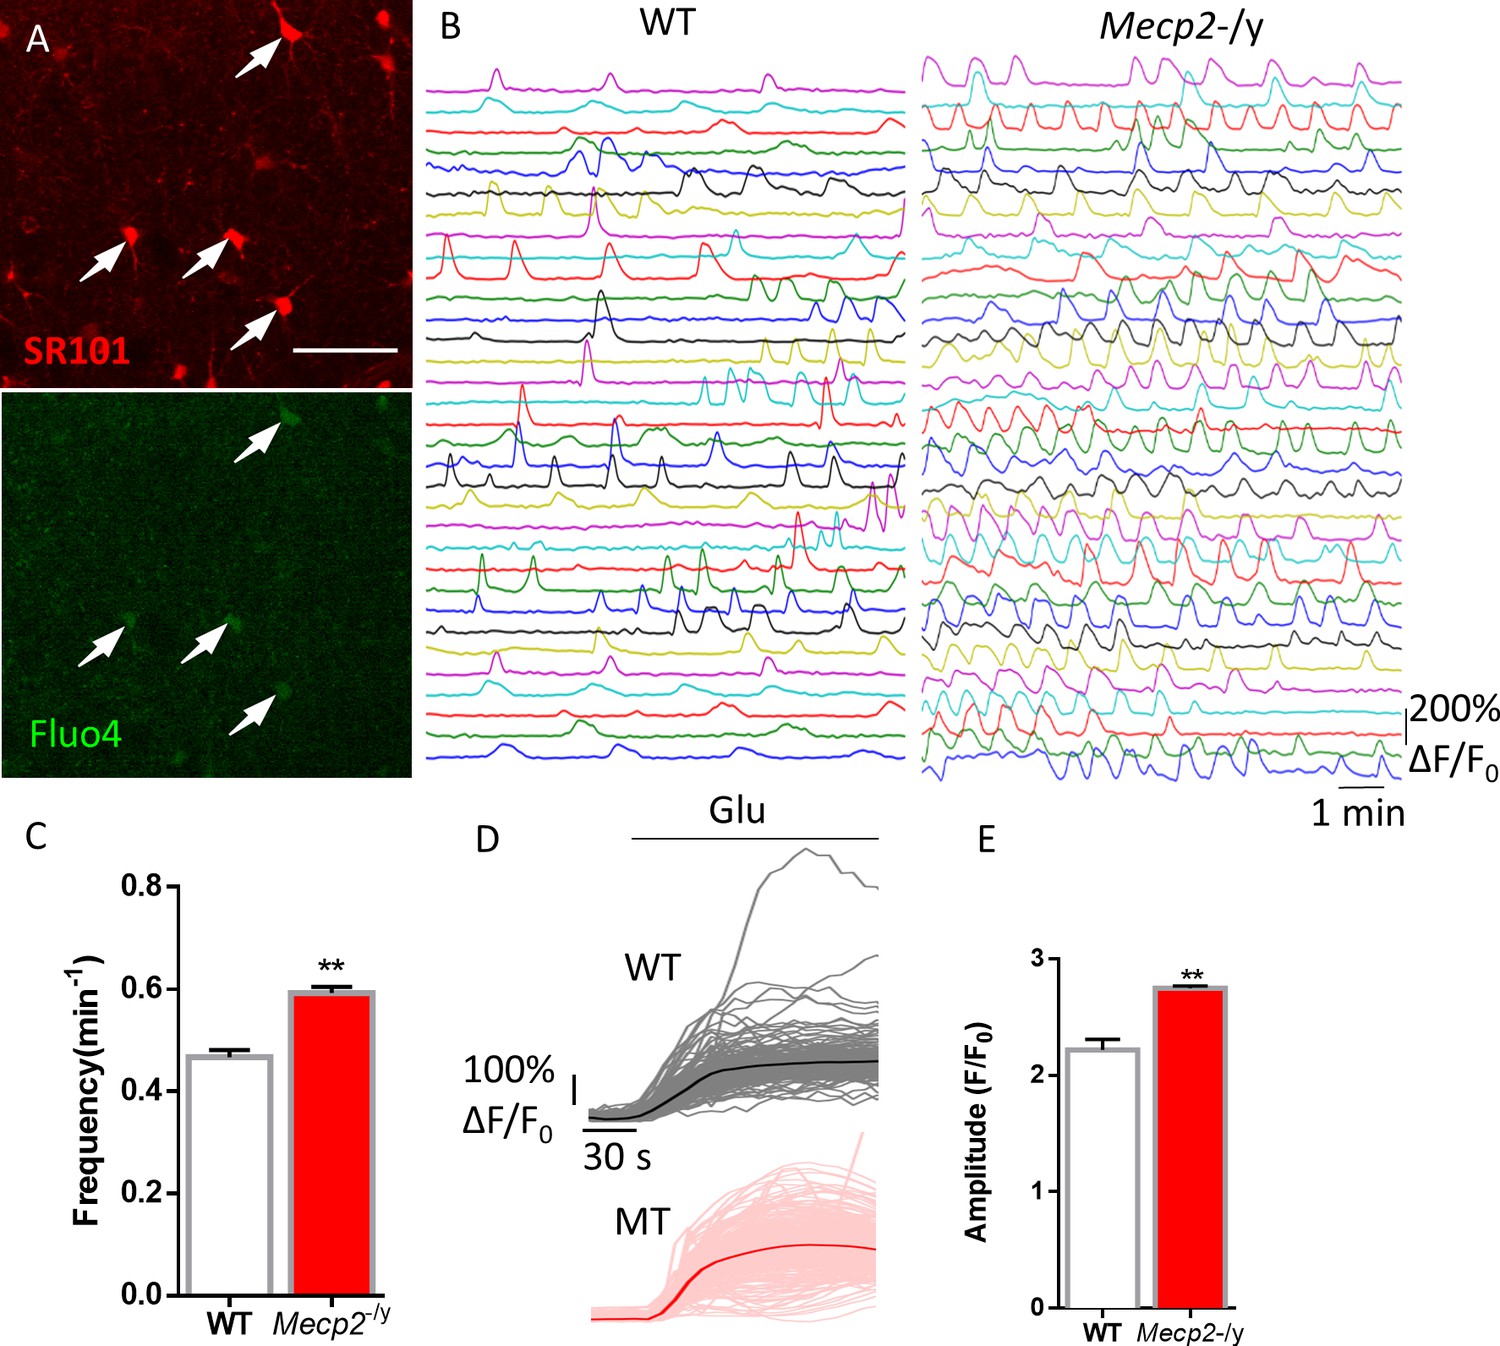
Abnormal Ca2+ activities in astrocytes in acute brain slices prepared from Mecp2 null mice.
(A) Representative images of SR101 labeling (astrocyte marker) and Fluo4 signals in acute hippocampal slices. Note the colocalization of SR101 and Fluo4. Scale bars = 50 μm. (B) Representative ΔF/F0 traces showing the spontaneous intracellular Ca2+ activity in SR101 positive cells in acute hippocampal slices prepared from wild type and Mecp2-/y mice. (C) Quantification of the frequency of the astrocytic Ca2+ oscillations in the slice experiments. (D) Traces of Fluo4 fluorescence changes stimulated by 100 μM glutamate in SR101 positive cells in acute hippocampal slices prepared from wild type and Mecp2-/y mice. Average traces are shown with solid lines. (E) Quantification of the peak amplitude of the glutamate-evoked Ca2+ elevations. The bar graphs in this figure show the mean ±s.e.m. *p<0.05, **p<0.01, ***p<0.001.
-
Figure 4—source data 1
The numerical data for the graphs shown in Figure 4C and E.
- https://doi.org/10.7554/eLife.33417.019
Figure 5 with 2 supplements
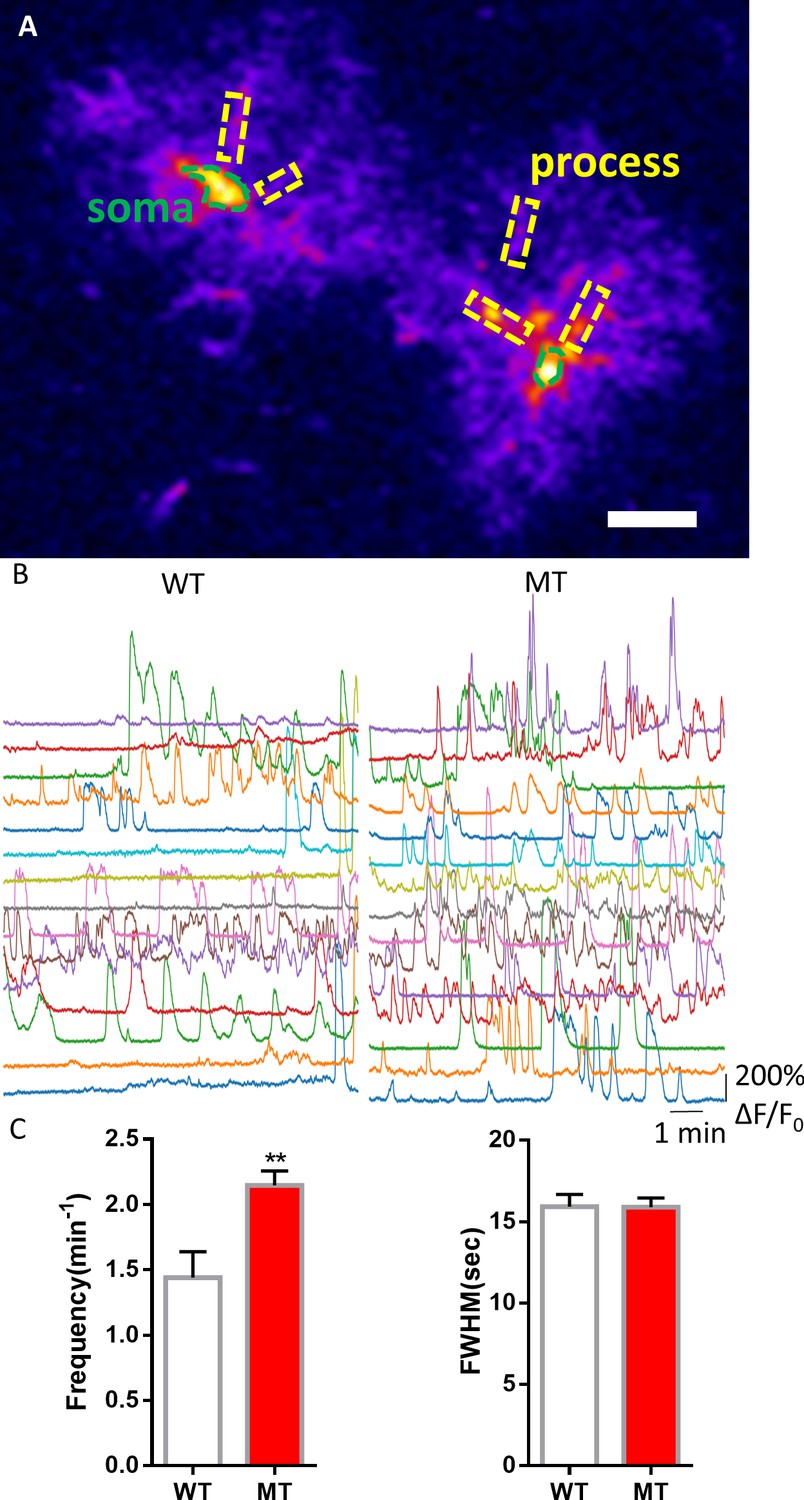
Abnormal spontaneous Ca2+ activities in vivo from Mecp2 null astrocytes.
(A) Representative GCaMP6s image showing two astrocytes in vivo. The somas and the processes could be clearly identified. Scale bars = 10 μm. (B) Representative ΔF/F0 traces showing the spontaneous intracellular Ca2+ activity in the soma of astrocytes in vivo from wild type and Mecp2 null astrocytes. (C) Quantification of the frequency (left) and the full width at half maximum (FWHM, right) of the astrocytic Ca2+ oscillations in vivo. The bar graphs in this figure show the mean ±s.e.m. ***p<0.001.
-
Figure 5—source data 1
The numerical data for the graphs shown in Figure 5.
- https://doi.org/10.7554/eLife.33417.025
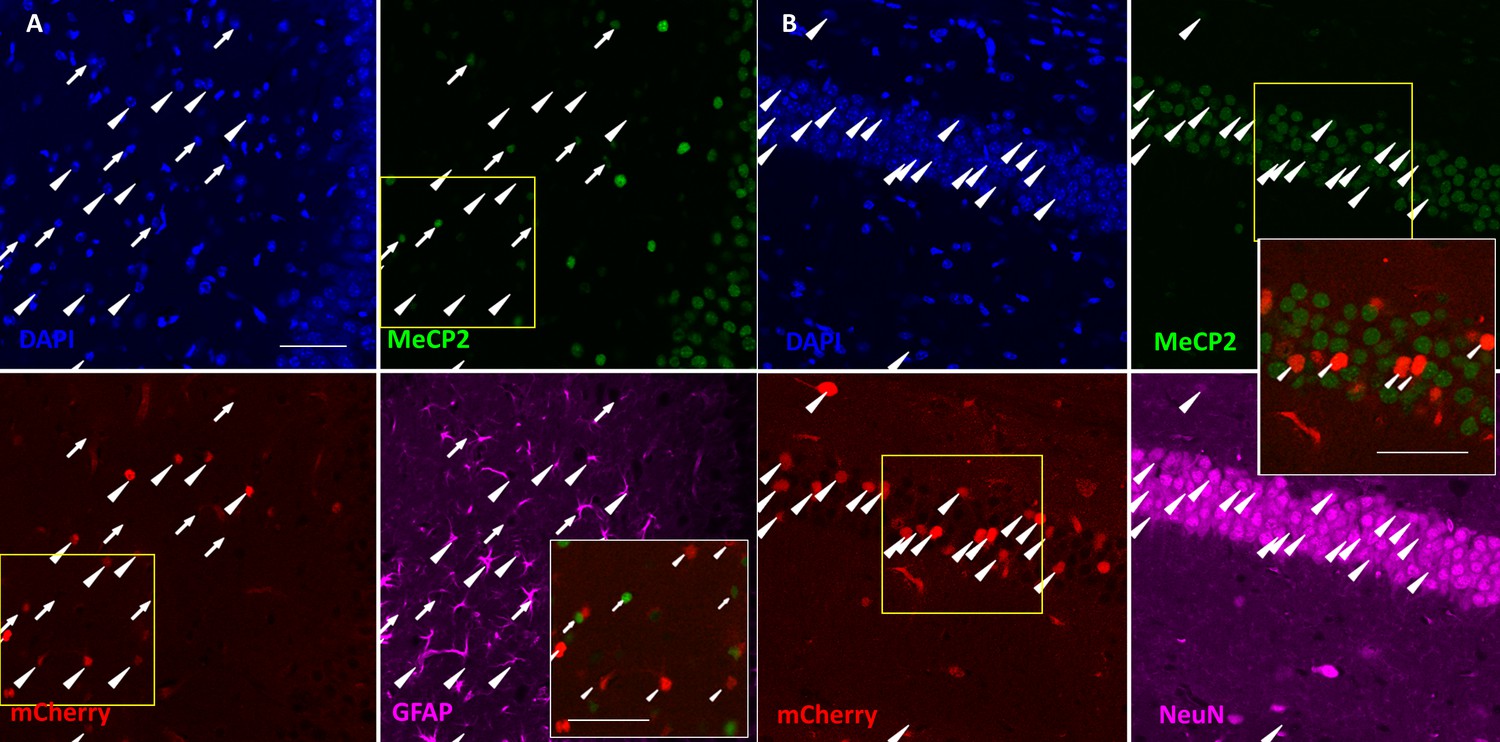
Figure 5—figure supplement 1
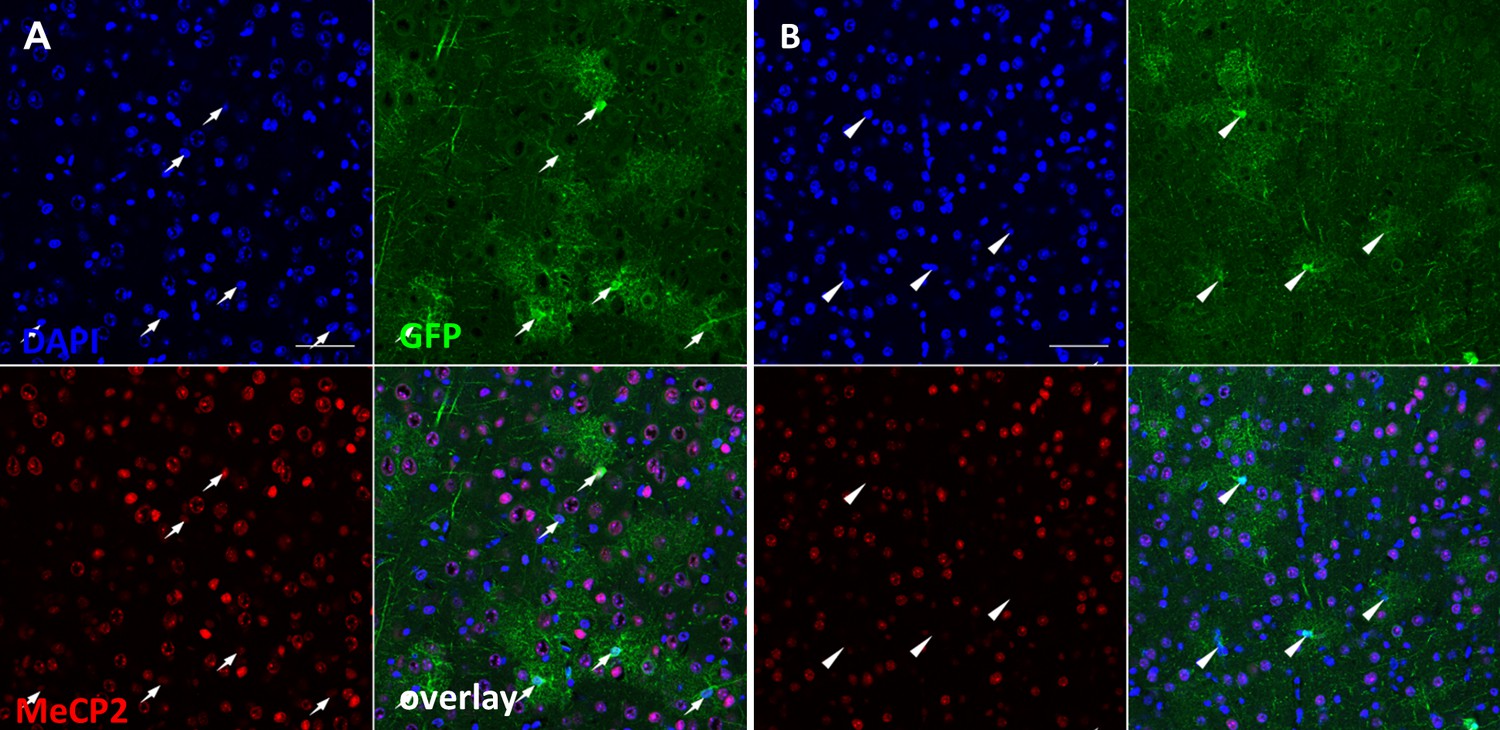
Co-staining of MeCP2 and GCaMP6 in cortex from WT (A) and MeCP2flox/y mice (B) that received AAV8-hGFAP-mCherry-Cre injection.
Note that all of the GFP positive cells from WT mice (marked by white arrows, (A) are positive for MeCP2, while all of the GFP positive cells from MeCP2flox/y mice (marked by white arrowheads, (B) are negative for MeCP2.
Figure 5—figure supplement 2
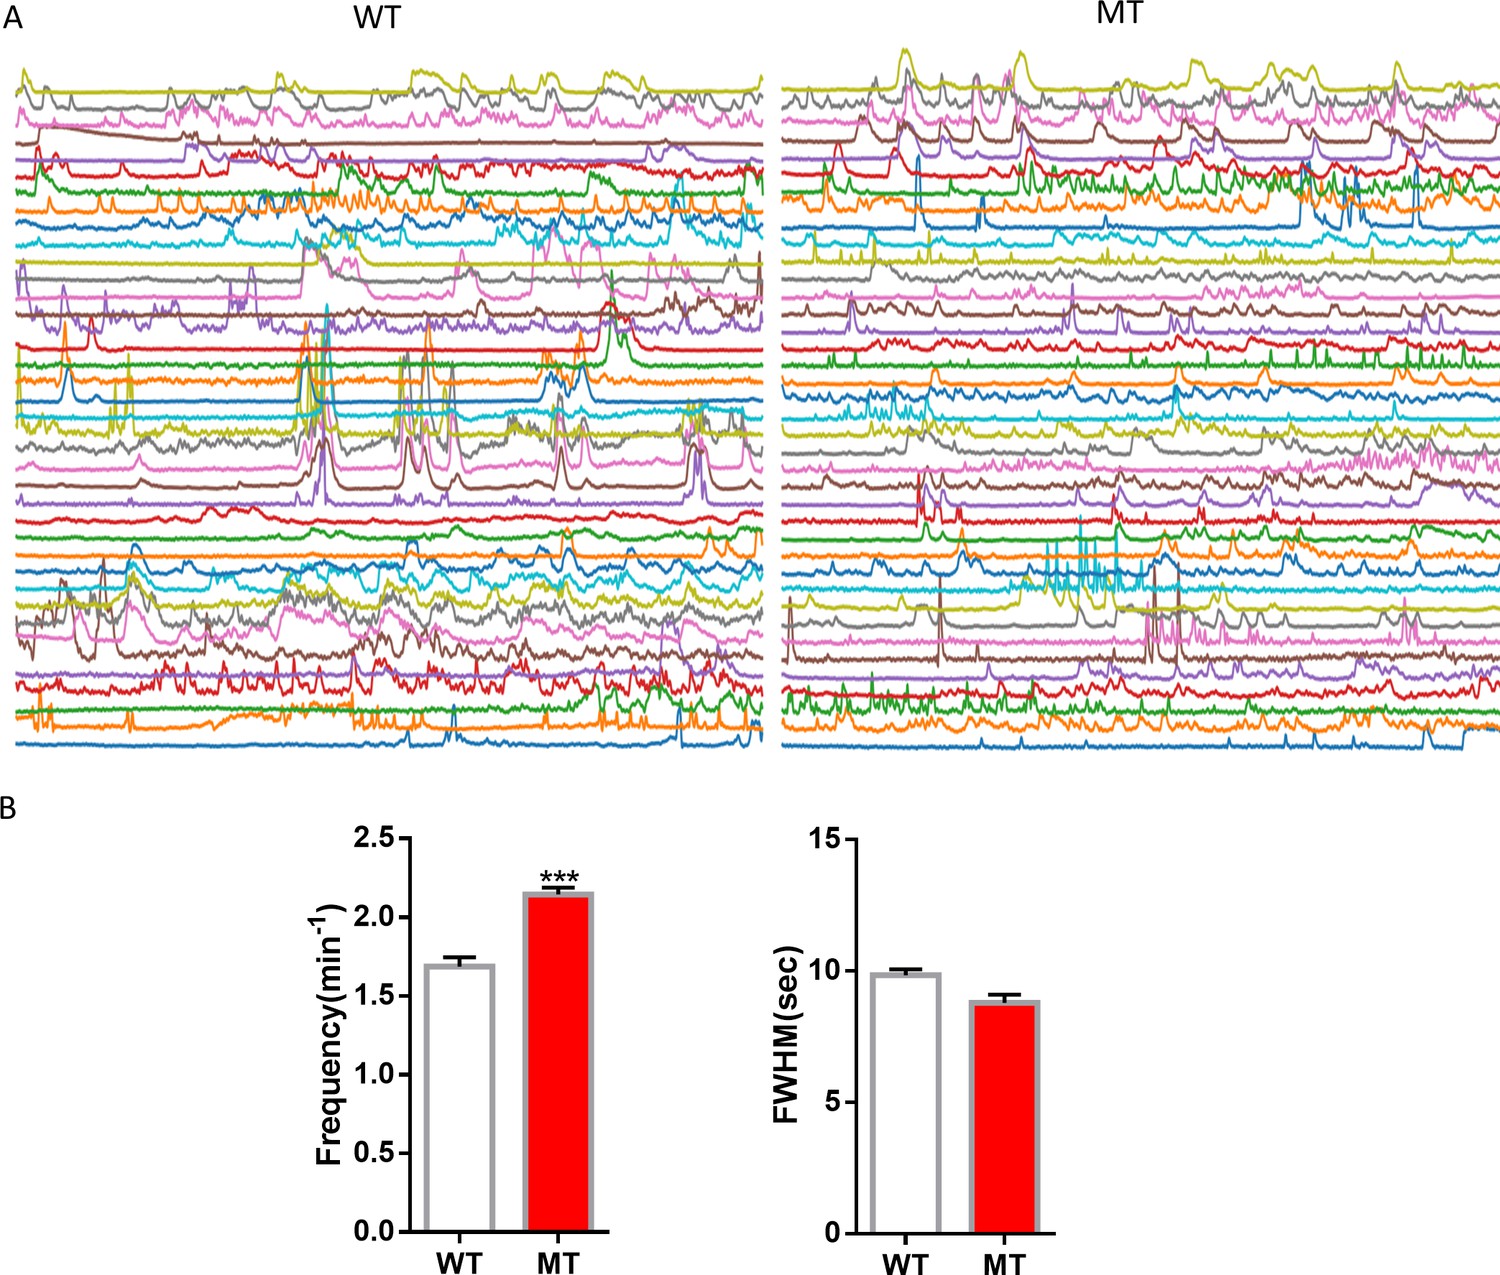
Quantification of spontaneous Ca2+ activity in astrocytic processes from live WT and Mecp2 null mice.
(A) GCaMP6 fluorescence traces in astrocytic processes from WT and Mecp2 null mice. (B) Quantification of the frequency and full width at half maximum (FWHM) of the spontaneous Ca2+ activity in astrocytic processes. ***p<0.001. Please see Table 2 for quantification of the amplitude.
Figure 6 with 5 supplements
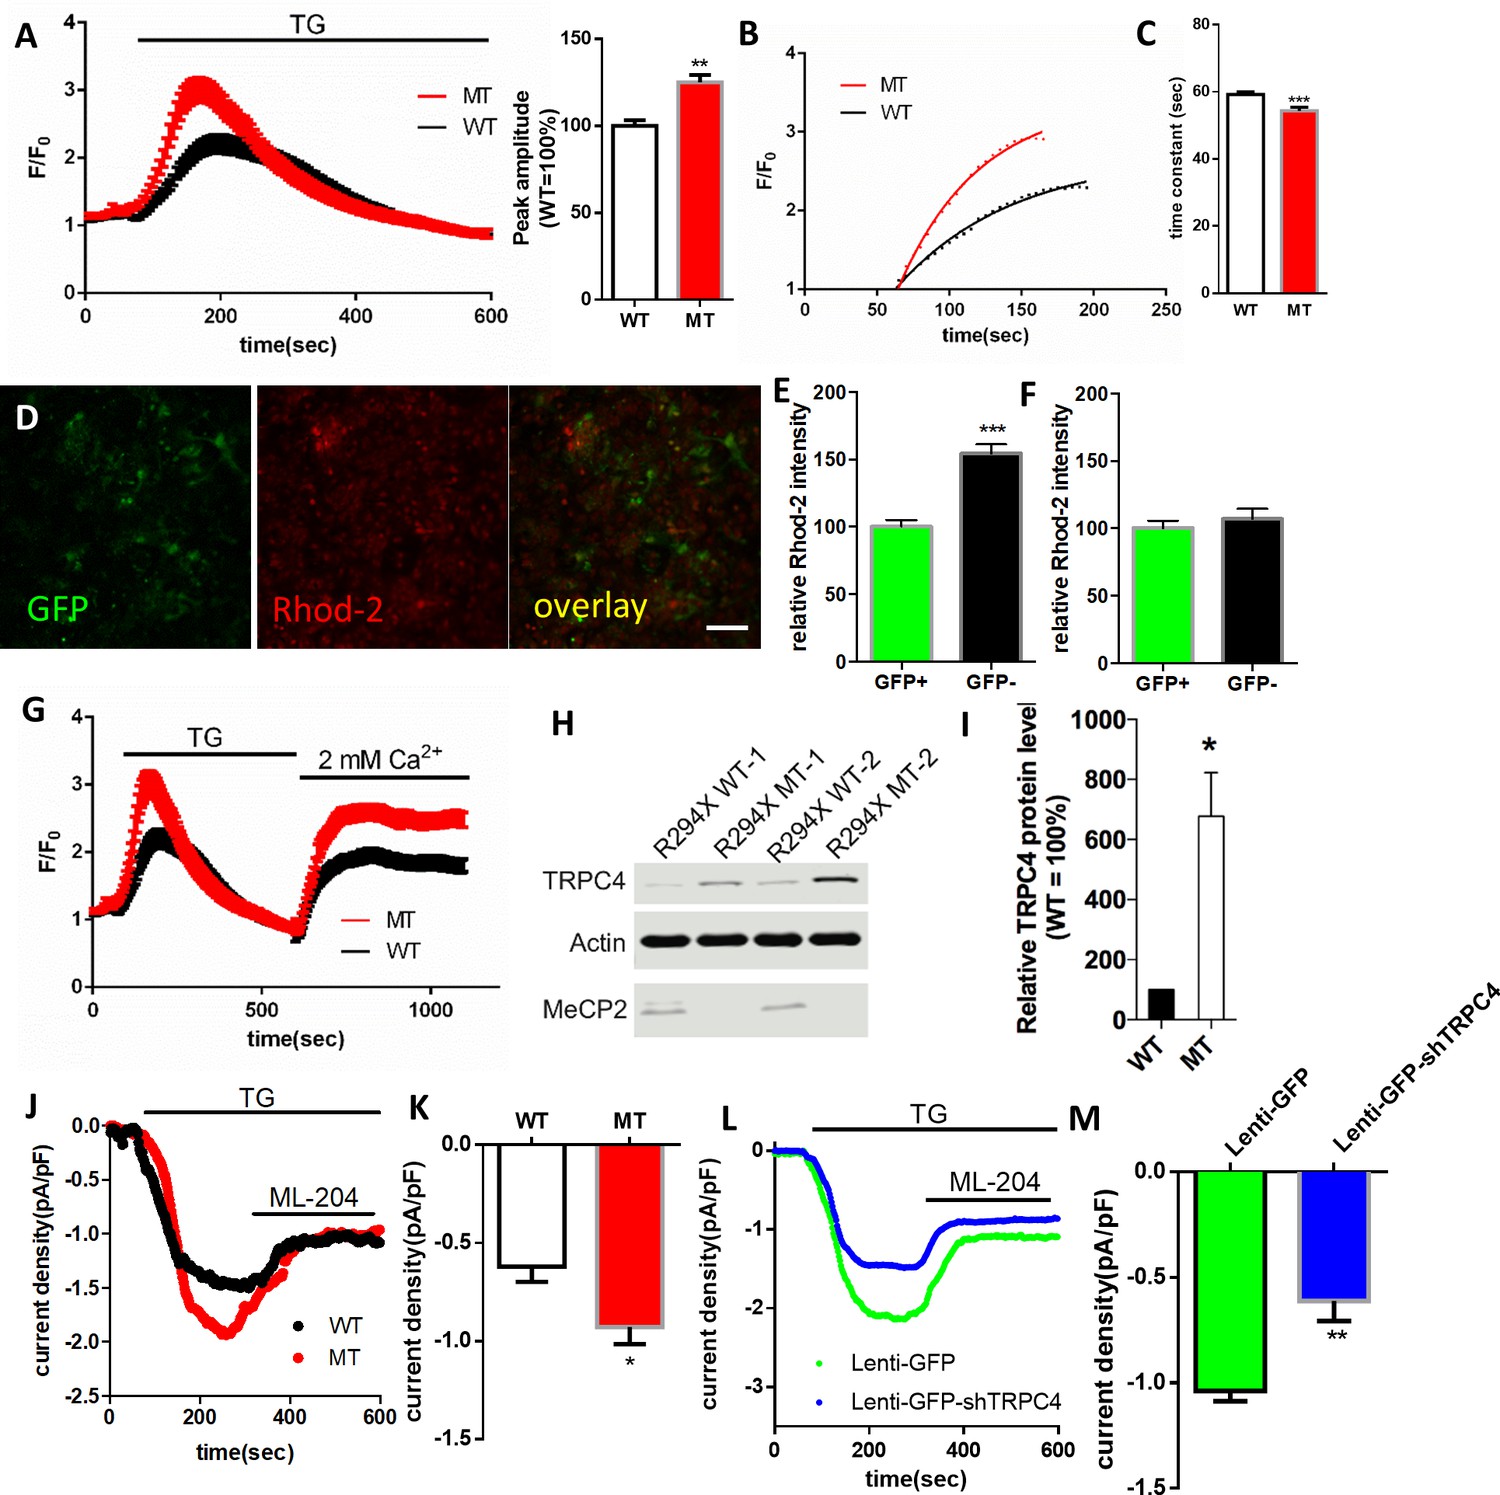
RTT astrocytes display abnormal calcium load in the ER, calcium leak from the ER, baseline cytosolic calcium level, and TRPC4-dependent SOCE.
(A) Left, average traces of Fluo4 fluorescence changes in wild type and mutant astrocytes treated with 1 μM TG to release ER calcium. Bath solution contained 0 mM Ca2+ plus 2 mM EGTA. Right, Quantification of the peak amplitude of TG induced Ca2+ elevations. (B) The rise phase (dots) shown in (A) is fitted with a single exponential curve. (C) Quantification of the time constant of the rise phase in the left panel from congenic mutant and wild type human RTT astrocytes in response to TG. (D) Representative GFP and Rhod-2 images in primary astrocytes from female Mecp2+/- ± with a GFP transgene on the wild type X chromosome. Scale bars = 50 μm. (E–F) Quantification of Rhod-2 fluorescence intensity in GFP negative and GFP positive primary astrocytes isolated from either female Mecp2+/- ± with a GFP transgene on the wild type X chromosome (E) or female Mecp2+/+ mice with a GFP transgene on the wild type X chromosome (F). (G) The average trace of Fluo4 fluorescence changes in response to extracellular Ca2+ (2 mM) after depletion of ER Ca2+ store using TG. (H) The Western blot result showing the protein level of TRPC4 in WT and MeCP2 mutant astrocytes. (I) Quantification of the Western blot results. (J) Representative traces of current density of TG-induced inward current in wild type and mutant astrocytes held at −70 mV. This current was partially blocked by TRPC4 selective antagonist, ML204. (K) Quantification of ML204 sensitive current from wild type and mutant astrocytes held at −70 mV. (L) Representative traces of current density of TG-induced inward current in mutant astrocytes infected with lentivirus expressing either GFP alone or co-expressing GFP and shTRPC4. (M) Quantification of ML204 sensitive current at −70 mV. The bar graphs in this figure show the mean ±s.e.m. *p<0.05, **p<0.01, ***p<0.001.
-
Figure 6—source data 1
The numerical data for the graphs shown in Figure 6A, C, E, F, I, K and M.
- https://doi.org/10.7554/eLife.33417.032
Figure 6—figure supplement 1
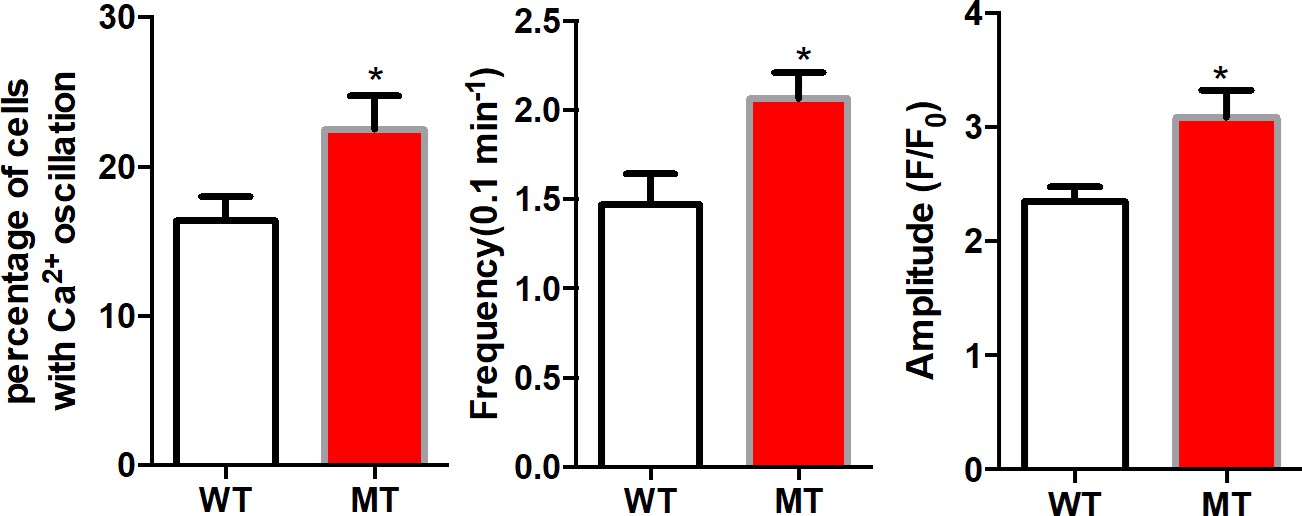
Mutant human RTT astrocytes exhibit abnormal Ca2+ activity in Ca2+-free aCSF (0 mM Ca2+ plus 2 mM EGTA).
Higher percentage of mutant astrocytes showing spontaneous Ca2+ elevations (left, p=0.04). The mutant cells exhibit a significantly higher frequency (middle, p=0.04) and amplitude (right, p=0.02) than wild type cells. 20 WT and 61 MT human astrocytes were analyzed in these experiments. The bar graphs in this figure show the mean ±s.e.m. *p<0.05.
Figure 6—figure supplement 2
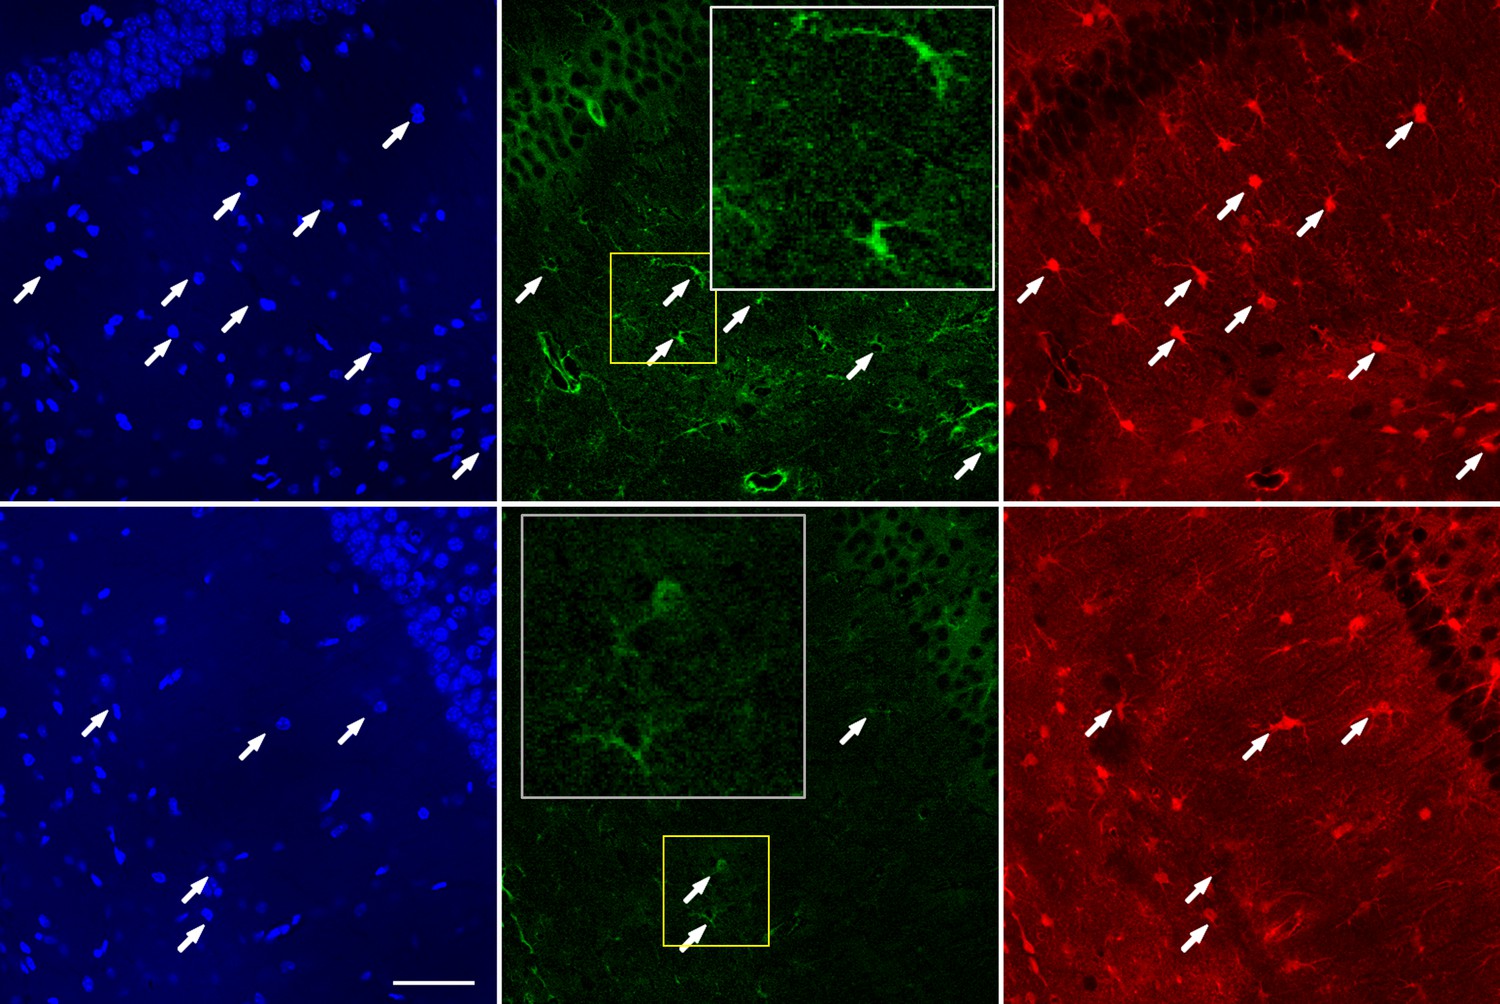
Co-staining of TRPC4 and astrocyte marker S100β on hippocampal sections from wild type (WT) and Mecp2 knockout (Mecp2-/y) mice.
(A) Strong TRPC4 immunoreactivity from Mecp2-/y (top) but not WT (bottom) mice. Arrows indicate TRPC4 fluorescence co-localized with S100β positive cells. White inserts provide zoomed-in views of the yellow boxed regions. Scale bar = 50 μm. (B) Quantification of relative TRPC4 immunoreactivity in S100β positive cells in the hippocampus of WT and Mecp2-/y mice (WT = 1). ***p<0.001.
Figure 6—figure supplement 3
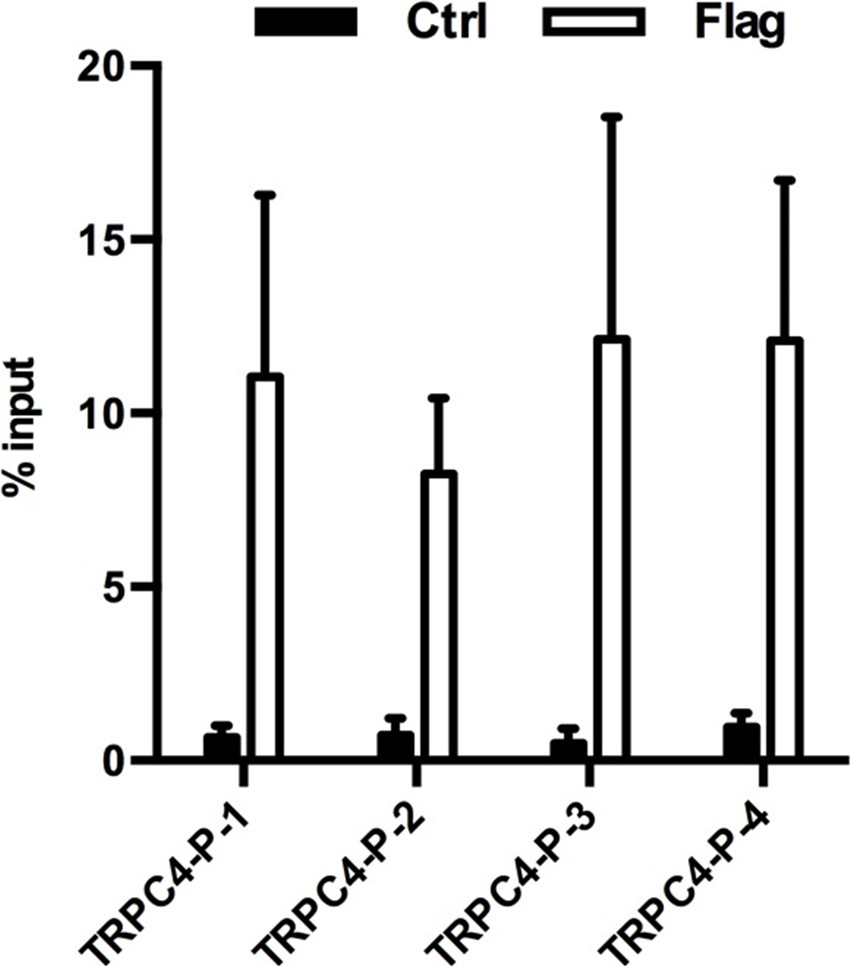
ChIP-qPCR analysis of MeCP2 occupancy on the promoter of the TrpC4 gene in primary mouse astrocytes isolated from either Mecp2-Flag mice (Flag) or control mice (ctrl).
4 pairs of primers (TRPC4-P-1 to −4) were used to cover the TrpC4 promoter. MeCP2 binding signal from the ChIP samples was normalize to signal from the input samples. The bar graphs in this figure show the mean ±s.e.m.
Figure 6—figure supplement 4
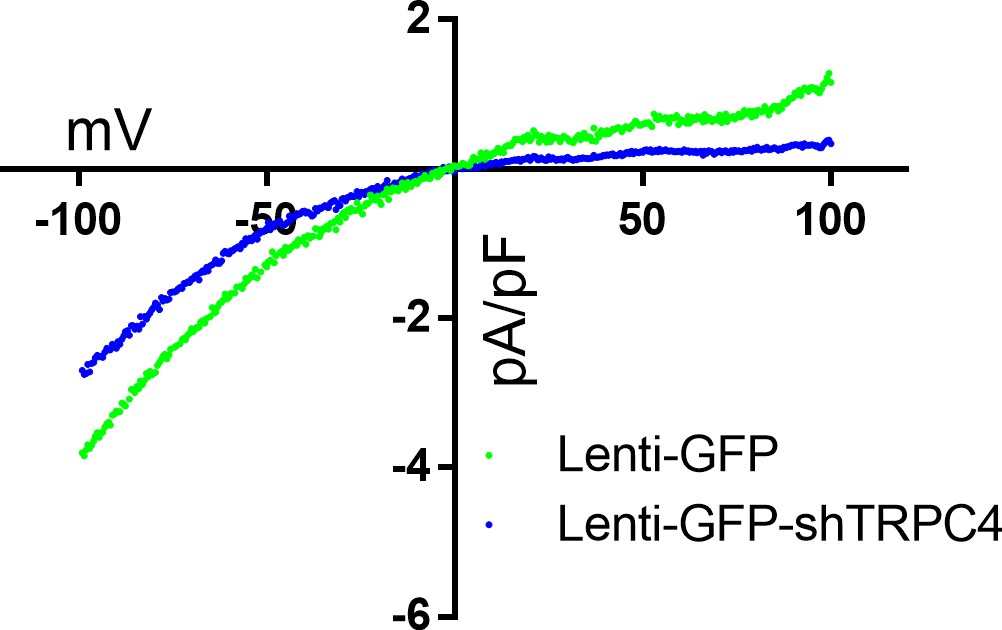
I-V curve of TG-induced ML204-sensitive current from astrocytes infected with Lenti-GFP or Lenti-GFP-shTRPC4.
https://doi.org/10.7554/eLife.33417.030
Figure 6—figure supplement 5
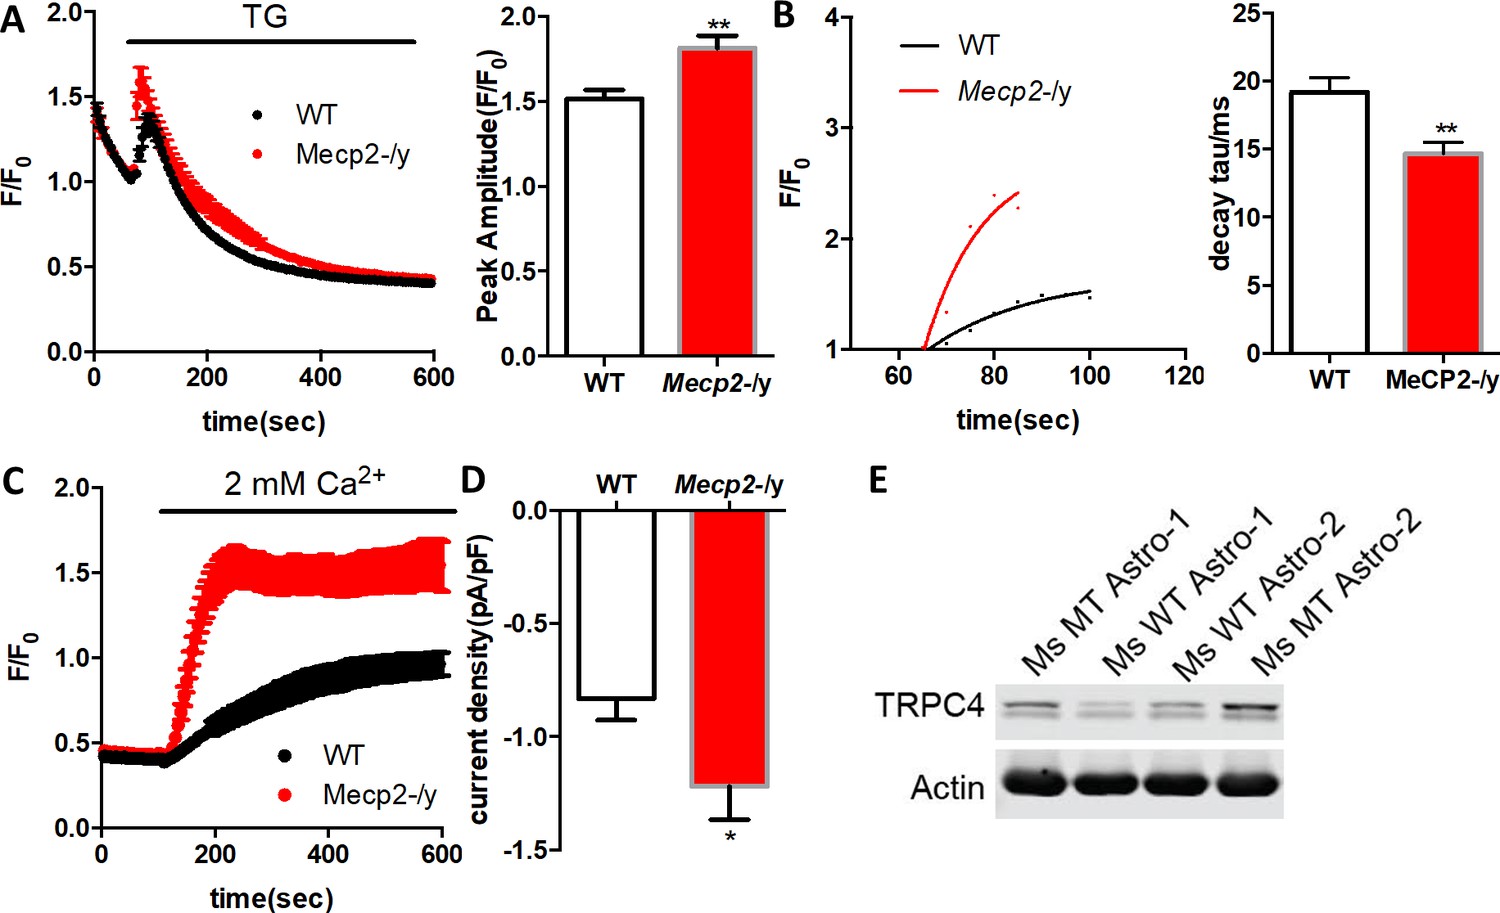
Mecp2-/y astrocytes display abnormal ER Ca2+ load, Ca2+ leakage, store operated Ca2+ entry, and TRPC4 expression.
(A) Left, average traces of Fluo4 fluorescence changes in wild type and Mecp2-/y astrocytes treated with 1 μM TG to release ER calcium. Ca2+-free aCSF (0 mM Ca2+ plus 2 mM EGTA) was used; right, quantification of the peak amplitude of F/F0 in response to TG. p=0.001. (B) Left, the rise phase (dots) shown in (a) is fitted with a single exponential curve; right, the time constant of the rise phase from Mecp2-/y astrocytes in response to TG was smaller than that from wild type cells. p=0.004. (C) The average trace of Fluo4 fluorescence changes in response to 2 mM aCSF after depletion of ER Ca2+ store by TG. (D) The quantification of ML204 sensitive current from wild type and Mecp2-/y astrocytes at −70 mV, illustrating higher TRPC4 mediated current in Mecp2-/y astrocytes. p=0.04. 9–38 WT and 10–39 Mecp2 null astrocytes were included in these analyses. (E) Western blot analysis showing increased level of TRPC4 protein in both mouse and human mutant astrocytes. The bar graphs in this figure show the mean ±s.e.m. *p<0.05, **p<0.01.
Figure 7
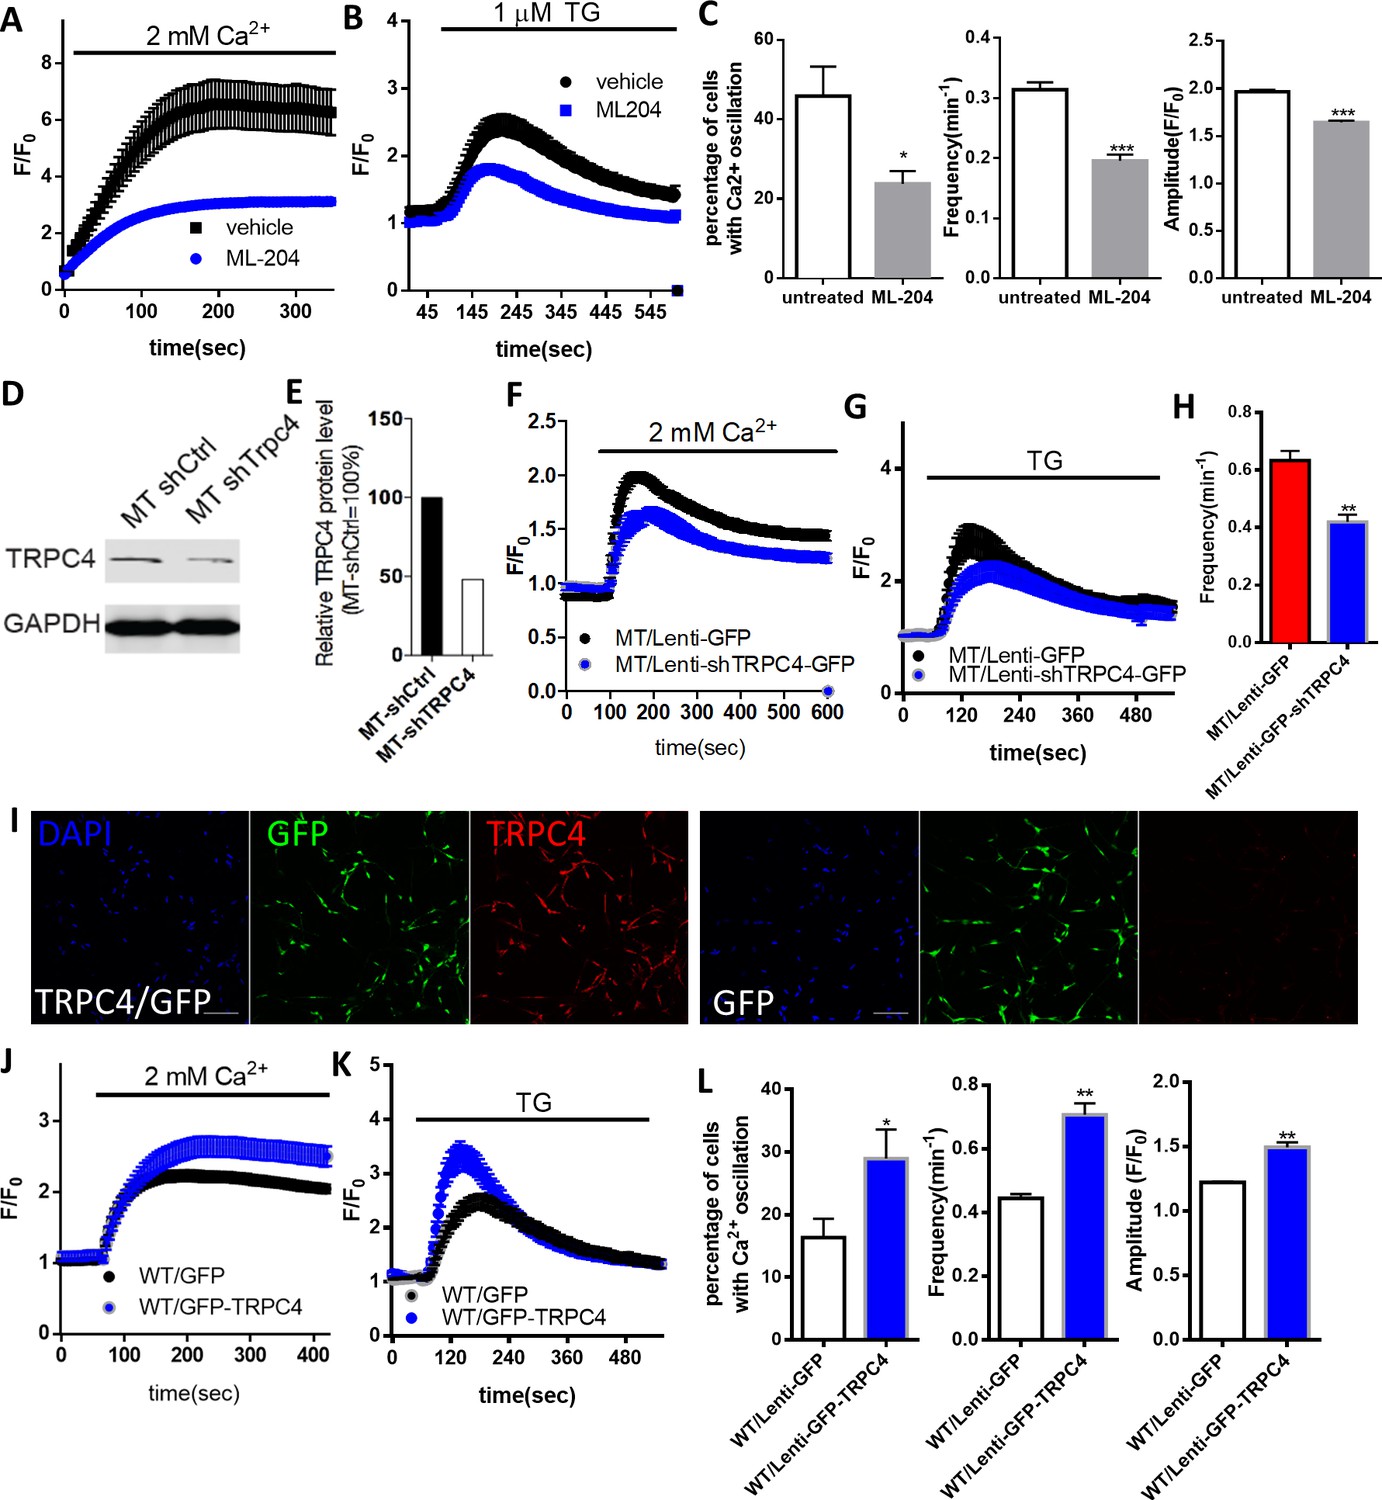
The role of TRPC4 in regulating calcium homeostasis in astrocytes.
(A) Extracellular Ca2+ -induced Fluo4 fluorescence changes after TG-induced ER Ca2+ depletion in Mecp2-/y astrocytes in the absence (control) or presence of ML204. (B) Average traces of TG-induced Fluo4 fluorescence changes in Mecp2-/y astrocytes with or without 24 hr of ML204 treatment. (C) Quantification of percentage (left) of astrocytes showing spontaneous Ca2+ oscillation and the frequency (middle) and amplitude (right) of such oscillation with or without 24 hr of ML204 treatment. (D) TRPC4 Western blot result showing decreased expression level of TRPC4 in mutant RTT human astrocytes after infected with lentivirus-shTrpc4-GFP, compared with astrocytes infected with lentivirus-GFP. (E) Quantification of the TRPC4 Western blot result. (F) Average traces of extracellular Ca2+ (2 mM)-induced Rhod-2 fluorescence changes from mutant RTT astrocytes infected with lentivirus expressing either shTRPC4/GFP or GFP alone, after depletion of ER Ca2+ store by TG pre-treatment. (G) Average traces of TG-induced Rhod-2 fluorescence changes from mutant RTT astrocytes infected with lentivirus expressing either shTRPC4/GFP or GFP alone. (H) Quantification of the frequency of spontaneous Ca2+ elevations from mutant RTT astrocytes infected with lentivirus expressing either shTRPC4/GFP or GFP alone. (I) Representative images of wild type human RTT astrocytes infected with lentivirus co-expressing TRPC4 and GFP (left) or with lentivirus expressing GFP alone (right). Note anti-TRPC4 immunoreactivity is higher in astrocytes infected with lenti-GFP/TRPC4 than in those infected with lenti-GFP. Scale bar = 50 μm. (J) Average traces of extracellular Ca2+ (2 mM)-induced Rhod-2 fluorescence changes from wild type astrocytes infected with lentivirus expressing either GFP/TRPC4 or GFP alone, after depletion of ER Ca2+ store by TG pre-treatment. (K) Average traces of TG-induced Rhod-2 fluorescence changes from wild type astrocytes infected with lentivirus expressing either GFP/TRPC4 or GFP alone. (L) Quantification of percentage (left) of astrocytes infected with lentivirus expressing either GFP/TRPC4 or GFP alone that showed spontaneous Ca2+ oscillation and the frequency (middle) and amplitude (right) of such oscillations. The bar graphs in this figure show the mean ±s.e.m. *p<0.05, **p<0.01, ***p<0.001.
-
Figure 7—source data 1
The numerical data for the graphs shown in Figure 7C, H and L.
- https://doi.org/10.7554/eLife.33417.034
Figure 8 with 2 supplements
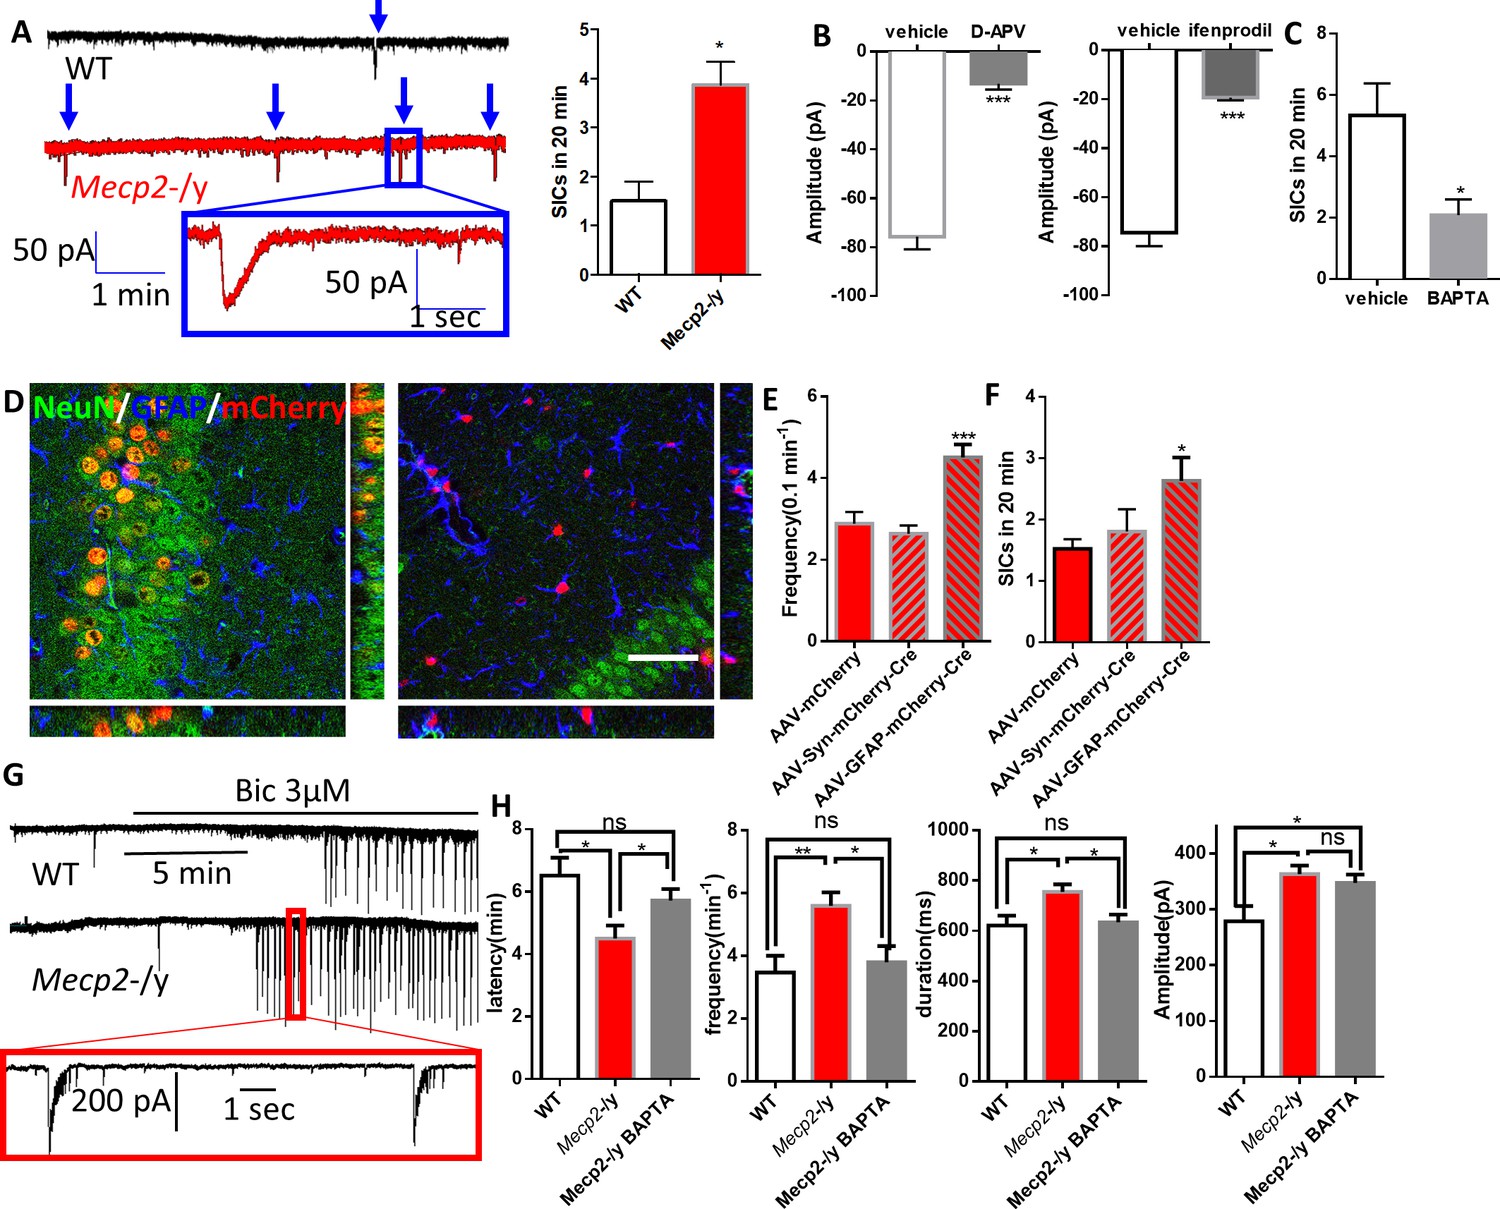
Abnormal Ca2+ activities in astrocytes lead to excessive activation of extrasynaptic NMDA receptors in neighboring neurons and increased network excitability.
(A) Left: representative traces of whole-cell patch clamp recording from CA1 pyramidal neurons in acute hippocampal slices prepared from wild type and Mecp2-/y mice showing slow inward currents (SICs). Arrows indicate all SICs. Inset: magnified view of the recording. Right: quantification of the SIC frequency in neurons from wild type and Mecp2-/y mice. (B) Quantification of the amplitude of SICs of neurons under control condition and in the presence of D-APV (left), an antagonist of NMDA receptors, or ifenprodil (right), a selective antagonist of NR2B-containing NMDA receptors. (C) Quantification of the SIC frequency in neurons adjacent to astrocytes with or without intracellular infusion of BAPTA. (D) Orthogonal (x-y view, y-z view, and x-z view) projections of z-scanning images showing immunofluorescence of NeuN and GFAP in regions around the hippocampus. The left image is from a Mecp2flox/y mouse injected with AAV-hSyn-mCherry-Cre, while the right image is from a Mecp2flox/y mouse injected with AAV-GFAP-mCherry-Cre. Note that all of the mCherry positive cells are NeuN positive in the left image, while all of the mCherry positive cells are GFAP positive in the right image. Scale bars = 50 μm. (E) Quantification of the frequency of the spontaneous Ca2+ oscillations in astrocytes from Mecp2flox/y mice injected with AAV-mCherry, AAV-hSyn-mCherry-Cre, or AAV-GFAP-mCherry-Cre. ***p<0.001 vs. AAV-mCherry. (F) Quantification of the SIC frequency from Mecp2flox/y mice injected with AAV-mCherry, AAV-hSyn-mCherry-Cre, or AAV-GFAP-mCherry-Cre. *p<0.05 vs. AAV-mCherry. (G) Representative patch clamp recordings in CA1 pyramidal neurons showing characteristic spontaneous epileptiform bursting activity in response to application of the GABAA-receptor antagonist bicuculline (3 μM) from wild-type (top) and Mecp2-/y (bottom) mice. (H) Quantification of the latency, frequency, duration and the amplitude of the epileptiform activity. The latency is defined as the time elapsed between Bic application and epileptiform activity onset. The bar graphs in this figure show the mean ±s.e.m. *p<0.05, **p<0.01, ***p<0.001.
-
Figure 8—source data 1
The numerical data for the graphs shown in Figure 8A, B, C, E, F and H.
- https://doi.org/10.7554/eLife.33417.038
Figure 8—figure supplement 1
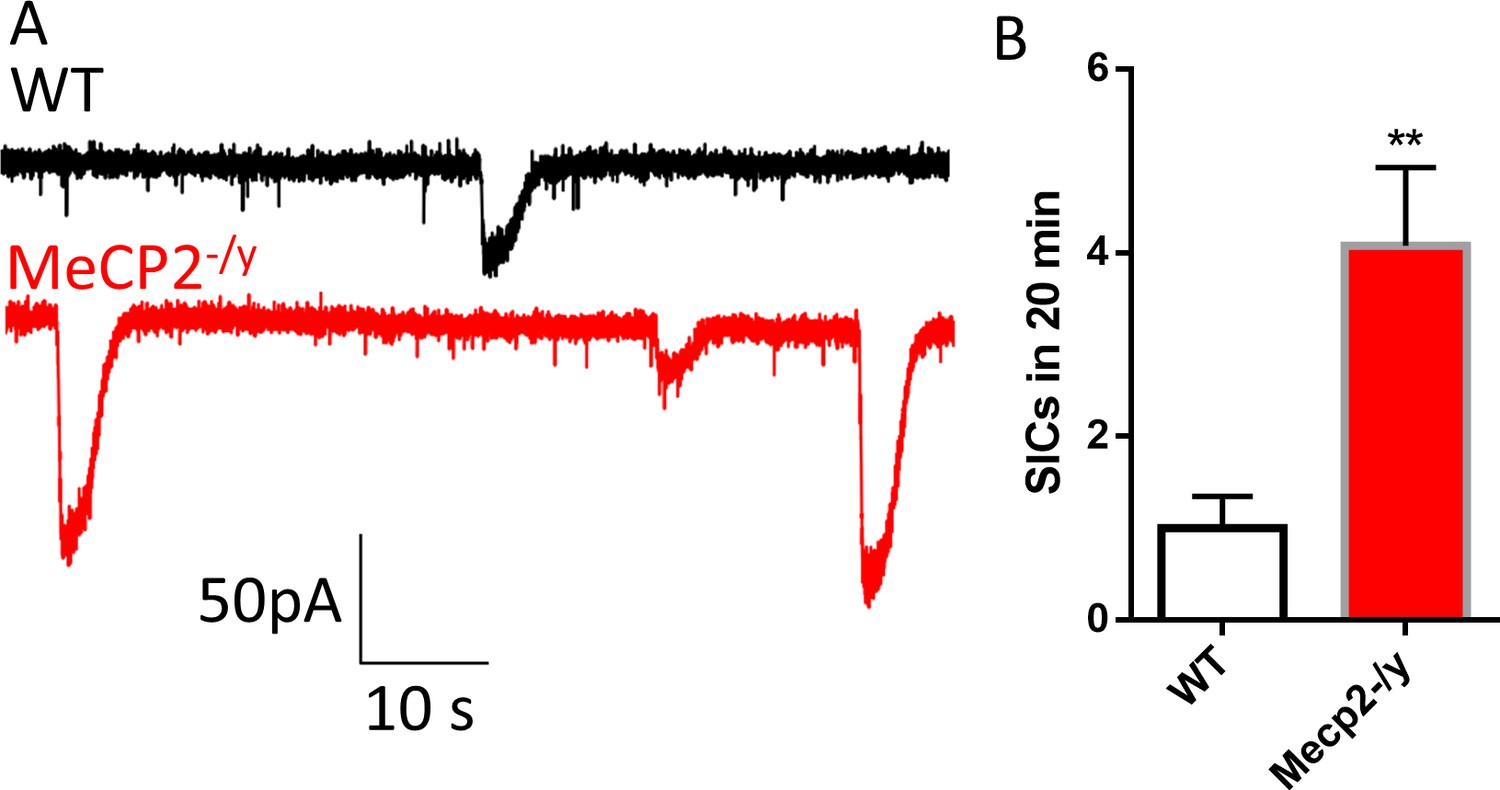
Excessive activation of extrasynaptic NMDA receptors in acute hippocampal slices from Mecp2 knockout (Mecp2-/y) mice.
(A) Sample recording traces from wild type (WT) and Mecp2-/y mice showing the EPSCs and slow inward currents (SICs). (B) Quantification of the frequency of SICs from Mecp2-/y mice. **p<0.01.
Figure 8—figure supplement 2
Immunohistological analysis of AAV-injected mice.
(A) Co-staining of MeCP2 and GFAP on hippocampal sections from Mecp2flox/y mice injected with AAV-GFAP-mCherry-Cre. (B) co-staining of MeCP2 and NeuN on hippocampal sections from Mecp2flox/y mice injected with AAV-Syn-mCherry-Cre. Note that all the mCherry positive cells (marked by white arrowheads) are negative for MeCP2 (MeCP2-). White insets present a high magnification view of region outlined by yellow boxes. Scale bars = 50 μm.
Figure 9
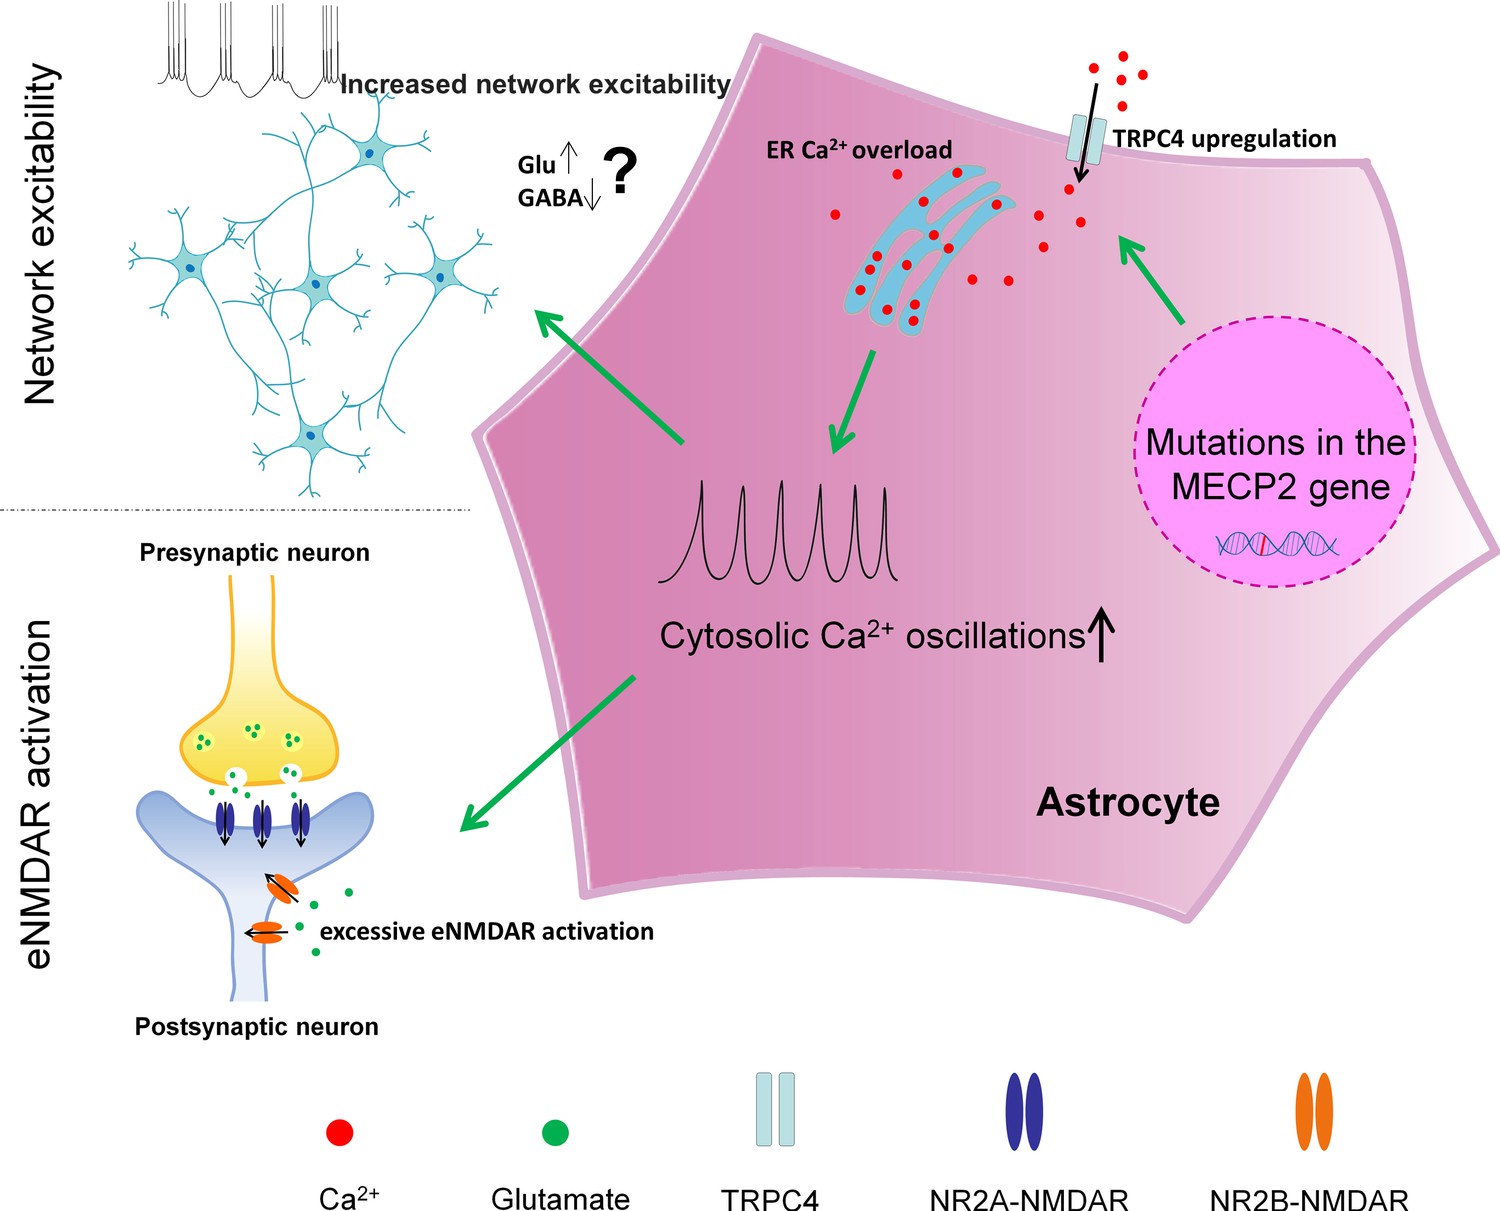
A schematic summary of the findings in our study.
https://doi.org/10.7554/eLife.33417.041Videos
Video 1
Spontaneous calcium activities in wild type human astrocytes
https://doi.org/10.7554/eLife.33417.002
Video 2
Spontaneous calcium activities in mutant human astrocytes
https://doi.org/10.7554/eLife.33417.003
Video 3
Spontaneous calcium activities in astrocytes from live wild type mice
https://doi.org/10.7554/eLife.33417.020
Video 4
Spontaneous calcium activities in astrocytes from live Mecp2 mutant mice
https://doi.org/10.7554/eLife.33417.021Tables
Table 1
Quantification of the percentage of GFAP+ cell in five differentiations from human iPSCs
https://doi.org/10.7554/eLife.33417.004| stereology # | 1 | 2 | 3 | 4 | 5 | |
|---|---|---|---|---|---|---|
| WT | 90% | 94% | 92% | 89% | 91% | |
| MT | 90% | 92% | 94% | 89% | 92% |
Table 2
Amplitudes of spontaneous Ca2+ elevations in different experiments
https://doi.org/10.7554/eLife.33417.005| Cell type | Wild-type | Mutant |
|---|---|---|
| R294X astrocytes | 1.660 ± 0.01624 N = 1091 | 1.808 ± 0.01882 N = 2962 |
| R294X astrocytes (processes) | 1.467 ± 0.01601 N = 2228 | 1.722 ± 0.01994 N = 2743 |
| V247fs astrocytes | 1.686 ± 0.02453 N = 902 | 1.816 ± 0.02128 N = 1760 |
| V247fs astrocytes (processes) | 1.560 ± 0.02224 N = 1825 | 1.640 ± 0.02447 N = 2312 |
| Mouse primary astrocytes | 1.787 ± 0.007193 N = 5694 | 1.822 ± 0.006209 N = 8389 |
| Astrocytes in situ | 2.010 ± 0.02998 N = 1367 | 2.151 ± 0.03079 N = 1997 |
| Astrocytes in vivo | 3.463 ± 0.1410 N = 285 | 3.045 ± 0.05410 N = 1346 |
| Astrocytes in vivo (processes) | 3.283 ± 0.03640 N = 2040 | 3.007 ± 0.01546 N = 8796 |
Table 3
Histological results of mice injected with AAVs (I)
https://doi.org/10.7554/eLife.33417.039| Mice injected with AAV-GFAP-mCherry-Cre | Mice injected with AAV-hSyn-mCherry-Cre | |
|---|---|---|
| %GFAP + cells in all mCherry + cells | 100 | 0 |
| %NeuN + cells in all mCherry + cells | 0 | 100 |
| %mCherry + cells in all GFAP + cells | 28 ± 3 | 0 |
| %mCherry + cells in all NeuN + cells | 0 | 74 ± 10 |
Table 4
Histological results of mice injected with AAVs (II)
https://doi.org/10.7554/eLife.33417.040| Mice injected with AAV-GFAP-mCherry-Cre | Mice injected with AAV-hSyn-mCherry-Cre | |
|---|---|---|
| %MeCP2- cells in all mCherry + cells | 98 ± 0.8 | 97 ± 1.5 |
| %MeCP2- cells in all GFAP + cells | 35 ± 3 | 7 ± 1.7 |
| %MeCP2- cells in all NeuN + cells | 2 ± 0.1 | 75 ± 11 |
Table 5
List of statistical methods
https://doi.org/10.7554/eLife.33417.042| Figure | Statistical methods |
|---|---|
| Figure 1C | Mann-Whitney U Test |
| Figure 1E | Mann-Whitney U Test |
| Figure 2C | Two Tailed Unpaired t-Test |
| Mann-Whitney U Test | |
| Mann-Whitney U Test | |
| Figure 2E | Mann-Whitney U Test |
| Figure 3C | Two Tailed Unpaired t-Test |
| Mann-Whitney U Test | |
| Figure 3E | Mann-Whitney U Test |
| Figure 4C | Mann-Whitney U Test |
| Figure 4E | Mann-Whitney U Test |
| Figure 5C | Two Tailed Unpaired t-Test |
| Mann-Whitney U Test | |
| Figure 6A | Mann-Whitney U Test |
| Figure 6C | Mann-Whitney U Test |
| Figure 6E | Two Tailed Unpaired t-Test |
| Figure 6F | Two Tailed Unpaired t-Test |
| Figure 6I | Two Tailed Unpaired t-Test |
| Figure 6K | Two Tailed Unpaired t-Test |
| Figure 6M | Mann-Whitney U Test |
| Figure 7C | Mann-Whitney U Test |
| Figure 7H | Mann-Whitney U Test |
| Figure 7L | Two Tailed Unpaired t-Test |
| Mann-Whitney U Test | |
| Mann-Whitney U Test | |
| Figure 8A | Two Tailed Unpaired t-Test |
| Figure 8B | Mann-Whitney U Test |
| Figure 8C | Mann-Whitney U Test |
| Figure 8E | One-way ANOVA followed by post-hoc Holm-Sidak test |
| Figure 8F | One-way ANOVA followed by post-hoc Holm-Sidak test |
| Figure 8H | Two Tailed Unpaired t-Test |
Additional files
-
Source code 1
Source code ca_signal.py: code used for the analysis of fluorescence changes, the detection of calcium events, measurement of peak amplitudes, and full width at half maximum in Figures 1–8.
- https://doi.org/10.7554/eLife.33417.043
-
Source code 2
Source code segment.py: code used for the automated segmentation step in image analysis in Figures 1–8.
It identifies each ROI by the results of cross correlation analysis. Briefly, all the local maximum pixels are detected as the initial ROIs. Then the cross correlation of fluorescence change between an ROI and a surrounding pixel is calculated. If the cross correlation is greater than a given threshold, this pixel is added to the ROI. The procedure is repeated until no more pixel can be added.
- https://doi.org/10.7554/eLife.33417.044
-
Supplementary file 1
Expression levels of SOCE-related genes in wild type and mutant RTT human astrocytes.
- https://doi.org/10.7554/eLife.33417.045
-
Transparent reporting form
- https://doi.org/10.7554/eLife.33417.046
Download links
A two-part list of links to download the article, or parts of the article, in various formats.
Downloads (link to download the article as PDF)
Open citations (links to open the citations from this article in various online reference manager services)
Cite this article (links to download the citations from this article in formats compatible with various reference manager tools)
Mechanism and consequence of abnormal calcium homeostasis in Rett syndrome astrocytes
eLife 7:e33417.
https://doi.org/10.7554/eLife.33417


