Large-scale replication study reveals a limit on probabilistic prediction in language comprehension
- Mante S Nieuwland

- Stephen Politzer-Ahles
- Evelien Heyselaar
- Katrien Segaert
- Emily Darley
- Nina Kazanina
- Sarah Von Grebmer Zu Wolfsthurn
- Federica Bartolozzi
- Vita Kogan
- Aine Ito
- Diane Mézière
- Dale J Barr
- Guillaume A Rousselet
- Heather J Ferguson
- Simon Busch-Moreno
- Xiao Fu
- Jyrki Tuomainen
- Eugenia Kulakova
- E Matthew Husband
- David I Donaldson
- Zdenko Kohút
- Shirley-Ann Rueschemeyer
- Falk Huettig
- Max Planck Institute for Psycholinguistics, Netherlands
- University of Edinburgh, United Kingdom
- The Hong Kong Polytechnic University, Hong Kong
- University of Oxford, United Kingdom
- University of Birmingham, United Kingdom
- University of Bristol, United Kingdom
- University of Glasgow, United Kingdom
- University of Kent, United Kingdom
- University College London, United Kingdom
- University of Stirling, United Kingdom
- University of York, United Kingdom
Figures
Figure 1
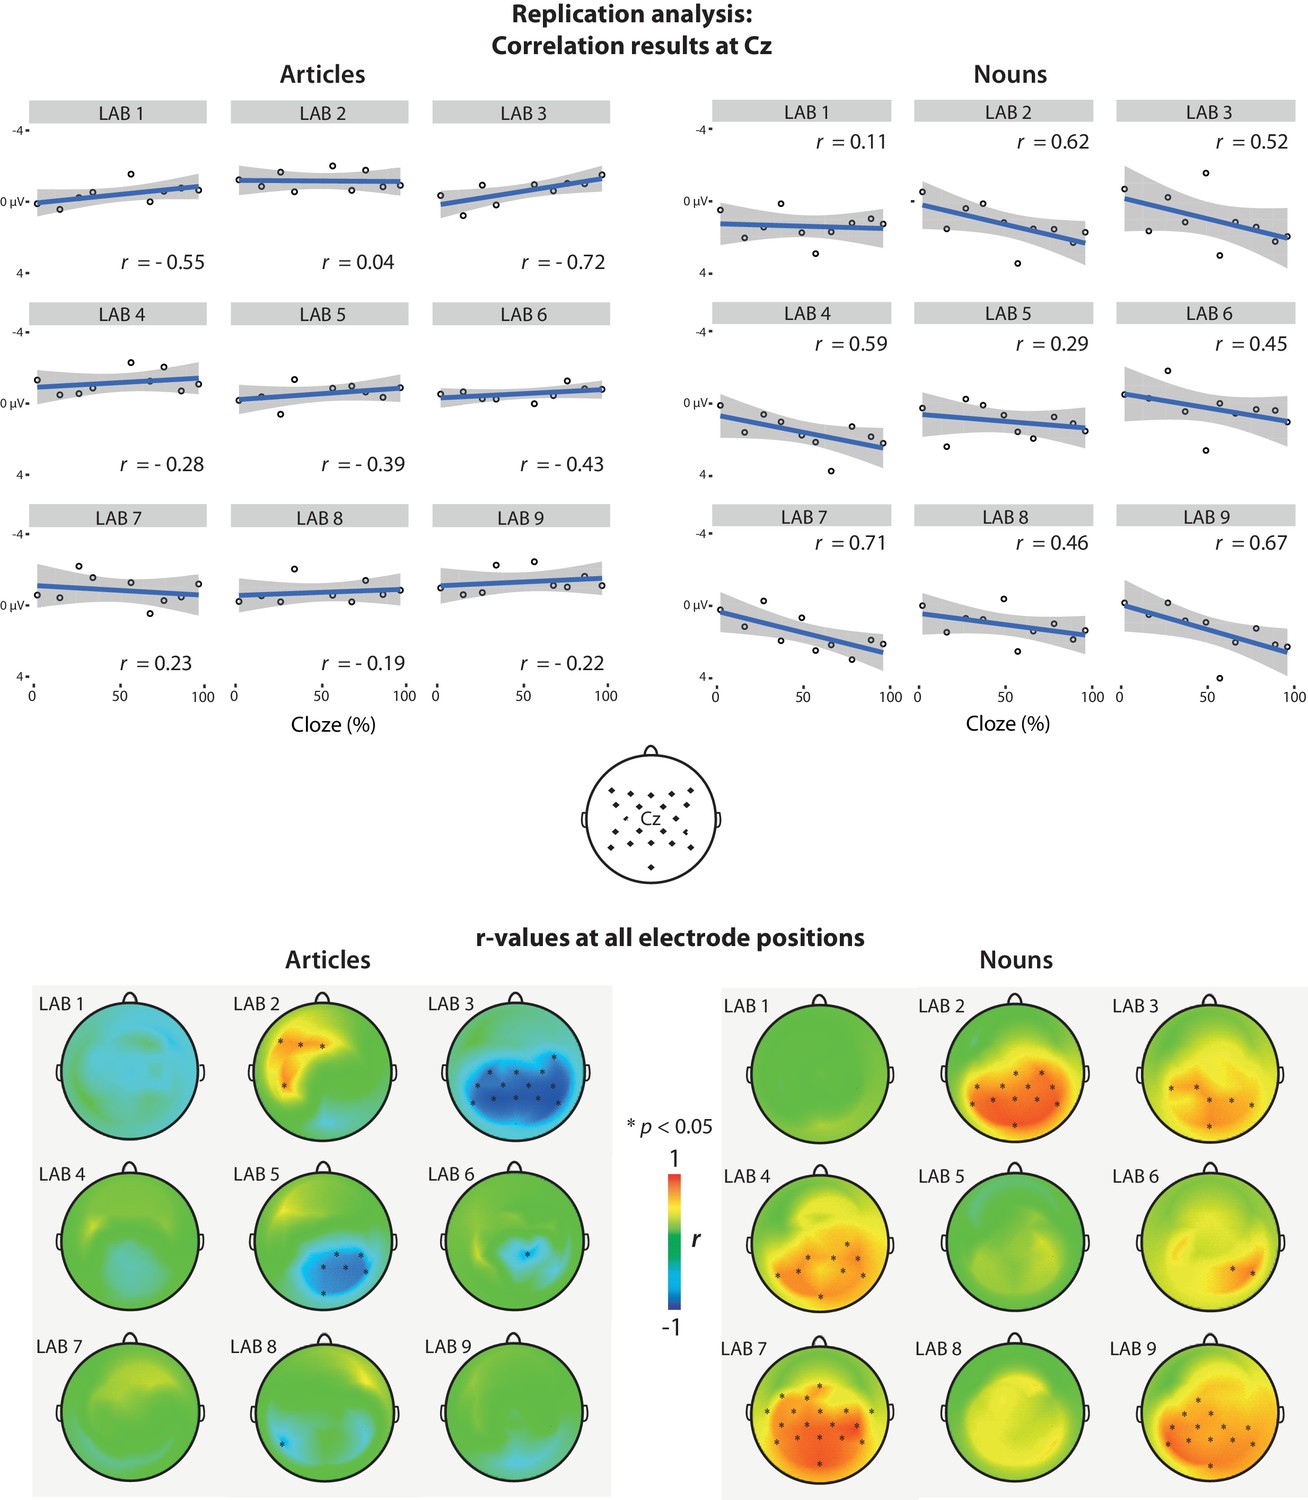
Replication analysis.
Correlations between N400 amplitude and article/noun cloze probability per laboratory. N400 amplitude is the mean voltage in the 200–500 ms time window after word onset. A positive value corresponds to the canonical finding that N400 amplitude became smaller (less negative—more positive) with increasing cloze probability. Here and in all further plots, negative voltages are plotted upwards. Upper graph: Scatter plots showing the correlation between cloze and N400 activity at electrode Cz, for each lab. The position of Cz and the other electrodes is displayed in the head plot in between the upper and lower graph. Lower graph: Scalp distribution of the r-values for each lab. Asterisks (*) indicate electrodes that showed a statistically significant correlation (two-tailed p<0.05, not corrected for multiple comparisons). Exact r- and p-values for each laboratory and EEG channel are available as source data (Figure 1—source datas 1–4) and on https://osf.io/eyzaq.
-
Figure 1—source data 1
r-values for the articles for each laboratory and each channel
- https://doi.org/10.7554/eLife.33468.003
-
Figure 1—source data 2
p-values for the articles for each laboratory and each channel.
- https://doi.org/10.7554/eLife.33468.004
-
Figure 1—source data 3
r-values for the nouns for each laboratory and each channel.
- https://doi.org/10.7554/eLife.33468.005
-
Figure 1—source data 4
r-values for the nouns for each laboratory and each channel.
- https://doi.org/10.7554/eLife.33468.006
Figure 2
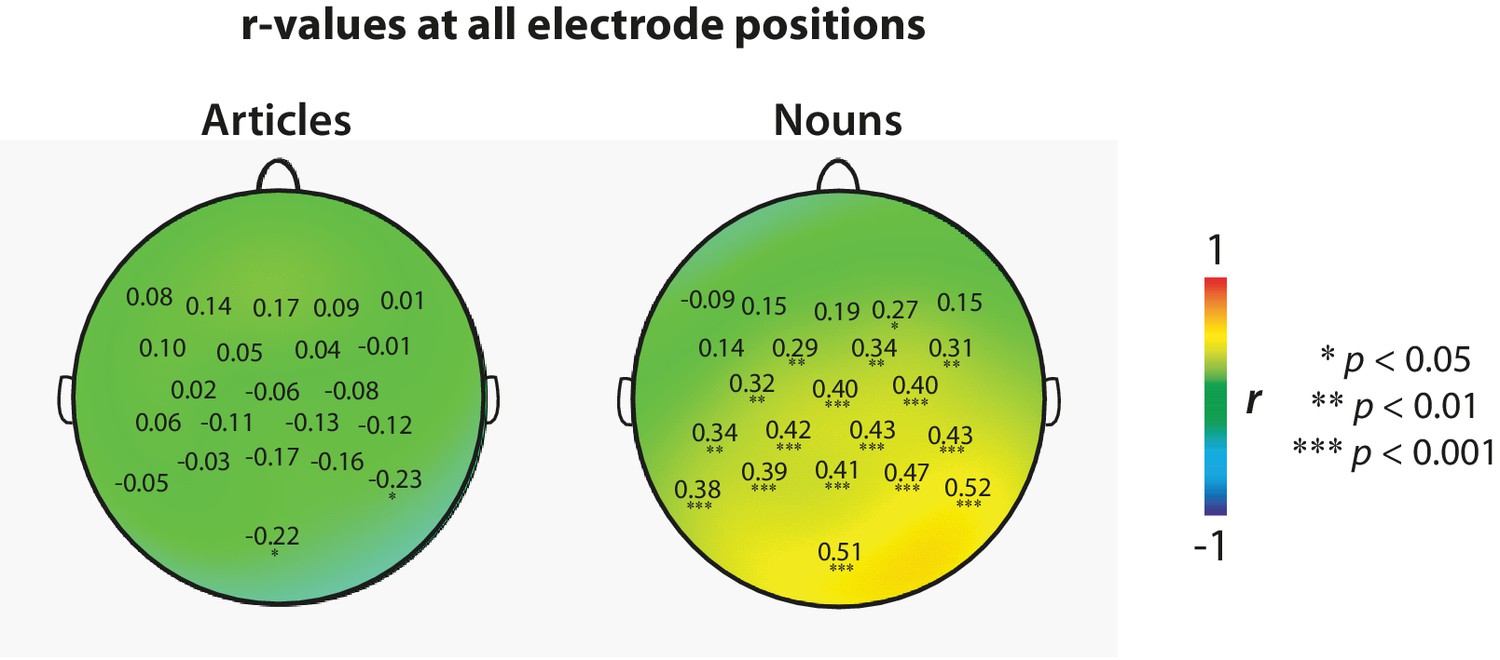
Replication analysis.
Scalp distribution and r-values at each channel based on data pooled from all laboratories, using a 500 ms baseline correction procedure as used by DeLong et al. (2005). Data were pooled after computing bin-averages per laboratory as in the original study, treating the laboratories as multiple observations of each bin-average. Asterisks (*) indicate electrodes that showed a statistically significant correlation (two-tailed, not corrected for multiple comparisons). Exact r- and p-values for each EEG channel are available as source data (Figure 2—source datas 1–4).
-
Figure 2—source data 1
r-values for the articles for each channel, computed across laboratories.
- https://doi.org/10.7554/eLife.33468.008
-
Figure 2—source data 2
p-values for the articles for each channel, computed across laboratories.
- https://doi.org/10.7554/eLife.33468.009
-
Figure 2—source data 3
r-values for the nouns for each channel, computed across laboratories.
- https://doi.org/10.7554/eLife.33468.010
-
Figure 2—source data 4
p-values for the nouns for each channel, computed across laboratories.
- https://doi.org/10.7554/eLife.33468.011
Figure 3
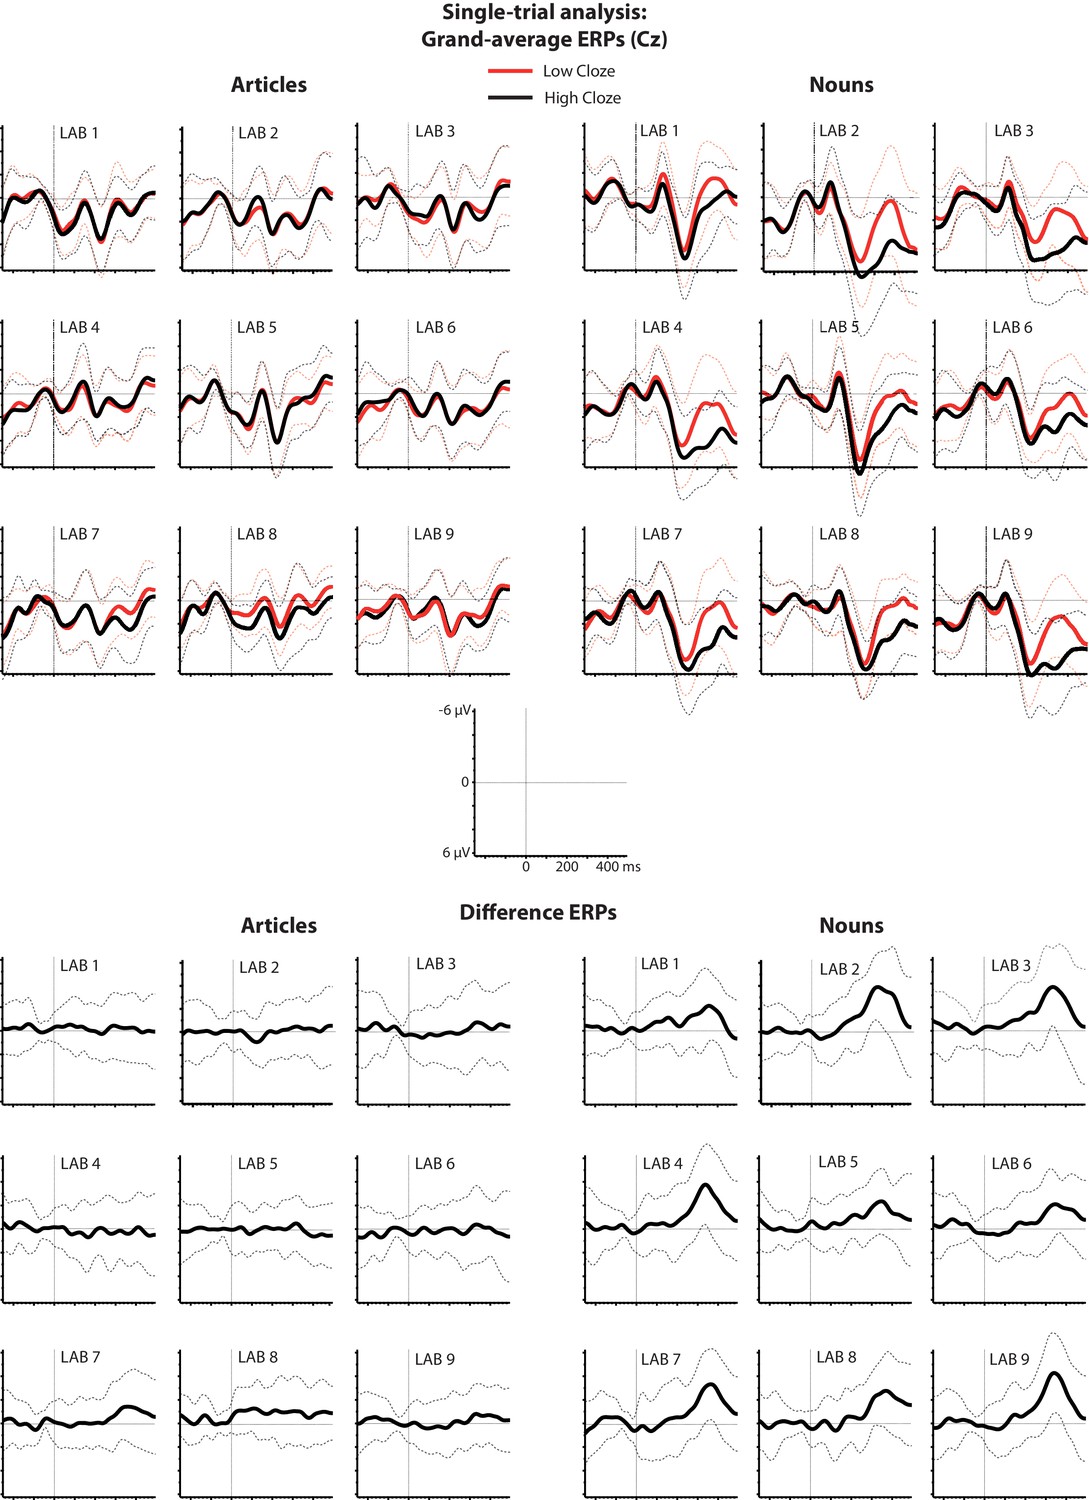
Single-trial analysis.
Grand-average ERPs elicited by relatively expected and unexpected words (cloze higher/lower than 50%) and the associated difference waveforms (low minus high cloze) at electrode Cz. Dotted lines indicate one standard deviation above or below the grand average.
Figure 4
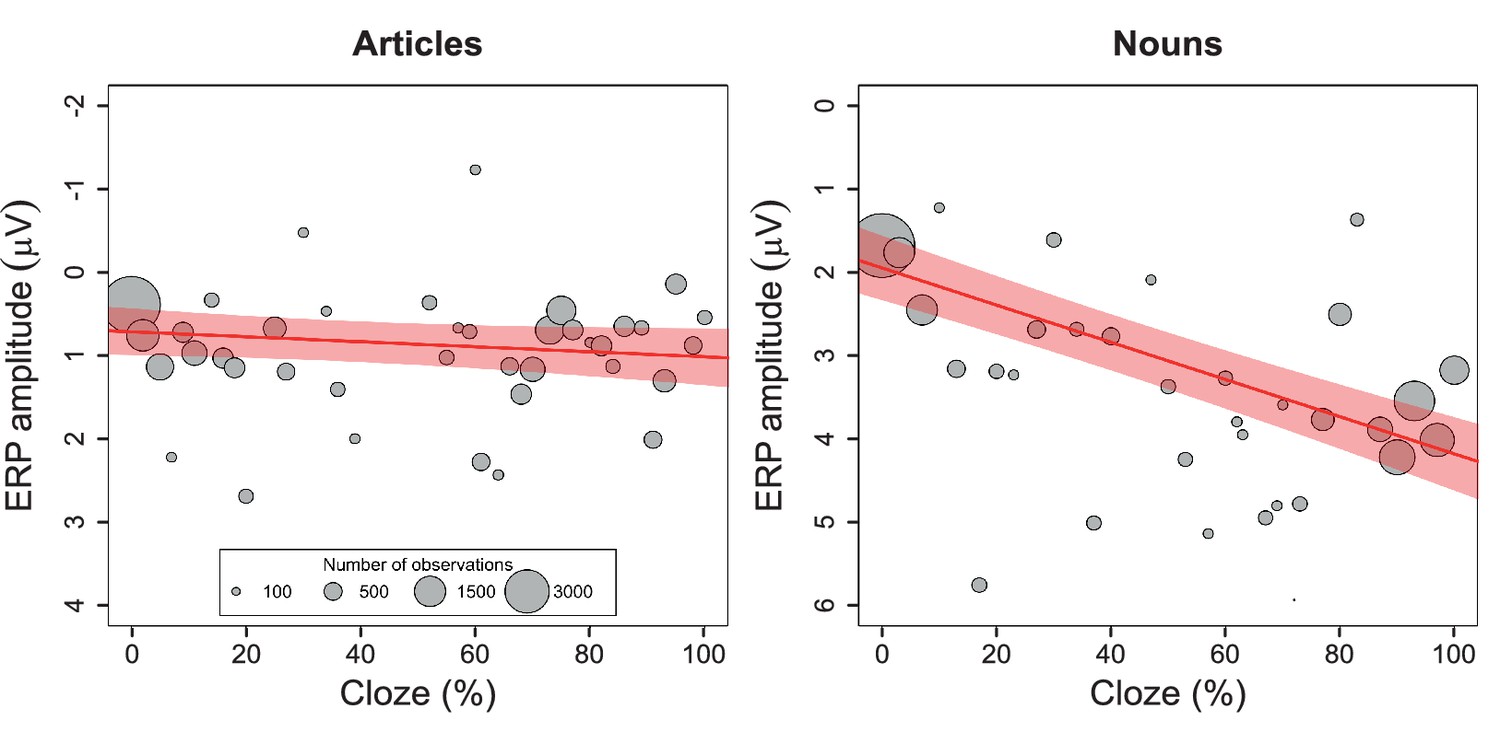
Single-trial analysis.
Relationship between cloze and ERP amplitude for articles and nouns in the N400 spatiotemporal window, as illustrated by the mean ERP values per cloze value (number of observations reflected in circle size), along with the regression line and 95% confidence interval. A change in article cloze from 0 to 100 is associated with a change in amplitude of 0.296 µV (95% confidence interval: −0.08 to .67). A change in noun-cloze from 0 to 100 is associated with a change in amplitude of 2.22 µV (95% confidence interval: 1.75 to 2.69). The data for these analyses were pooled across all nine labs.
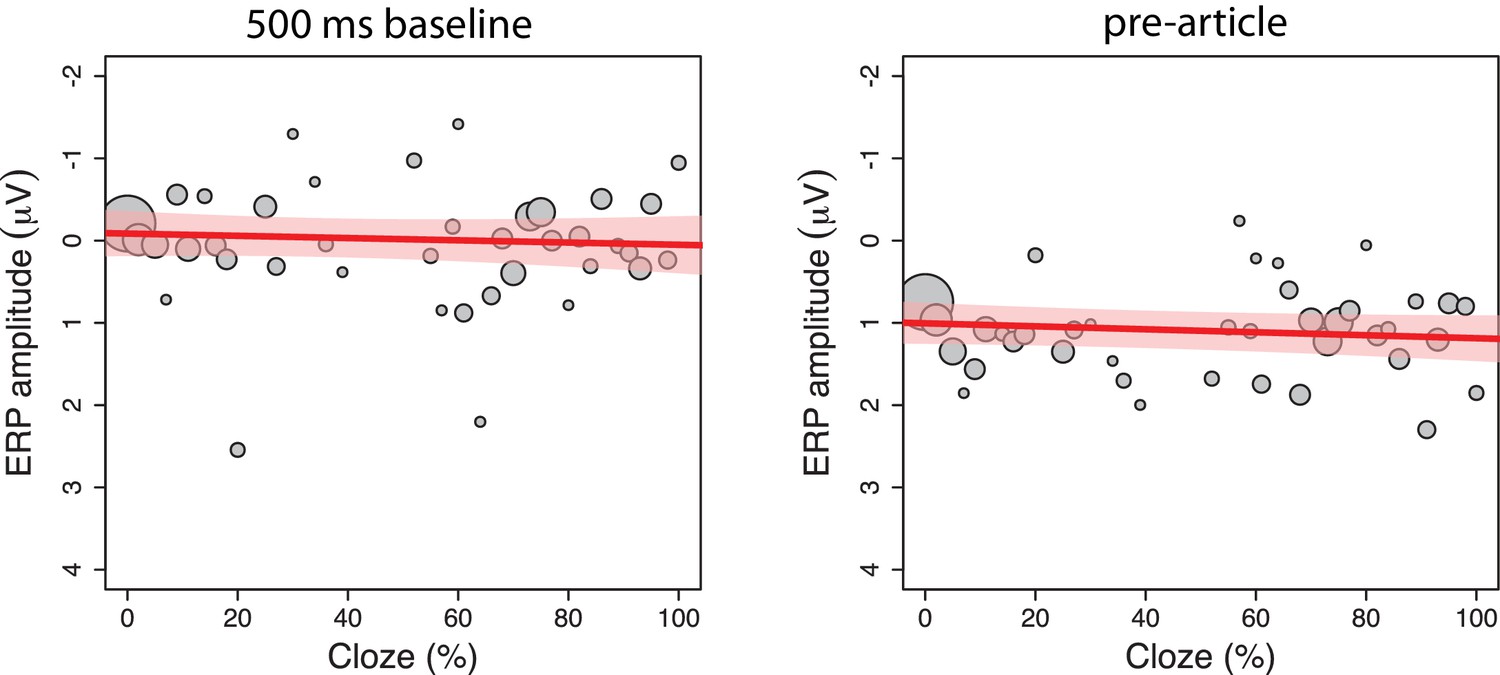
Figure 5
Exploratory single-trial analyses.
The relationship between cloze and ERP amplitude as illustrated by the mean ERP values per cloze value (number of observations reflected in circle size), along with the regression line and 95% confidence interval, from two exploratory analyses. We performed a test which used a longer baseline time window (500 ms, left panel) to better control for pre-article voltage levels. This test reduced the initially observed effect of article-cloze, β = 0.14, CI [−0.25, .53], χ2(1)=0.46, p=0.50). An analysis in the 500 to 100 ms time window before article-onset (right panel) revealed a non-significant effect of cloze that resembled the pattern observed after article-onset, β = 0.16, CI [−0.07, .39], χ2(1)=1.82, p=0.18, shedding doubt on the conclusion that the observed results are due to the presentation of the articles.
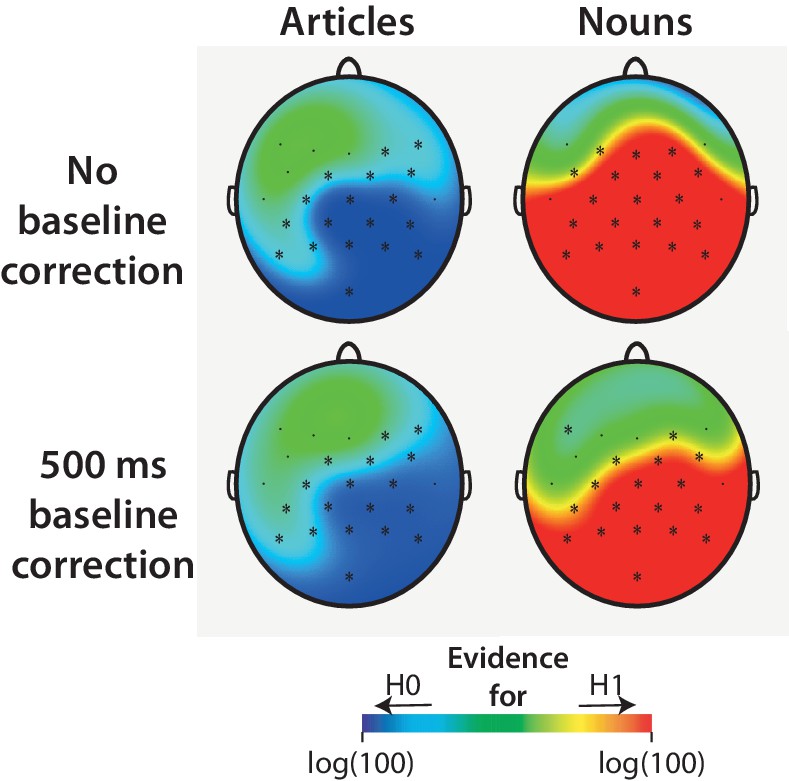
Figure 6
Exploratory replication Bayes factor analysis.
This analysis quantifies the obtained evidence for the null hypothesis (H0) that N400 is not impacted by cloze, or for the alternative hypothesis (H1) that N400 is impacted by cloze with the direction and size of effect reported by DeLong et al. Scalp maps show the common logarithm of the replication Bayes factor for each electrode, capped at log(100) for presentation purposes. Electrodes that yielded at least moderate evidence for or against the null hypothesis (Bayes factor of ≥3) are marked by an asterisk. At posterior electrodes where DeLong et al. found their effects, our article data yielded strong to extremely strong evidence for the null hypothesis, whereas our noun data yielded extremely strong evidence for the alternative hypothesis (upper graphs). These results were obtained with the procedure described in DeLong et al. (no baseline correction), and with a 500 ms pre-word baseline correction (lower graphs), the procedure later described by DeLong and colleagues.
Figure 7
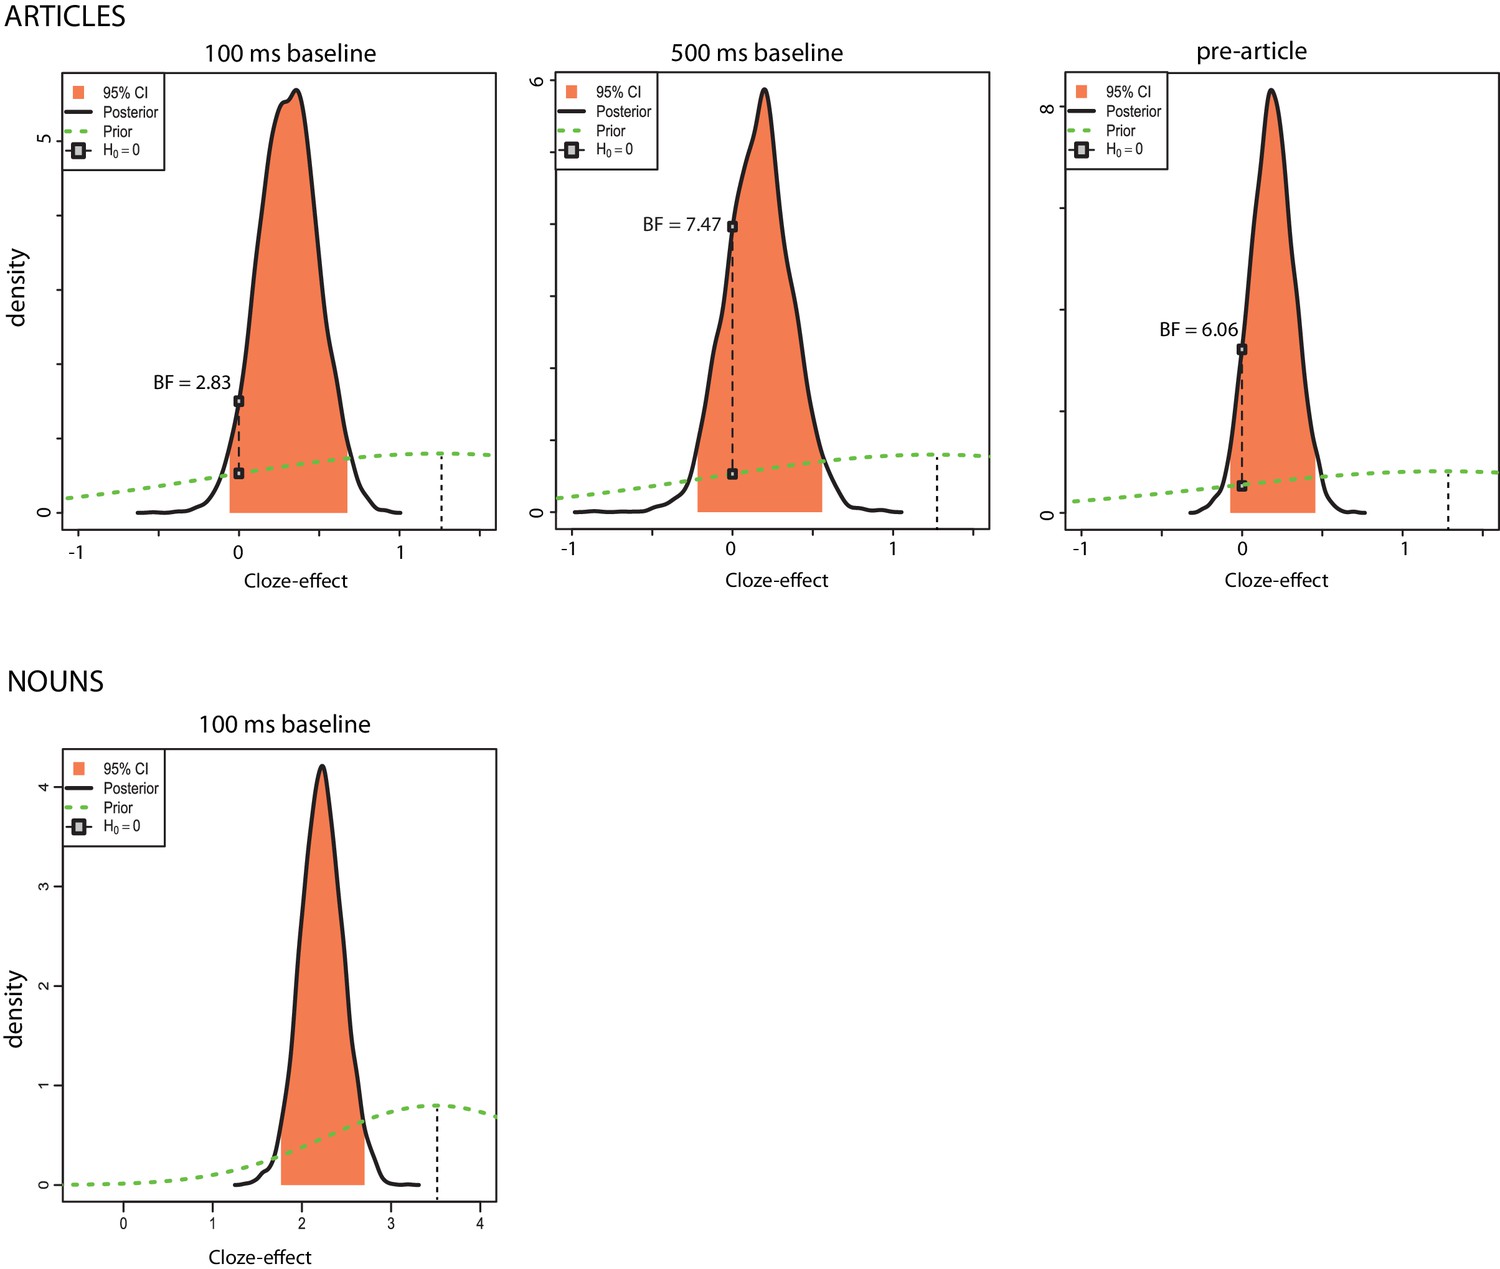
Exploratory Bayesian mixed-effects model analyses.
Posterior density distributions for the effect of cloze on ERP amplitudes in the N400 window. The x-axis shows cloze effect sizes (i.e. changes in microvolts associated with an increase from 0% cloze probability to 100% cloze probability). The black line indicates the posterior distribution of effects; higher values of the posterior density at a given effect size indicate higher probability that this is the true effect size in the population. The peak of the posterior distribution roughly corresponds to the point estimate of the effect size (the regression coefficient) fitted from the Bayesian mixed effect model, i.e., the most likely value of the true effect size. The middle 95% of the posterior distribution, shaded in orange, corresponds to a two-tailed 95% credible interval for the effect size—i.e., an interval that we can be 95% confident contains the true effect. The green dotted line indicates the prior distribution (i.e., our expectation about where the true effect would lie before the data were collected). For the articles, this prior is centred on 1.25 μV, an approximation of the effect observed by DeLong et al. (2005), and for the nouns it is centred on 3.5 μV. The black connected dots illustrate the ratio between the posterior and prior distribution (i.e. the Bayes factor) at the effect size of 0 μV; for example, a Bayes factor of 4 suggests we can be four times more certain that the true effect is zero after having conducted this experiment than before, or, in other words, that the data increased our confidence in the null effect of zero fourfold. We performed these analyses for each of the linear mixed-effects model analyses we performed. We note that in all the article-analyses, the posterior probability of the estimated effect being greater than zero is around 80 or 90%, although this is also true for the pre-stimulus variable, shedding doubt that the observed results are due to presentation of the articles. In none of our article-analyses did zero lie outside the obtained credible interval, whereas for the nouns, zero lay outside the credible interval. These results are consistent with a failure to replicate the size of the article-effect reported by DeLong et al. and a successful replication of the noun-effect.
Figure 8
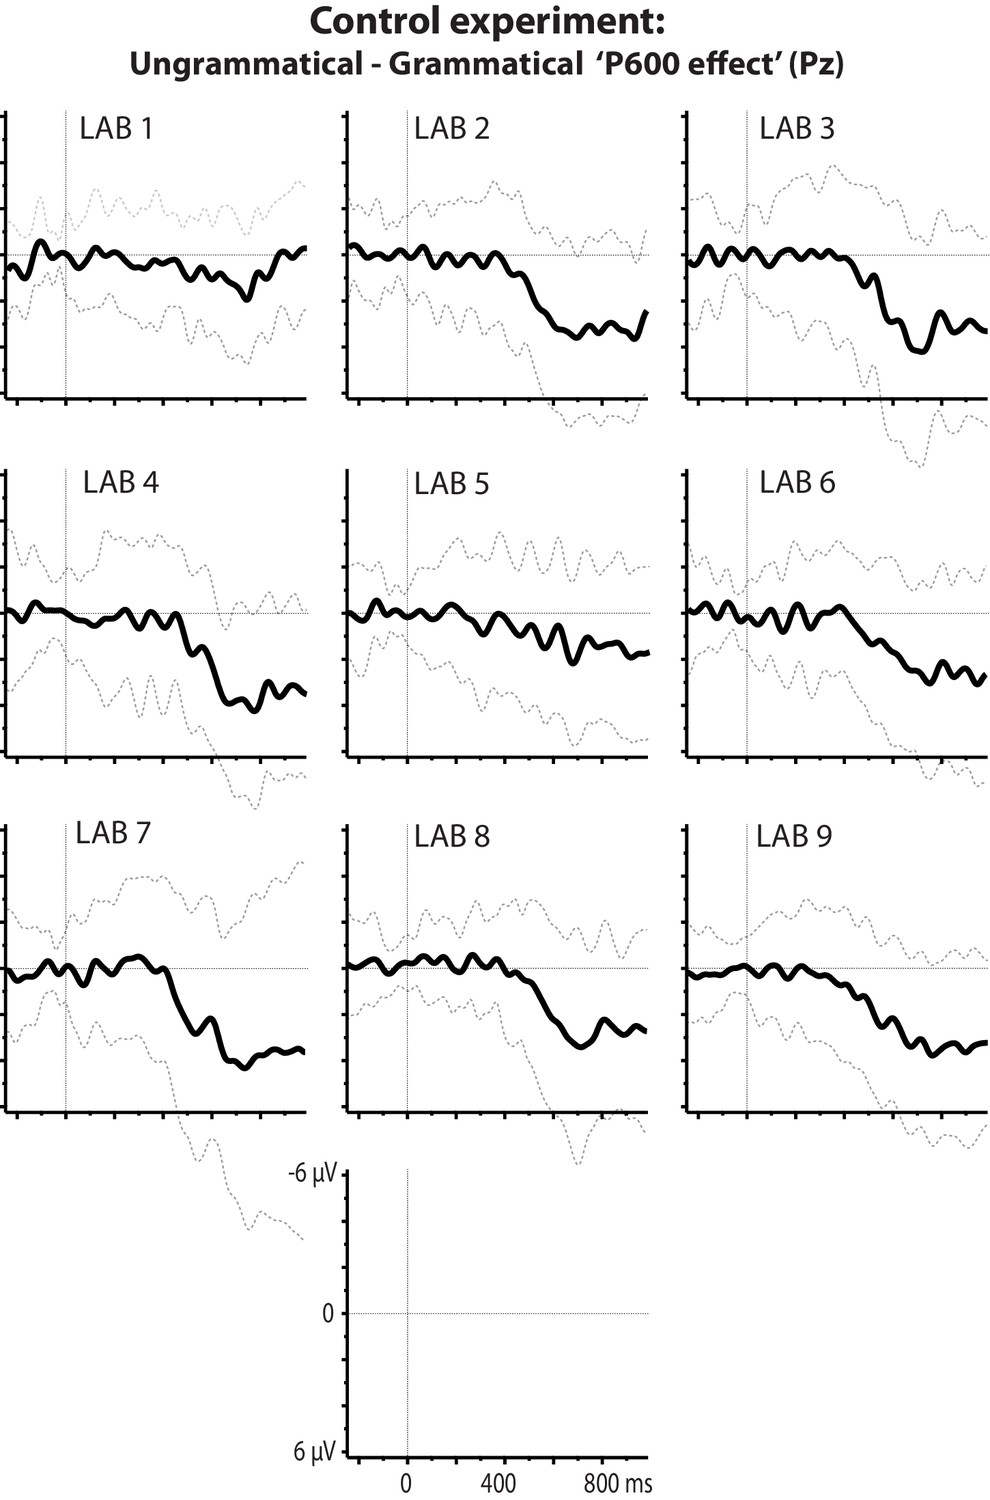
Control experiment.
P600 effects at electrode Pz per lab associated with flouting of the English a/an rule. Plotted ERPs show the grand-average difference waveform and standard deviation for ERPs elicited by ungrammatical expressions (‘an kite’) minus those elicited by grammatical expressions (‘a kite’).
Additional files
-
Supplementary file1
This file contains Supplementary Tables 1-3.
Supplementary Table 1 contains the sentence materials with cloze probabilities (0-100%) of articles and nouns, along with post-noun sentence endings, comprehension questions and expected answer. Of note, because expectedness of the noun is here determined by the cloze value of the preceding article, there are three items (28, 29 and 49) in which the unexpected noun has a cloze that is equal to or higher than the expected noun. This has no repercussions for the statistical results because the noun-analysis was based on noun cloze. Supplementary Table 2 contains the List of changes to the materials used by Delong et al. (2005). Supplementary Table 3 contains detailed information about participants, trial numbers and EEG recording equipment per laboratory.
- https://doi.org/10.7554/eLife.33468.018
-
Transparent reporting form
- https://doi.org/10.7554/eLife.33468.019
Download links
A two-part list of links to download the article, or parts of the article, in various formats.
Downloads (link to download the article as PDF)
Open citations (links to open the citations from this article in various online reference manager services)
Cite this article (links to download the citations from this article in formats compatible with various reference manager tools)
Large-scale replication study reveals a limit on probabilistic prediction in language comprehension
eLife 7:e33468.
https://doi.org/10.7554/eLife.33468


