Preoptic leptin signaling modulates energy balance independent of body temperature regulation
- Pennington Biomedical Research Center, Louisiana State University System, United States
- Baylor College of Medicine, United States
- School of Medicine, Tulane University, United States
- Brown University, United States
Figures
Figure 1 with 1 supplement
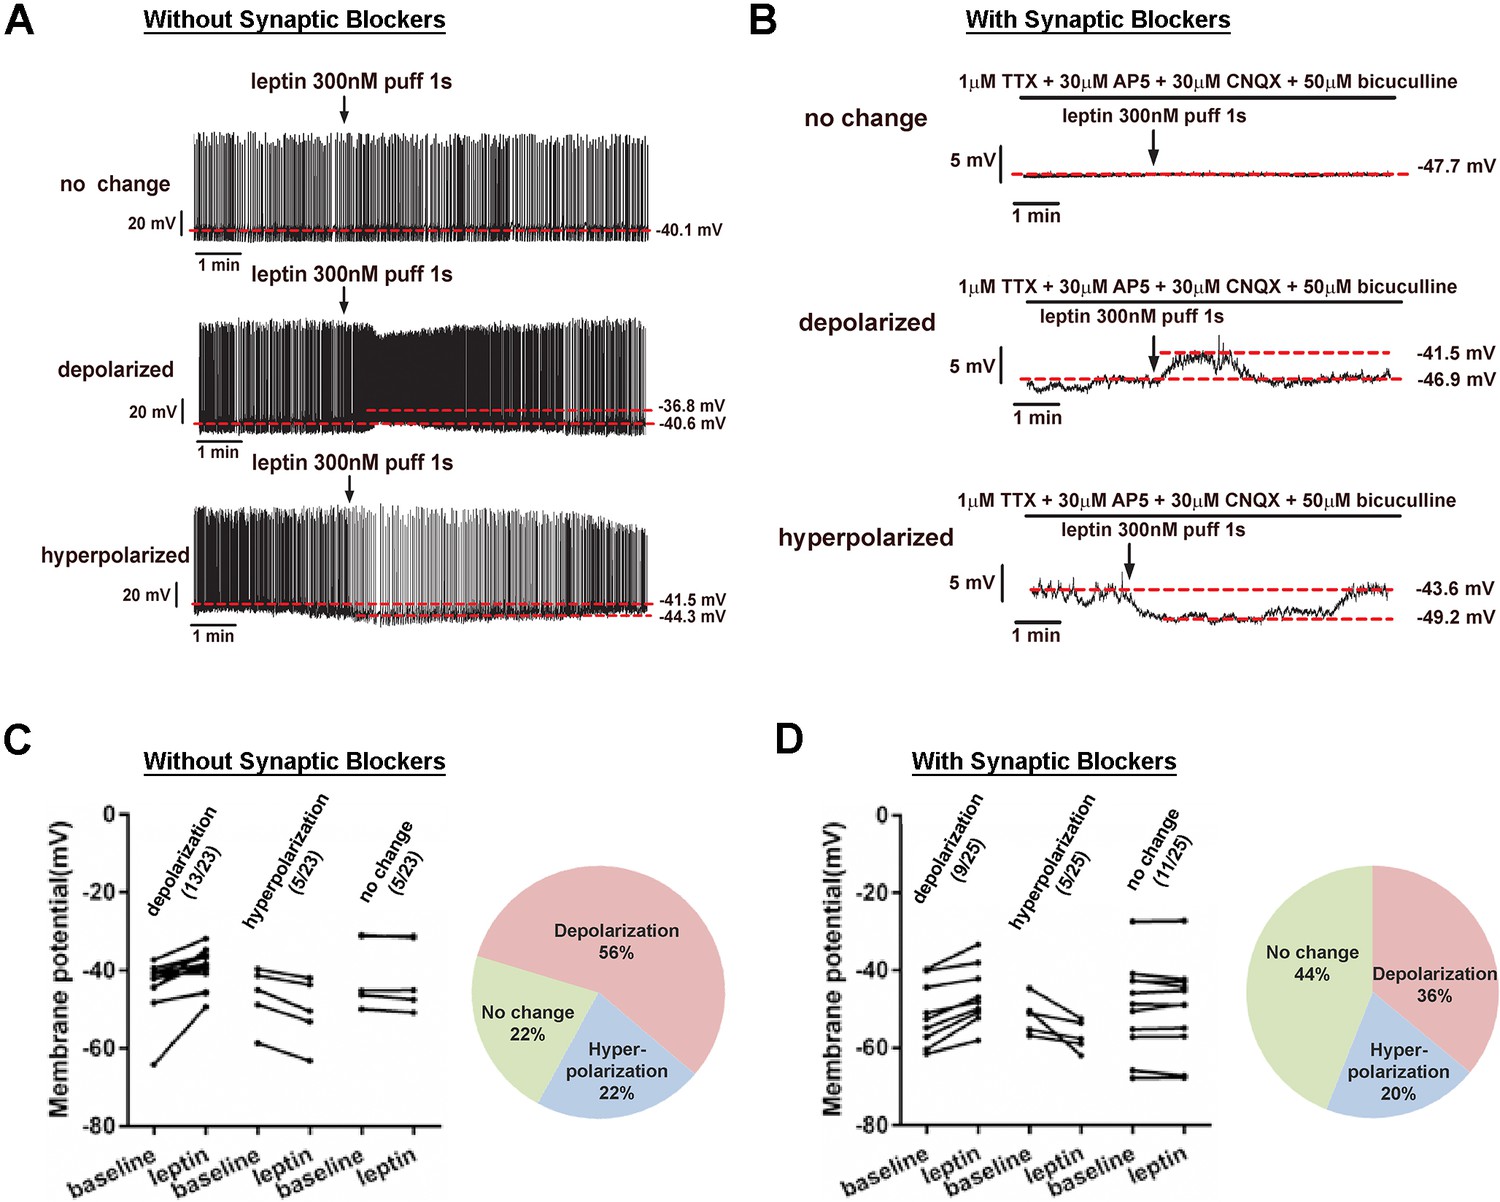
LeprPOA neurons respond heterogeneously to leptin.
(A–B) Representative whole-cell current clamp recordings of LeprPOA neurons showing three different responses to puff application of leptin in the absence (A) and the presence (B) of synaptic transmission blockers. (C–D) Membrane potential changes of individual LeprPOA neurons in response to puff application of leptin in the absence (C, n = 23) and the presence (D, n = 25) of synaptic transmission blockers and the pie charts showing percetages of depolarization, hyperpolarization, and no change.
-
Figure 1—source data 1
Membrane potentials of individually recorded LeprGFP neurons at baseline and following leptin treatment used to categorize leptin response profiles in Figure 1C,D and Figure 1—figure supplement 1A.
- https://doi.org/10.7554/eLife.33505.004
Figure 1—figure supplement 1
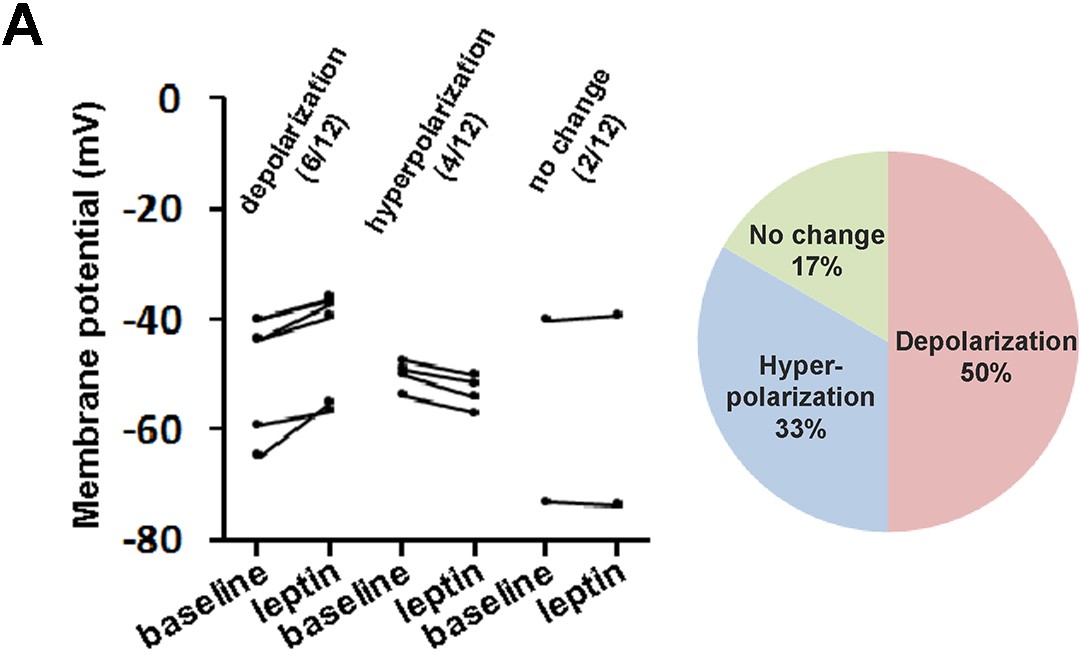
Whole-cell current clamp of LeprPOA neurons in response to bath application of leptin.
(A) Membrane potential changes of individual LeprPOA neurons in response to bath application of leptin in the absence of synaptic transmission blockers and the pie chart showing percentages of depolarization, hyperpolarization, and no change (n = 12).
Figure 2 with 1 supplement
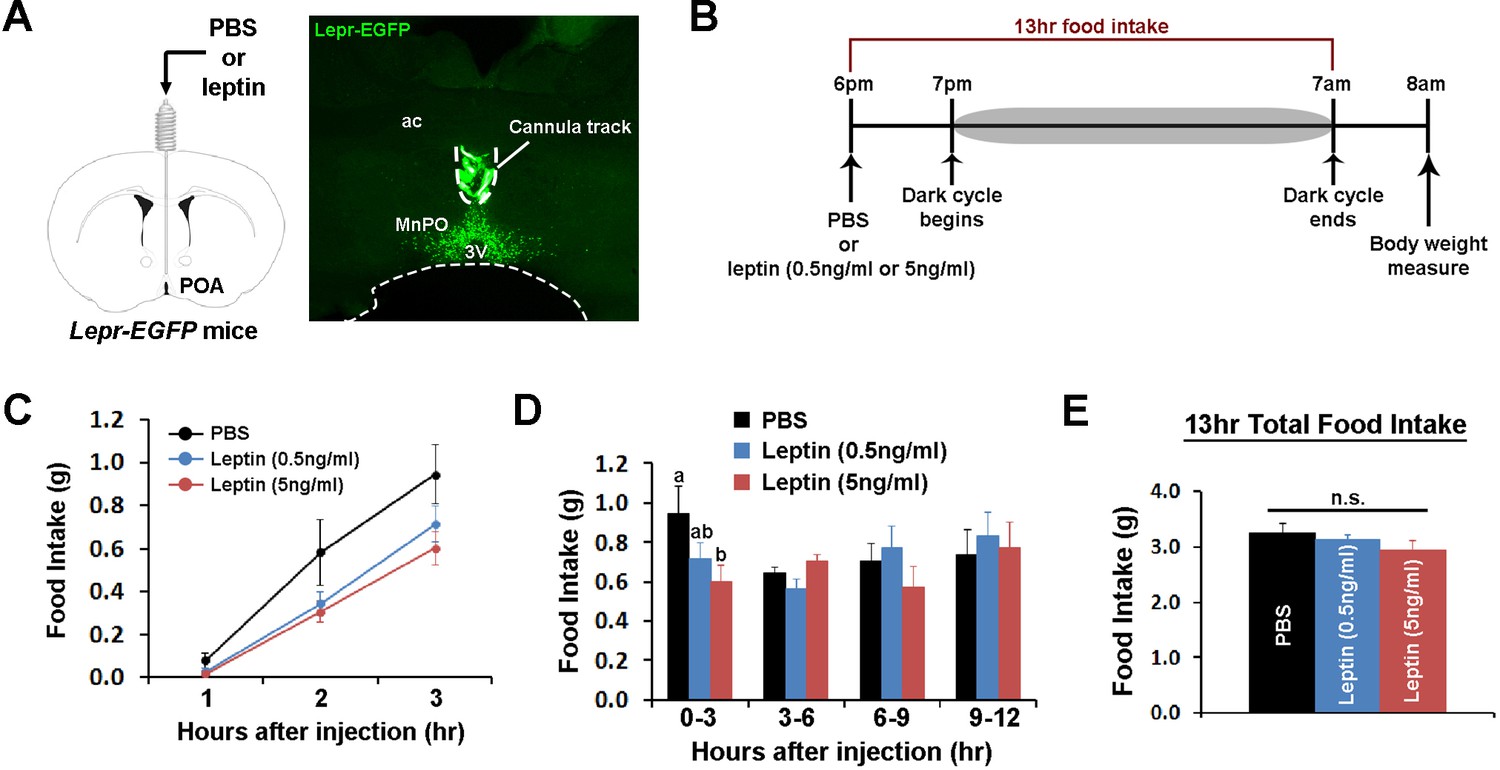
POA leptin signaling suppresses food intake.
(A) Schematic diagram showing the implantation of a chronic cannula in the POA of LeprEGFP mice and a representative histological image showing the placement of the cannula. (B) Experimental scheme of testing POA leptin effect on food intake with BioDAQ. (C) Leptin injection into the POA suppressed dark-onset food intake for the first 3 hr after the injection (n = 8). There was a significant treatment effect during this period (repeated measures ANOVA, p=0.001). (D) POA leptin effect on food intake lasted only for the first 3 hr after the injection (n = 8). Bars with different letters denote statistical significance at p<0.05 (repeated measures ANOVA, p=0.017). (E) Overnight food intake was similar between treatments (n = 8; repeated measures ANOVA, p=0.374). 3V, third ventricle; ac, anterior commissure; MnPO, median preoptic nucleus.
-
Figure 2—source data 1
Raw hourly food intake data over 13 hr and cumulative food intake data for time bins following intra-POA injections of PBS and leptin used to generate Figure 2C,D,E.
- https://doi.org/10.7554/eLife.33505.007
Figure 2—figure supplement 1
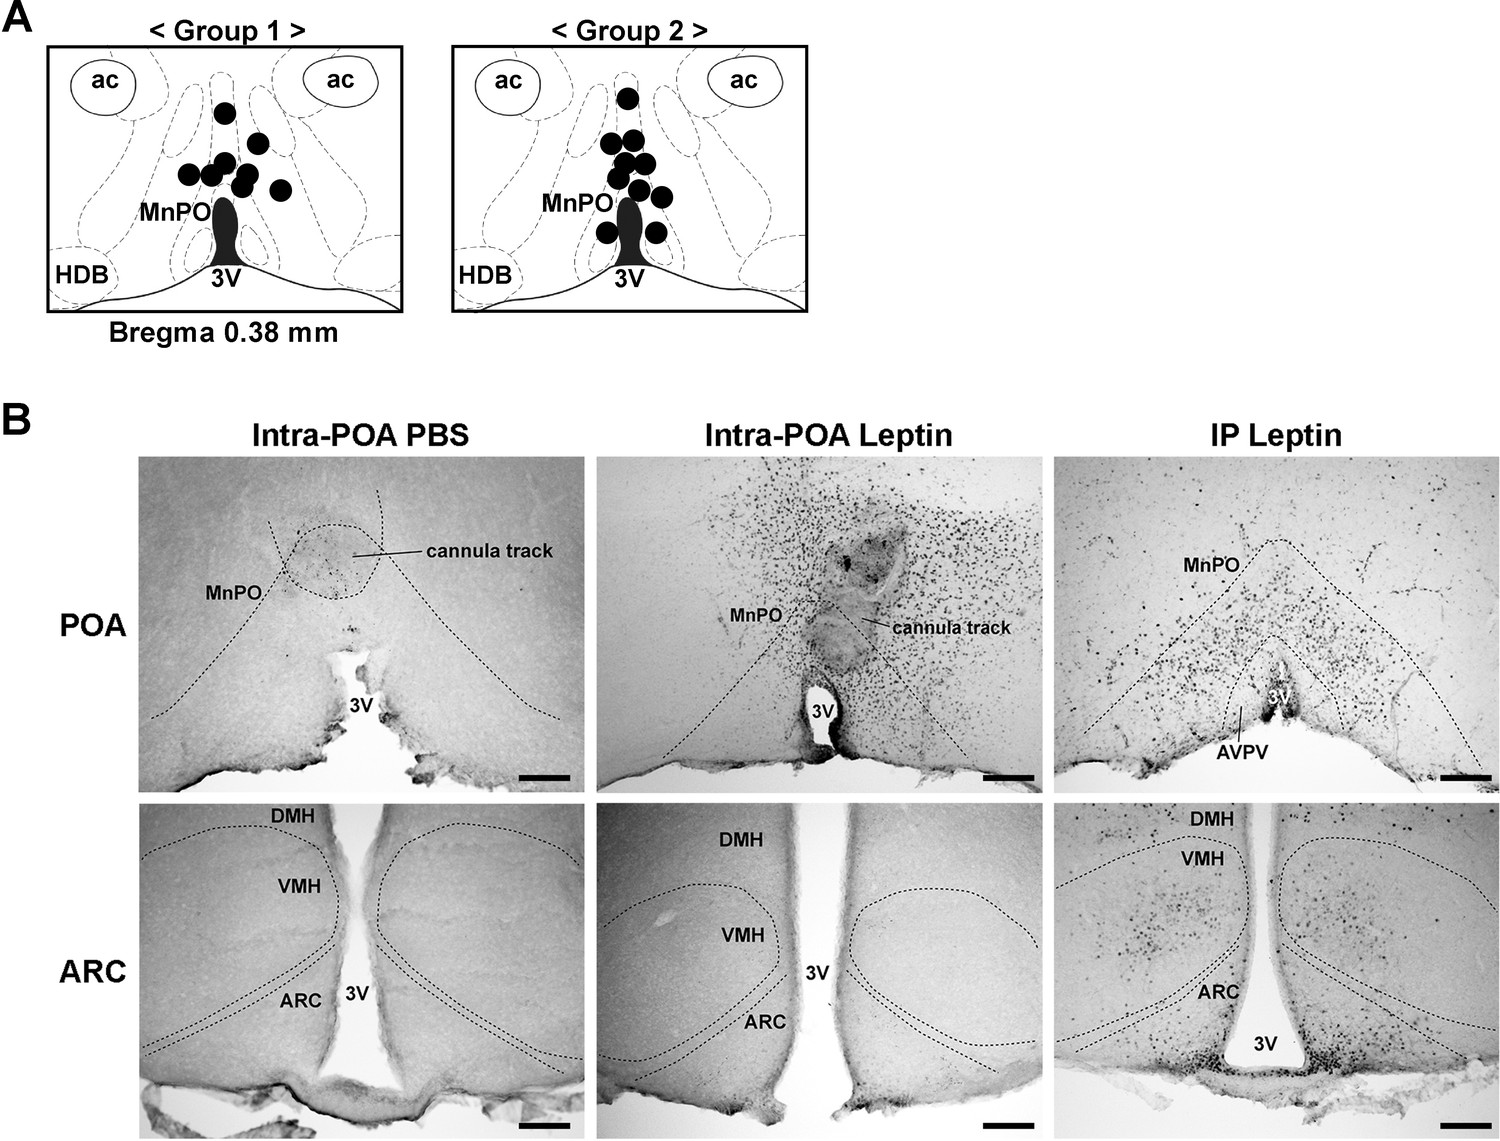
Histological analysis of injection sites and pSTAT3 specificity in the hypothalamus.
(A) Injection sites for all mice used for the intra-POA leptin injection study. Injection sites were determined retrospectively by histological analysis (group 1, n = 8; group 2, n = 10). (B) pSTAT3 (black dots) comparisons between injection conditions for the POA and the ARC. Positive pSTAT3 staining around the cannula track is due to activation of inflammatory pathways. 3V, third ventricle; ac, anterior commissure; ARC, arcuate hypothalamic nucleus; AVPV, anteroventral periventricular nucleus; DMH, dorsomedial hypothalamic nucleus; HDB, nucleus of the horizontal limb of the diagonal band; MnPO, median preoptic nucleus; VMH, ventromedial hypothalamic nucleus. Scale bar = 200 μm.
Figure 3
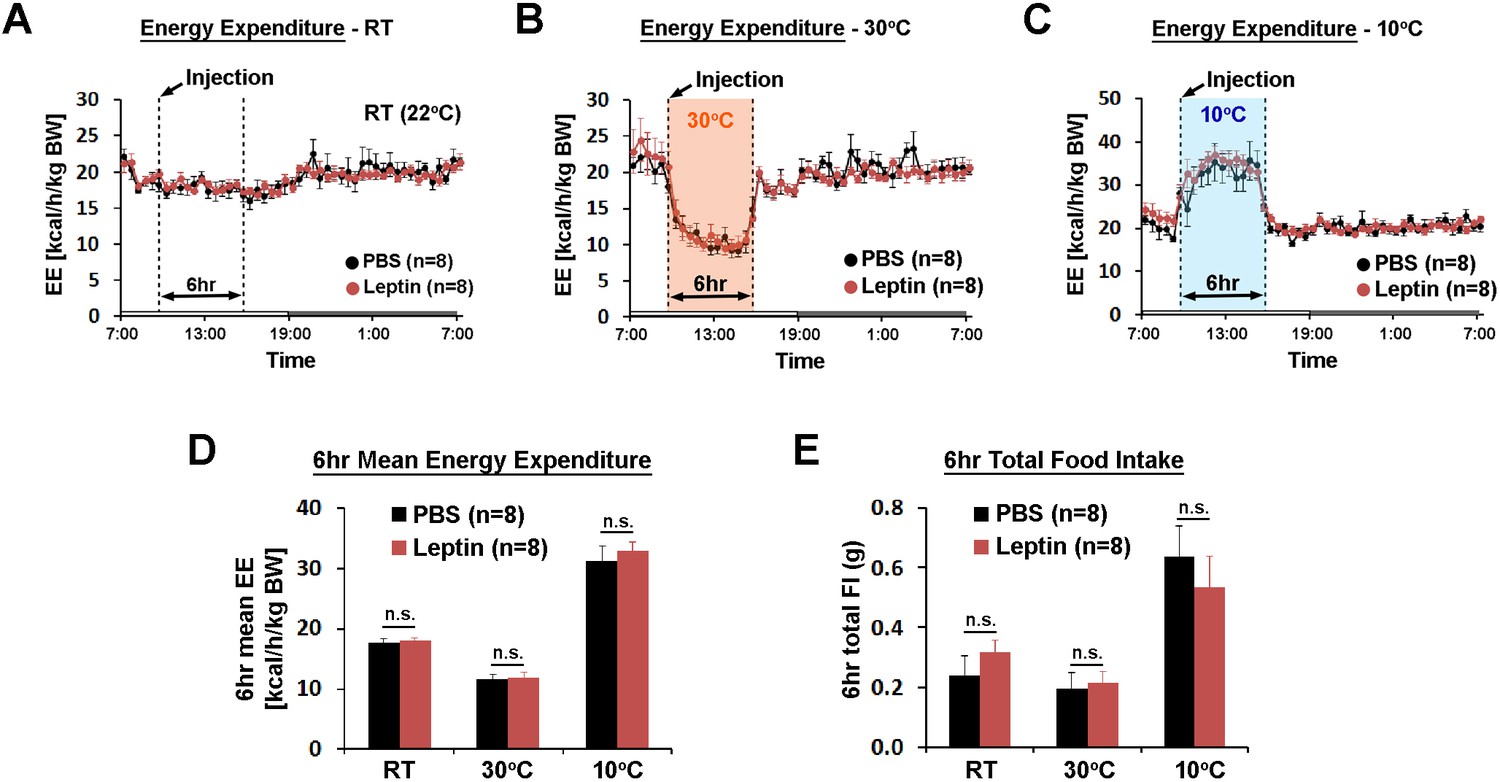
POA leptin signaling does not affect ambient temperature-dependent metabolic adaptations.
(A–C) 24 hr energy expenditure from PBS and leptin injections (5 ng/ml, total 0.5 pg) are overlaid for RT (22°C), warm (30°C), and cold (10°C) (n = 8 each). Temperature was changed for 6 hr from 9 am to three pm. (D) 6 hr mean energy expenditure was compared between treatment conditions (paired t-test between PBS and leptin at each temperature). (E) Total food intake during the same 6 hr as in (D).
-
Figure 3—source data 1
Raw and mean energy expenditure for generation of Figure 3A,B,C and D; and food intake data used to generate Figure 3E.
- https://doi.org/10.7554/eLife.33505.009
Figure 4 with 2 supplements
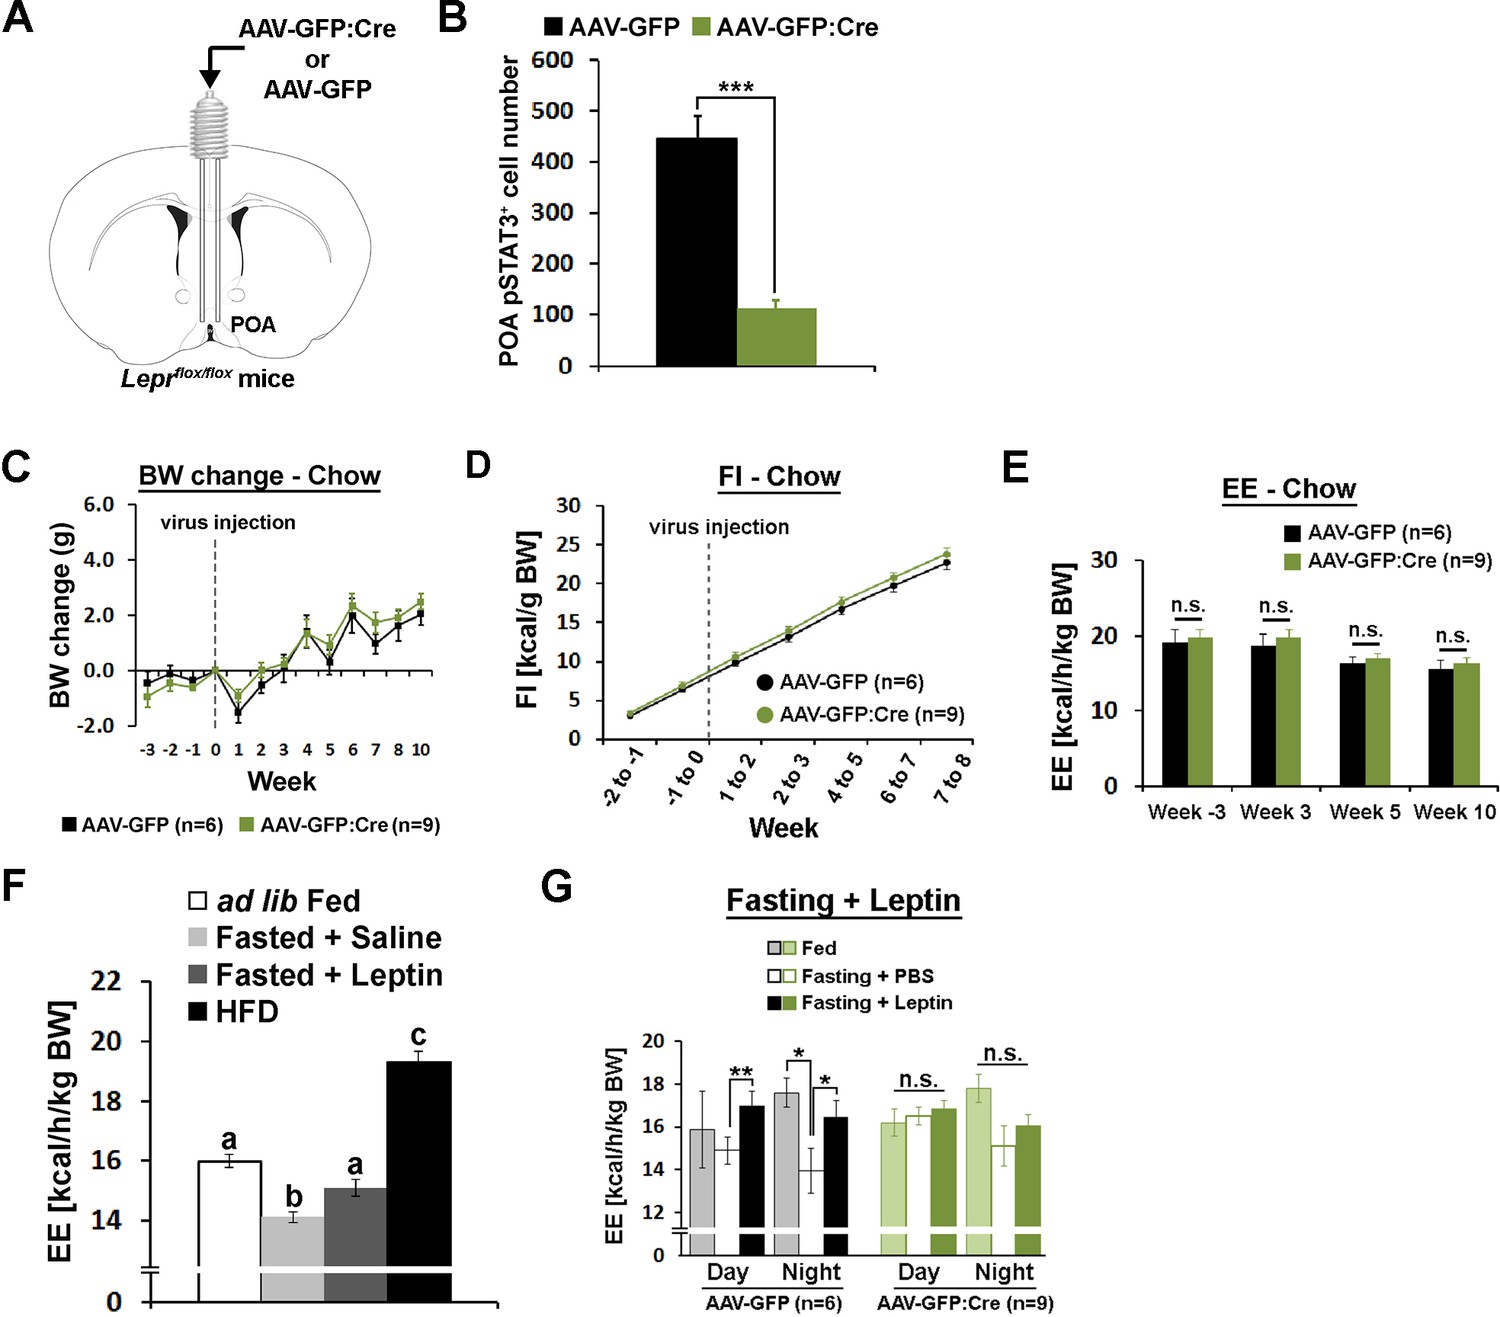
POA Lepr is necessary for fasting-induced hypometabolism.
(A) A schematic diagram showing bilateral viral injection into the POA of Leprflox/flox mice. (B) AAV-GFP:Cre injection resulted in about 80% reduction of pSTAT3+ cell numbers in the POA (n = 6 for AAV-GFP, n = 9 for AAV-GFP:Cre; independent t-test, p<0.001). (C–E) Body weight, food intake, and energy expenditure were similar between groups throughout the study (repeated measures ANOVA followed by Bonferroni pairwise comparisons, p>0.05). (F) Energy expenditure comparison between ad lib fed (n = 10), fasted +saline (n = 5), fasted +leptin (n = 5; 5 mg/kg, i.p.), and 2-week-long HFD feeding (n = 5). Leptin injection attenuated fasting-induced hypometabolism while HFD increased the metabolic rate. Bars with different letters denote statistical significance at p<0.05 (one-way ANOVA followed by Bonferroni pairwise comparisons). (G) In LeprPOA KD mice, fasting did not decrease energy expenditure, thus leptin failed to attenuate fasting-induced hypometabolism (repeated measures ANOVA followed by Bonferroni pairwise comparisons, *p<0.05, **p<0.01).
-
Figure 4—source data 1
Individual cell counts used to generate Figure 4B; raw body weight and body weight changes used to generate Figure 4C; raw food intake and weight specific caloric intake used to generate Figure 4D; raw and mean energy expenditure used to generate Figure 4E,F,G.
- https://doi.org/10.7554/eLife.33505.013
Figure 4—figure supplement 1
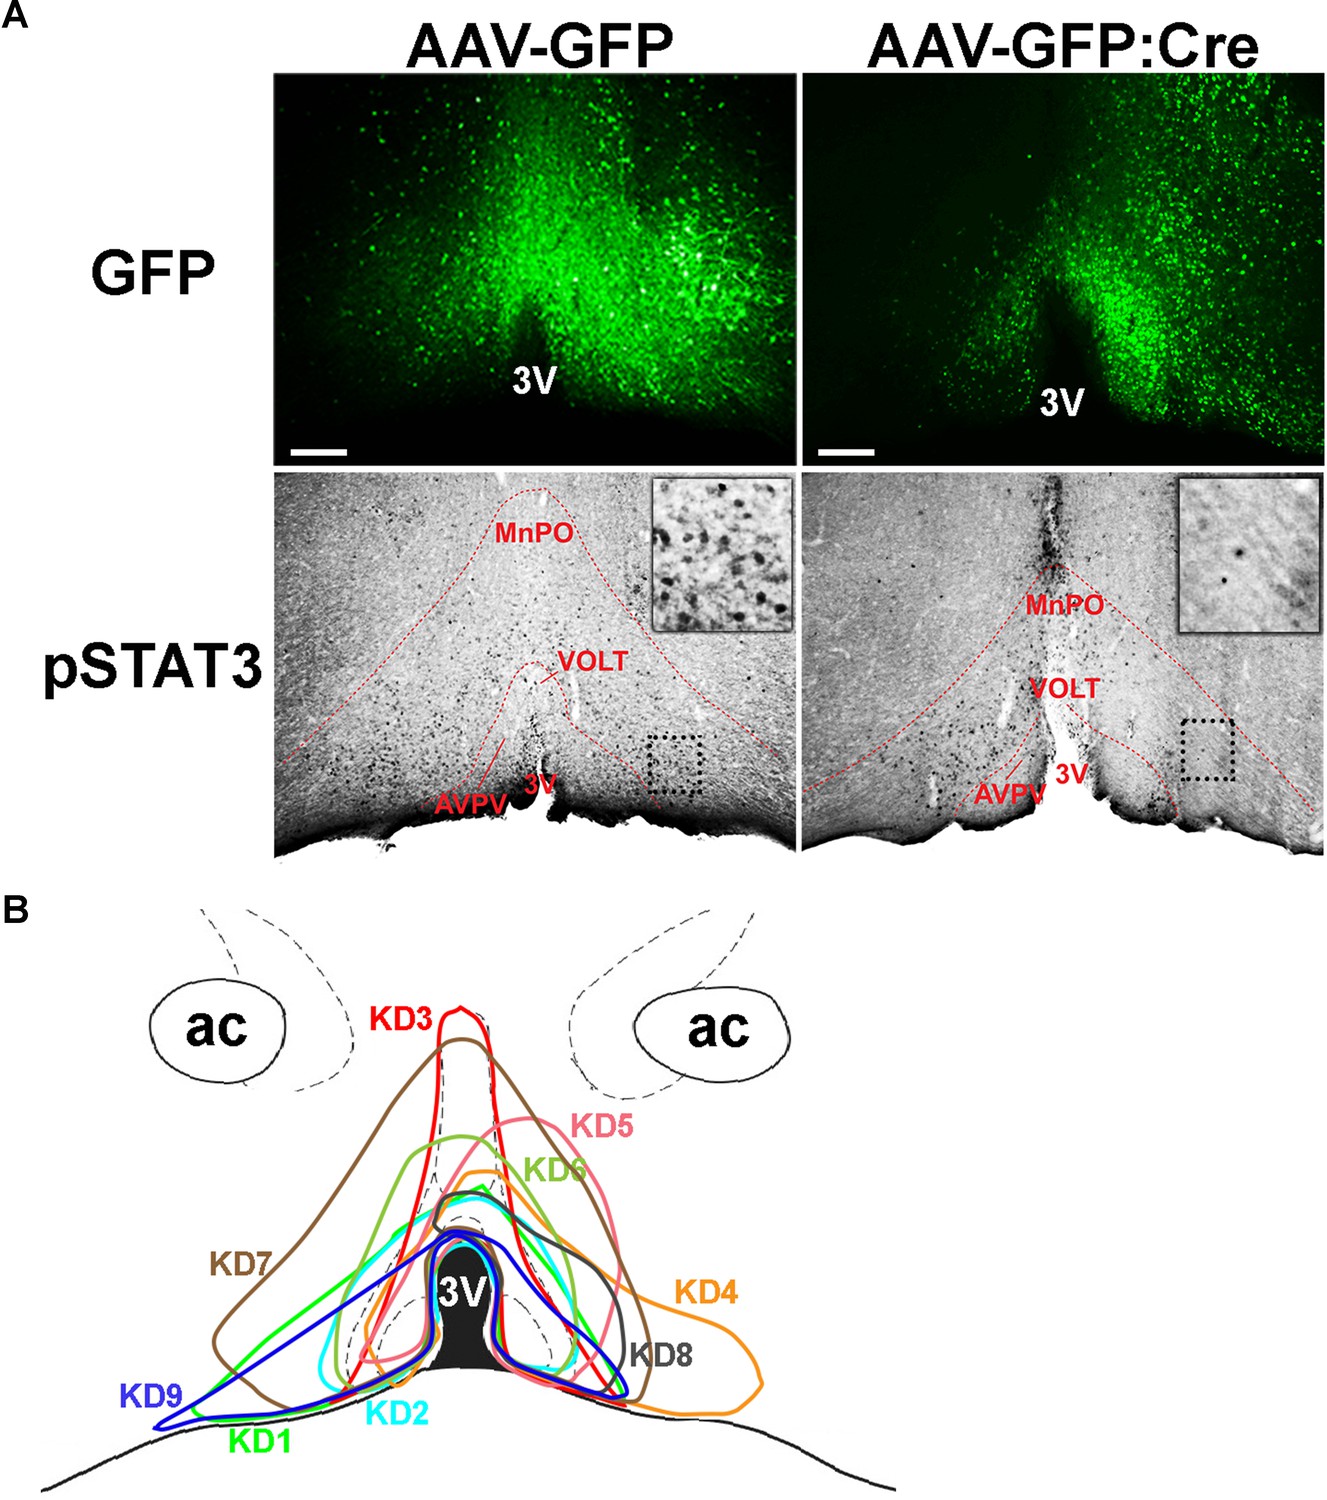
Histological analysis of virus spread and pSTAT3.
(A) Representative histological images showing virus spread (GFP) and pSTAT3 (black dots) in the POA between AAV-GFP and AAV-GFP:Cre injections. Note relative absence of pSTAT3 in areas of high AAV-GFP:Cre expression (i.e. left side vs right side along the 3V) while AAV-GFP expression did not affect pSTAT3. Dotted box areas are enlarged at upper right corners in each column. (B) Virus spread of all 9 LeprPOA KD mice used in the chow diet experiment. 3V, third ventricle; AVPV, anteroventral periventricular nucleus; MnPO, median preoptic area; VOLT, vascular organ of the lamina terminalis. Scale bar = 200 μm.
Figure 4—figure supplement 2
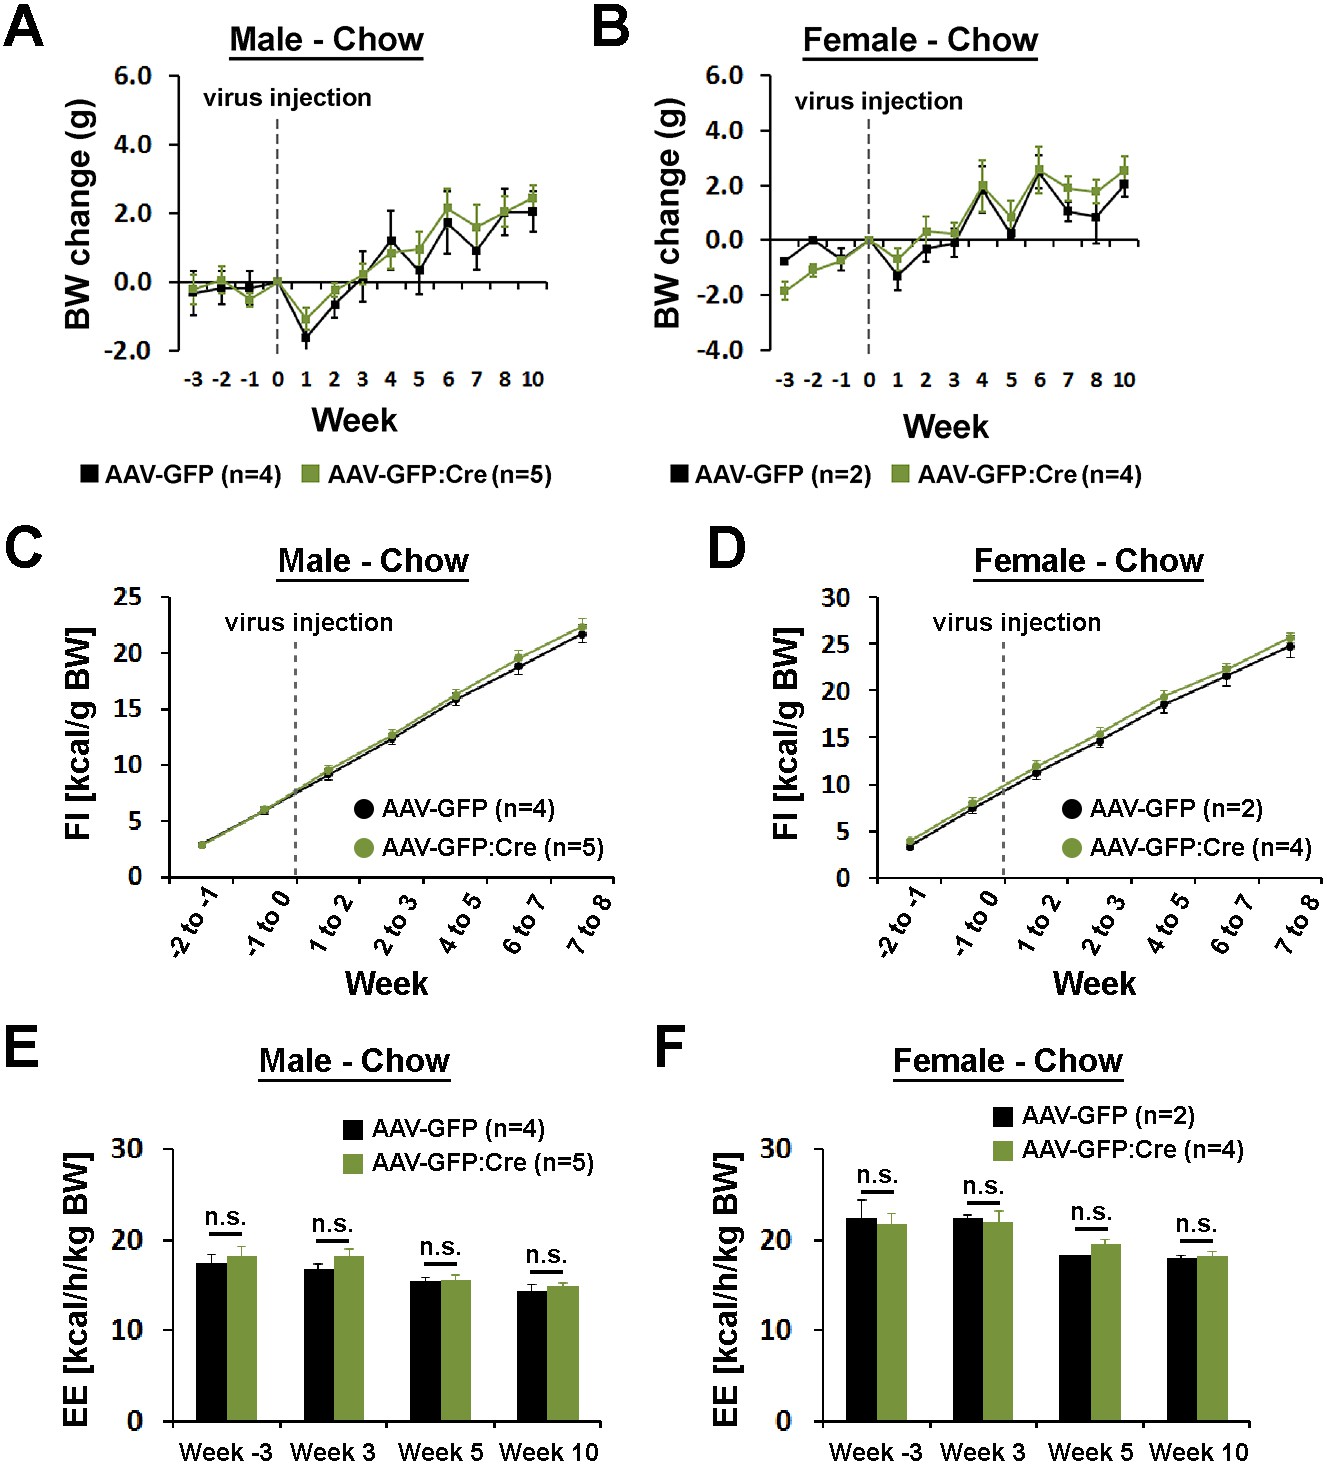
Body weight, food intake, and energy expenditure by sex.
(A–F) Body weight, food intake, and energy expenditure did not show sex-specific differences between mice injected with AAV-GFP and AAV-GFP:Cre in the POA (repeated measures ANOVA followed by Bonferroni pairwise comparisons).
Figure 5 with 4 supplements
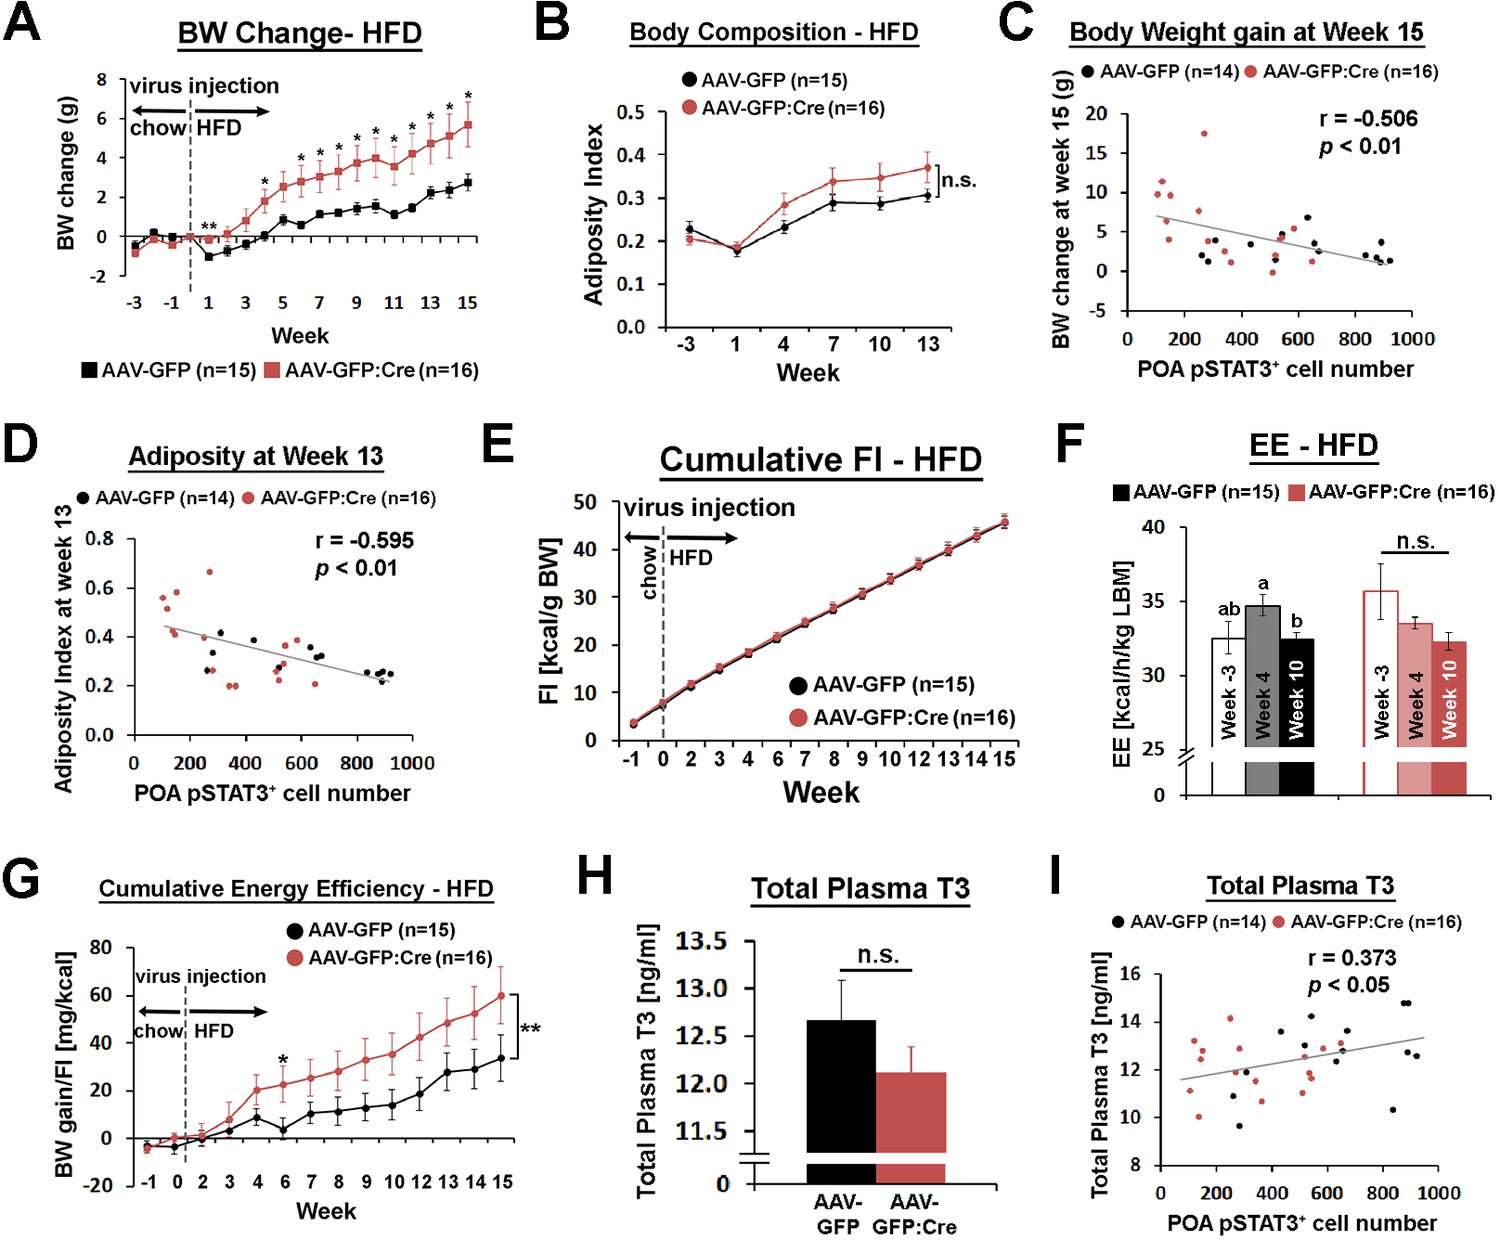
POA Lepr is involved in body weight regulation under HFD.
(A) LeprPOA KD mice gained greater body weight than control mice over 15 weeks on HFD (repeated measures ANOVA followed by Bonferroni pairwise comparisons, *p<0.05, **p<0.01). (B) There was a trend of higher adiposity index (fat mass/lean mass) in LeprPOA KO mice (the effect of virus type on adiposity index was tested by repeated measures ANOVA, p=0.141). (C–D) Body weigh change at week 15 and adiposity index at week 13 are negatively correlated with POA pSTAT3+ cell numbers (Pearson correlation). (E) Cumulative food intake during the entire study was similar between groups (repeated measures ANOVA followed by Bonferroni pairwise comparisons). (F) Energy expenditure is compared between time points within each group. Bars with different letters denote statistical significance at p<0.05 (repeated measures ANOVA followed by Bonferroni pairwise comparisons). (G) Cumulative energy efficiency (body weight gain/food intake) showed a significant interaction between week and virus type (F(11,319) = 2.518, p<0.01, repeated measures ANOVA followed by Bonferroni pairwise comparisons, *p<0.05). (H) Total plasma T3 levels were not significantly different between groups (independent t-test, p=0.267). (I) Total plasma T3 levels showed a significant positive correlation with POA pSTAT3+ cell numbers (Pearson correlation).
-
Figure 5—source data 1
Raw data body weight, raw body composition, body weight changes, adiposity index and percent body composition used to generate Figure 5A,G and Figure 5—figure supplement 2A and B; food intake used to generate Figure 5E andG; raw and mean energy expenditure used to generate Figure 5F and Figure 5—figure supplement 2E; energy efficiency used to generate Figure 5G; raw scoring and total number of estrous cycles used to generate Figure 5—figure supplement 2l.
- https://doi.org/10.7554/eLife.33505.019
Figure 5—figure supplement 1
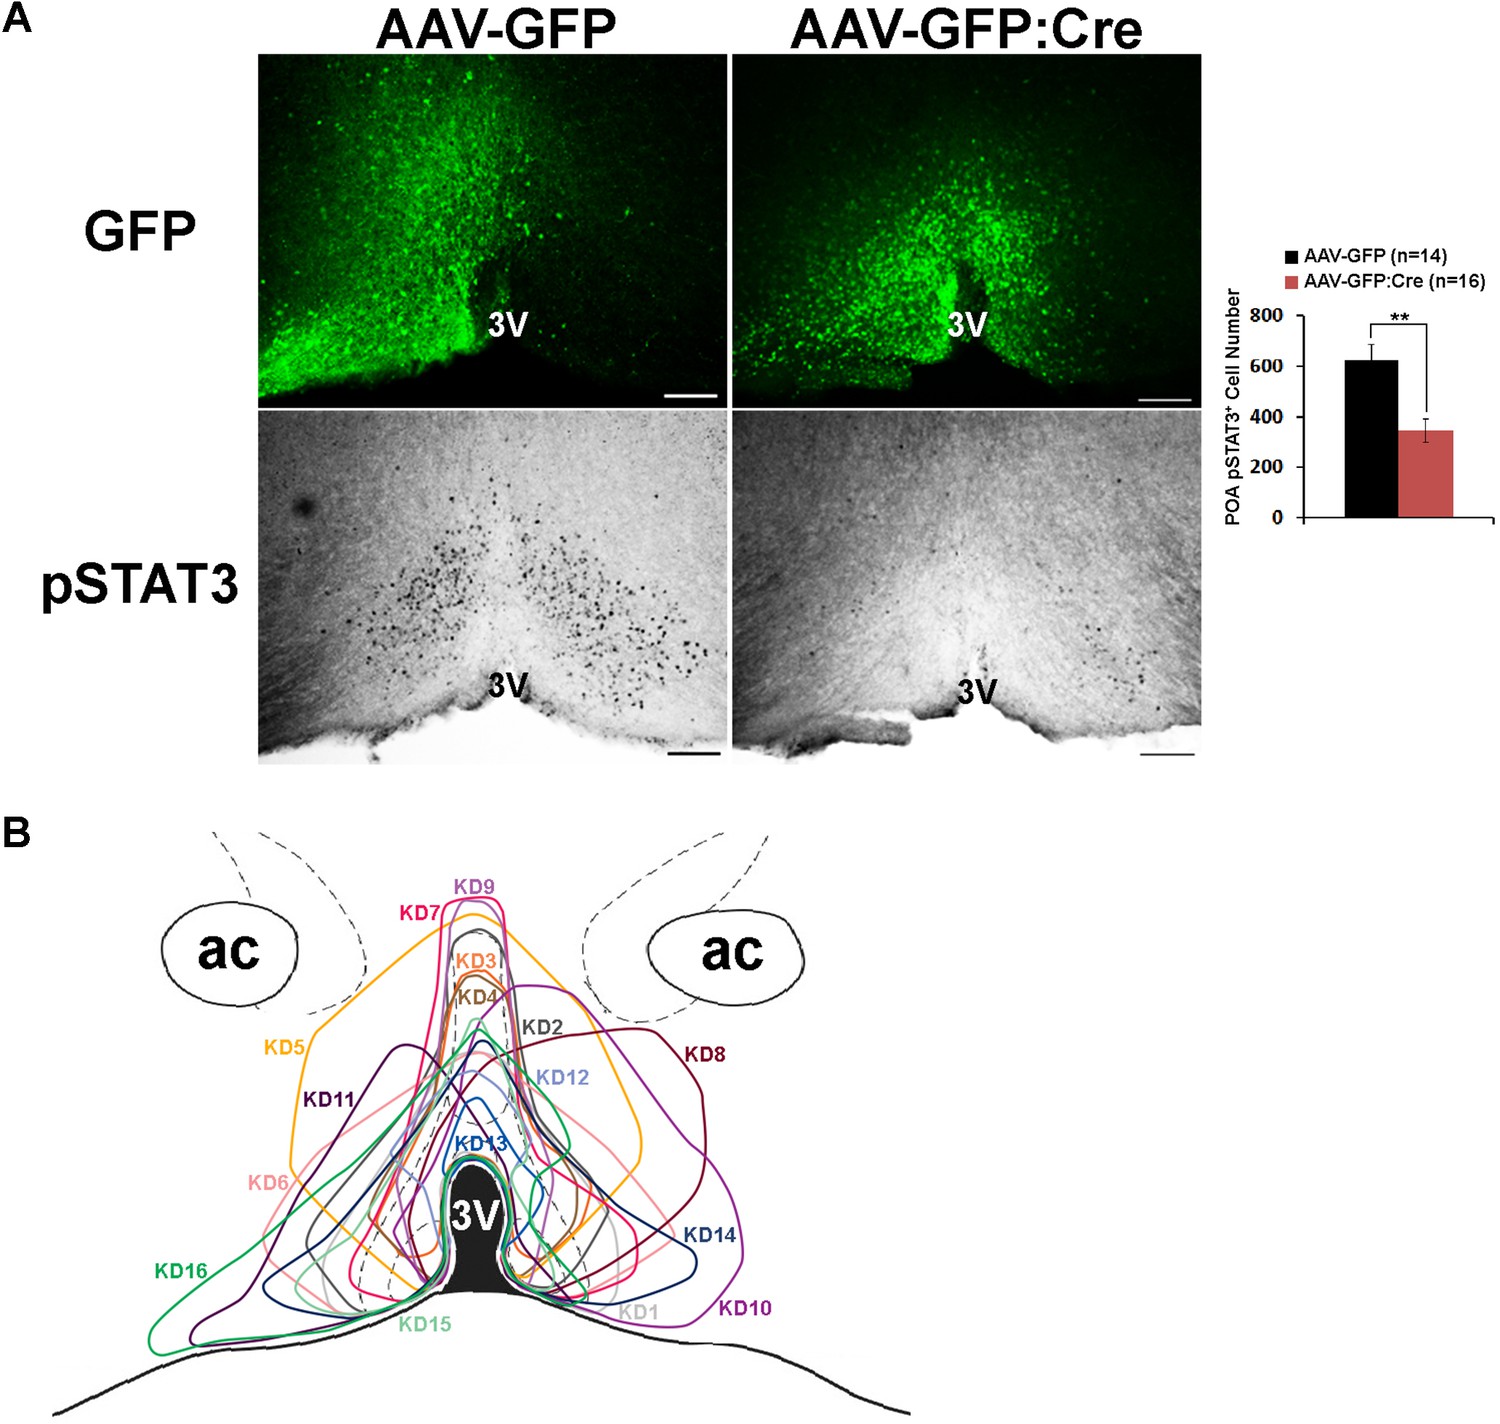
Histological analysis of virus spread and pSTAT3.
(A) Representative histological images showing virus spread (GFP) and pSTAT3 in the POA for mice used in the HFD study. AAV-GFP:Cre injection resulted in about 50% reduction of pSTAT3+ cell numbers in the POA (independent t-test, **p<0.01). (B) Viral spread of all 16 LeprPOA KD mice used in the HFD experiment. Scale bar = 200 μm.
Figure 5—figure supplement 2
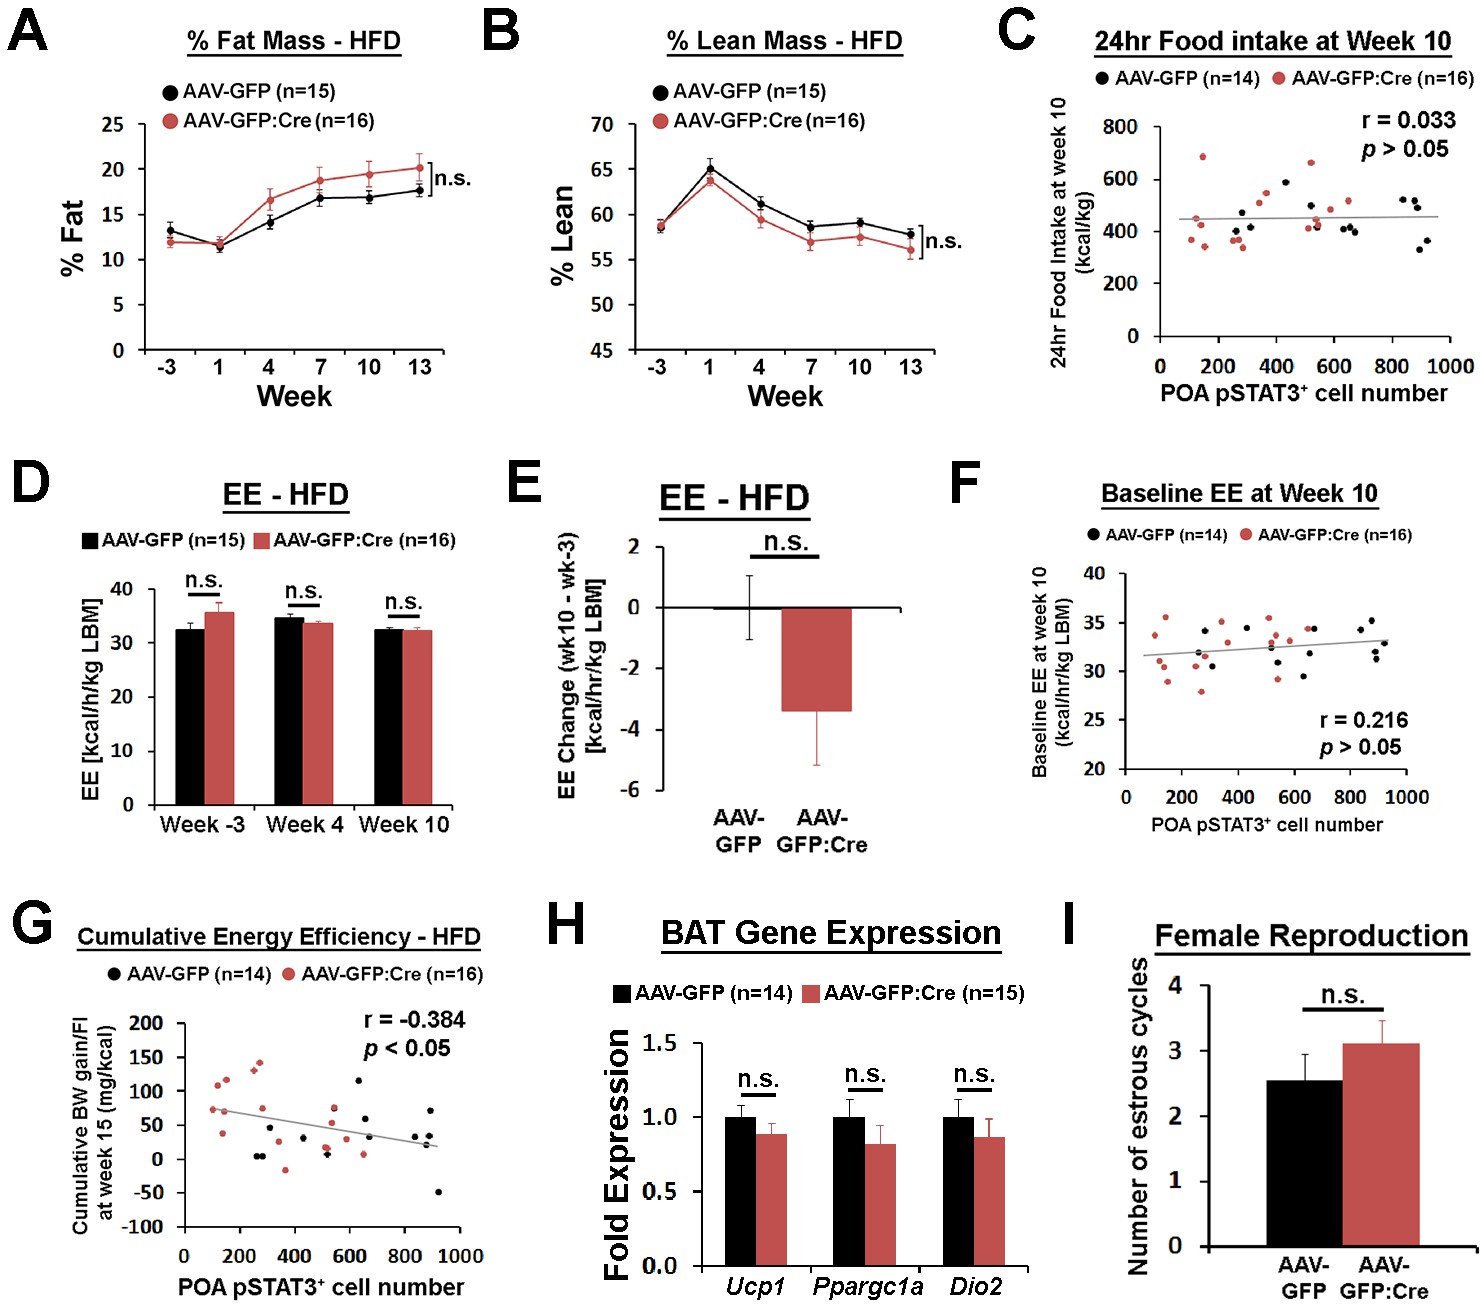
POA Lepr is involved in body weight regulation under HFD.
(A–B) LeprPOA KD mice showed a trend of higher % fat mass and lower % lean mass than control mice (repeated measures ANOVA followed by Bonferroni pairwise comparisons, p>0.05). (C) 24 hr food intake at week 10 showed no correlation with POA pSTAT3+ cell numbers (Pearson correlation, p=0.865). (D) Energy expenditure compared between groups at three different time points showed no significant differences (repeated measures ANOVA followed by Bonferroni pairwise comparisons, p>0.05). (E) Energy expenditure change from week −3 to week 10 showed bigger reduction in LeprPOA KD mice (independent t-test, p=0.137). (F) Baseline energy expenditure (24 hr average at RT) at week 10 showed no significant correlation with POA pSTAT3+ cell numbers (Pearson correlation, p=0.251). (G) Cumulative energy efficiency at week 15 was negatively correlated with POA pSTAT3+ cell numbers (Pearson correlation). (H) Expression of BAT-related genes, Ucp1, Ppargc1a, and Dio2 were not significantly different between groups (independent t-test for each gene; Ucp1, p=0.31; Ppargc1a, p=0.31, Dio2, p=0.45). (I) The total number of estrous cycles during 19 days was similar between groups (independent t-test, p=0.297).
Figure 5—figure supplement 3
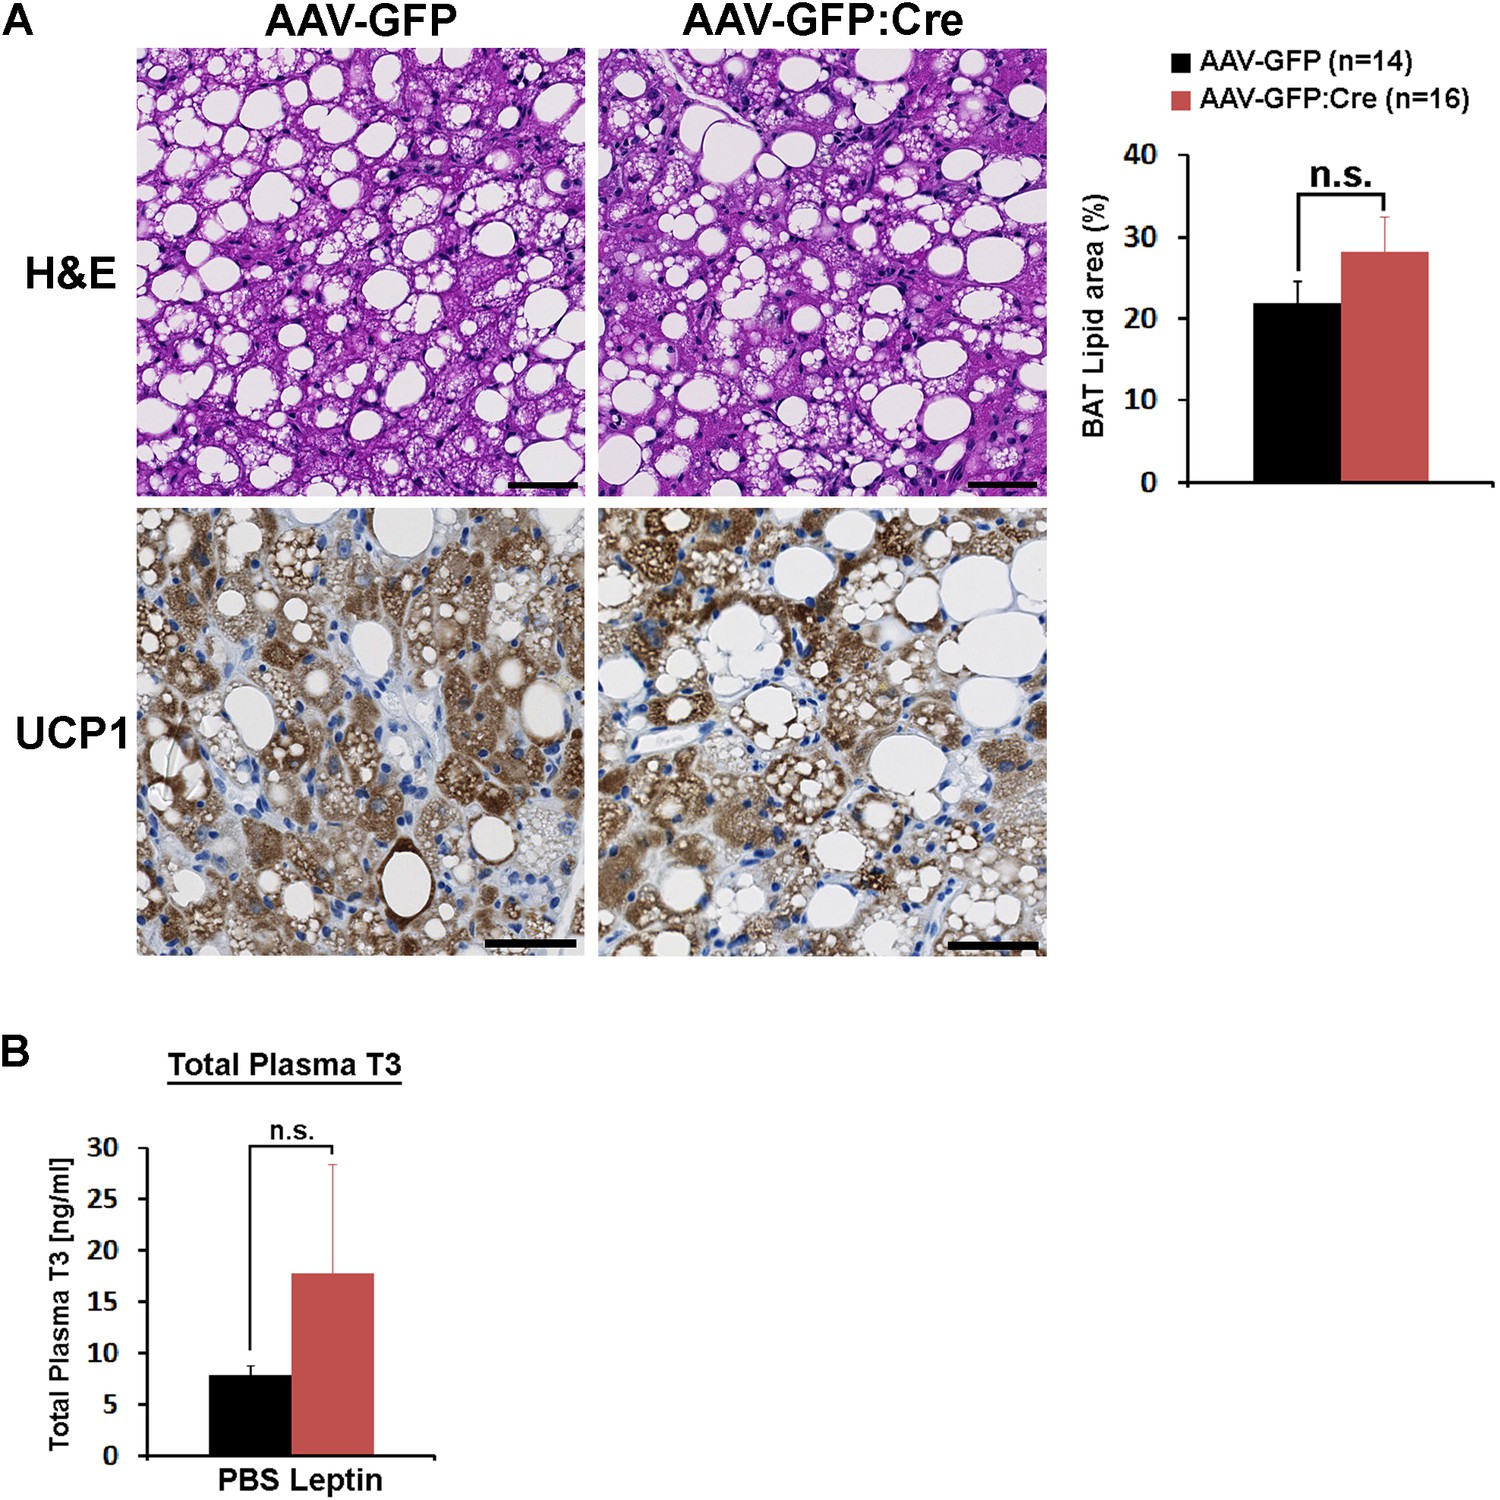
BAT histological analysis and POA leptin effect on total plasma T3.
(A) Analyses of BAT morphology, lipid area (independent t-test, p=0.21), and UCP1 expression (brown). Scale bar = 50 μm. (B) The intra-POA leptin injection (5 ng/ml, total 0.5 pg, three times) in fasted mice did not significantly increase the total plasma T3 level (n = 5 for each treatment; independent t-test, p=0.37).
Figure 5—figure supplement 4
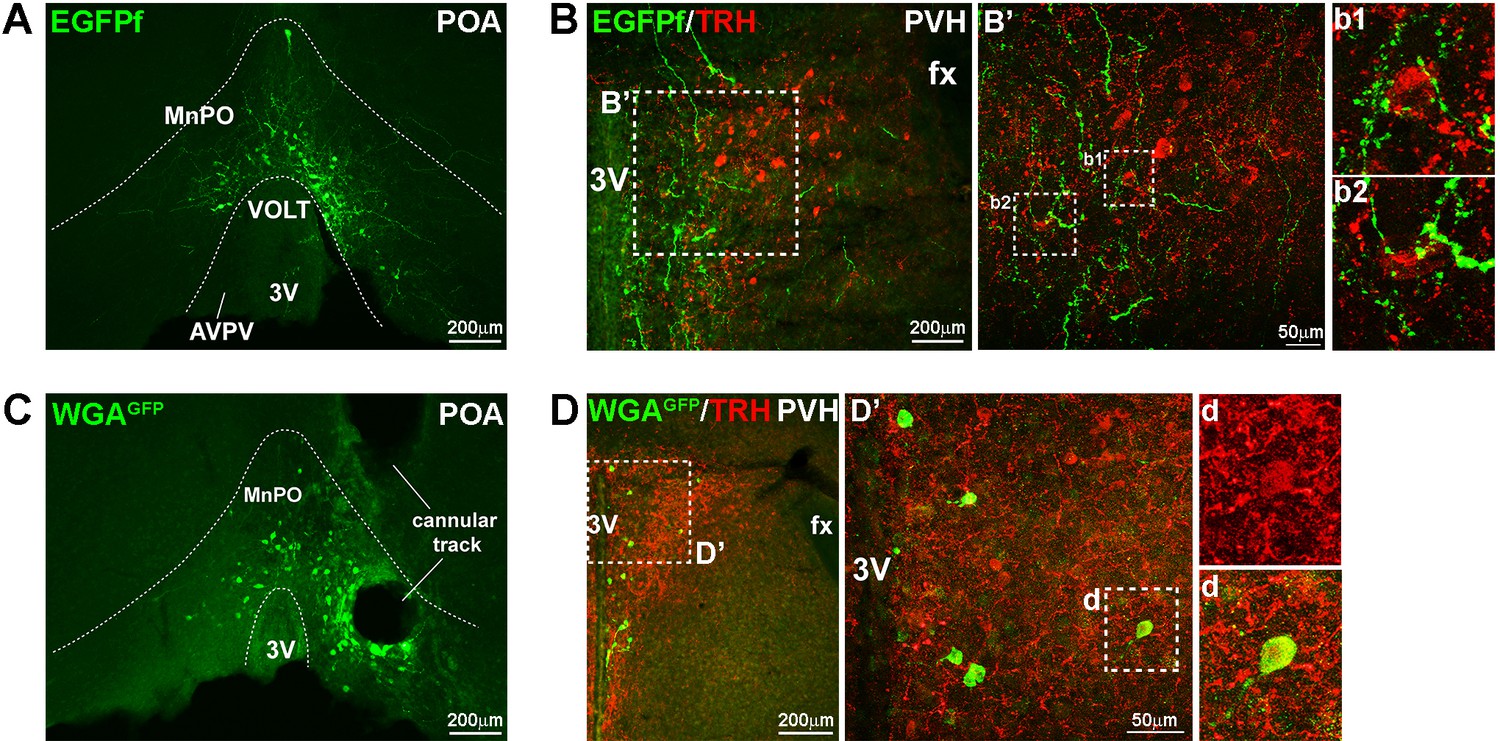
Projection of LeprPOA neurons to the PVH.
(A) Representative image of viral EGFPf expression in the POA in LeprCre mouse that had been injected with Ad-iZ/EGFPf in the POA. (B) Fibers of EGFPf-expressing LeprPOA neurons in the PVH and their proximity to TRH neuron cell bodies. Dotted boxes are magnified in B’, b1 and b2. (C) Representative image of viral WGAGFP expression in the POA in LeprCre mouse that had been injected with Ad-iN/WED in the POA. (D) PVH neurons that express WGAGFP are shown. In the middle panel, one WGAGFP-expressing cell co-expresses TRH and is enlarged in d. 3V, third ventricle; AVPV, anteroventral periventricular nucleus; fx, fornix; MnPO, median preoptic nucleus; VOLT, vascular organ of the lamina terminalis.
Tables
Key resources table
| Reagent type (species) or resource | Designation | Source or reference | Identifiers | Additional information |
|---|---|---|---|---|
| strain, strain background (M. Musculus) | C57BL/6J | The Jackson Laboratory | JAX: 000664; RRID: IMSR_JAX:000664 | |
| genetic reagent (M. Musculus) | LeprEGFP | Dr. Martin G. Myers, Jr., University of Michigan; PMID: 17021368 | Full nomenclature: LeprCre/Cre; Gt(ROSA)26Sortm2Sho/tm2Sho | |
| genetic reagent (M. Musculus) | Leprflox/flox | Dr. Streamson C. Chua, Jr., Albert Einstein College of Medicine; PMID: 15389315 | ||
| genetic reagent (Adeno-associated virus) | AAV-GFP (AAV5-hSyn-EYFP) | University of North Carolina Vector Core | UNC: AV4836 | Titer: 4.0 × 10Exp12 vg/ml |
| genetic reagent (Adeno-associated virus) | AAV-GFP:Cre (AAV5-hSyn-GFP:Cre) | University of North Carolina Vector Core | UNC: AV6446 | Titer: 5.1 × 10Exp12 vg/ml |
| antibody | anti-pSTAT3 (Tyr705, rabbit polyclonal) | Cell Signaling | Cell Signaling: 9131RRID: AB_331586 | (1:500) |
| antibody | anti-GFP (chicken polyclonal) | Abcam | Abcam: ab13970; RRID: AB_300798 | (1:1000) |
| antibody | anti-TRH (rabbit polyclonal) | Dr. Eduardo A. Nillni, Brown University | EAN: pYE26 | (1:1000) |
| antibody | anti-UCP1 | Abcam | Abcam: ab209483 RRID: AB_2722676 | (1:4000) |
| antibody | anti-rabbit IgG-biotin (donkey polyclonal) | ImmunoResearch Laboratories | IRL: 711-065-152; RRID: AB_2340593 | (1:1000) |
| antibody | anti-chicken IgY-DyLight 488 (donkey polyclonal) | ImmunoResearch Laboratories | IRL: 703-486-155 discontinued | (1:200) |
| antibody | anti-rabbit AlexaFluor 594 (donkey polyclonal) | ThermoFisher Scientific | TFS: A-21207; RRID: AB_141637 | (1:200) |
| peptide, recombinant protein | leptin (mouse recombinant) | National Hormone and Peptide Program | http://www.humc.edu/hormones | |
| commercial assay or kit | Milliplex Map Kit (plasma T3) | Millipore Sigma | Millipore Sigma: RTHYMAG-30K | |
| commercial assay or kit | Vectastain ABC kit | Vector Laboratories | Vecotr Laboratories: PK-6100 | |
| other | HFD (high fat diet for mouse) | Research Diets | Research Diets: D12331 | 58 kcal% fat |
Additional files
-
Transparent reporting form
- https://doi.org/10.7554/eLife.33505.020
Download links
A two-part list of links to download the article, or parts of the article, in various formats.
Downloads (link to download the article as PDF)
Open citations (links to open the citations from this article in various online reference manager services)
Cite this article (links to download the citations from this article in formats compatible with various reference manager tools)
Preoptic leptin signaling modulates energy balance independent of body temperature regulation
eLife 7:e33505.
https://doi.org/10.7554/eLife.33505


