Epidermal LysM receptor ensures robust symbiotic signalling in Lotus japonicus
- Aarhus University, Denmark
- University of Copenhagen, Denmark
- University of Torino, Italy
Figures
Figure 1 with 3 supplements
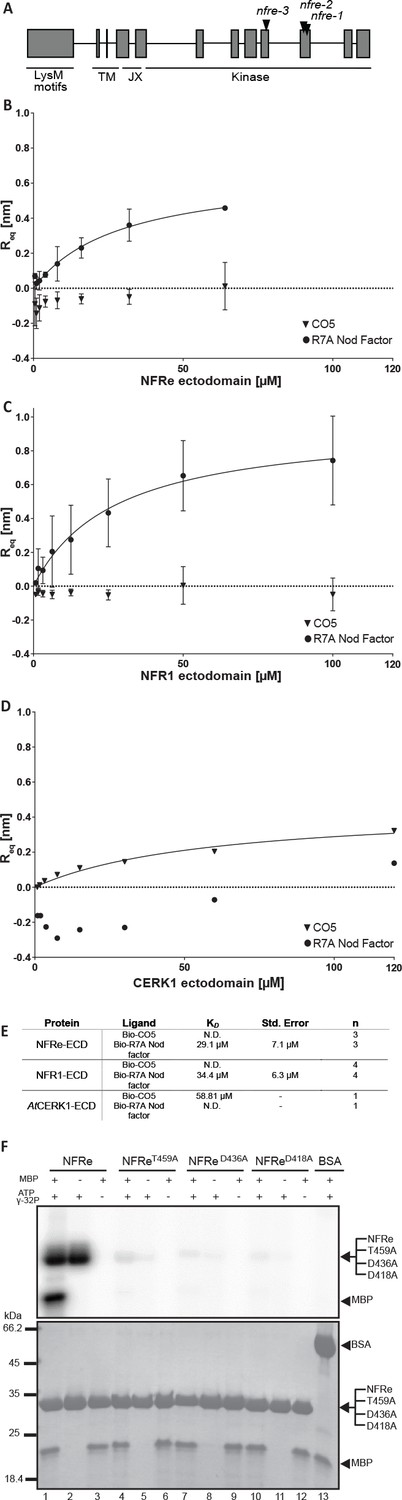
NFRe perceives Nod factor and has an active intracellular kinase.
(A) The structure of Nfre gene (4663 bp) and predicted protein domains (600 aminoacids). The boxes indicate coding regions, lines are introns, and the location of mutations in the three alleles is indicated. The underlines indicate domains in NFRe; LysM domains, TM: transmembrane, JX: juxtamembrane, kinase. (B), (C) and (D) are binding curves obtained from the biolayer interferometry measurements of NFRe ectodomain, NFR1 ectodomain and AtCERK1 ectodomain interaction with two different ligands, R7A Nod factor and GlcNAc5. Both NFRe and NFR1 ectodomain do not bind to GlcNAc5 but show binding to R7A Nod factor. AtCERK1 ectodomain does not bind R7A Nod factor but binds GlcNAc5. (E) Binding constants of NFRe, NFR1 and AtCERK1 ectodomain to GlcNAc5 and R7A Nod factor obtained from biolayer interferometry steady state-analysis. (F) Nfre encodes an active kinase domain. Autophosphorylation and protein kinase activities of wild-type NFRe, T459A, D436A, D418A NFRe mutant versions, and bovine serum albumin as control are shown. Myelin basic protein was used as substrate for kinase activities. Autoradiogram (top), and SDS-PAGE gels (bottom) are shown. KD, Std. Error and n represent the dissociation constant, standard deviation and number of biological replicates used for the analysis. N.D. represents not detectable.
Figure 1—figure supplement 1
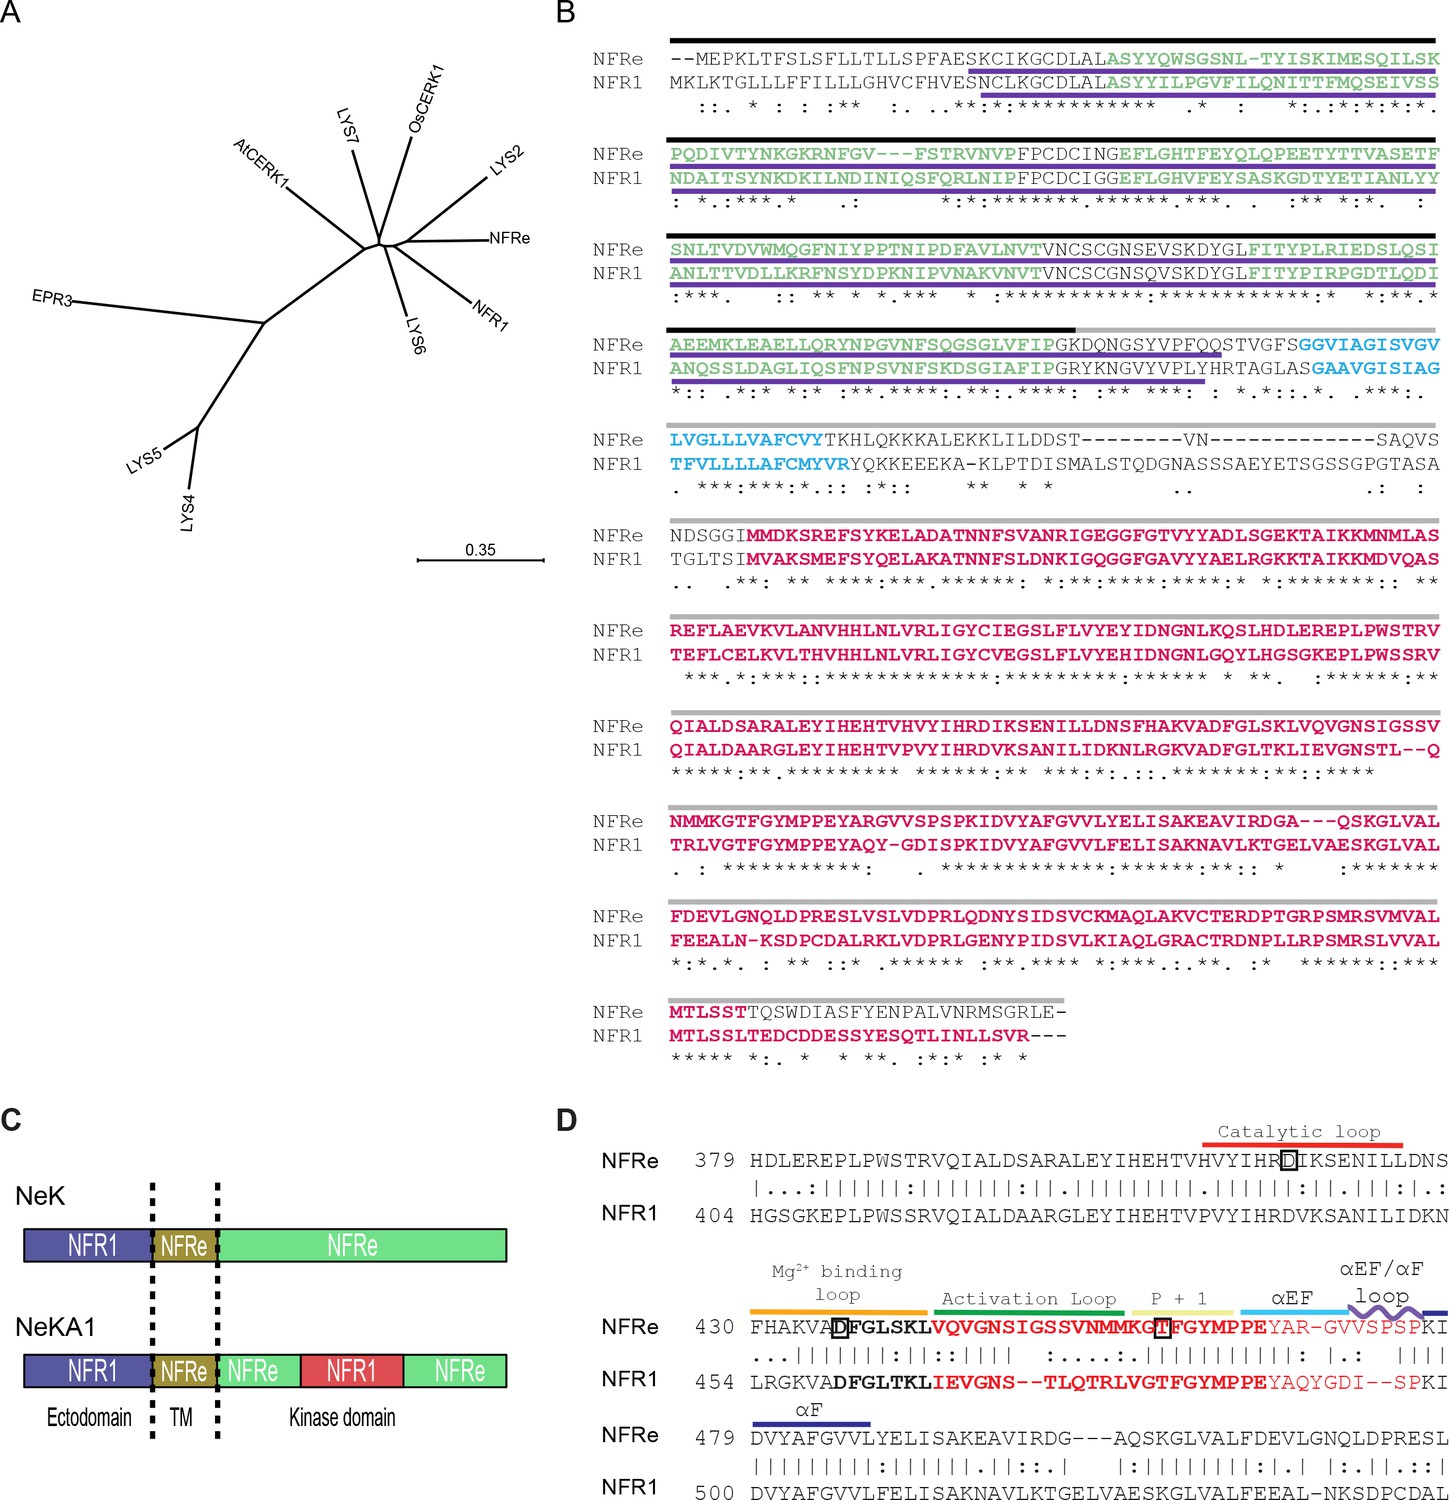
NFRe is an NFR1 type LysM receptor.
(A) Phylogenetic tree of NFR1 type LysM receptors of Lotus japonicus and OsCERK1 and AtCERK1. (B) Alignment of NFRe and NFR1 aminoacid sequences. Sequence under the black line represents the extracellular part of chimeric proteins. Sequence under the grey line represents the transmembrane domain and intercellular part of chimeric proteins. Sequence underlined with a purple line is the ectodomain region used for binding assay. Sequence coloured in green indicates the three LysM motifs. Sequences coloured in blue is the transmembrane domain. Sequences coloured in red is the kinase region used for in vitro kinase assay. Asterisks indicate conserved residues, colons indicate conserved residues, and periods indicate semi-conservative residues. (C) Schematic representation of the two chimeric constructs. NeK contains the ectodomain of NFR1, transmembrane domain and the kinase domain of NFRe. In the NeKA1 construct the activation segment of NFR1 (details in panel B) replaces the corresponding region of NFRe. (D) Partial sequence alignment of NFRe and NFR1 kinase domains. Kinase regions are labelled and the sequence in bold indicates the activation segment in this alignment. Sequences highlighted in red have been swapped between NFRe and NFR1 in the NeKA1 construct. Aminoacids in boxes indicate the location of the point mutations in the kinase mutants used for this study.
Figure 1—figure supplement 2

Purification of NFRe, NFR1 and AtCERK1 ectodomains.
Size exclusion chromatography profiles of glycosylated NFRe (A) and NFR1 (B) ectodomains purified on a Superdex 200 10/300 GL column. SEC profile of glycosylated AtCERK1 ectodomain purified on a Superdex 75 10/300 GL column (C). In the SEC profiles, glycosylated NFRe, NFR1 and AtCERK1 ectodomains elutes as single monodisperse peaks. (D, E, F) Corresponding SDS–PAGE analysis of the SEC runs. Glycosylated NFRe has two glycosylation states as visible by the two bands around 35 kDa (D), whereas glycosylated NFR1 appears as three diffused glycosylation states ranging from 27 to 35 kDa (E). Glycosylated AtCERK1 is visible as a diffuse band around 35 kDa (F).
Figure 1—figure supplement 3
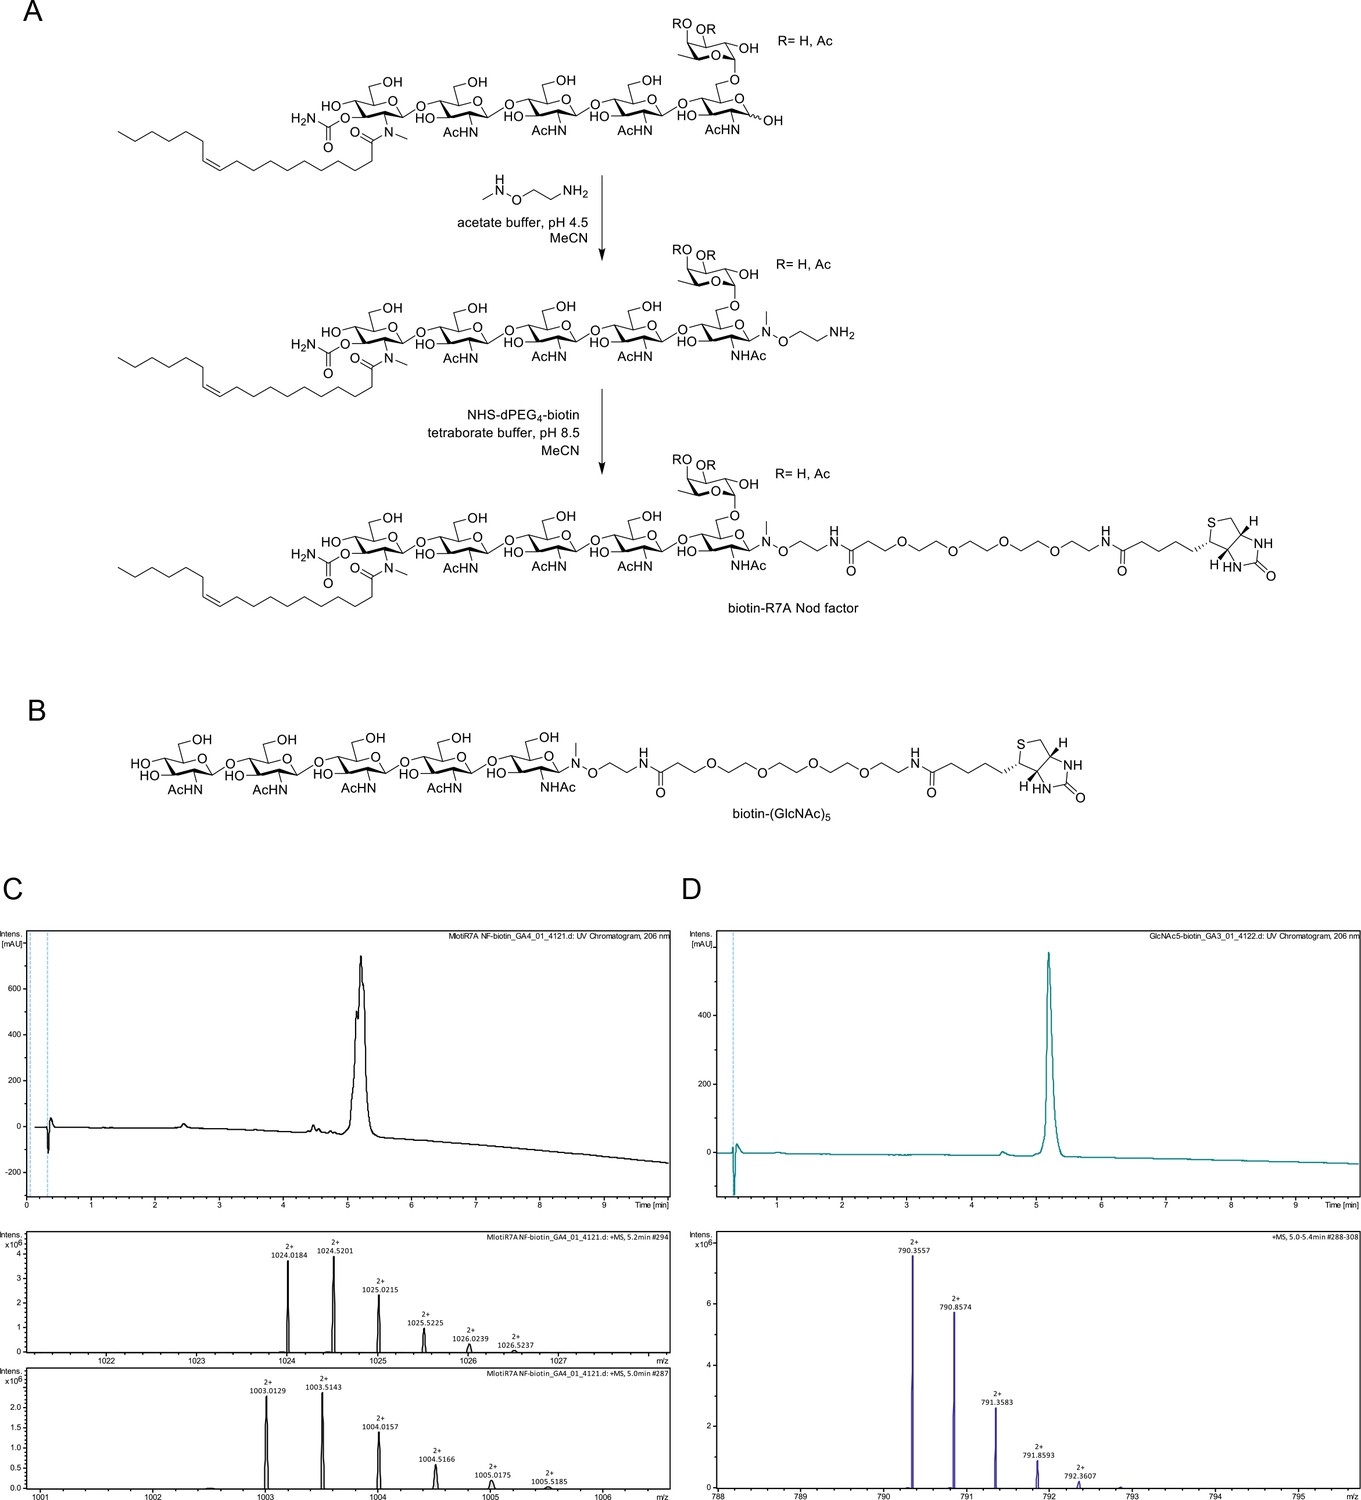
Chemoselective synthesis of biotinylated R7A Nod factor and chitin pentamer conjugates.
(A) Synthesis of biotinylated Mesorhizobium loti, strain R7A Nod factor conjugate. Conditions: (i) R7A Nod factor (5 mM), O-(2-aminoethyl)-N-methyl hydroxylamine (150 mM), 0.62 M acetate buffer at pH 4.5 containing 50% acetonitrile, 16 hr; (ii) N-hydroxysuccinimidyl–dPEG4–biotin (15 mM), 50 mM borate buffer at pH 8.5 containing 50% acetonitrile, 16 hr. (B) Structure of analogously synthesized biotinylated chitopentaose conjugate. (C) High-performance liquid chromatography (HPLC) chromatogram (215 nm) and high-resolution mass spectrometric (HR-MS) data for biotinylated R7A Nod factor conjugate. The chromatogram displays overlapping peaks, owing to a distribution of OAc groups on the fucosyl unit (main species include 3-O-acetylated, 4-O-acetylated, or non-acetylated fucosyl unit). High-resolution mass spectra (HR-MS) were obtained using a Dionex Ultimate 3000 UHPLC instrument (Thermo) coupled to a Bruker Impact HDII QTOF mass spectrometer. Mass spectra shown for [M + 2 hr]2 + for 3-O and 4-O-acetylated species (upper panel) and non-acetylated species (lower panel). (D), HPLC chromatogram (215 nm) and HR-MS data for biotinylated chitopentaose conjugate. Mass spectrum shown for [M + 2 hr]2+.
Figure 2 with 2 supplements
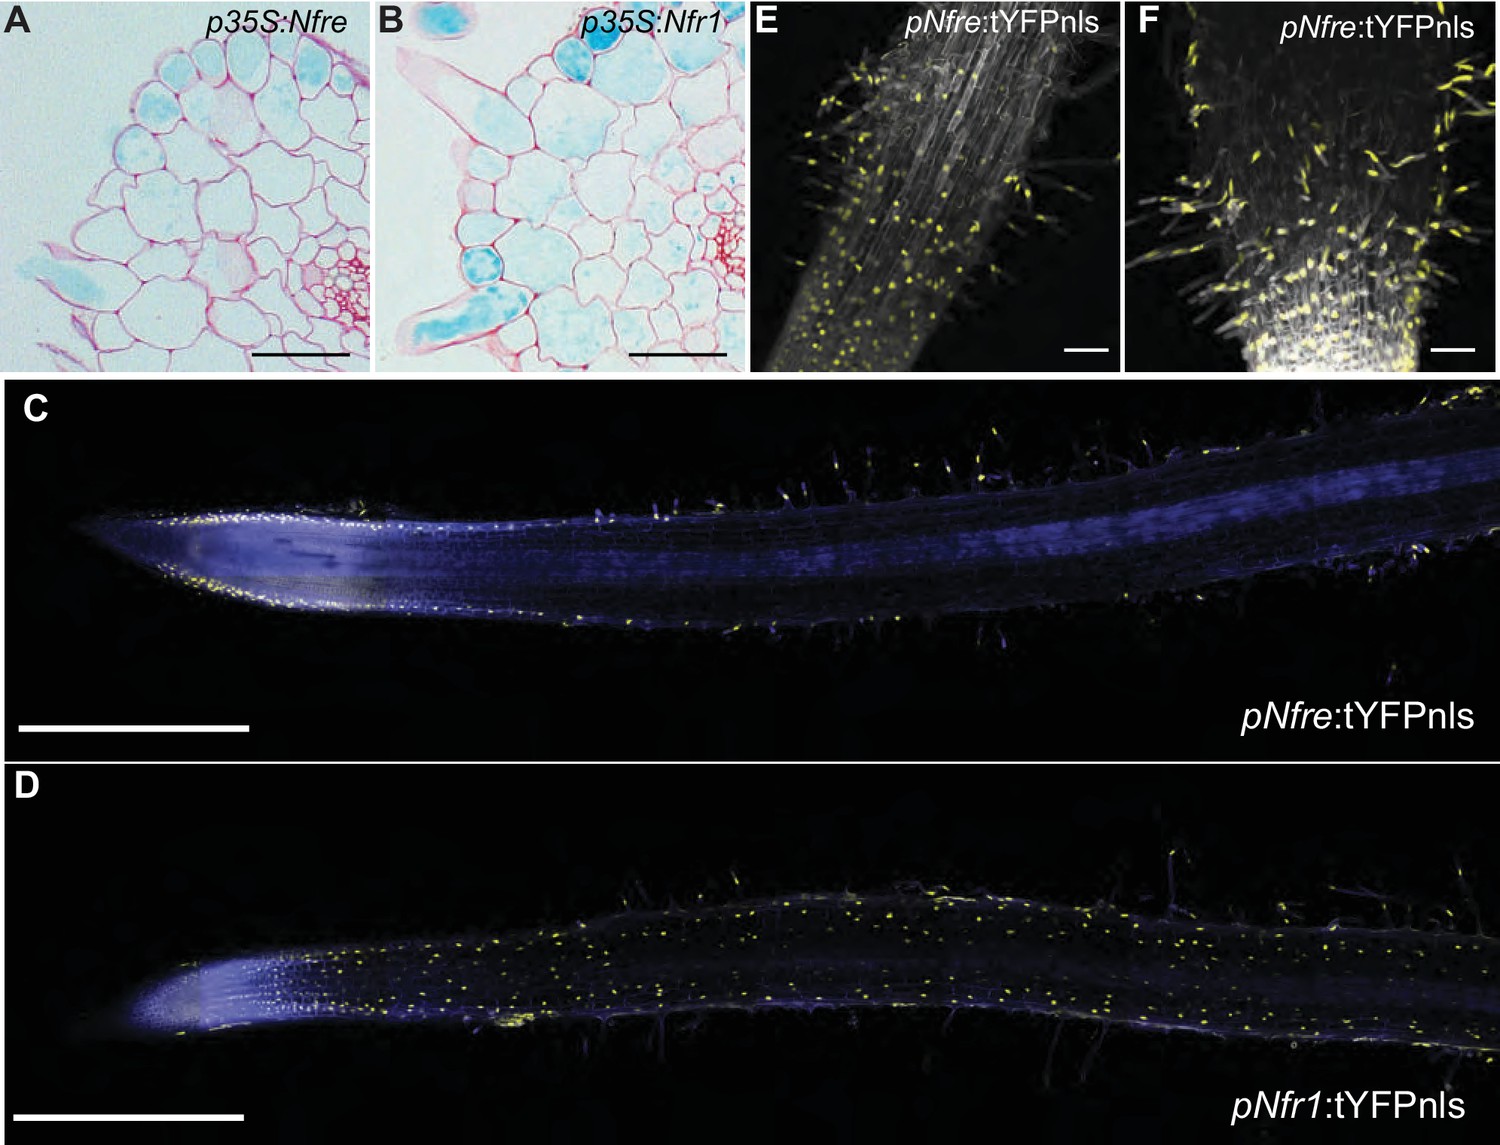
NFRe maintains a low, epidermal expression during root nodule symbiosis.
(A) Transversal root section of nfr1-1-Nin:GUS plants expressing p35S-Nfre shows activation of Nin promoter in the outer cell layer after M. loti inoculation. (B) Transversal root section of nfr1-1-Nin:GUS plants expressing p35S-Nfr1 shows activation of Nin promoter in all cell layers after M. loti inoculation. (C) The epidermal cells, primarily localized in the root susceptible zone, show activity of the Nfre promoter visualized by the nuclear localized triple YFP protein (tYFPnls). (D) Widespread activity of the Nfr1 promoter in the uninoculated root visualized by nuclear localized triple YFP protein (tYFPnls). (E) The expression of Nfre in the susceptible zone of the root, and in the root hairs is maintained after inoculation with M. loti (F). Scale bars, 40 μm (A, B), 0.5 mm (C, D), and 50 μm (E, F).
Figure 2—figure supplement 1
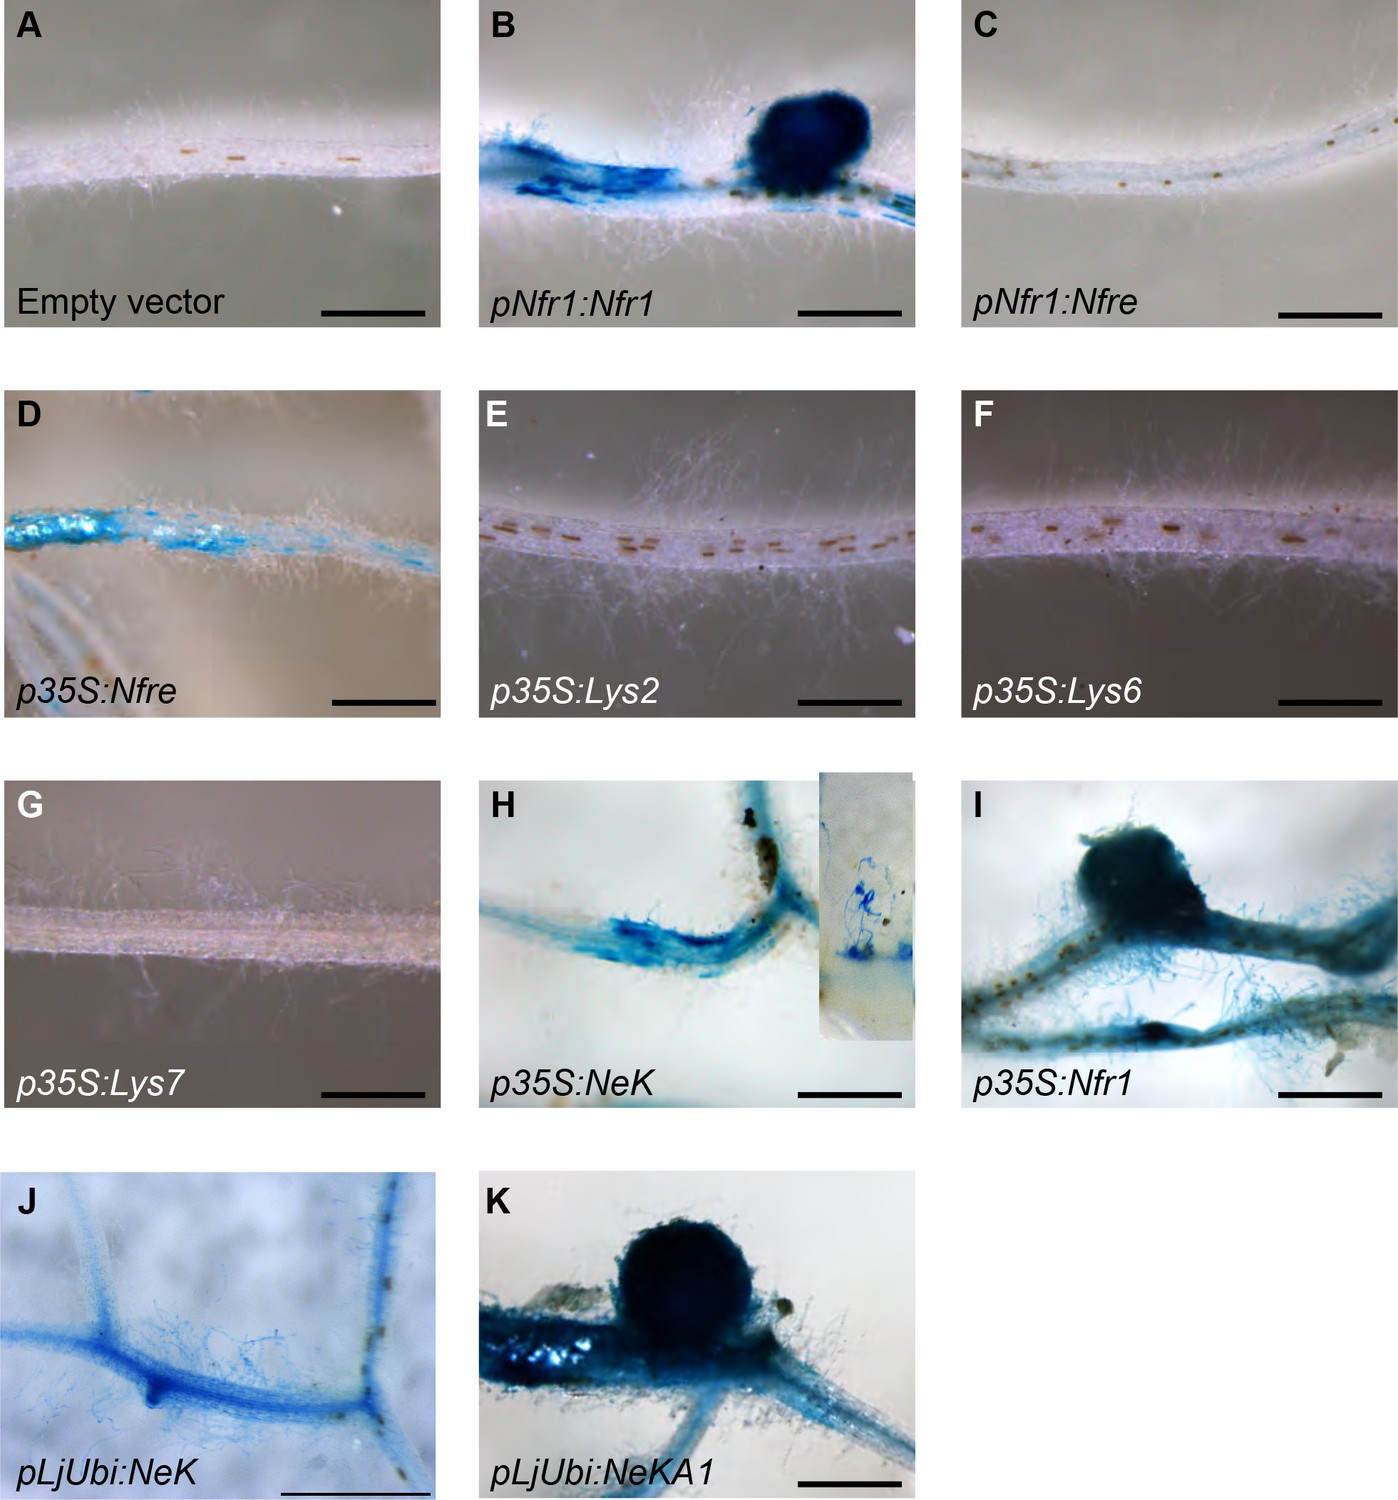
Nin:GUS activation in nfr1-1-Nin:GUS plants expressing different receptor variants.
No activation of Nin:GUS was detected in roots transformed with the empty vector (A) containing the endogenous Nfre, when Nfre expression was controlled by Nfr1 promoter (C) or when Lys2 (E), Cerk6 (F), or Lys7 (G) were expressed from 35S promoter. Nin activation but no nodule formation was observed when full length Nfre (D), or chimeric receptor NeK (extracellular region of NFR1, transmembrane and intracellular region of NFRe) was expressed from the 35S (H) or LjUbiquitin (J) promoters. The inset in (H) shows a close-up of observed epidermal Nin:GUS induction. Nodule formation and cortical activation of Nin:GUS was observed in roots expressing Nfr1 under its own (B) or 35S (I) promoter and in roots expressing the chimeric NeKA1 receptor (K) where the activation segment of NFRe was replaced by the corresponding region from NFR1. Scale bars, 1 mm.
Figure 2—figure supplement 2
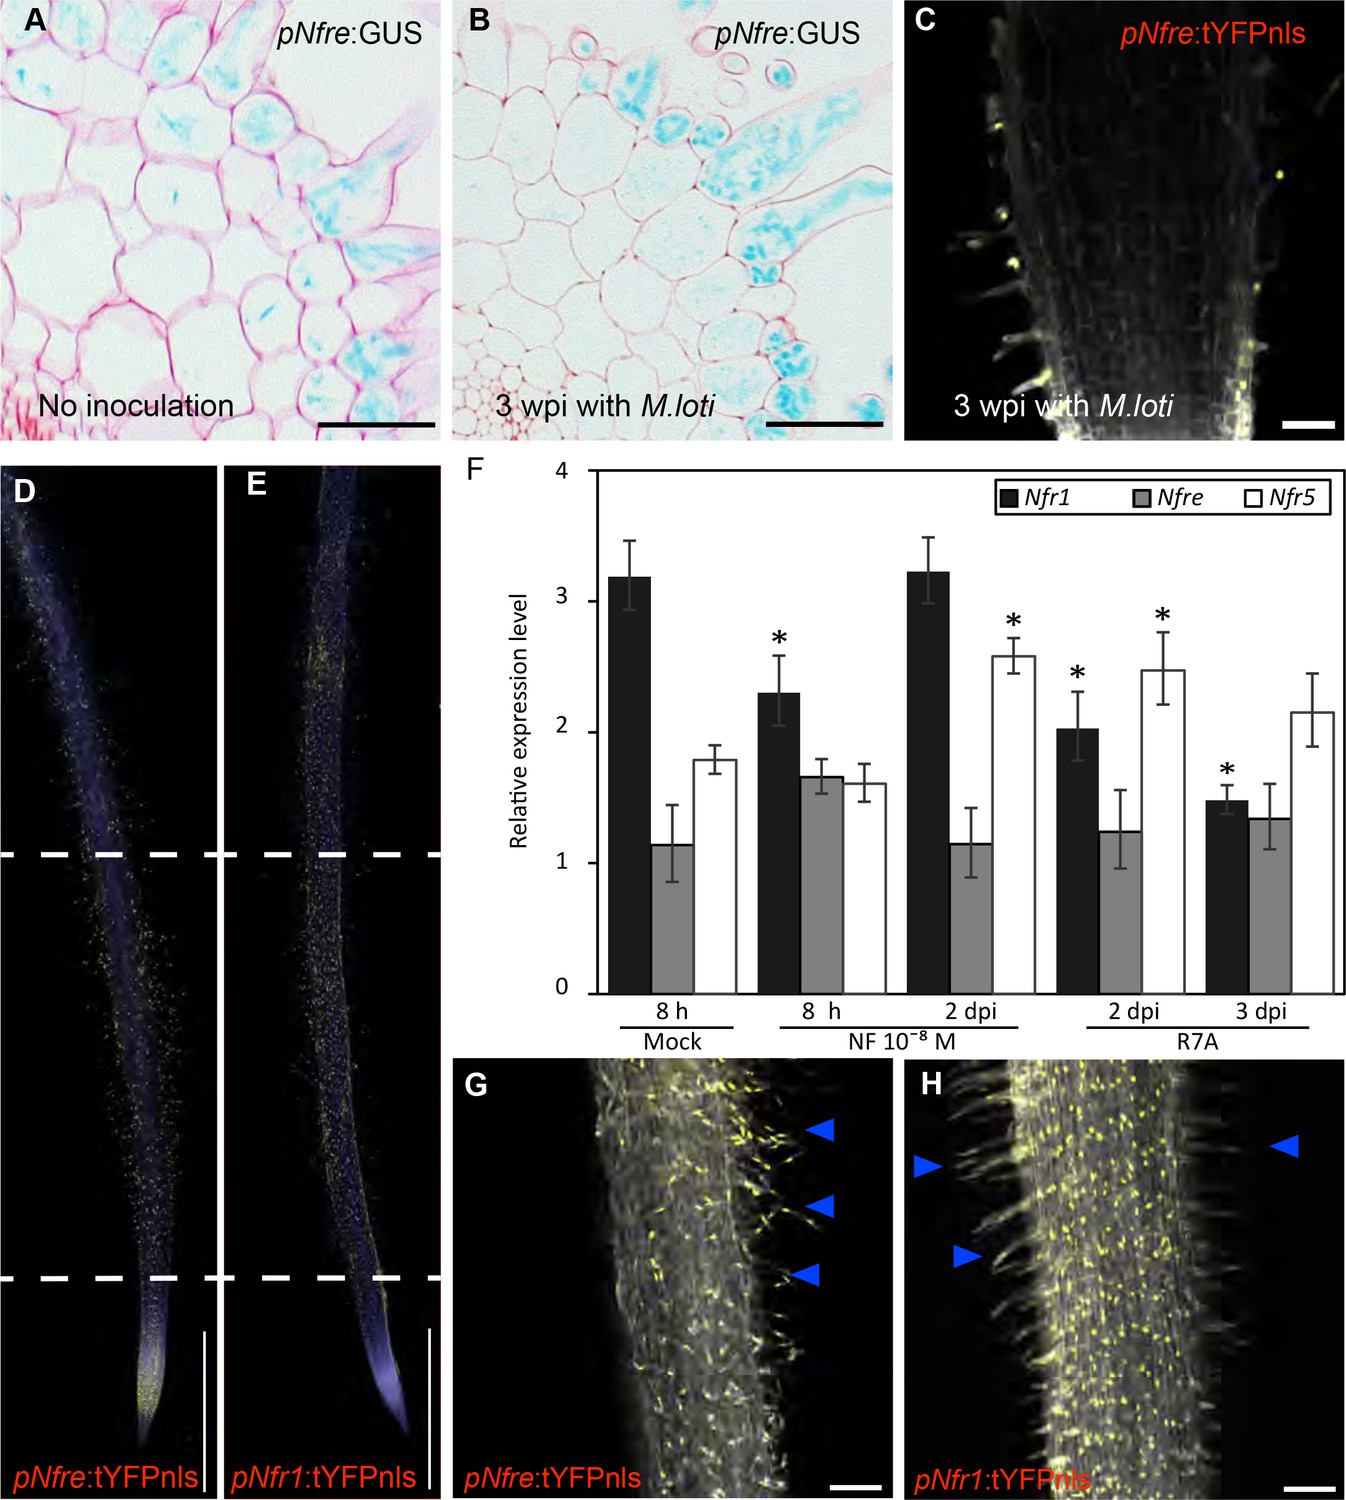
Expression patterns of LysM receptors in Lotus japonicus.
(A) The expression of Nfre:GUS in hairy root of WT without Rhizobium inoculation. (B) The expression of pNfre:GUS in hairy root of WT at 3 weeks after inoculation with M.loti (C) The expression of pNfre:tYFPnls is maintained in the root hairs at 3 weeks after inoculation with M.loti. (D) The epidermal cells, primarily localized in the root susceptible zone, show activity of the Nfre promoter visualized by the nuclear localized triple YFP protein (tYFPnls). (E) Widespread activity of the Nfr1 promoter in the uninoculated root visualized by nuclear localized triple YFP protein (tYFPnls). (F) Transcript levels of Nod factor receptors measured by quantitative RT-PCR in Mock (water)-treated, Nod factor-treated or M. loti inoculated wild type roots. Relative expression levels of the three receptors in three biological and three technical replicas are shown. The levels of housekeeping genes, ATP, UBC and PP2A were used for calculating the relative expressions. *p<0.05, Student´s t-test compared with the expression level in Mock (water)-treated samples. (G) The epidermal cells (root hairs- arrows) of 3dpi root show activity of the Nfre promoter (Nfre:tYFPnls). (H) The epidermal cells (root hairs- arrows) of 3dpi root show lower activity of the Nfr1 promoter (Nfr1:tYFPnls) when compared to the rest of cortical cells or with Nfre in (G). Scale bars, 40 µm (A, B), 50 µm (C), 1 mm (d, e), 100 µm (G, H).
Figure 3 with 4 supplements
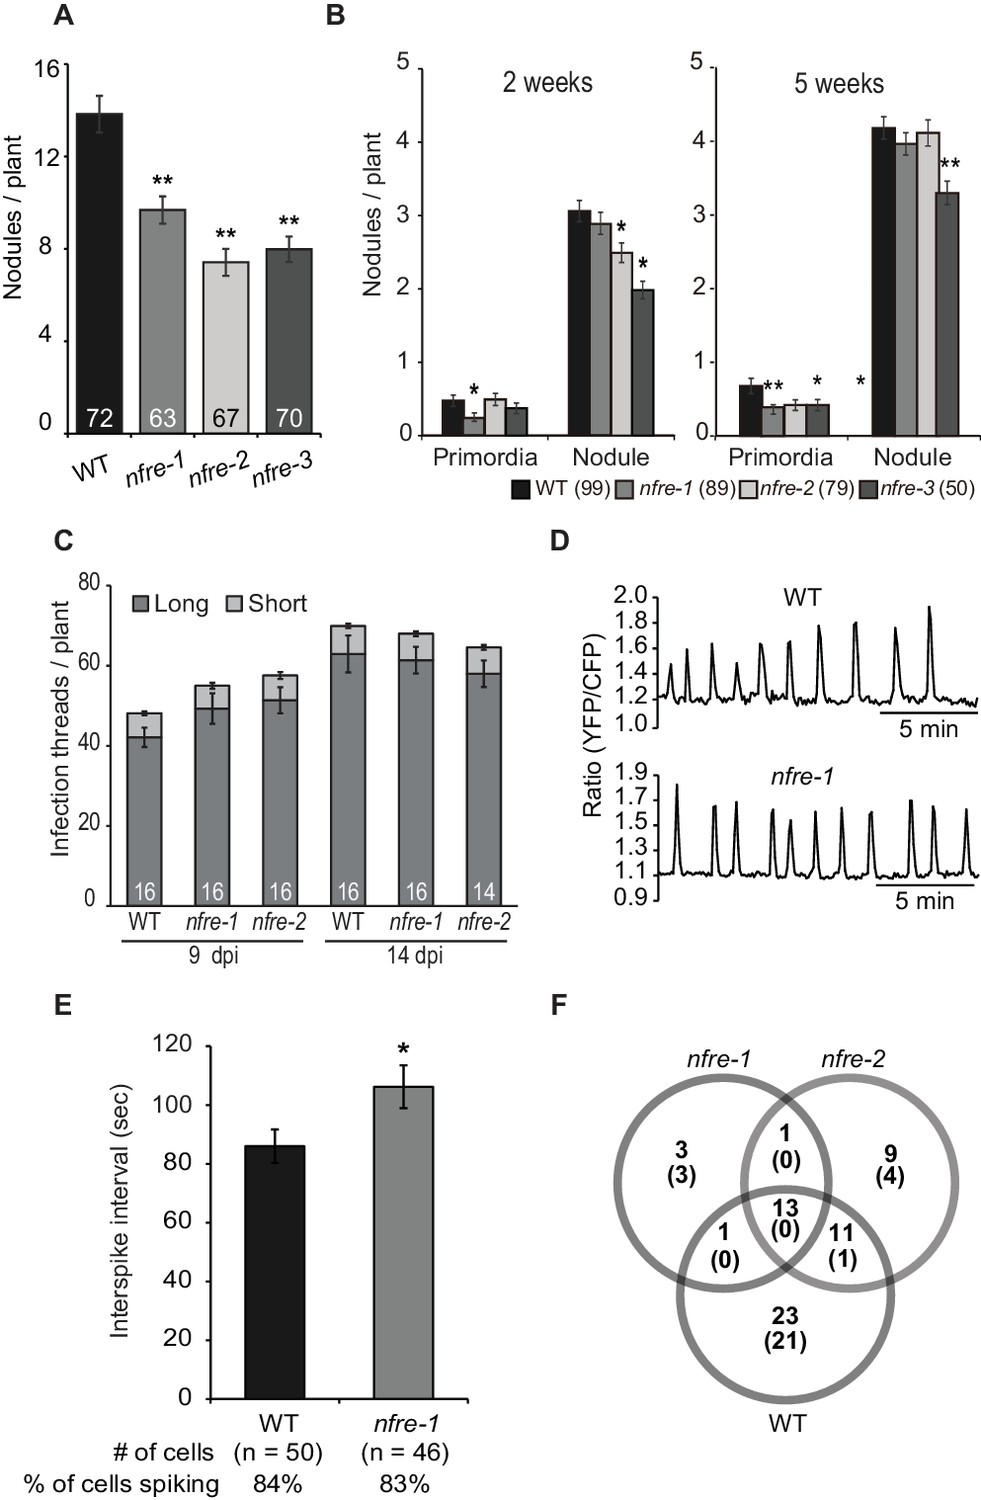
NFRe promotes nodule organogenesis in Lotus japonicus.
(A) Greenhouse-grown nfre plants formed fewer root nodules compared to WT when analysed at eight wpi with M. loti. (B) Agar plate-grown nfre plants form fewer primordia than WT at 5 wpi with M. loti. (C) The nfre mutants and wild type plants form similar number of short and long root hair infection threads at 9 and 14 dpi. (D) Representative nuclear calcium oscillations (spiking) induced by R7A Nod factor (10–8 M) in wild type and nfre mutant root hairs. Ca2+ oscillations are presented as ratiometric values between YFP and CFP signals detected on the basis of the NLS-YC3.6 Ca2+sensor. (E) The inter-spike interval of nfre-1 mutant is significantly longer than that of WT. (F) Venn diagrams of Nod factor up- and down-regulated (parentheses) genes detected in the susceptible zone at 24 hr after treatment. The values given at the bottom of columns in (A) and (C) represents the number of plants analysed. Error bars represent standard error of the mean. *p<0.05 and **p<0.01, Student´s t-test compared to wild type.
Figure 3—figure supplement 1
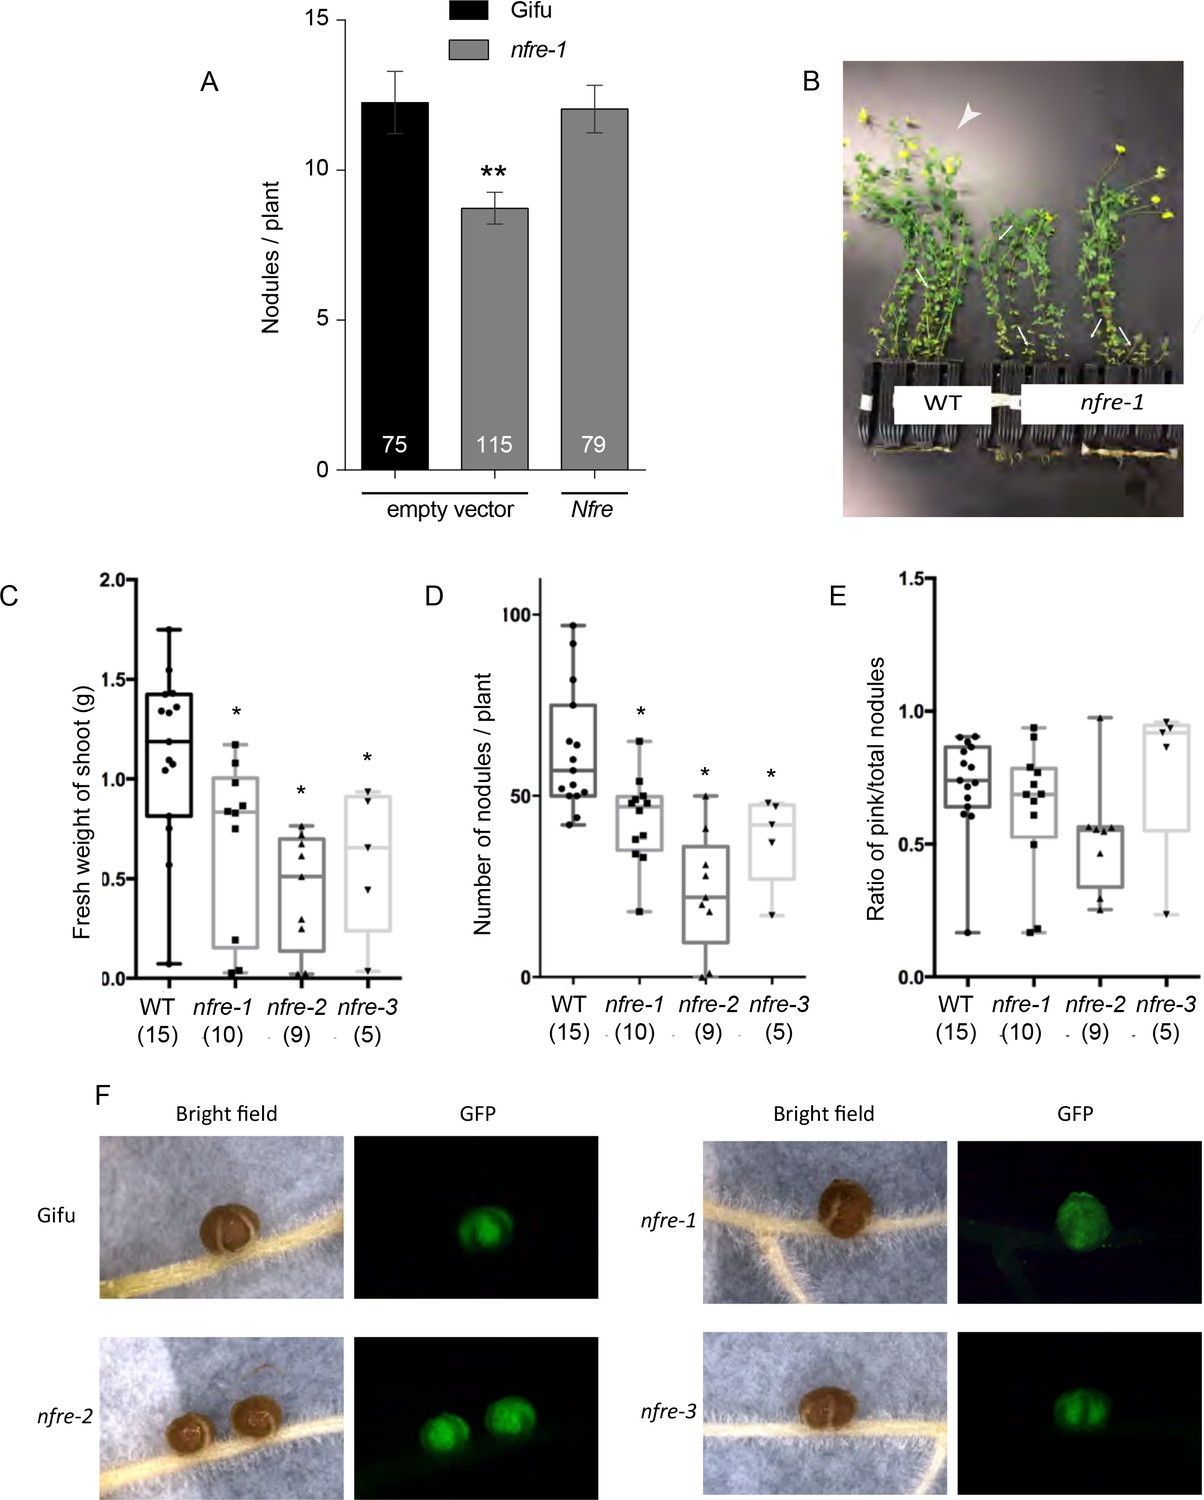
The phenotype of wild-type and nfre plants.
(A) Nfre rescues the nfre-1 nodulation phenotype. Nodules formed by Gifu wild type or nfre-1 plants at 7wpi with M. loti NZP2235 transformed with the empty vector or the wild type Nfre driven by the CaMV 35S promoter respectively. The number of plants analysed is shown (n). Error bars-standard error of the mean. **p<0.01, Student´s t-test. (B) Wild-type and nfre plants after 9 weeks growth on soil. Wild-type plants are larger, have more shoots (arrows), flowers and pods (arrowheads), while nfre plants are shorter, and have just started to develop flowers. (C) Shoot fresh weight (D) Total number of nodules formed when exposed to the native soil rhizobia. (E) The ratio of pink nodules formed when exposed to the native soil rhizobia. The number of plants analysed is shown at the bottom of each bar. Box plot graphs are shown with max and min values, and the significance was assessed by Kruskal-Wallis test. (F) The nodules formed by nfre mutants at 5 wpi have a wild-type appearance, and are fully colonized by M. loti- GFP.
Figure 3—figure supplement 2

Pattern of nuclear calcium oscillations in wild-type and nfre-1 mutant.
(A) Representative nuclear calcium oscillations detected in WT (left) and nfre-1 (right) cells after Nod factor treatment (10–8M). Magenta indicates short interspike interval (<85 s) and blue indicates long interspike interval (≥85 s). Dots represent successive spikes detected by CaSA software. Mean of the minimal (B), median (C), and maximal (D) interspike intervals in WT and nfre-1 cells measured by CaSA software. Error bars represent standard error of the mean. *p<0.05, Student´s t-test.
Figure 3—figure supplement 3
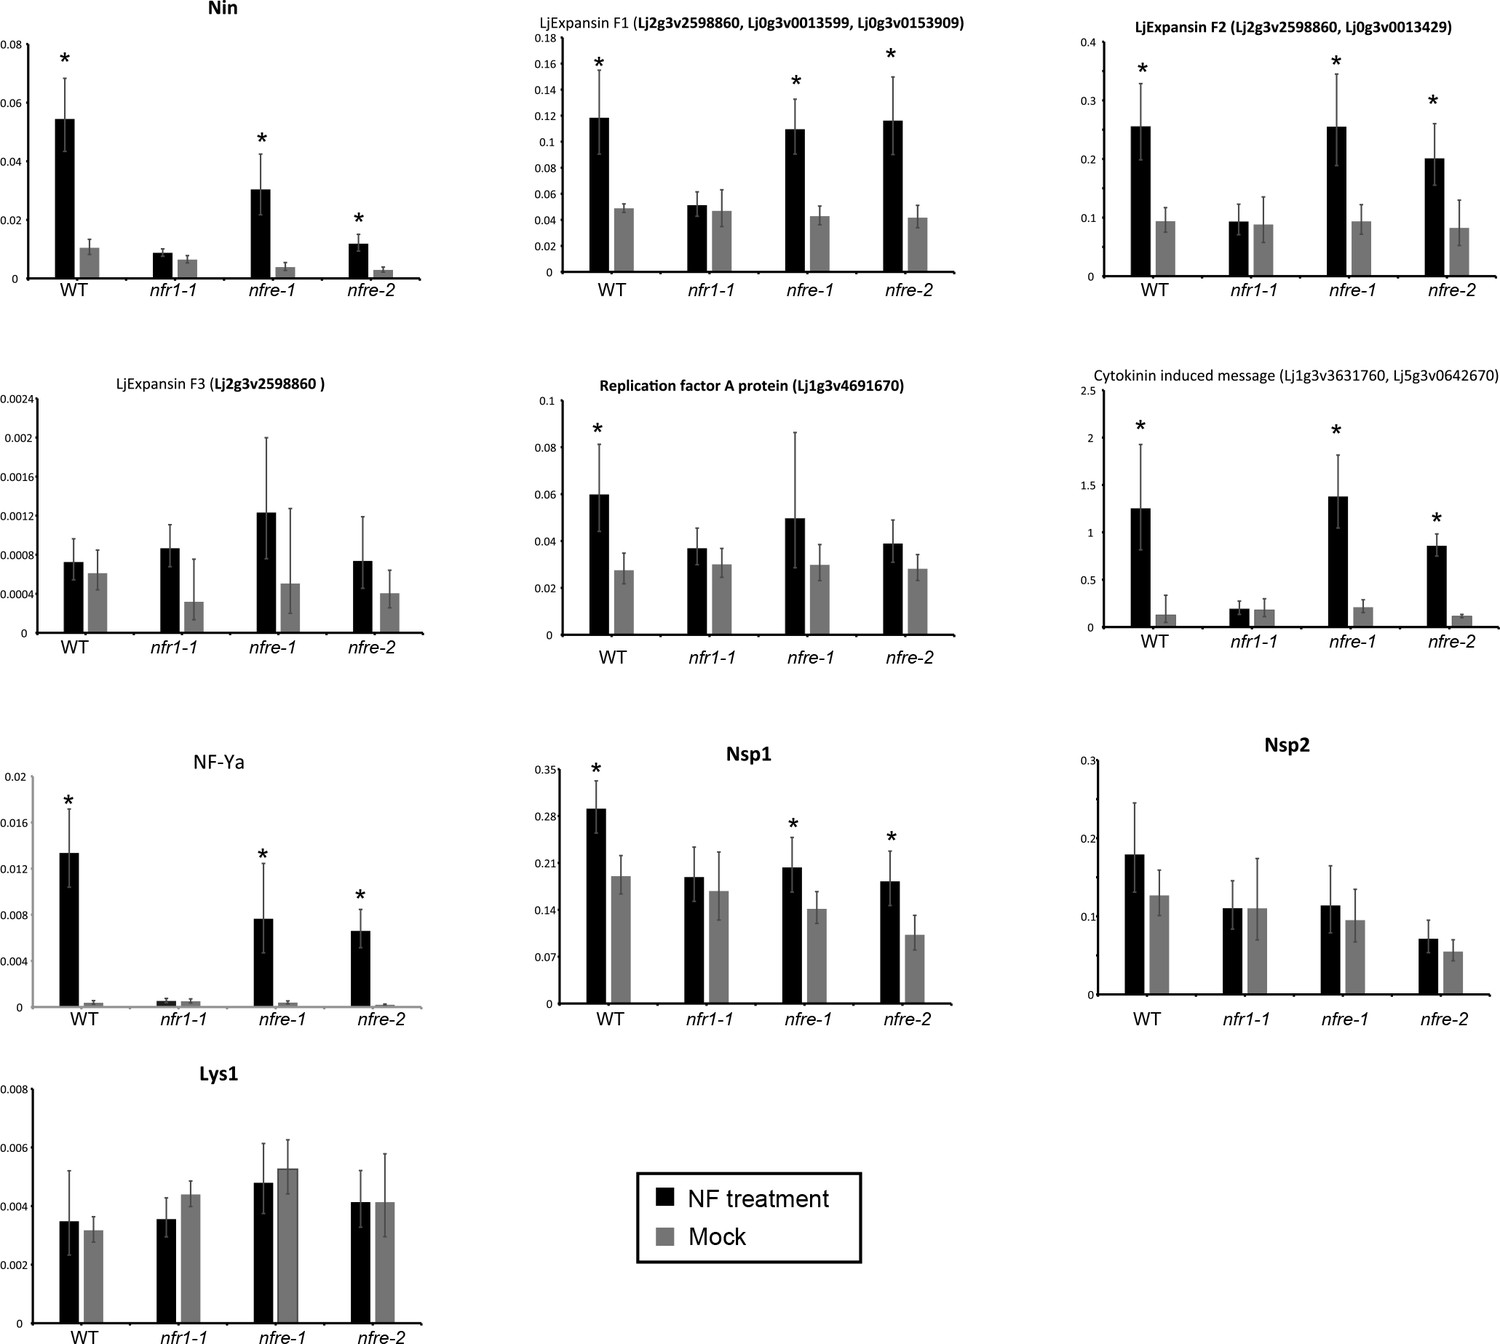
Transcript levels of selected genes measured by quantitative RT-PCR in Mock, or Nod factor-treated wild type, nfr1-1 and nfre mutant roots.
Relative expression levels of selected genes based on the RNA seq study measured in the susceptible zone for three biological and three technical replicas are shown. The levels of housekeeping genes, ATP, UBC and PP2A were used for calculating the relative expressions. *p<0.05, Student´s t-test compared with the corresponding expression level in Mock (water)-treated samples.
Figure 3—figure supplement 4
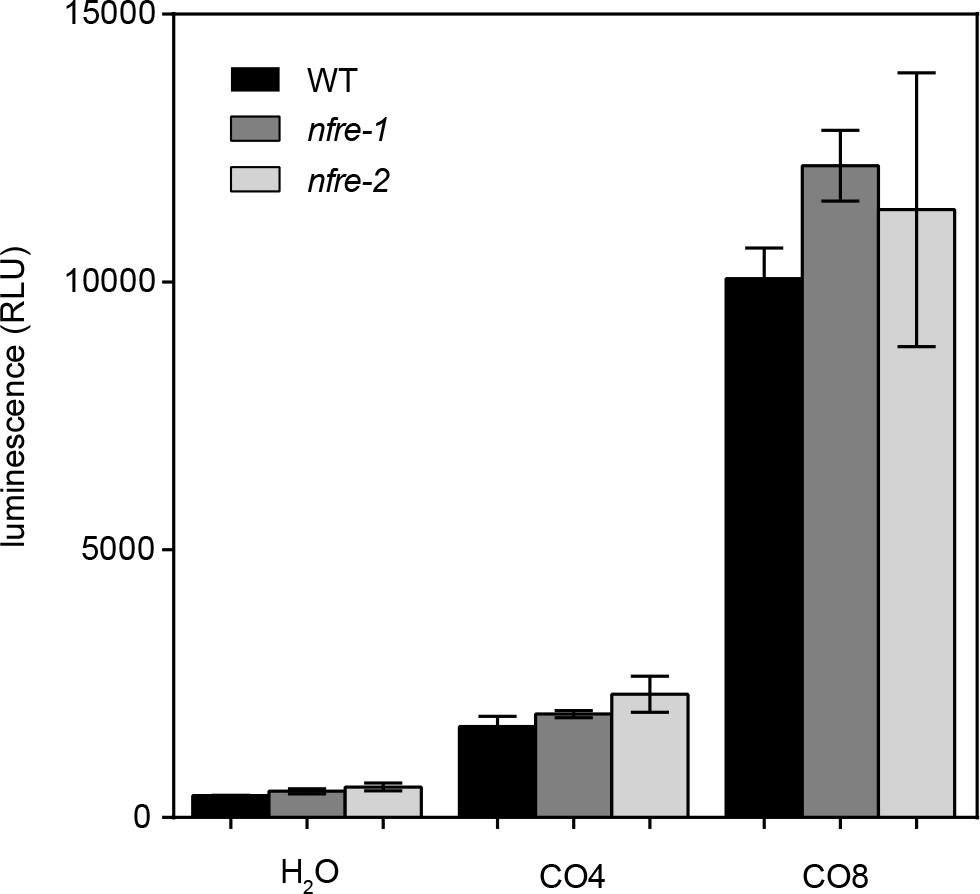
Chitin oligomers elicit production of similar ROS levels in nfre and wild type roots.
Roots of nfre and wild type were treated with 1 μM CO4, CO8 or water then the amount of reactive oxygen species produced was followed by a chemiluminescent assay. Peak values are plotted as relative light units (RLU) and error bars represent the s.e.m. No significant difference (t-test) could be found between the mutant and wild type samples of the same treatment.
Figure 4 with 1 supplement
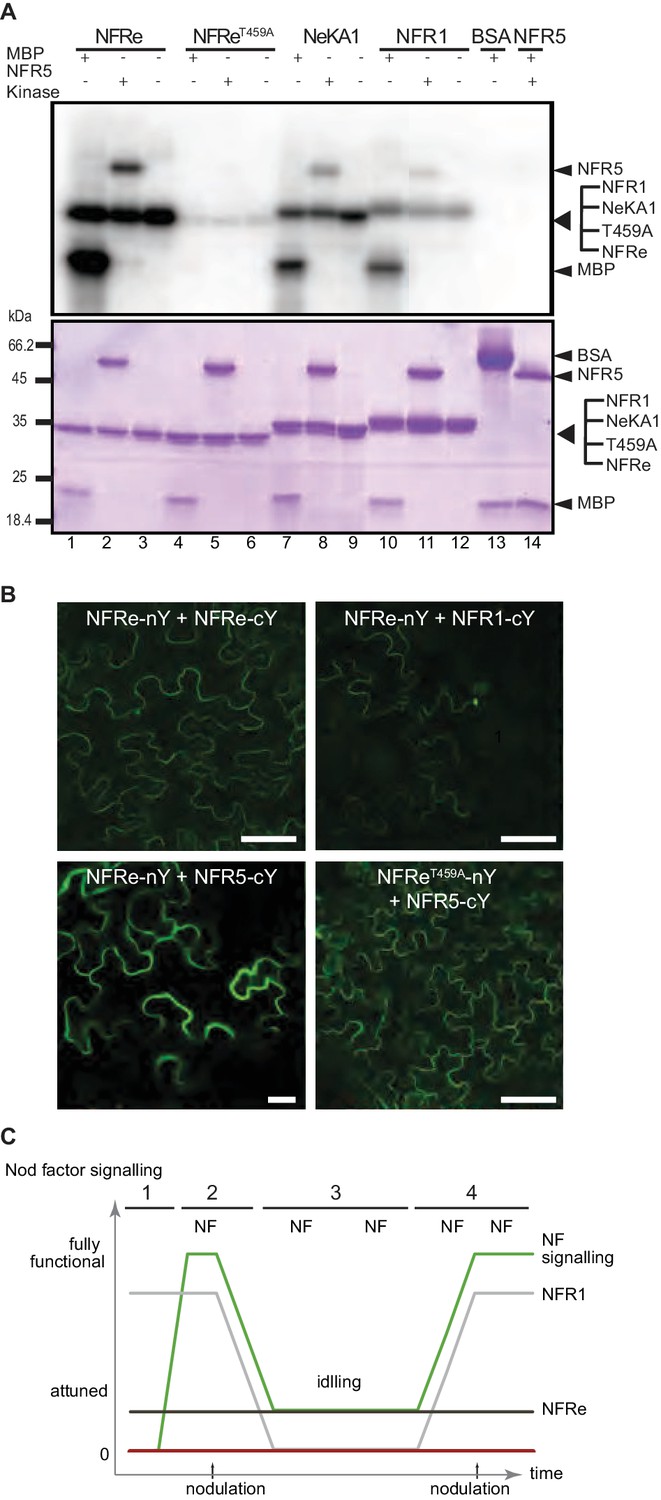
NFRe signalling is dependent of NFR5.
(A) The NFRe kinase phosphorylates NFR5 kinase, whereas the NFReT459A shows no phosphorylation activity. The kinase of NeKA1 receptor in which the activation segment of NFRe was swapped with the corresponding region of NFR1 also phosphorylates NFR5 kinase. NFR1 kinase serves as positive control for NFR5 kinase transphosphorylation. Bovine serum albumin and NFR5 kinase domain are negative controls. (B) Bimolecular fluorescence complementation (BiFC) of YFP signal indicates protein-protein interactions in tobacco leaves. NFRe forms homomers (NFRe-nY +NFRe cY), and heteromers with NFR1 (NFRe-nY +NFR1 cY), or NFR5 (NFRe-cY +NFR5 nY). Formation of heteromeric complexes with NFR5 is not dependent on an active NFRe kinase (NFRe T459A -nY + NFR5 cY). (C) Working model of Nod factor signalling (green line) in the susceptible zone ensuring an efficient nodulation on the expanding root system. NFRe (dark grey line) has a constant expression in the epidermal cells of the susceptible zone. NFR1 (light grey line) dominates the uninoculated root in terms of expression level and spatial distribution (1). Once the symbiotic process is initiated by the Nod factor (NF), the expression of NFR1 is rapidly downscaled (2). A sustained expression of NFRe in the epidermal cells ensures an idling signalling in the susceptible zone, keeping the expanding root system tuned in to rhizobia (3). NFR1 acts as a master switch triggering recurrent symbiotic events in a fast and efficient manner from NFRe-attuned epidermal cells (4).
Figure 4—figure supplement 1

NFRe is localized on plasma membrane and signals together with NFR5.
(A) Wild-type and the T459A mutant version of NFRe localize on plasma membrane of N. benthamiana leaf cells. Co-localisation of YFP-labelled NFRe proteins with the AtPIP2-DsRED plasma membrane marker after plasmolysis (arrows) is shown. (B) NFRe forms homo and heteromeric complexes with NFR1 and NFR5 in N. benthemiana leaves. YFP fluorescence is detected when wild type or T459A mutant version of NFRe tagged with the N-terminal part of YFP protein (n–Y) is co-expressed with NFRe, NFR5 or NFR1 tagged with the C-terminal of the YFP (c–Y). No signal is detected when the same constructs are expressed alone. The left panel shows images collected using the YFP channel, and the right panel shows the corresponding bright field image. (C) Co-expression of NFRe and NFR5 induces cell death in N. benthamiana leaves. This phenotype is dependent on the presence of NFR5 and NFRe (upper panel), and on an active NFRe kinase (lower panel). Co-expression of NFRe and NFR1 does not lead to cell death in tobacco leaves (lower panel). A representative image illustrating the absence of cell death is shown in the lower panel for the following expressions: NFReT485A and NFR5, NFRe and NFR1, NFRe, NFR5, NFR1. (D). NFRe signalling in L. japonicus roots is dependent on NFR5. Unlike NFR5 (upper panel), the NFRe, NFR or NeK receptors expressed from the 35S promoter fail to activate Nin promoter in the nfr5-2-Nin:GUS plants exposed to M. loti bacteria for 5 weeks (representative root is shown in the lower panel). Scale bars, 20 μm (A), 100 μm (B).
Tables
Table 1
Nfre expression from p35S promoter activates Nin induction in the nfr1-1-Nin:GUS plants
https://doi.org/10.7554/eLife.33506.010| Construct (plants analysed) | No. of plants Nin positive | % of plants with Nin induction | No. of nodulated plants | % of nodulated plants |
|---|---|---|---|---|
| Empty vector (28) | 0 | 0 | 0 | 0 |
| pNfr1:Nfre (21) | 0 | 0 | 0 | 0 |
| p35S:Nfre (58) | 28 | 48 | 0 | 0 |
| p35S:Nfre_T459A (21) | 0 | 0 | 0 | 0 |
| pNfr1:Nfr1 (19) | 19 | 100 | 19 | 100 |
| p35S:Nfr1 (26) | 25 | 96 | 25 | 96 |
| p35S:Lys2 (14) | 0 | 0 | 0 | 0 |
| p35S:Lys6 (34) | 0 | 0 | 0 | 0 |
| p35S:Lys7 (34) | 0 | 0 | 0 | 0 |
Table 2
The intracellular domains of NFRe and NFR1 kinases determine the signalling output
https://doi.org/10.7554/eLife.33506.016| Construct (plants analysed) | No. of plants Nin positive | % of plants with Nin induction | No. of nodulated plants | % of nodulated plants |
|---|---|---|---|---|
| p35S:NeK (29) | 3 | 10 | 0 | 0 |
| pLjUbi:NeK (40) | 2 | 5 | 0 | 0 |
| pLjUbi:NeKA1 (40) | 26 | 65 | 14 | 35 |
| pLjUbi:Nfr1 (22) | 22 | 100 | 21 | 95 |
Additional files
-
Supplementary file 1
Primers used in this study.
- https://doi.org/10.7554/eLife.33506.019
-
Supplementary file 2
Differentially expressed genes in the susceptible zone of wild-type and nfre mutant roots after Nod factor treatment.
- https://doi.org/10.7554/eLife.33506.020
-
Supplementary file 3
Signalling from NFRe in Lotus roots is dependent of NFR5.
- https://doi.org/10.7554/eLife.33506.021
-
Transparent reporting form
- https://doi.org/10.7554/eLife.33506.022
Download links
A two-part list of links to download the article, or parts of the article, in various formats.
Downloads (link to download the article as PDF)
Open citations (links to open the citations from this article in various online reference manager services)
Cite this article (links to download the citations from this article in formats compatible with various reference manager tools)
Epidermal LysM receptor ensures robust symbiotic signalling in Lotus japonicus
eLife 7:e33506.
https://doi.org/10.7554/eLife.33506


