Covalent linkage of the DNA repair template to the CRISPR-Cas9 nuclease enhances homology-directed repair
- Christian Berk

- Katja Bargsten
- Yizhou Li
- Dario Neri
- Mark D Robinson
- Constance Ciaudo
- Jonathan Hall
- Martin Jinek
- Gerald Schwank
- The Institute of Molecular Health Sciences, ETH Zurich, Switzerland
- The Institute of Molecular Life Sciences, University of Zurich, Switzerland
- SIB Swiss Institute of Bioinformatics, Switzerland
- Institute for Pharmaceutical Sciences, ETH Zurich, Switzerland
- Department of Biochemistry, University of Zurich, Switzerland
Figures
Figure 1
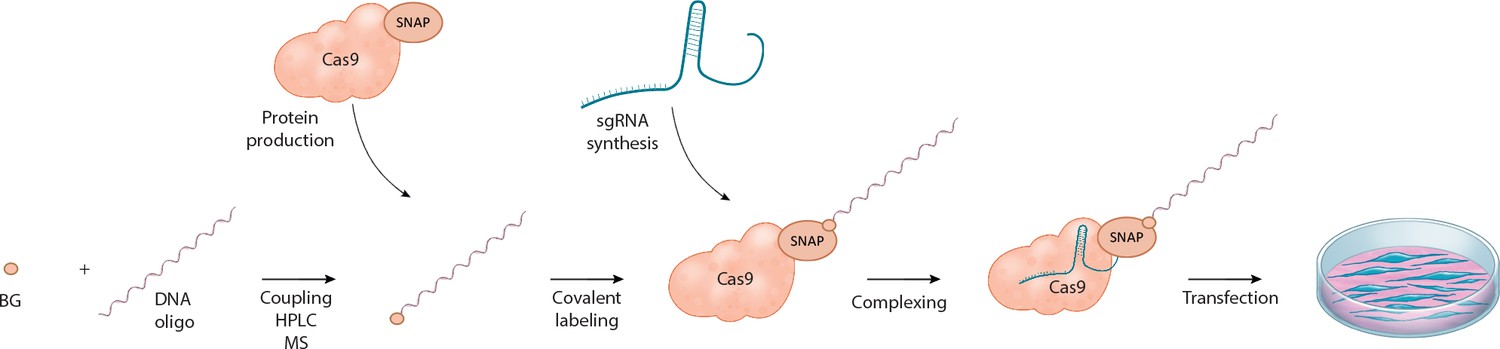
Schematic overview of the workflow for linking the DNA repair template to the Cas9 RNP complex.
O6-benzylguanine (BG)-labeled DNA oligos are covalently linked to Cas9-SNAP fusion proteins. The DNA-Cas9 molecules are then complexed with the specific sgRNAs to form the functional ribonucleoprotein-DNA (RNPD) complexes.
Figure 2

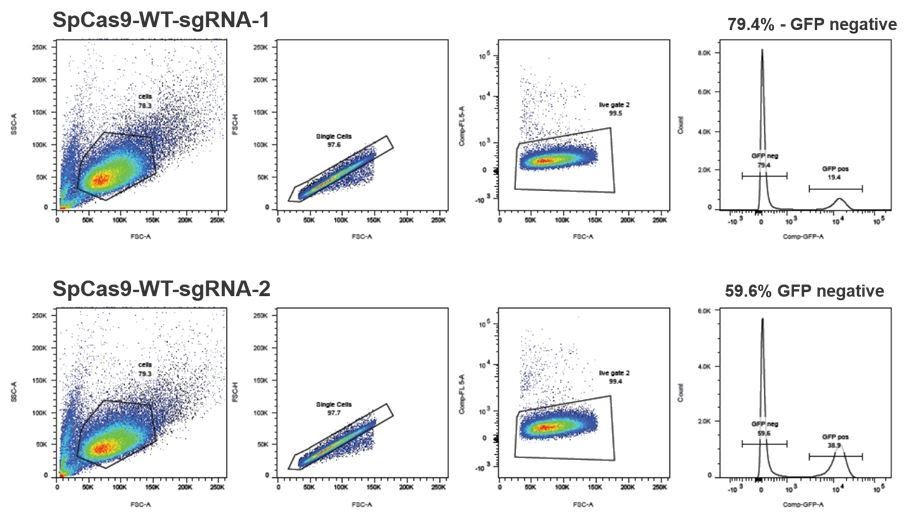
Fluorescent reporter system for high-throughput analysis of DSB repair rates.
(a) Schematic overview of the HEK293T fluorescent reporter system. The RFP fluorophore carries a c.190_191delinsCT mutation that substitutes two nucleotides TA at the positions 190 and 191 in the RFP sequence to CT. This leads to the inactivation the RFP fluorophore by the substitution of tyrosine at the position 63 with leucine (p.Y63L). Repair of the mutation via donor oligos generates RFP/GFP double positive cells; indel mutations generate RFP/GFP double negative cells if they induce a frame shift. Of note, analysis of the reporter locus by next generation sequencing (NGS) demonstrated that 20 percent of indels did not lead to a frame shift (Supplementary file 4). Nevertheless, although FACS analysis thereby underestimates the absolute number of edited cells, it allows to accurately compare the correction efficiencies of different Cas9 systems. ‘X’ labels the mutation in RFP. 2A stands for 2A ‘self-cleaving’ peptide (Kim et al., 2011). (b) Schematic overview of the Streptococcus pyogenes sgRNA targeting mutRFP fluorophore and the corresponding PAM site. Black arrow indicates the introduced DSB site. The two nucleotides in the sgRNA seed sequence as well as the amino acid in the fluorophore region that are changed upon of precise repair (CT >TA and L > Y) are shown in orange. (c) Correction and indel rates can be quantified by FACS. The panels show FACS plots for gating GFP negative cells (upper panel) and the RFP positive cells (lower panel). (d) Representative confocal microscopy images. Scale bar: 50 µm, magnification 20x. Live cell nuclei were stained with Hoechst 33342. The efficiency of the sgRNA (sgRNASpCas9(mutRFP)) is shown in Figure 3—figure supplement 1b.
Figure 3 with 1 supplement
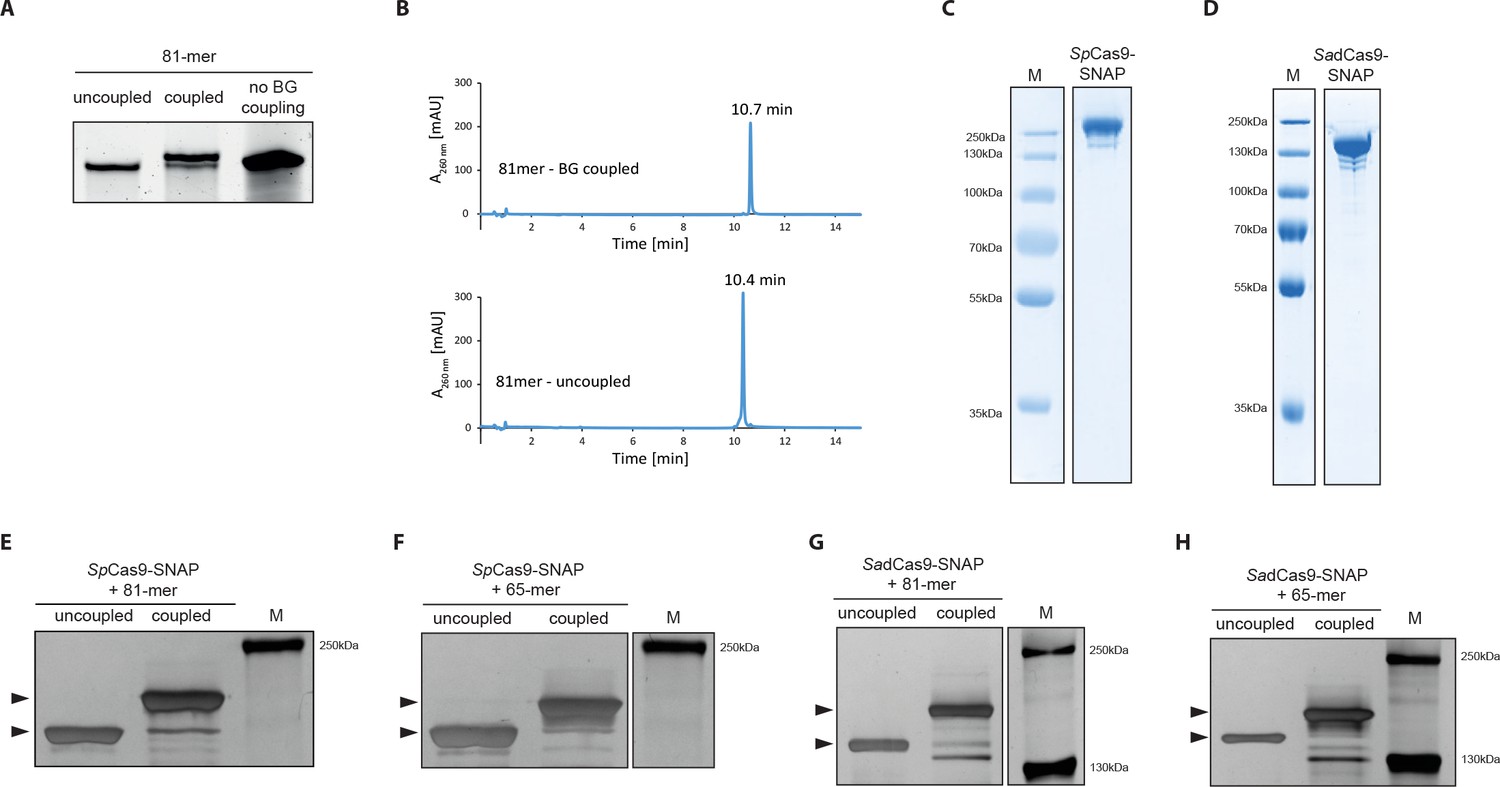
Covalent linkage of the DNA repair template to the Cas9 RNP complex.
(a) Band shift of the 81-mer amino-modified oligo after coupling to BG-GLA-NHS shown on a denaturing PAGE gel. Amino modified oligos were mixed with amine-reactive BG building blocks and the samples were taken prior to the reaction (uncoupled) and after the reaction (coupled). No BG coupling: no amine-reactive BG building block was added to the amino modified oligos. (b) LC-MS analysis of HPLC-purified BG-coupled and uncoupled DNA repair templates. (c,d) Coomassie Blue stained SDS-PAGE gels of the purified SpCas9-SNAP and the SadCas9-SNAP fusion proteins (functionality of the SNAP-tags is shown in Figure 3—figure supplement 1e,f). (e-h) Silver stained SDS-PAGE gels. Band shifts confirm covalent linkage of Cas9-SNAP proteins to BG-coupled 81-mers. Lower arrowheads: unbound Cas9-SNAP. Upper arrowheads: Cas9-SNAP covalently bound to oligos.
-
Figure 3—source data 1
Numerical data and the exact p values for all graphs in Figure 3—figure supplement 1.
- https://doi.org/10.7554/eLife.33761.007
Figure 3—figure supplement 1
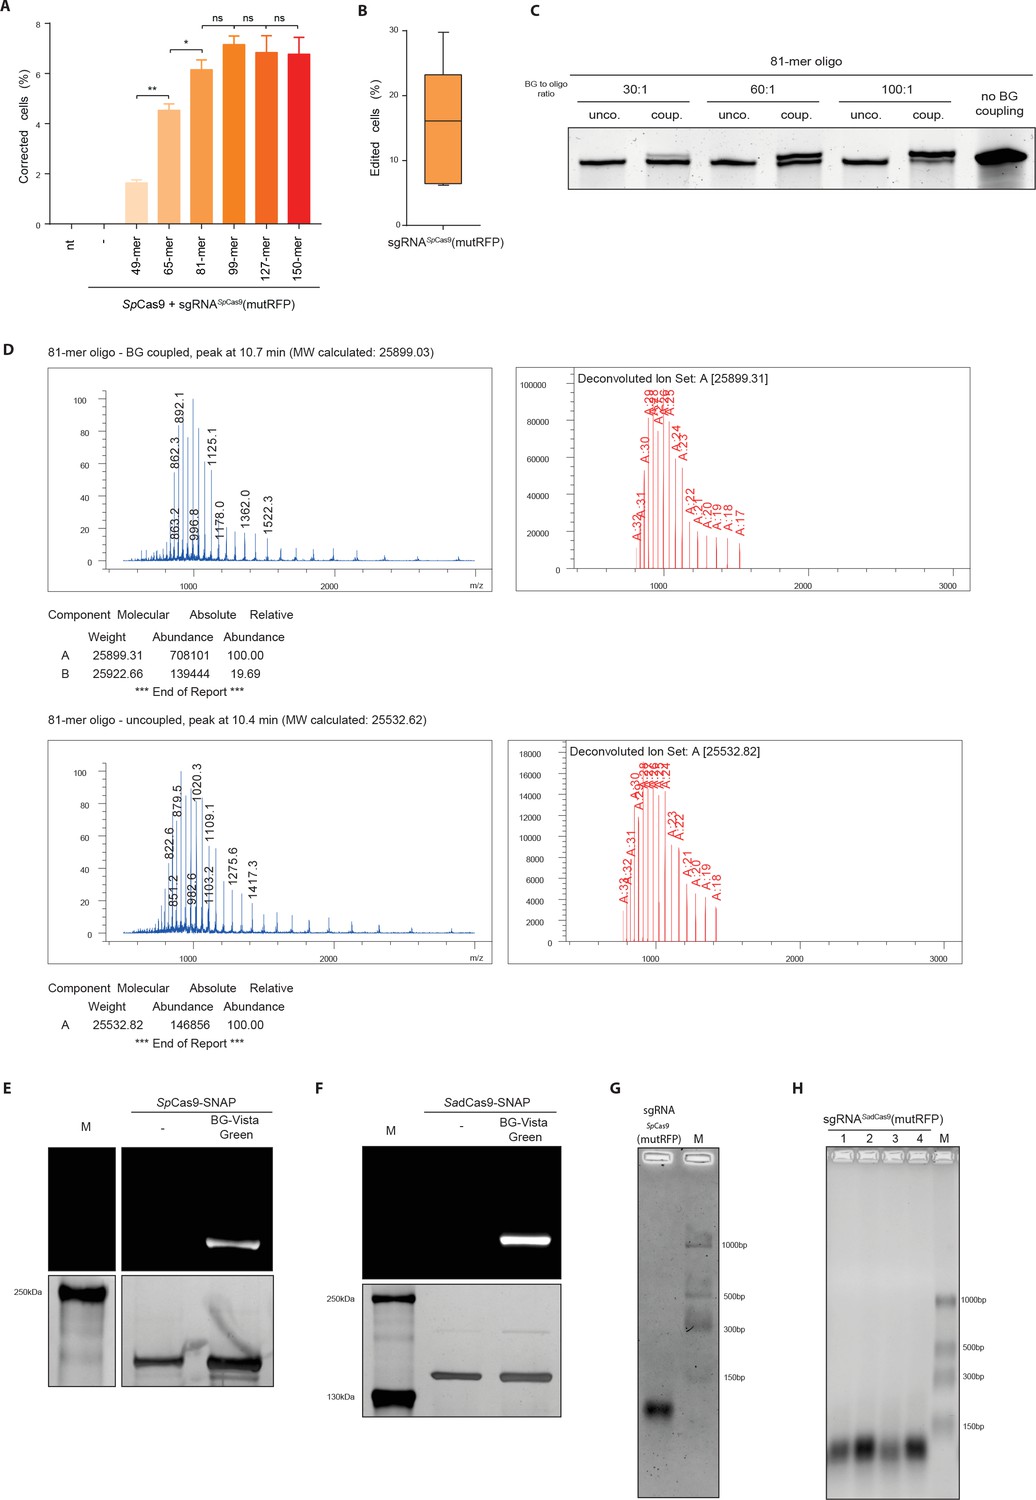
Covalent linkage of the DNA repair template to the Cas9 RNP complex.
(a) Quantification of HDR rates with DNA repair templates of different lengths by FACS. (b) Quantification of sgRNASpCas9(mutRFP) editing efficiency in the reporter cell line by FACS. (c) SYBR-Gold stained denaturing PAGE gel. Proportion of shifted 81-mer amino-modified oligos after the coupling reaction with different concentrations of BG-GLA-NHS building blocks. (d) Negative ion ESI mass spectra of HPLC purified BG-coupled (top panel) and uncoupled (bottom panel) oligos shown in Figure 3b. (e,f) SDS-PAGE gels of SpCas9-SNAP (e) and the SadCas9-SNAP (f) proteins labeled with BG-Vista Green (upper panels). Subsequently gels were silver stained for protein detection (lower panels). (g,h) Denaturing RNA gels (2% MOPS) with in vitro transcribed sgRNAs. (g) sgRNA used to create the DSB in the mutRFP locus (sgRNASpCas9(mutRFP)). (h) sgRNAs used to bind catalytically inactive SadCas9 to regions upstream (sgRNASadCas9(mutRFP)−1 and sgRNASadCas9(mutRFP)−2) and downstream (sgRNASadCas9(mutRFP)−3 and sgRNASadCas9(mutRFP)−4) of the mutRFP locus. Box and whiskers plot: min to max (**p<0.0021, *p<0.0332 with n = 7; n represents the number of biological replicates). Numerical data and the exact p values for all graphs are shown in the Figure 3—source data 1.
Figure 4 with 2 supplements
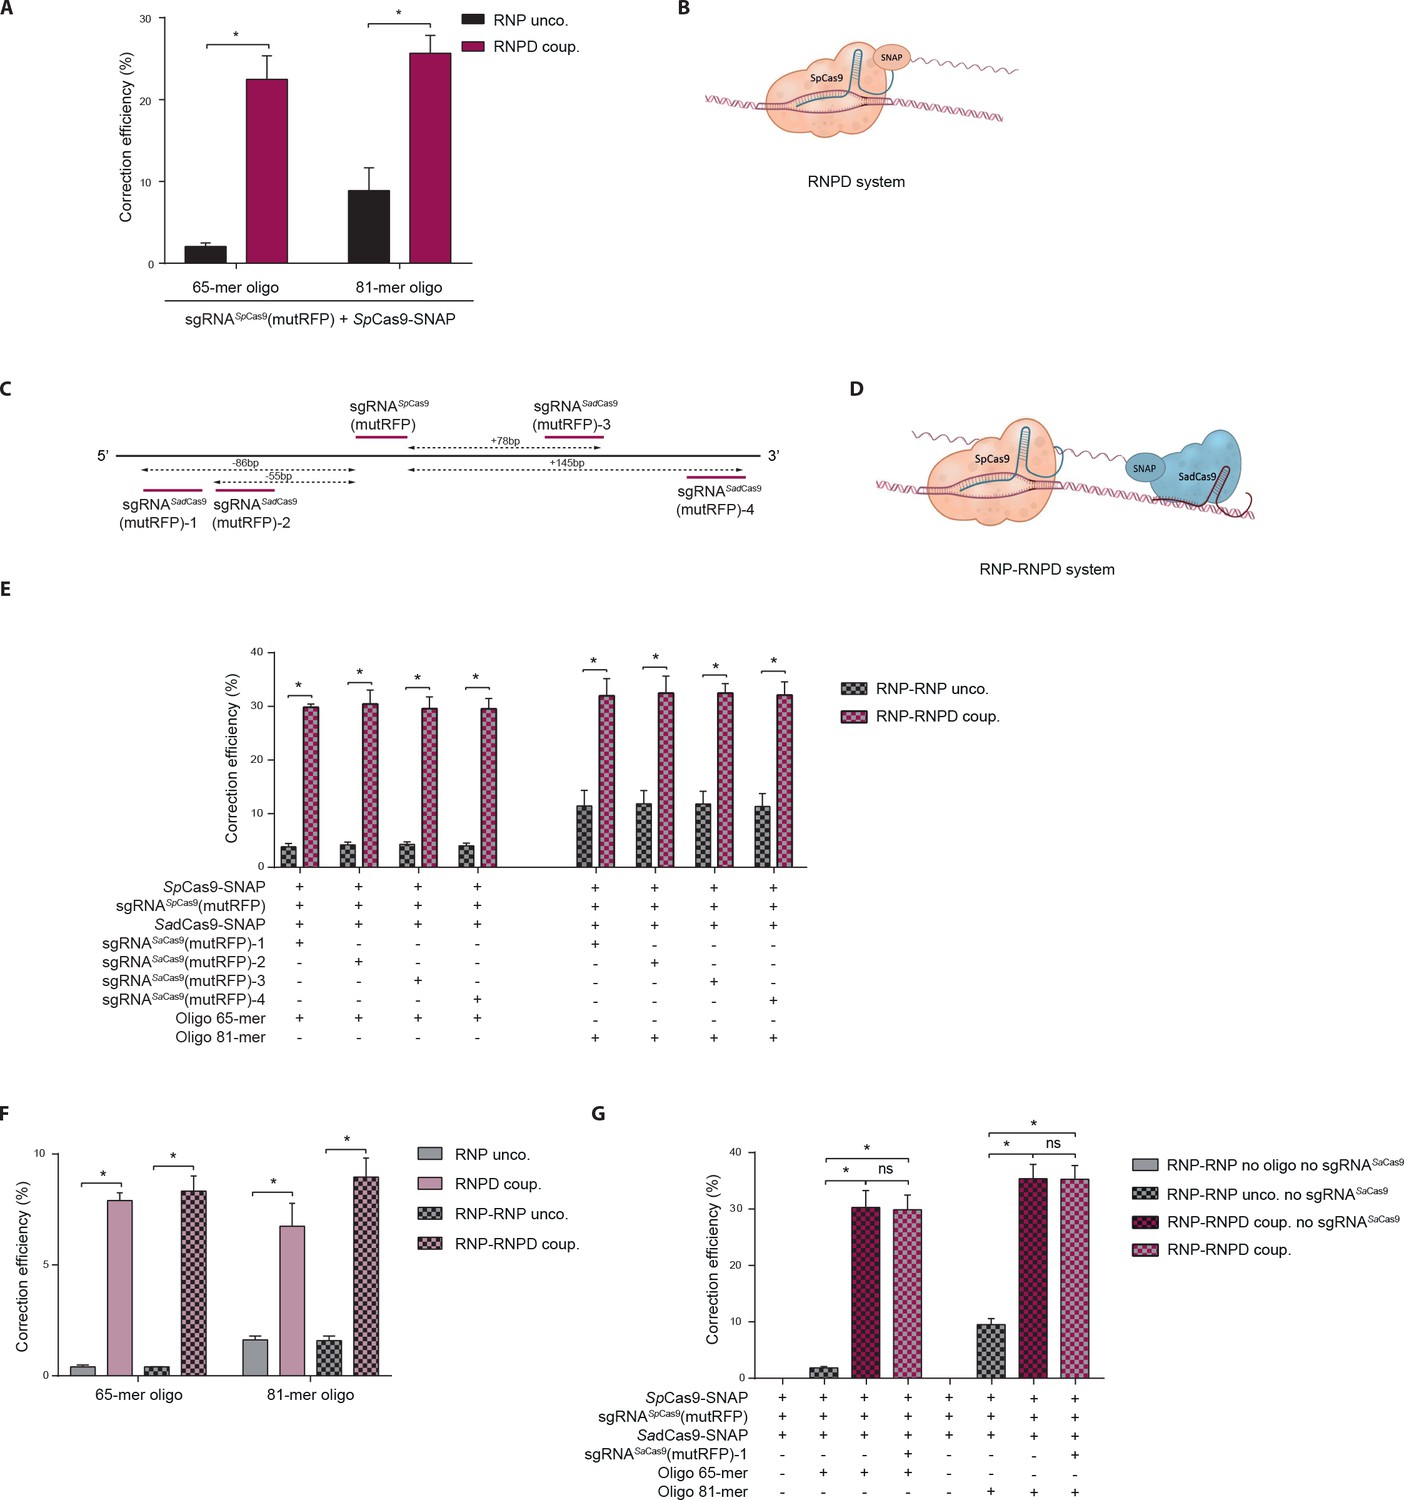
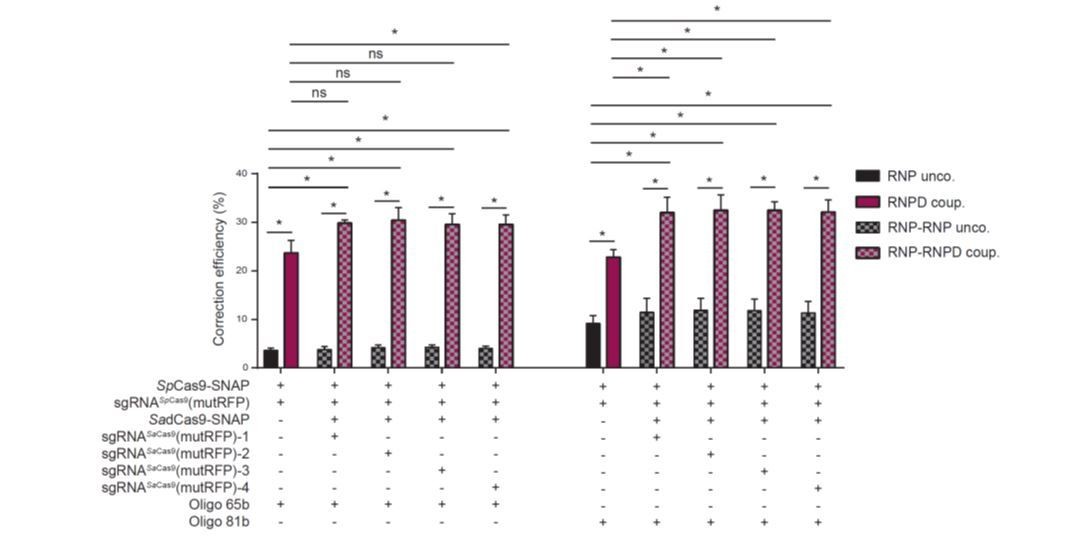
Linking the repair template to the Cas9 RNP complex enhances correction efficiency in a fluorescent reporter cell line.
(a) Comparison between the control Cas9 system (RNP unco.: SpCas9-SNAP plus unlabeled donor oligo) and our novel system (RNPD coup.: SpCas9-SNAP conjugated to BG-labeled donor oligo). Cells were analyzed 5 days after transfection by FACS. Results are presented as correction efficiency (percentage of correction in edited cells). (b) Illustration of our novel Cas9 system, in which the repair template is covalently bound to SpCas9-SNAP (RNPD coup.). (c) Schematic overview of the binding positions of different SadCas9 sgRNAs (sgRNAsSadCas9(mutRFP)-1-4) in comparison to the SpCas9 sgRNA targeting the mutRFP fluorophore (sgRNAsSpCas9(mutRFP)). (d) Illustration of the two-component system, where the repair template is linked to the catalytically inactive SadCas9-SNAP (RNP-RNPD coup.). (e) Comparison between the two-component system (RNP-RNPD coup.: SpCas9-SNAP + SadCas9-SNAP bound to BG-labeled donor oligo) and the corresponding control Cas9 system (RNP-RNP unco.: SpCas9-SNAP + SadCas9-SNAP + unlabeled repair oligo). (f) Transfection of the one component system (grey and pink panels) and two component system (black/grey and black/pink panels) into reporter cells at a 5-time lower concentrations. In the two component system sgRNASadCas9(mutRFP)-3 was used. (g) Comparison of two component systems with and without the sgRNA for the SadCas9 complex. RNP unco. (SpCas9-SNAP + uncoupled oligo + sgRNASpCas9(mutRFP)); RNPD coup. (SpCas9-SNAP-coupled BG-oligo + sgRNASpCas9(mutRFP)); RNP-RNP unco. (SpCas9-SNAP + sgRNASpCas9(mutRFP) + SadCas9-SNAP + uncoupled oligo + sgRNASadCas9(mutRFP)); RNP-RNPD coup. (SpCas9-SNAP + sgRNASpCas9(mutRFP) + SadCas9-SNAP-coupled BG-oligo + sgRNASadCas9(mutRFP)). All values are shown as mean ±s.e.m of biological replicates; *p<0.0332 with n = 3 (f) and n = 4 (a,e,g) (n represents the number of biological replicates). A one-tailed Mann-Whitney test was used for comparisons. Numerical data and the exact p values for all graphs are shown in the Figure 4—source data 1.
-
Figure 4—source data 1
Numerical data and the exact p values for all graphs in Figure 4.
- https://doi.org/10.7554/eLife.33761.011
-
Figure 4—source data 2
Numerical data for all graphs in Figure 4—figure supplement 1.
- https://doi.org/10.7554/eLife.33761.012
-
Figure 4—source data 3
Numerical data and the exact p values for all graphs in Figure 4—figure supplement 2.
- https://doi.org/10.7554/eLife.33761.013
Figure 4—figure supplement 1
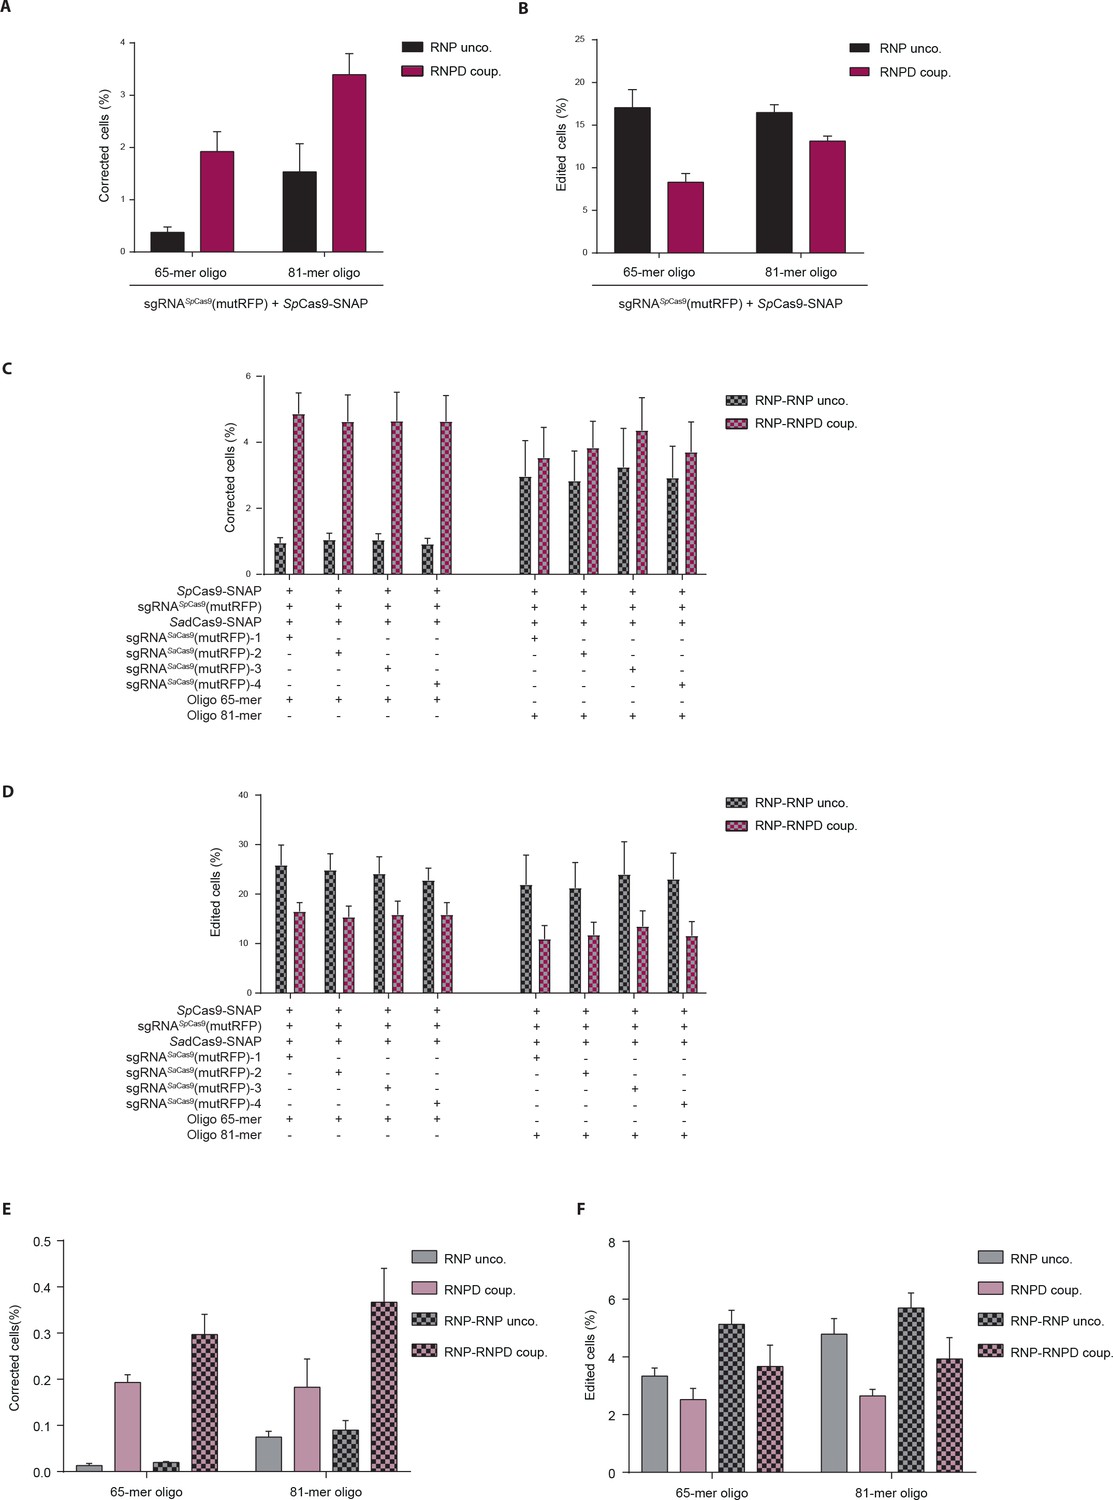
Linking the repair template to the Cas9 RNP complex increases correction rates at the expense of indel formation.
(a–f) Quantification of reporter cells by FACS analysis 5 days after transfection. The absolute percentages of (a,c,e) precisely corrected cells (RFP/GFP double positive cells), and (b,d,f) all edited cells (RFP/GFP double positive cells plus RFP/GFP double negative cells). (a,b) Comparison of RNP uncoupled and RNPD coupled CRISPR complexes. (c,d,e,f) Comparison of RNP uncoupled, RNPD coupled, RNP-RNPD uncoupled and RNP-RNPD coupled CRISPR complexes. (e,f) Complexes were transfected at 5-fold lower concentrations. All values are shown as mean ±s.e.m of biological replicates. A one-tailed Mann-Whitney test was used for comparisons. Numerical data and the exact p values for all graphs are shown in the Figure 4—source data 2.
Figure 4—figure supplement 2
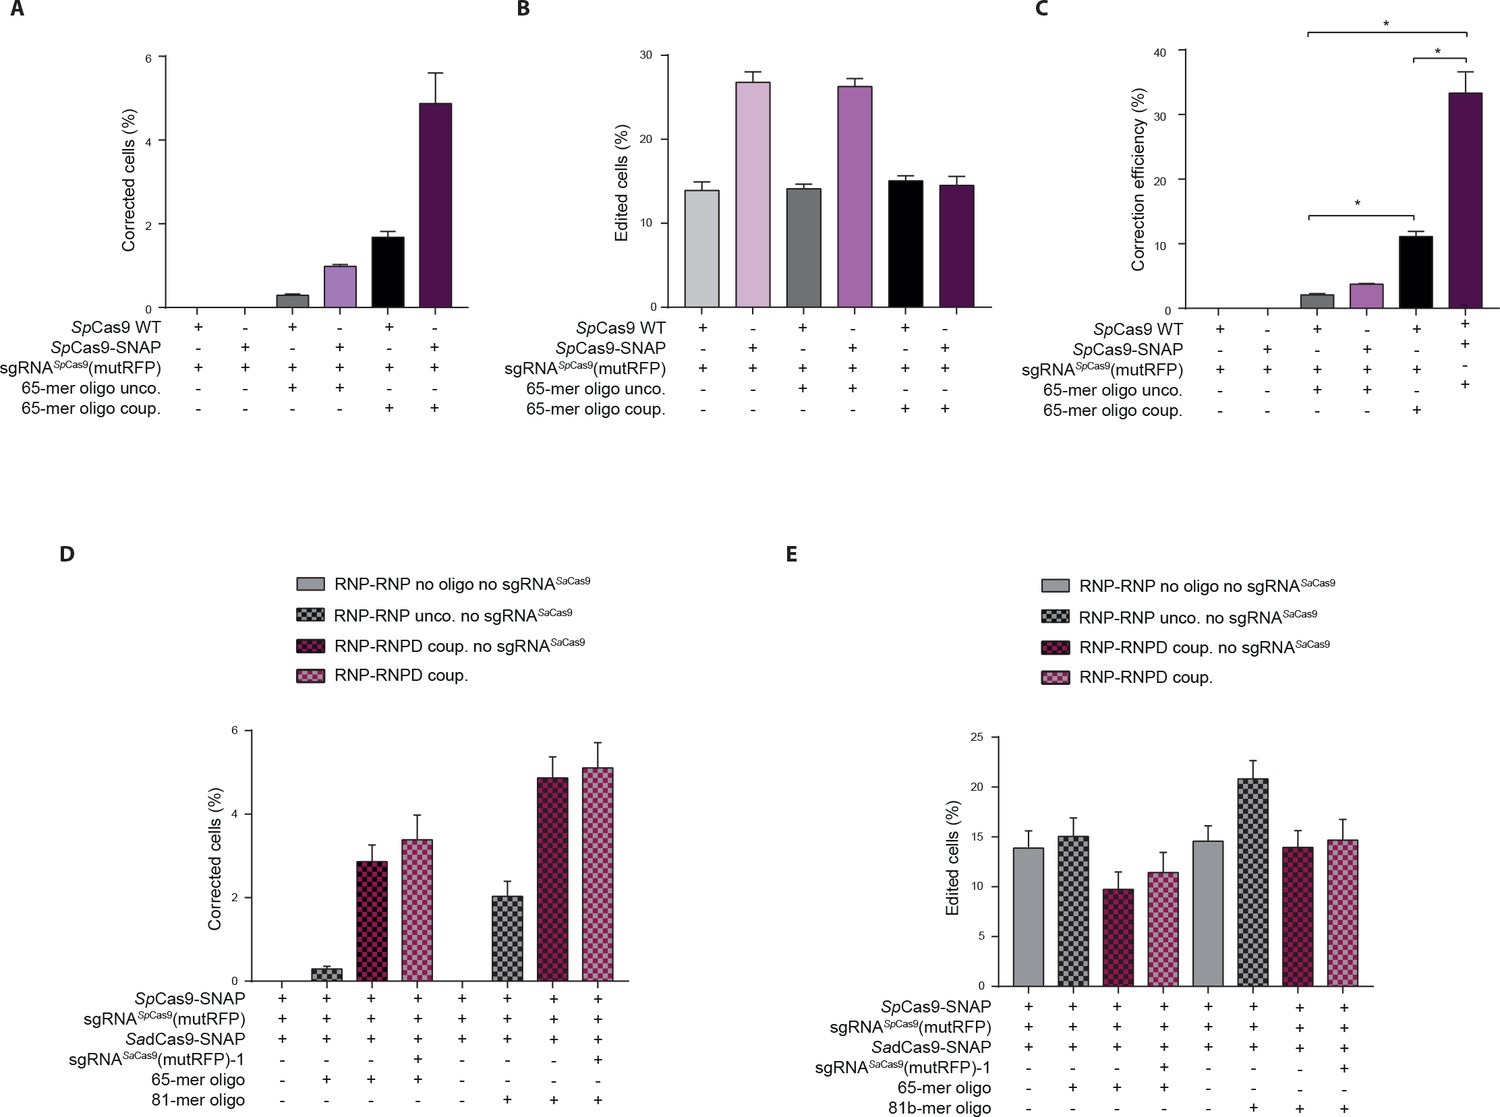
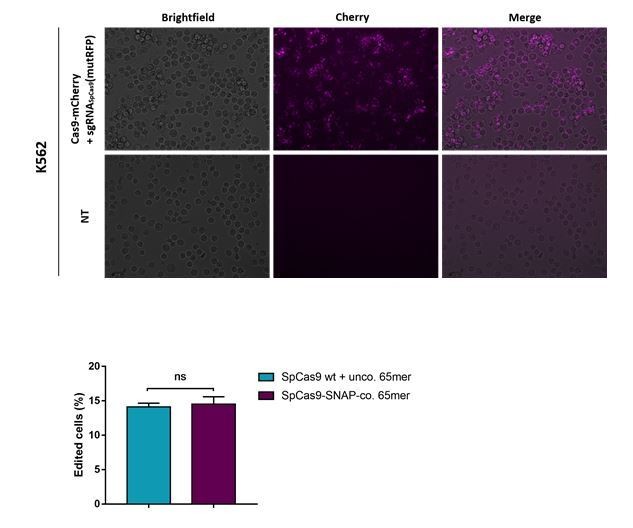
Mechanistic insights into enhanced correction rates.
(a–e) Quantification of reporter cells by FACS analysis 5 days after transfection. The absolute percentages of precisely corrected cells (RFP/GFP double positive cells) (a,d), all edited cells (RFP/GFP double positive cells plus RFP/GFP double negative cells) (b,e) and the correction efficiency (the percentage of precisely corrected of edited cells) are shown (c). (a–c) Comparison of SpCas9 WT and SpCas9-SNAP systems without an oligo and with either unco. or BG-coup. 65-mer oligos. (d,e) Comparison of two component systems with and without the sgRNA for the SadCas9 complex. All values are shown as mean ±s.e.m of biological replicates. (c) *p<0.0332 with n = 4 (n represents the number of biological replicates). A one-tailed Mann-Whitney test was used for comparisons. Numerical data and the exact p values for all graphs are shown in the Figure 4—source data 3.
Figure 5
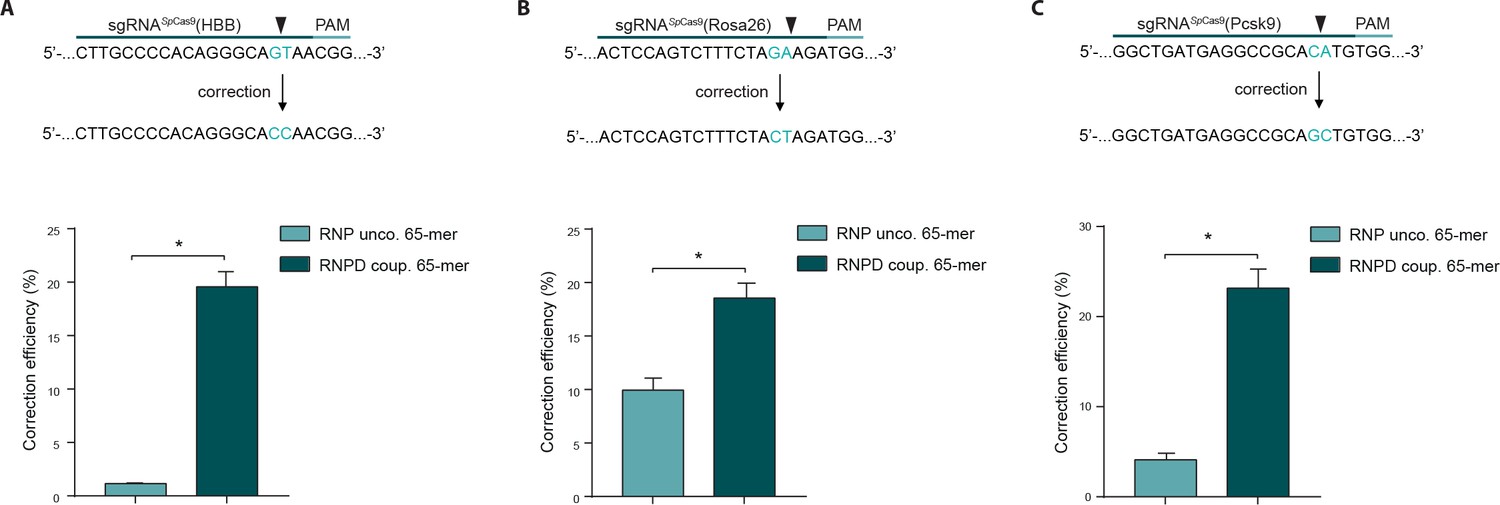
Linking the repair template to the Cas9 RNP complex enhances correction efficiency at endogenous loci.
(a,b,c) Upper panels: Schematic overview of the target genomic regions of the Streptococcus pyogenes gRNAs. Black arrow indicates the introduced DSB site. The nucleotides that are exchanged in case of precise repair are shown in blue. Lower panels: NGS data quantification: Correction efficiency of the control Cas9 system (RNP unco.: SpCas9-SNAP plus unlabeled donor oligo) compared to our novel system (RNPD coup.: SpCas9-SNAP bound to BG-labeled donor oligo) is shown. (a) The HBB locus was targeted in a K562 cell line. The (b) Rosa26 and (c) Pcsk9 loci were targeted in mouse ESCs. All values are shown as mean ±s.e.m of biological replicates; *p<0.0332 with n = 4 (a) and n = 3 (b,c) (n represents the number of biological replicates). A one-tailed Mann-Whitney test was used for comparisons. Allele plots, variant count tables and categorized variant count tables for these loci are available as Supplementary file 2–4. Numerical data and the exact p values for all graphs are shown in the Figure 5—source data 1.
-
Figure 5—source data 1
Numerical data and the exact p values for all graphs in Figure 5.
- https://doi.org/10.7554/eLife.33761.015
Figure 6
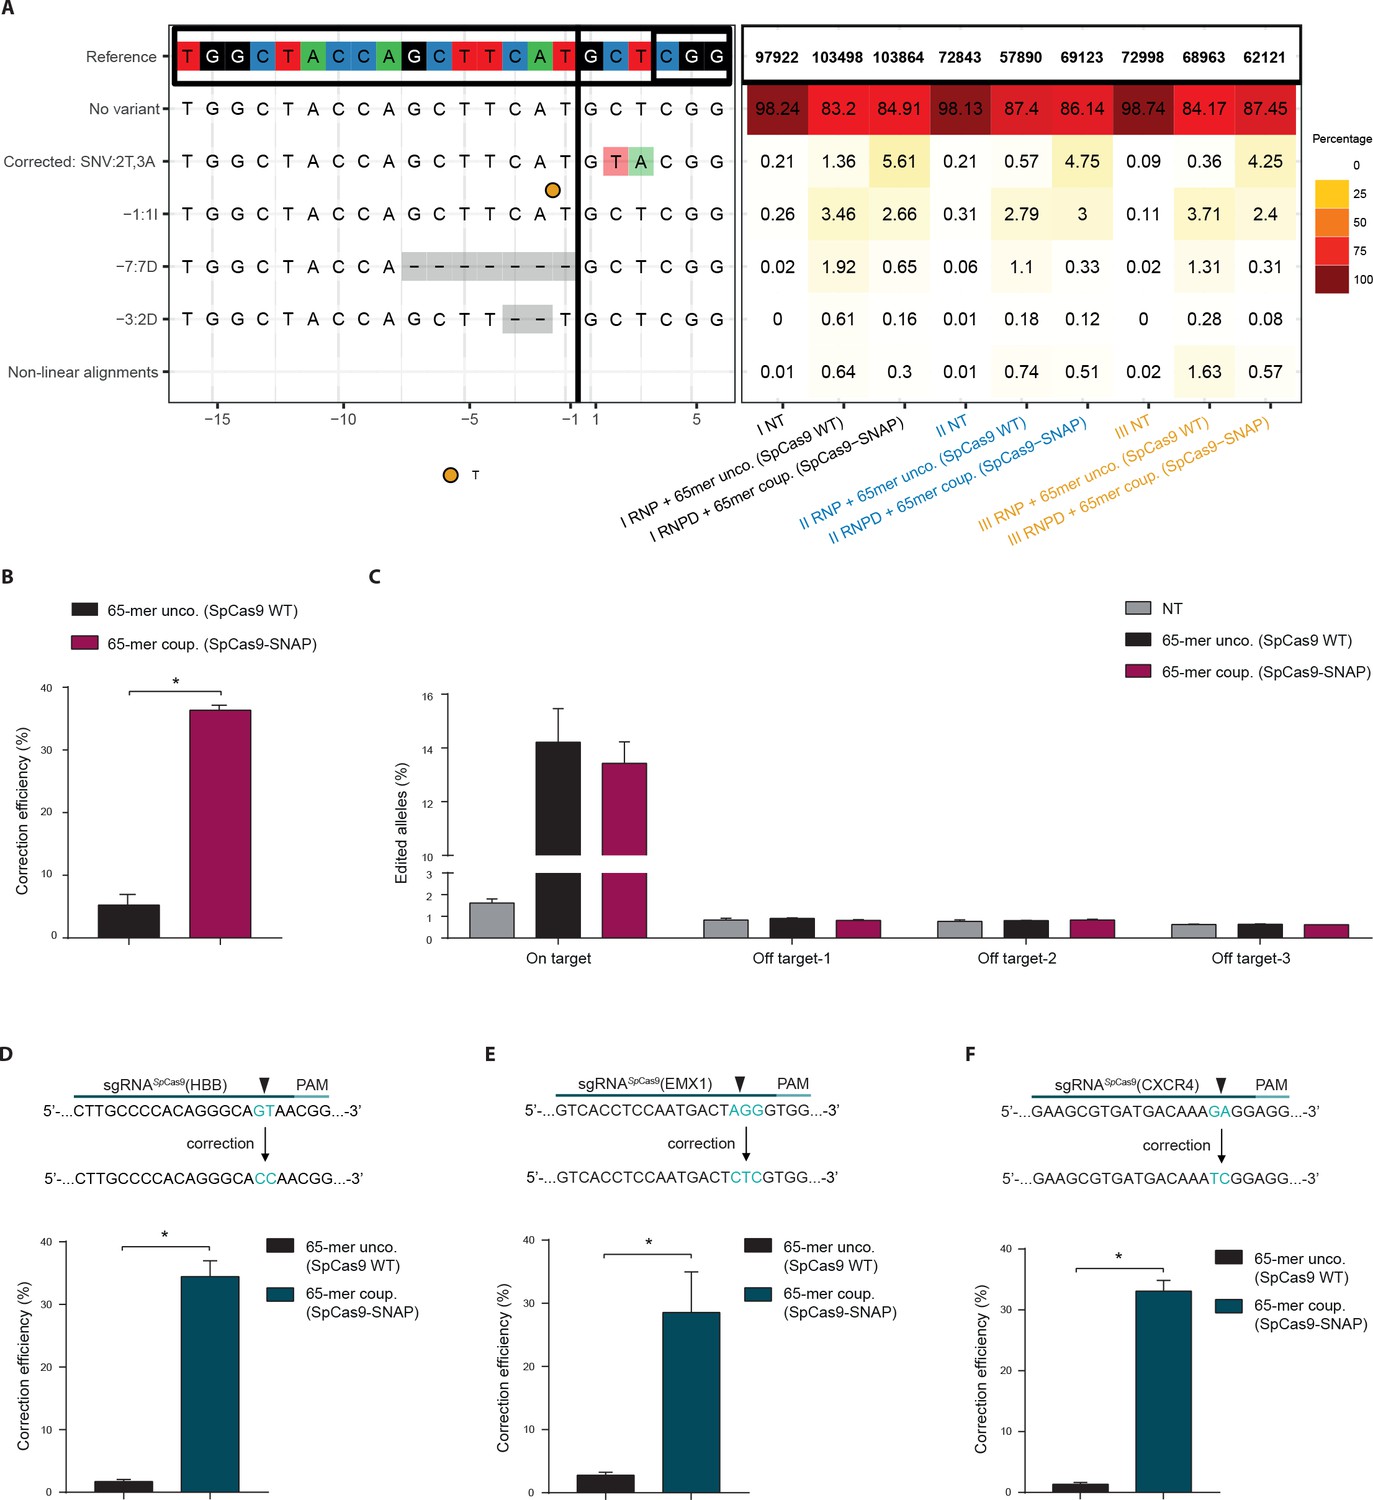
Direct comparison of the Cas9 RNPD system to the classical Cas9 complex.
Classical Cas9 system (wild type SpCas9 plus unlabeled donor oligo); Our novel RNPD system (SpCas9-SNAP conjugated to BG-labeled donor oligo). (a) Targeting of the reporter locus in HEK293T cells. Illustration of the most frequent variants found by NGS in untreated samples (NT), in samples transfected with the classical Cas9 system (65-mer unco. (SpCas9 WT)), and in our engineered system (65-mer coup. (SpCas9-SNAP)). Alleles with a frequency above 0.5% in any of the nine samples are shown. For alleles with lower frequencies see Supplementary file 3. Abbreviations: Insertion (I), Deletion (D), Single nucleotide variant (SNV). Different colours in the x-axis indicate the three experimental replicates. A detailed description of the plot labels can be found in the Supplementary File 2 legend. (b,d,e,f) NGS data quantification of the (b) reporter locus, (d) HBB locus, (e) EMX1, and (f) CXCR4 locus targeted in HEK293T cells. In (a,b,c) the mutRFP sgRNA (see Figure 2b) was used. (c) Off target analysis for sgRNASpCas9(mutRFP): the percentage of edited alleles detected using NGS in untreated samples, in samples transfected with the classical Cas9 system, and in our engineered system. Information on the off target loci can be found in Supplementary file 1 – Supplementary Table 1. (d,e,f) Upper panels: Schematic overview of the target genomic regions of the gRNAs. Black arrow indicates the introduced DSB site. The nucleotides that are exchanged in case of precise repair are shown in blue. Lower panels: NGS data quantification. Correction efficiency of the classical Cas9 system compared to our novel system is shown. All values are shown as mean ±s.e.m of biological replicates. *p<0.0332 with n = 3 (b,c) and n = 4 (d,e,f) (n represents the number of biological replicates). A one-tailed Mann-Whitney test was used for comparisons. Allele plots, complete variant count tables and categorized variant count tables for these loci are available as Supplementary file 2–4. Numerical data and the exact p values for all graphs are shown in the Figure 6—source data 1.
-
Figure 6—source data 1
Numerical data and the exact p values for all graphs in Figure 6.
- https://doi.org/10.7554/eLife.33761.017
Author response image 1

Author response image 2
Author response image 3
Author response image 4
Author response image 5
Tables
Key resources table
| Reagent type (species) or resource | Designation | Source or reference | Identifiers | Additional information |
|---|---|---|---|---|
| Recombinant protein (Streptococcus pyogenes) | SpCas9-SNAP | This paper | Schwank and Jinek lab | |
| Recombinant protein (Staphylococcus aureus) | SadCas9-SNAP | This paper | Schwank and Jinek lab | |
| Genetic reagent | NH2-modified oligo | Integrated DNA Technologies | - | Custom DNA oligos/ '5 C6 NH2 modif. |
| Chemical compound | BG-GLA-NHS | New England Biolabs | ID_NEB:S9151S |
Additional files
-
Supplementary file 1
This file contains Supplementary Tables 1-6 (referenced in the Materials and methods).
Supplementary Table 1 contains the guide protospacer sequences used in this study. Supplementary Table 2 contains the primer sequences for IVT of guides used in this study. Supplementary Table 3 contains the crRNA sequences of guides used in this study. Supplementary Table 4 contains the repair oligo sequences used in this study. The nucleotide substitution introduced by precise correction using repair template is shown in lowercase. Supplementary Table 5 contains the NGS primers used in this study. The target specific part of the primer is shown in uppercase, and the Illumina adapter is shown in lowercase. Supplementary Table 6 contains the plasmids used in this study.
- https://doi.org/10.7554/eLife.33761.018
-
Supplementary file 2
This file contains the allele plots for the loci analyzed by NGS.
Allele plots show insertion/deletion variant alleles with frequency of at least 0.01%, and non-indel variants with frequency of at least 0.05% in any sample. When more than 50 variants passed these criteria, the top 50 alleles according to their maximum frequency in any sample are shown. From top to bottom, the consensus sequences for variant alleles are displayed in the order: no variant, precisely corrected allele, insertions (I) and deletions (D), single nucleotide variants (SNVs) and non-linear alignments. SNVs are only shown for non-indel variants and appear in color. In the y-axis labels, nucleotide numbers indicate the distance to the cut site. Variants are labelled with respect to the leftmost base. For example −5:9D is a 9 base pair deletion starting 5 bases upstream of the cut site. SNV labels show the bases that differ between the non-indel reads and the reference. The most common inserted sequences with less than 20 base pairs are shown in full in the legend. For longer and less frequent insertions the length is indicated. In the heatmap at right, the header shows the number of merged read pairs with alignments spanning the guide sequence. The x-axis is coloured according to experimental replicate.
- https://doi.org/10.7554/eLife.33761.019
-
Supplementary file 3
This file contains complete variant count tables for the genomic loci analyzed by NGS.
Variants are labeled as in Supplementary file 2.
- https://doi.org/10.7554/eLife.33761.020
-
Supplementary file 4
This file contains categorized variant count tables for the genomic loci analyzed by NGS.
Reads were classified as ‘indel’ if any insertions or deletions were present in the guide region, as ‘no variant’ if they perfectly matched the guide reference, (for on-target loci) ‘corrected’ if the targeted bases were changed as expected, and ‘mismatch’ if any other nucleotide changes were present.
- https://doi.org/10.7554/eLife.33761.021
-
Transparent reporting form
- https://doi.org/10.7554/eLife.33761.022
Download links
A two-part list of links to download the article, or parts of the article, in various formats.
Downloads (link to download the article as PDF)
Open citations (links to open the citations from this article in various online reference manager services)
Cite this article (links to download the citations from this article in formats compatible with various reference manager tools)
Covalent linkage of the DNA repair template to the CRISPR-Cas9 nuclease enhances homology-directed repair
eLife 7:e33761.
https://doi.org/10.7554/eLife.33761


