Personality links with lifespan in chimpanzees
- School of Philosophy, Psychology and Language Sciences, The University of Edinburgh, United Kingdom
- Scottish Primate Research Group, United Kingdom
- Centre for Cognitive Ageing and Cognitive Epidemiology, United Kingdom
- Georgia State University, United States
- Yerkes National Primate Research Center, United States
- National Zoological Park, Smithsonian Institution, United States
- University of Stirling, United Kingdom
- Kyoto University, Japan
- National Institute for Environmental Studies, Japan
- Institute for Advanced Study, Kyoto University, Japan
- Japan Monkey Centre, Japan
- University of Arizona, United States
- Lincoln Park Zoo, United States
Figures
Figure 1

Survival curves of captive and wild chimpanzees.
Lines indicate survival probability of each group over the lifespan. The solid lines represent the captive population used in this study and the dashed line corresponds to a wild group (Bronikowski et al., 2011). The shaded areas indicated the 95% confidence region for reach group.
Figure 2 with 6 supplements
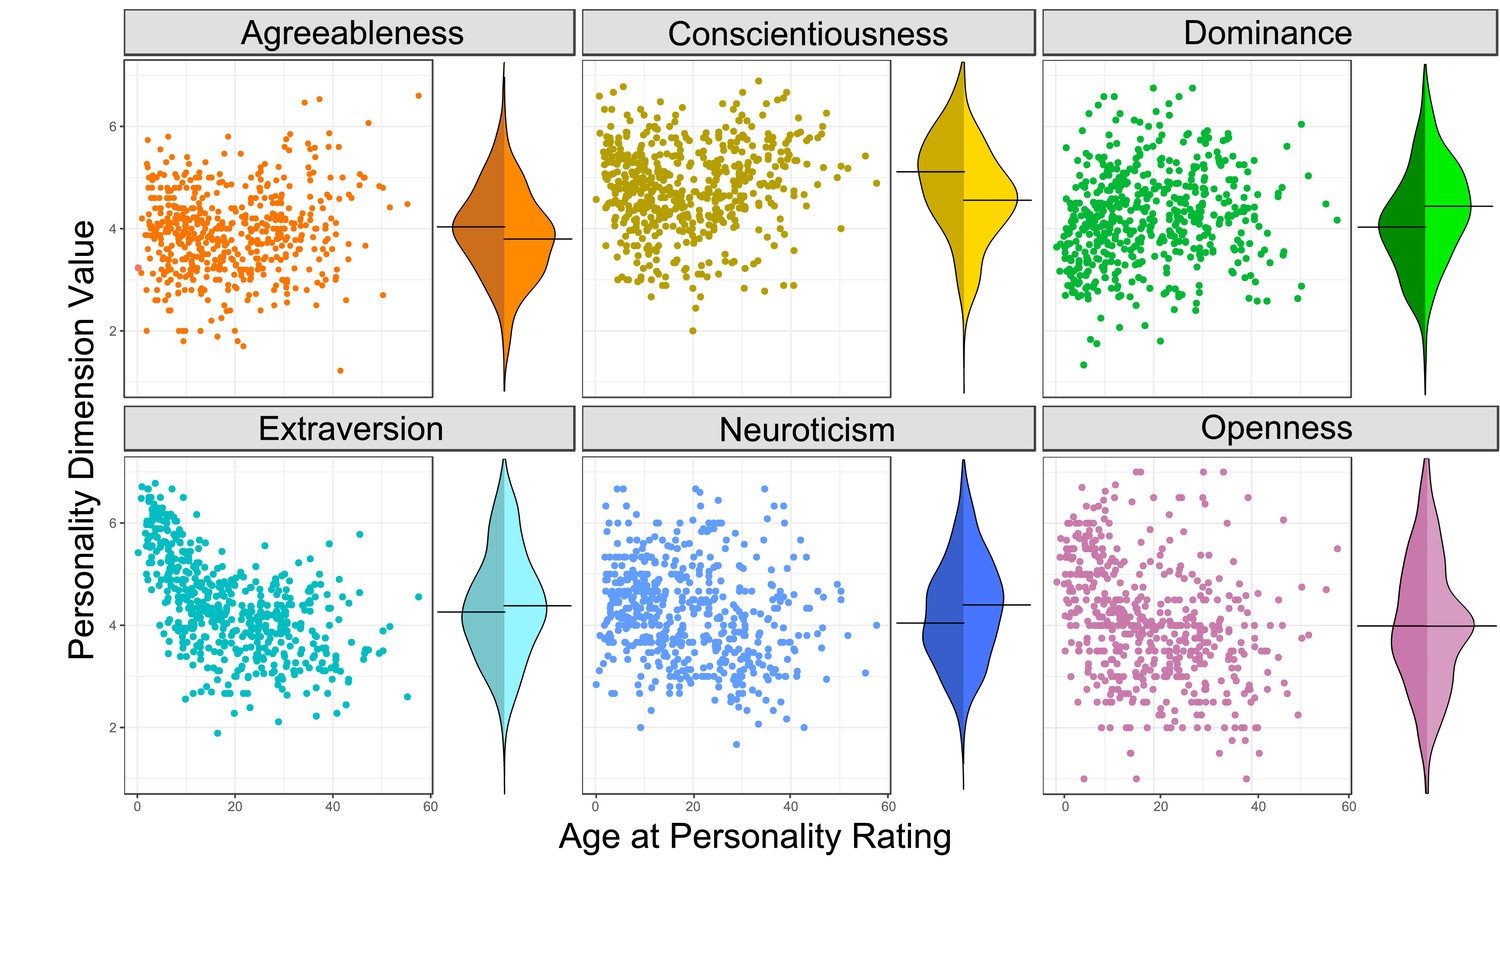
Personality’s relationship with age and sex.
Each panel shows the personality scores of a specific dimension for all individuals in a scatterplot against age on the left, and on the right with bean plots showing the distribution of scores split by sex (females are on the left, males on the right). Relationships between age and each personality dimensions are illustrated in the figure supplements.
Figure 2—figure supplement 1
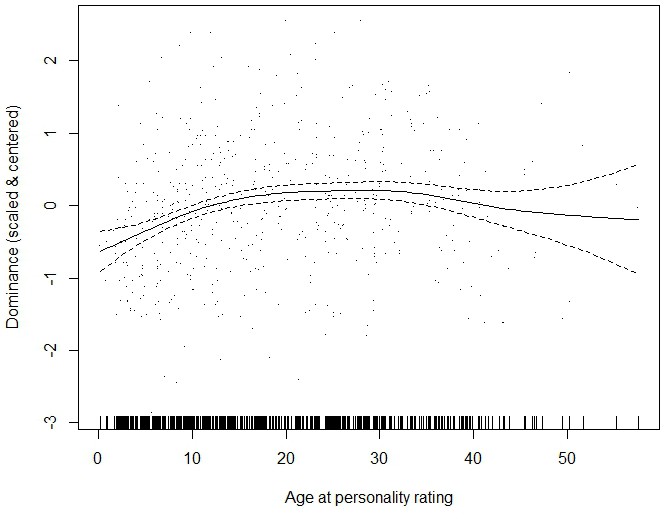
Generalized additive model of dominance and age at personality rating.
The carpet and scatter plot present the distribution of observations over which the best fit smoothed regression line is plotted with the 95% confidence region.
Figure 2—figure supplement 2
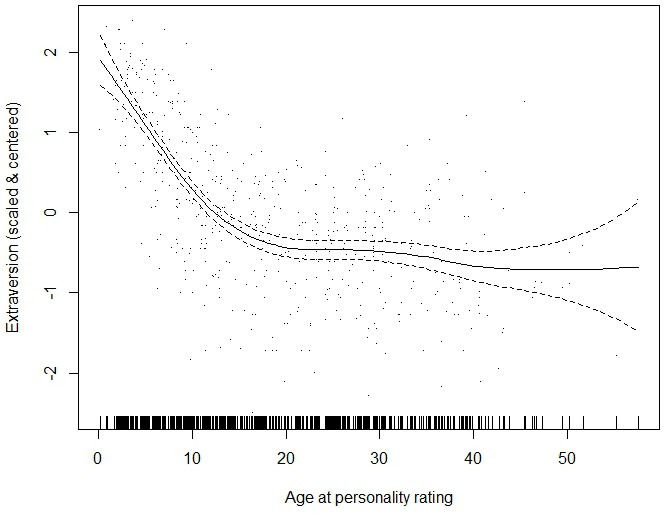
Generalized additive model of extraversion and age at personality rating.
The carpet and scatter plot present the distribution of observations over which the best fit smoothed regression line is plotted with the 95% confidence region.
Figure 2—figure supplement 3
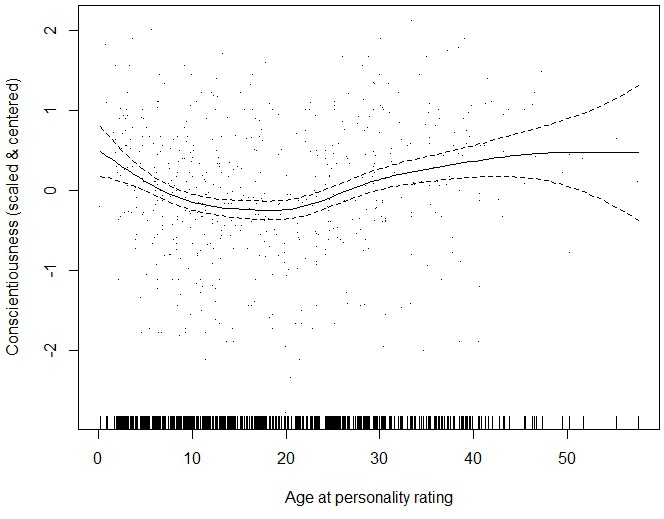
Generalized additive model of conscientiousness and age at personality rating.
The carpet and scatter plot present the distribution of observations over which the best fit smoothed regression line is plotted with the 95% confidence region.
Figure 2—figure supplement 4

Generalized additive model of agreeableness and age at personality rating.
The carpet and scatter plot present the distribution of observations over which the best fit smoothed regression line is plotted with the 95% confidence region.
Figure 2—figure supplement 5
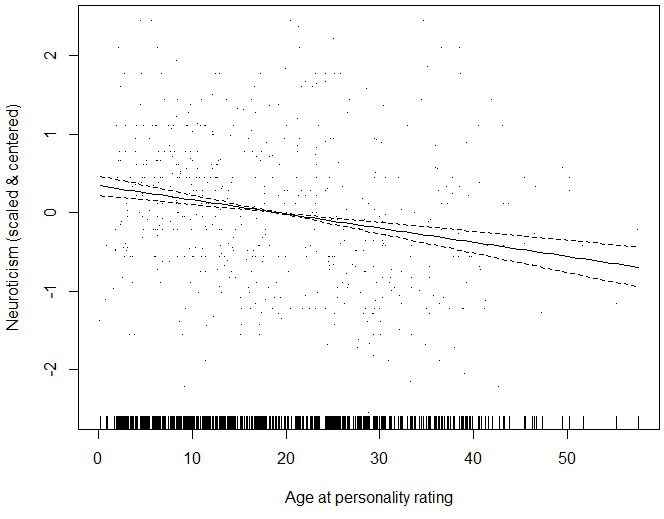
Generalized additive model of neuroticism and age at personality rating.
The carpet and scatter plot present the distribution of observations over which the best fit smoothed regression line is plotted with the 95% confidence region.
Figure 2—figure supplement 6
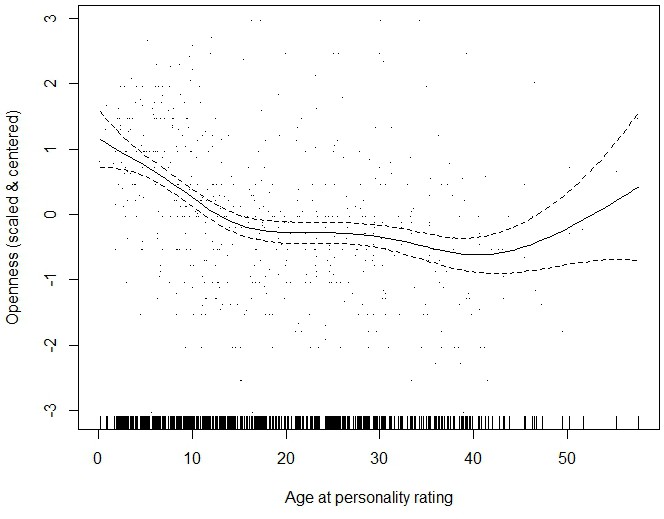
Generalized additive model of openness and age at personality rating.
The carpet and scatter plot present the distribution of observations over which the best fit smoothed regression line is plotted with the 95% confidence region.
Figure 3
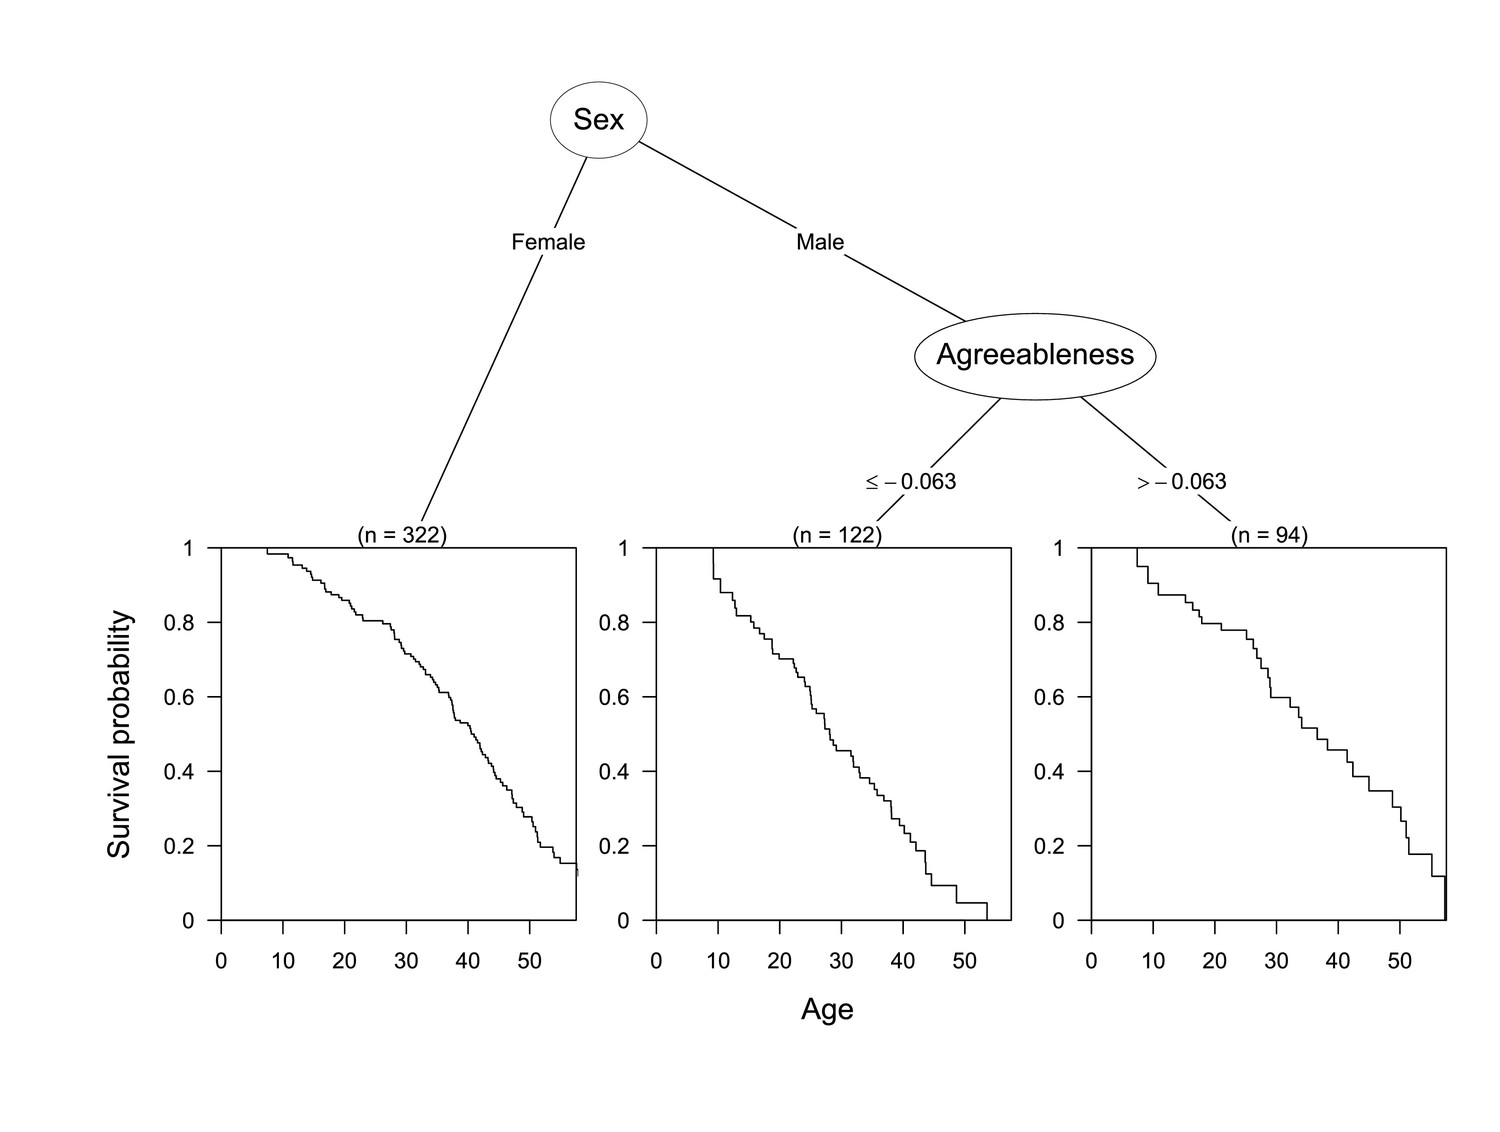
Conditional inference tree diagram indicating variables influencing survival.
Bottom panes indicate the survival curves of and number of chimpanzees in each sub-group. Sub-groups were split based on the growth of the tree and decision criteria are indicated below each node. Splits in numeric variables (e.g. agreeableness) are by standard deviations.
Tables
Table 1
Weighted survival model estimates of personality and demographic variables related to longevity.
Values are model averaged parameter estimates and unconditional confidence intervals calculated from estimates shown in Supplementary Table 4.
| Unadjusted | Adjusted for age | |||
|---|---|---|---|---|
| Variable | Hazard Ratio | 95% C.I. | Hazard Ratio | 95% C.I. |
| Male (n = 216) | ||||
| Wild-born | 1.40 | [0.68, 2.90] | 1.35 | [0.66, 2.74] |
| Agreeableness | 0.66 | [0.49, 0.89] | 0.61 | [0.42, 0.89] |
| Dominance | 0.98 | [0.74, 1.29] | 0.99 | [0.72, 1.37] |
| Extraversion | 1.04 | [0.71, 1.51] | 1.01 | [0.65, 1.57] |
| Conscientiousness | 1.11 | [0.78, 1.58] | 1.19 | [0.79, 1.81] |
| Neuroticism | 0.91 | [0.66, 1.25] | 0.93 | [0.66, 1.31] |
| Openness | 1.09 | [0.76, 1.55] | 1.06 | [0.78, 1.46] |
| Female (n = 322) | ||||
| Wild-born | 1.16 | [0.72, 1.85] | 1.17 | [0.73, 1.87] |
| Agreeableness | 1.12 | [0.83, 1.50] | 1.24 | [0.84, 1.82] |
| Dominance | 1.04 | [0.83, 1.30] | 1.05 | [0.82, 1.35] |
| Extraversion | 1.15 | [0.80, 1.67] | 1.02 | [0.66, 1.57] |
| Conscientiousness | 1.01 | [0.76, 1.34] | 0.98 | [0.70, 1.38] |
| Neuroticism | 0.93 | [0.73, 1.17] | 0.93 | [0.72, 1.19] |
| Openness | 0.77 | [0.59, 0.99] | 0.82 | [0.66, 1.02] |
Additional files
-
Supplementary file 1
Containing Tables S1 – S4.
- https://doi.org/10.7554/eLife.33781.013
-
Source code 1
R code for data processing, plotting, and analyses.
- https://doi.org/10.7554/eLife.33781.014
-
Transparent reporting form
- https://doi.org/10.7554/eLife.33781.015
Download links
A two-part list of links to download the article, or parts of the article, in various formats.
Downloads (link to download the article as PDF)
Open citations (links to open the citations from this article in various online reference manager services)
Cite this article (links to download the citations from this article in formats compatible with various reference manager tools)
Personality links with lifespan in chimpanzees
eLife 7:e33781.
https://doi.org/10.7554/eLife.33781


