Segmentation of the zebrafish axial skeleton relies on notochord sheath cells and not on the segmentation clock
- WWU Münster, Germany
- CiM Cluster of Excellence (EXC-1003-CiM), Germany
- Hubrecht Institute-KNAW & UMC Utrecht, Netherlands
- The Francis Crick Institute, United Kingdom
- Instituto de Investigación en Biomedicina de Buenos Aires (IBioBA), CONICET–Partner Institute of the Max Planck Society, Argentina
- FCEyN, UBA, Ciudad Universitaria, Argentina
- Max Planck Institute for Molecular Physiology, Germany
- University College London, United Kingdom
- École Polytechnique Fédérale de Lausanne (EPFL), Switzerland
Figures
Figure 1 with 3 supplements
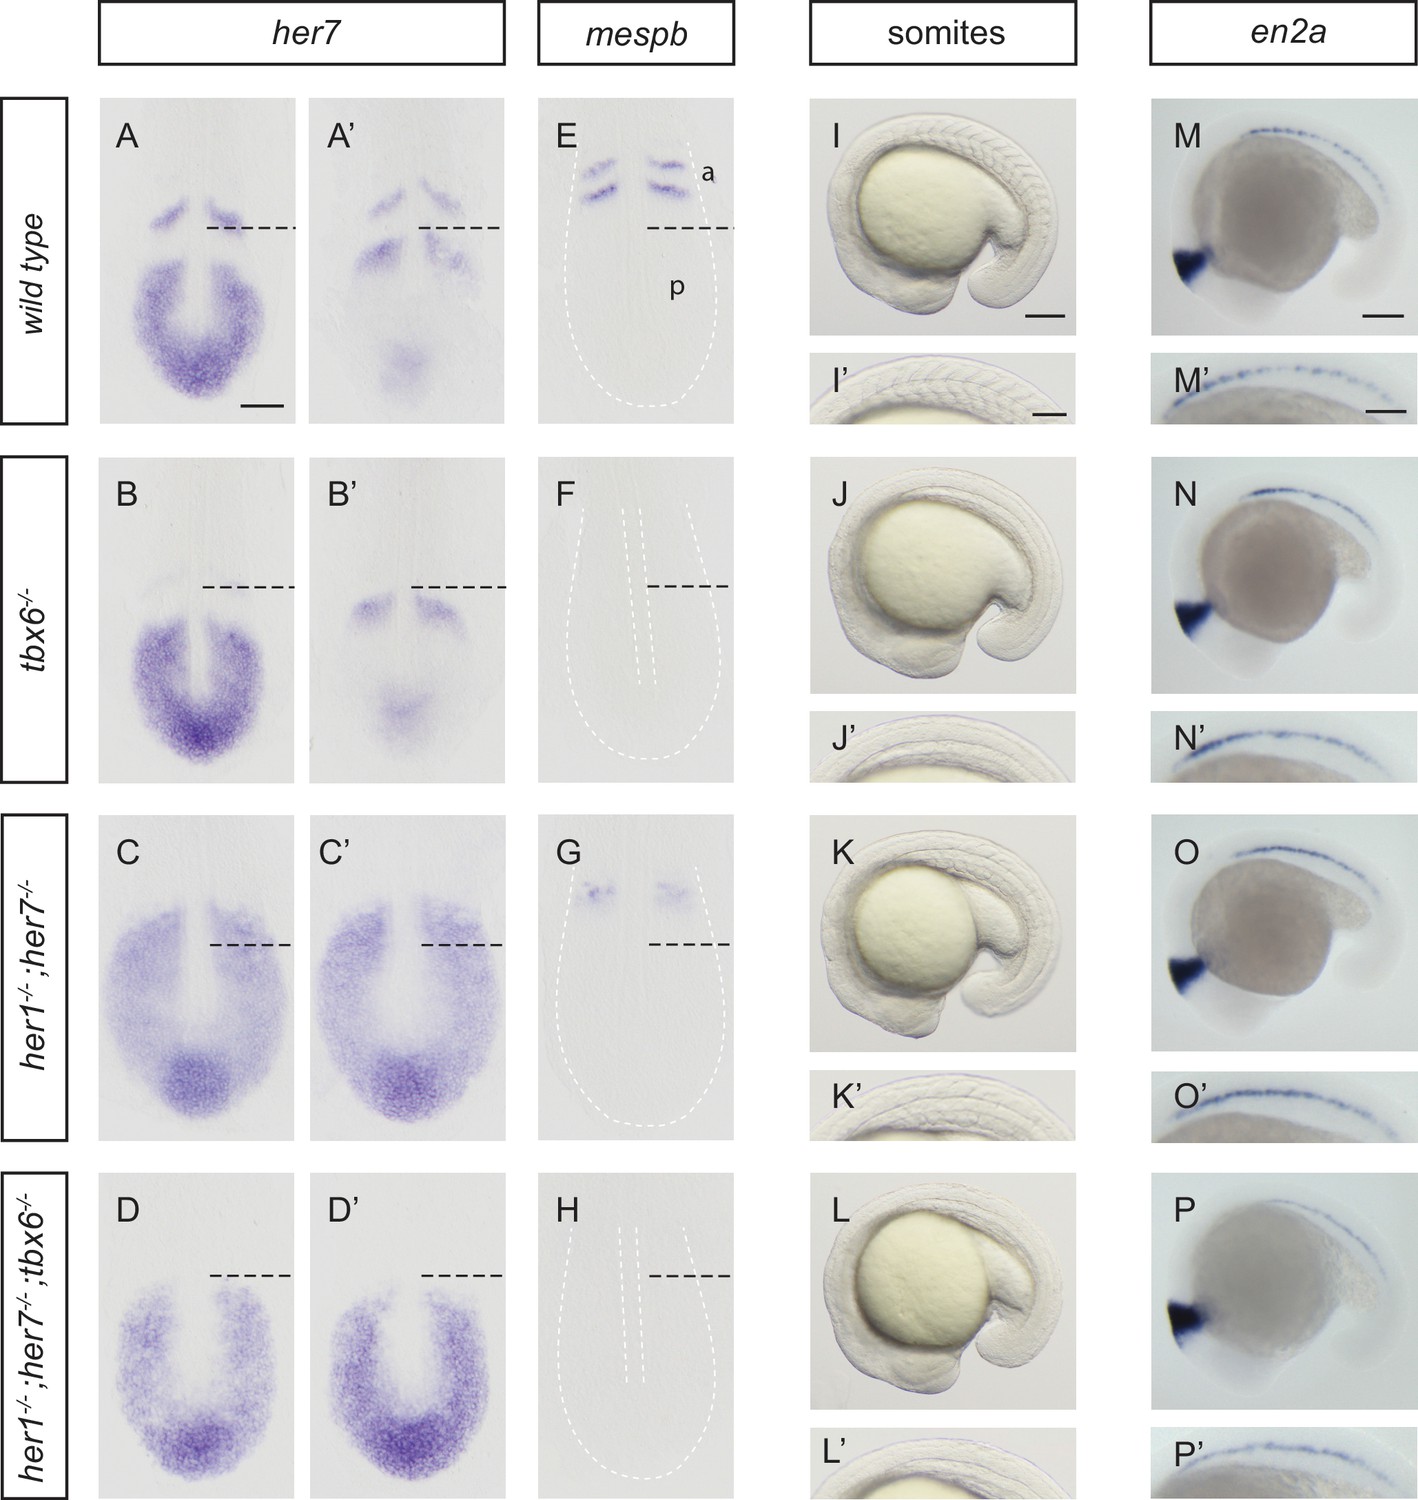
Disruption of the segmentation clock in tbx6, her1;her7 and her1;her7;tbx6 mutants.
(A–D’) In situ hybridization for segmentation clock marker her7. (B and B') her7 oscillates in the posterior PSM of tbx6−/−, but does not oscillate in her1−/−;her7−/− (C and C´) or her1−/−;her7−/−;tbx6−/− (D and D`). (E–H) In situ hybridization for segmental output marker mespb. mespb is not expressed in tbx6−/− (F) or her1−/−;her7−/−;tbx6−/− (H), but is weakly expressed in her1−/−;her7−/−, albeit not in segmental stripes (G). (I–L’) Somite boundaries in the paraxial mesoderm. In tbx6−/− (J), her1−/−;her7−/− (K) and her1−/−;her7−/−;tbx6−/− (L) mutants, boundaries lose periodic order. (M–P’) Spatial distribution of muscle pioneers marked by in situ hybridization with en2a. In tbx6−/− (N), her1−/−;her7−/− (O) and her1−/−;her7−/−;tbx6−/− (P) muscle pioneers lose segmental pattern. A-H’ are dorsal views of 13.5 hpf (10 somites) embryos, I-P' are lateral views of 18–19.5 hpf (18–20 somites) embryos. a – anterior, p – posterior. Scale bar in A is 100 µm and applies to A-G. Scale bar in I is 150 µm, applies to I-L and in I’ is 100 µm, applies to I’-L’. Scale bars in M and M’ are 150 µm and 100 µm respectively, and apply to M-P and M’-P’ respectively.
Figure 1—figure supplement 1
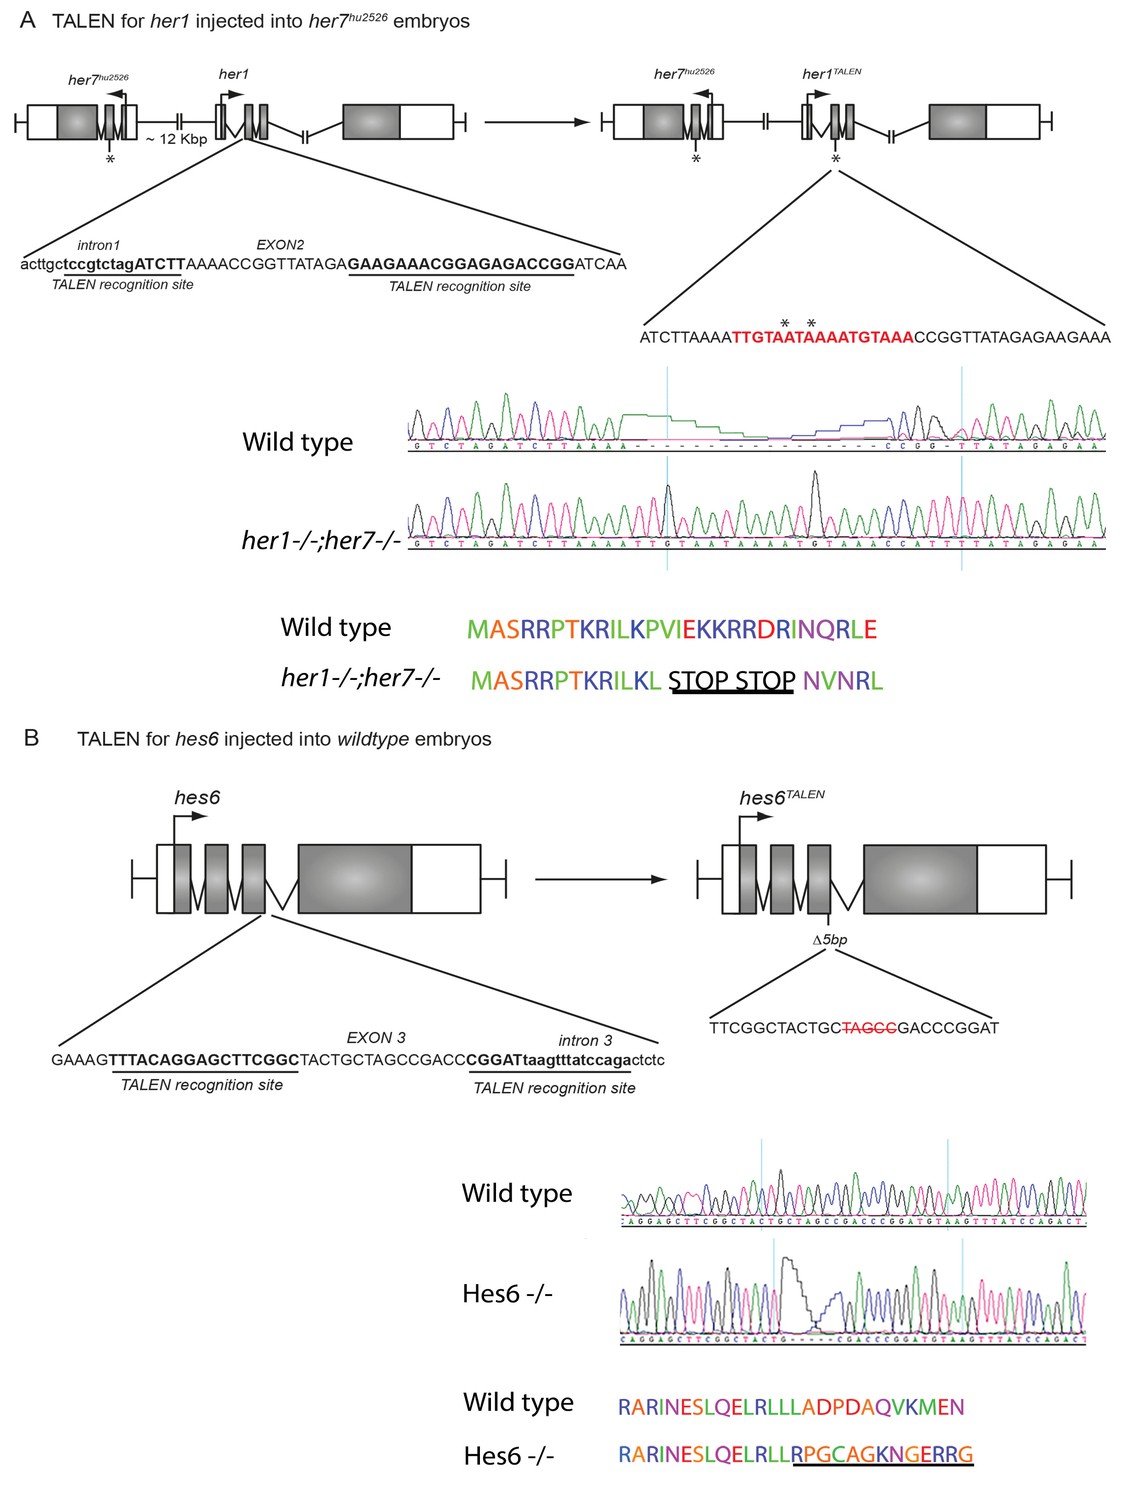
Generating novel her1;her7 and hes6 mutants by TALEN.
(A) A TALEN construct directed against her1 was injected in the her7 mutant resulting in an insertion of 17 bp (red sequence) and the creation of 2 consecutive stop codons in exon 2 of her1 (*=stop codons). (B) The novel hes6 mutation was created by injection of a TALEN targeted against hes6 in wild type. The new allele has a five base pair deletion in exon 3.
Figure 1—figure supplement 2
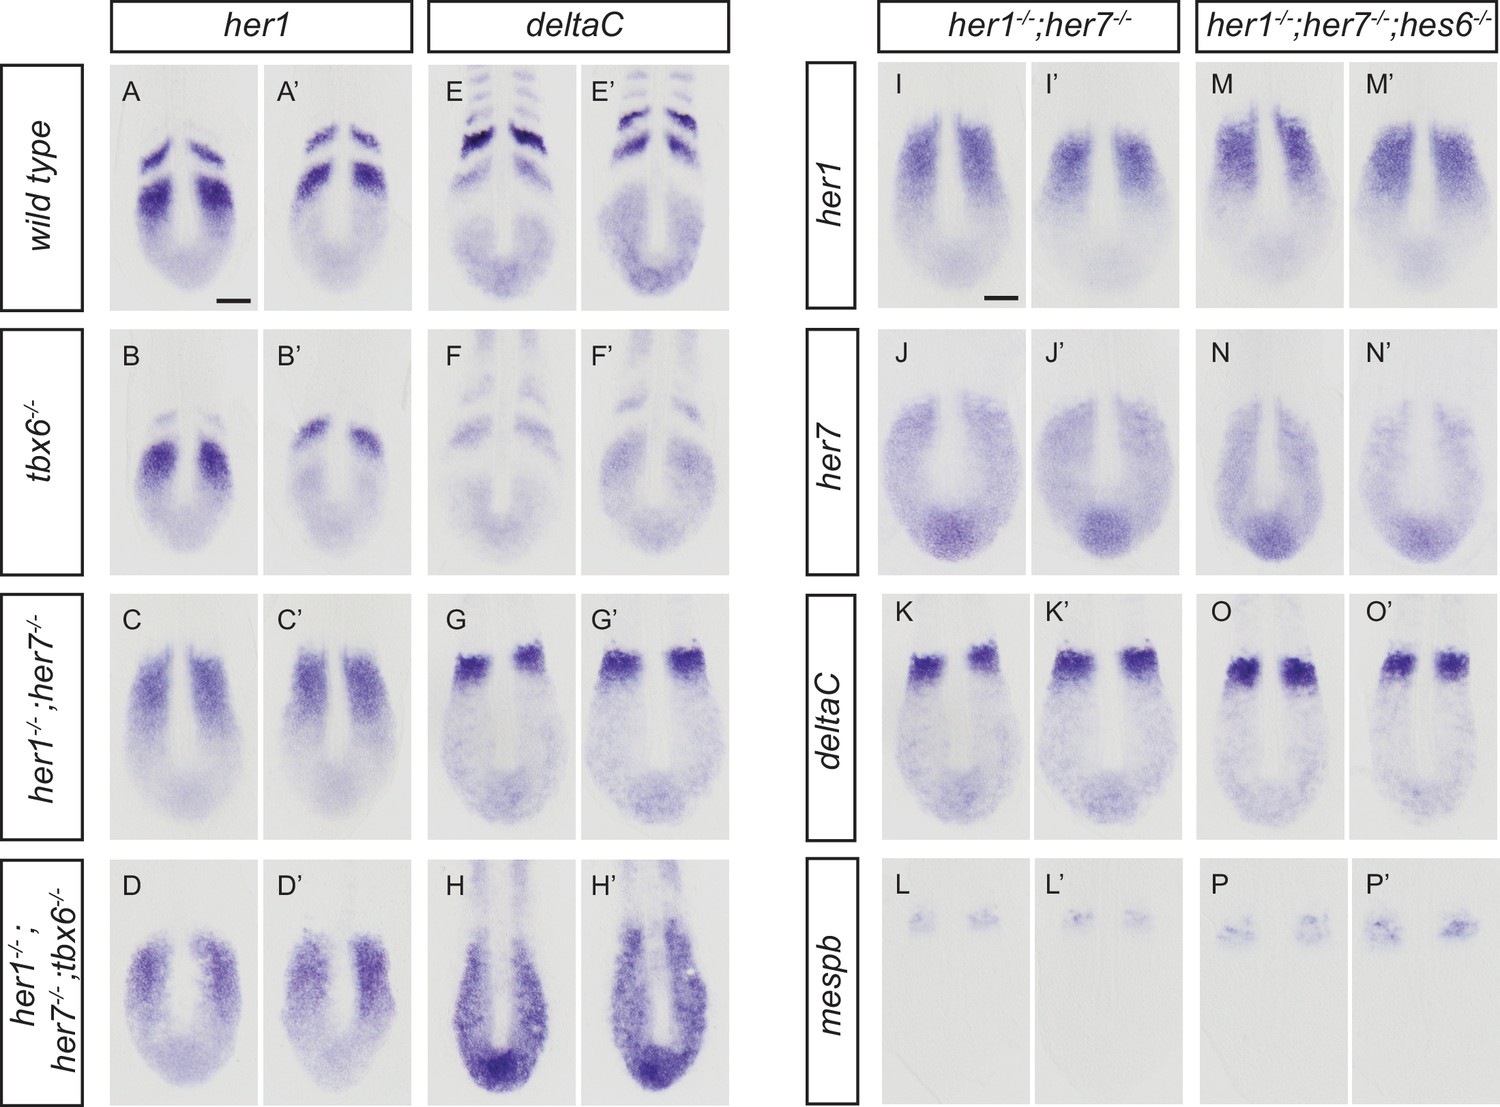
Disruption of the segmentation clock in tbx6, her1;her7, her1;her7;tbx6 and her1;her7;hes6 mutants.
(A-H') In situ hybridization for segmentation clock markers her1 and deltaC in tbx6−/−, her1−/−;her7−/−and her1−/−;her7−/−;tbx6−/−. her1 (B and B’) and deltaC (F and F’) oscillate in the posterior PSM of tbx6−/−. her1 (C and C’) and deltaC (G and G’) do not oscillate in her1−/−;her7−/−. (D and D’, H and H’) her1 and deltaC do not oscillate and their expression is restricted to the posterior PSM in her1−/−;her7−/−;tbx6−/−. (I-P') Comparison of clock markers her1, her7 and deltaC and segmental output marker mespb between her1−/−;her7−/− and her1−/−;her7−/−;hes6−/−. her1, her7 and deltaC expression domains are indistinguishable in her1−/−;her7−/− (I and I’, J and J’, K and K’) and her1−/−;her7−/−;hes6−/− (M and M’, N and N’, O and O’). mespb expression in the anterior PSM is equivalently disordered in both mutants (L and L’, P and P’). Embryos are 13.5 hpf (10-somite stage). Scale bar in A applies to A-H’. Scale bar in I applies to I-P’. Scale bars are 100 µm.
Figure 1—figure supplement 3
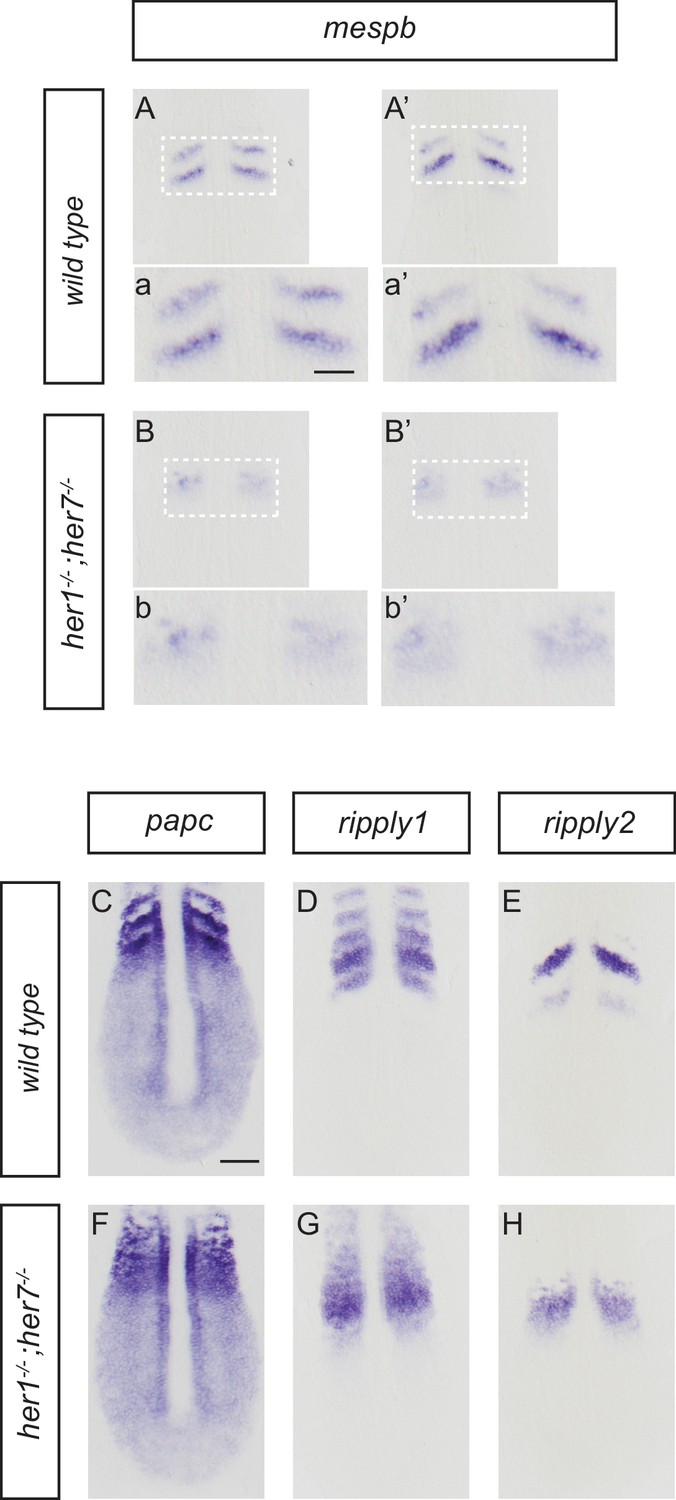
Disruption of segmental output in the anterior PSM of her1;her7 mutants.
In situ hybridization for segmentation clock output markers. (A-b') Two examples of mespb expression in the anterior PSM of wild type embryos, present as segmental stripes (A, a and A’, a’) whereas mespb expression is diffuse and lacking segmental organization in her1−/−;her7−/− (B, b and B’, b’). (C-H) Comparison of segmental markers paraxial protocadherin (papc), ripply1 and ripply2 between wild type and her1−/−;her7−/− embryos. papc (C) ripply1 (D) and ripply2 (E) are expressed as stripes in the anterior PSM and ripply1 is also expressed in the posterior compartment of the formed somites in wild type, but all markers show disrupted segmental organization in her1−/−;her7−/− (F, G and H respectively). A - H are dorsal views of 13.5 hpf (10 somites) flat-mounted embryos. Scale bar in C is 100 µm and applies to A - H. Scale bar in a is 50 µm and applies to insets a, a’, b and b’.
Figure 2 with 4 supplements
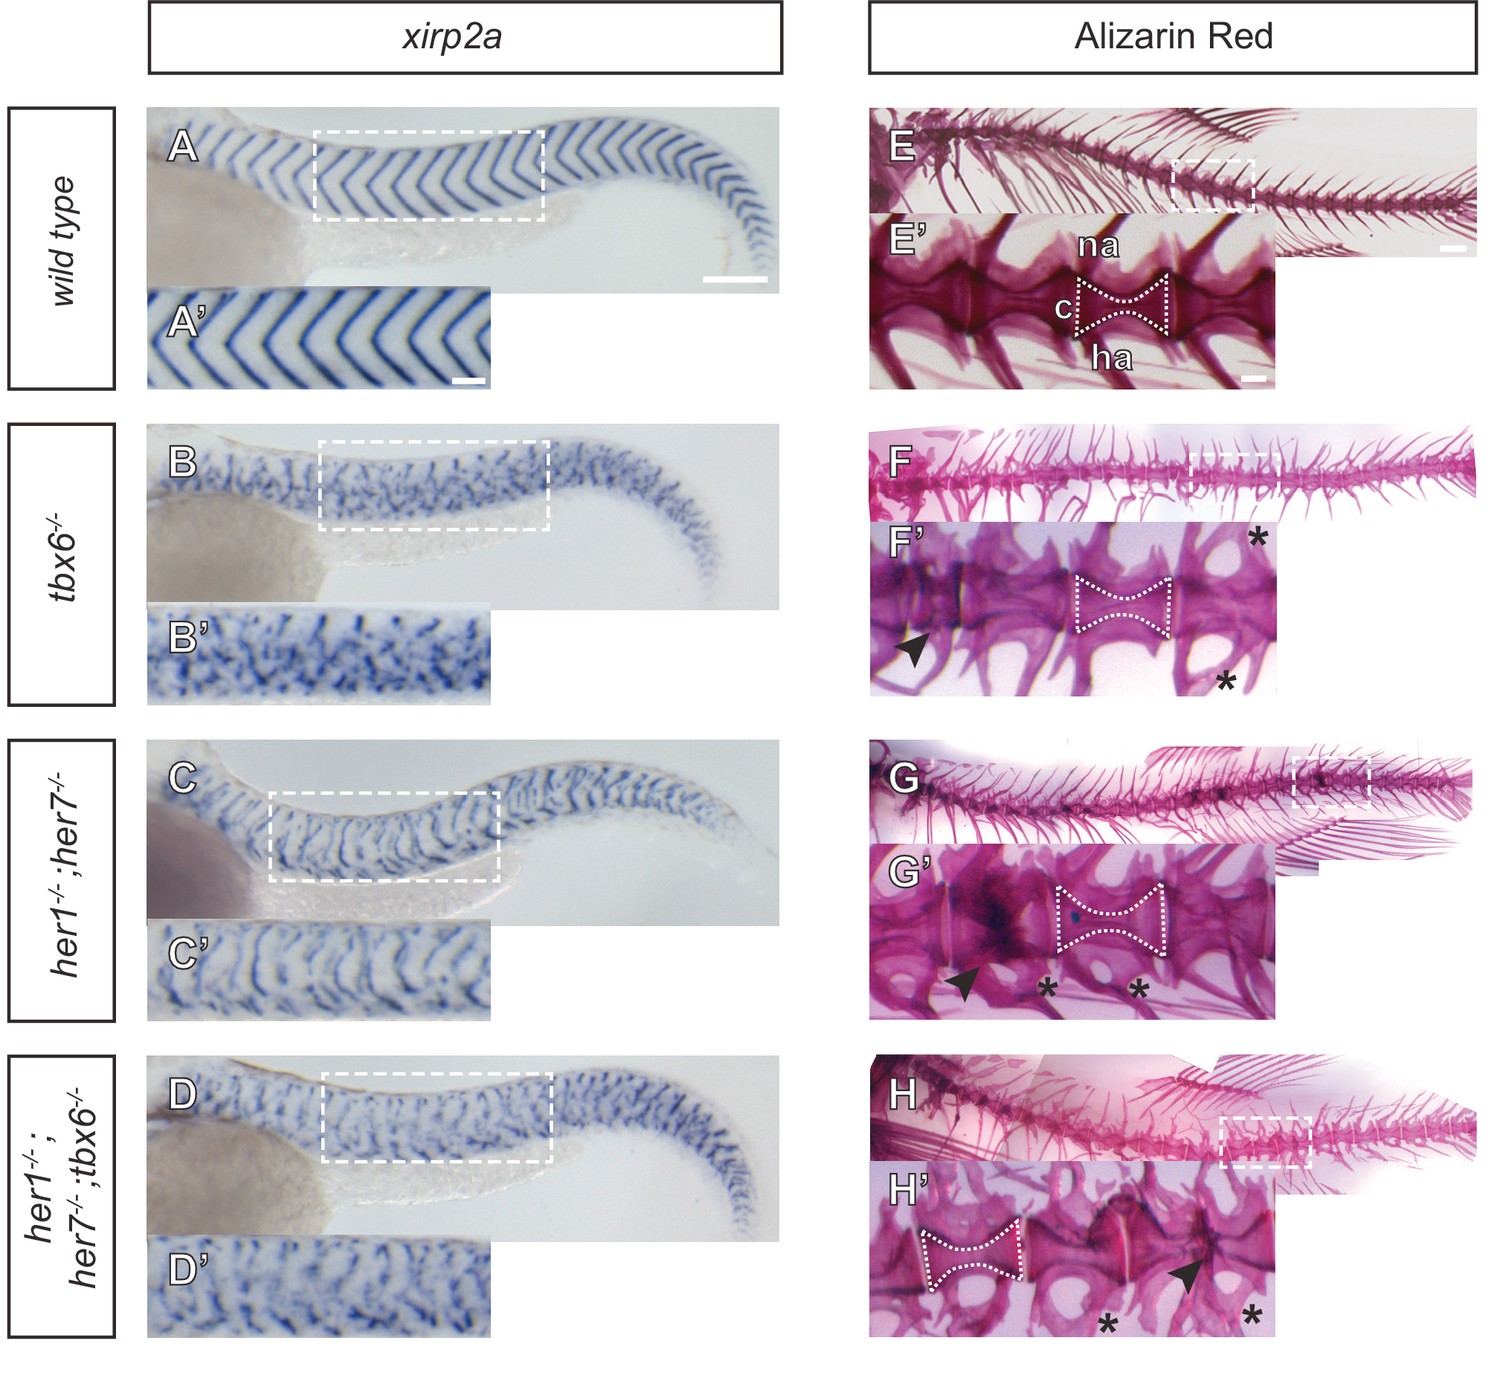
Myotome boundaries are disrupted in segmentation clock mutants, but chordacentra are still patterned.
(A to D’) In situ hybridization for myotome boundary marker xirp2a. Myotome boundaries are disrupted to differing degrees of severity depending on the genotype. (E–H’) Alizarin Red bone preparations. Centra are well-formed in tbx6−/− (n = 10) (F), while neural and hemal arches are often fused (F´). Centra are also well-formed in her1−/−;her7−/− (n = 14) (G,G’) and her1−/−;her7−/−;tbx6−/− (n = 15) (H,H’). Occasional defects occur, seen as smaller vertebrae (arrowhead in F’), or as fusions of two vertebrae (arrowheads in G’ and H’). Larvae in A-D are 40 hpf. Adult fish in E-H are between two and six months. All animals in lateral view with anterior to the left. na - neural arch, hr - hemal arch, c - centrum. Scale bars in A and A’ are 150 µm and 100 µm respectively and apply to A-D and A’-D’ respectively. Scale bar in E is 1 mm and applies to E-H, scale bar in E’ is 200 µm and applies to E’-H’. Asterisks highlight fused neural and hemal arches.
Figure 2—figure supplement 1
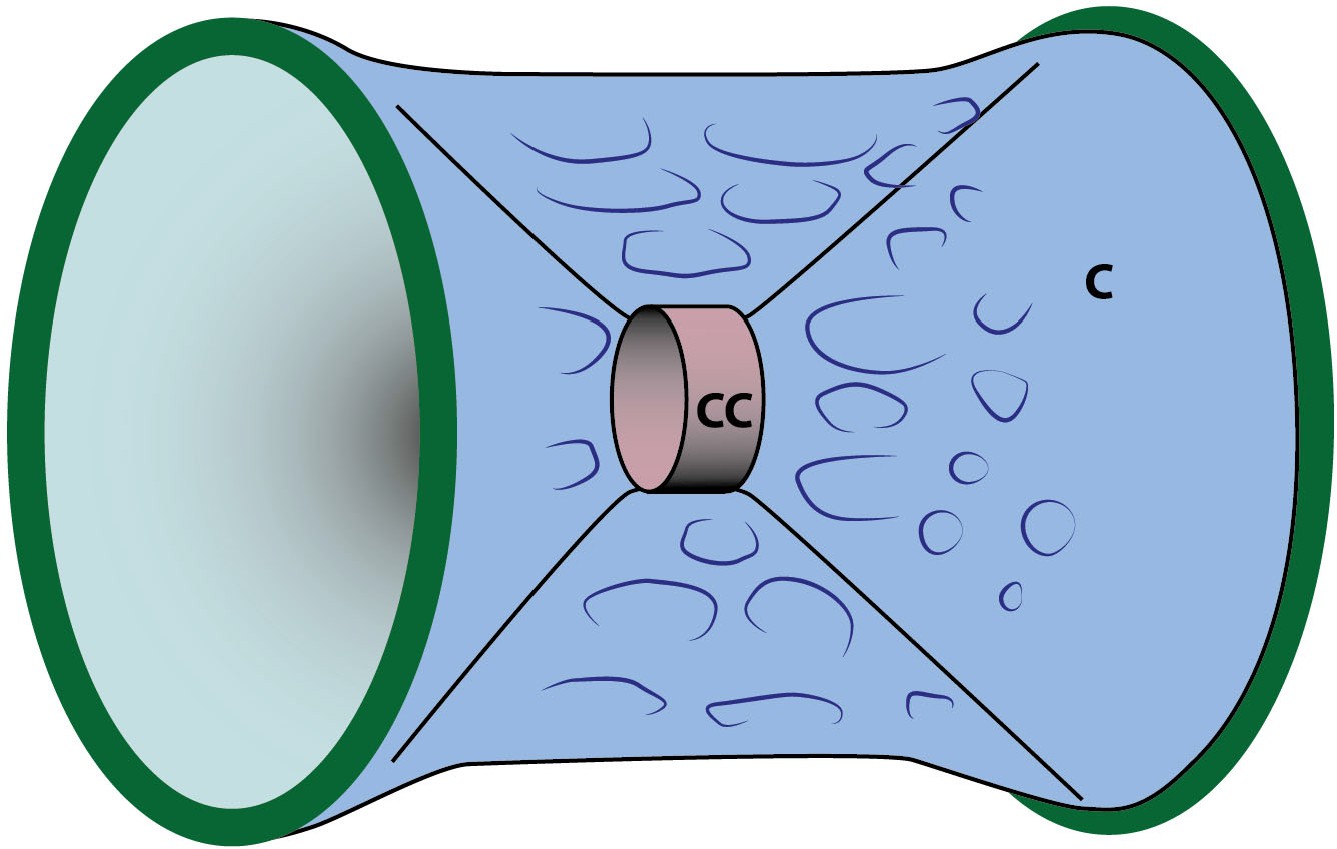
Schematic depiction of a vertebral body.
The initial mineralization immediately adjacent to the notochord results in the formation of the chordacentrum (cc). The subsequent expansion of this structure through further mineralization of collagenous fibrils leads to subsequent distal growth in all dimensions, and the formation of the centrum proper (vertebral body) (c). Green border represent domains of outwardly-growing entpd5 expression (compare to Figure 5). Adapted after Figure 7 of Wang et al., 2013.
Figure 2—figure supplement 2
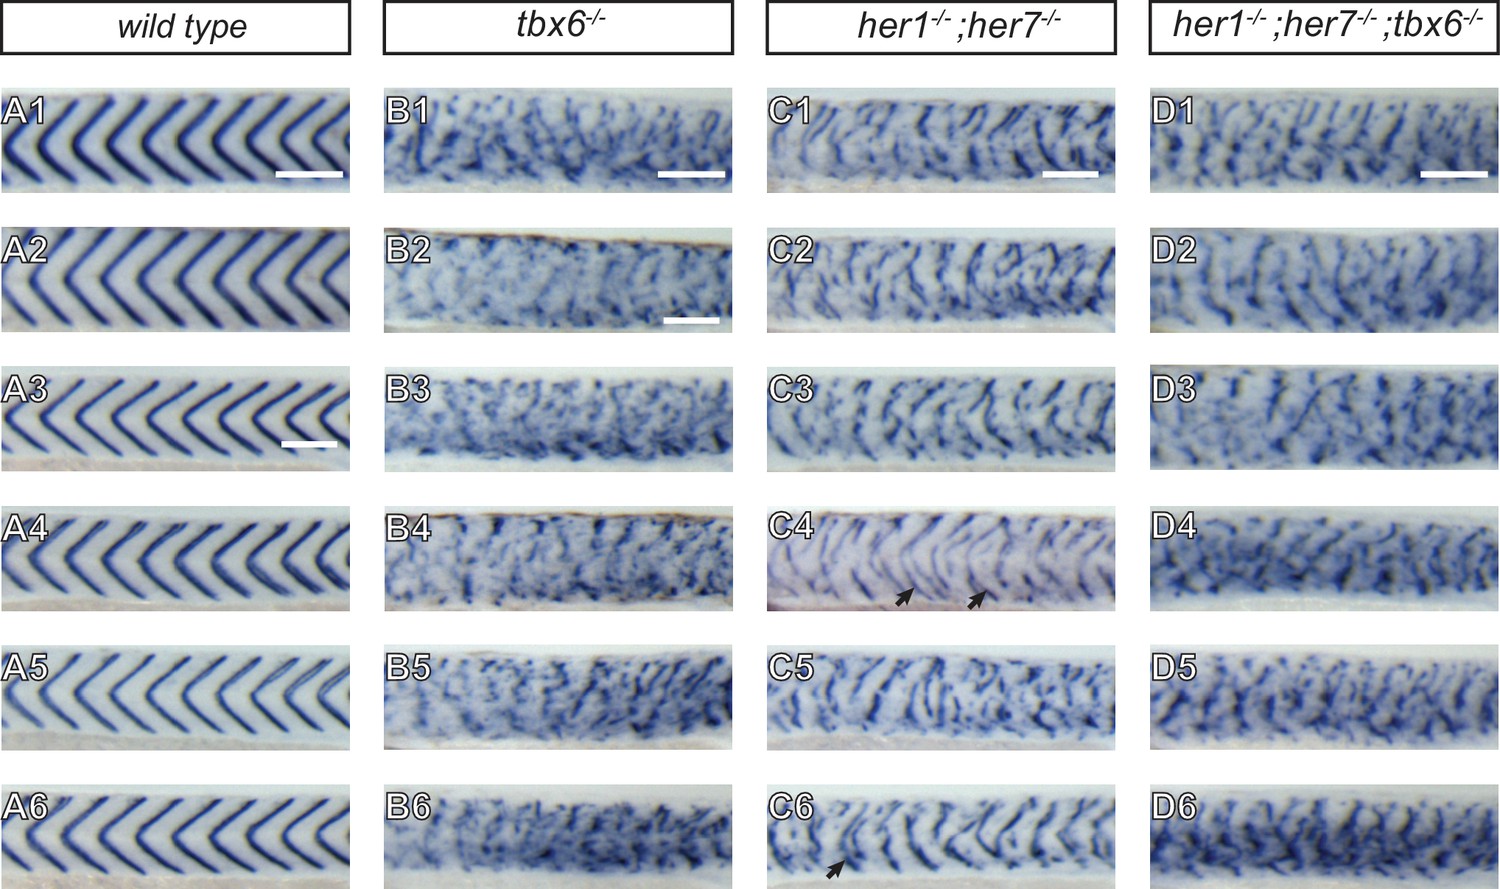
Severity of myotome boundary disruptions in tbx6, her1;her7 and her1;her7;tbx6 mutants differ according to genotype.
(A1–D6) In situ hybridisation for myotome boundary marker xirp2a in six representative embryos for each genotype. (A1-A6) In wild type larvae, xirp2a staining delimits periodic, chevron-shaped boundaries. (B1–B6) In tbx6−/−, myotome boundaries are either fragmented or indistinct and xirp2a staining is visible in most of the axis. (C1–C6) In her1−/−;her7 −/−, myotome boundaries are fragmented and scattered in the trunk. Occasional chevron-shaped boundaries can be observed (arrows in C4 and C6). (D1–D6) Myotome boundary disorder of her1−/−;her7−/−;tbx6 −/− resembles tbx6−/−. Scale bars are 100 µm. Scale bar in A1 applies to A1-2, in A3 applies to A3-A6, in B2 applies to B2-B6, in C1 to C1-6 and in D1 to D1-6. Larvae are 36–41 hpf, shown in lateral view with anterior to the left. Images are taken from trunk abutting the yolk extension, corresponding to ~segments 7 to 17 in .
Figure 2—figure supplement 3
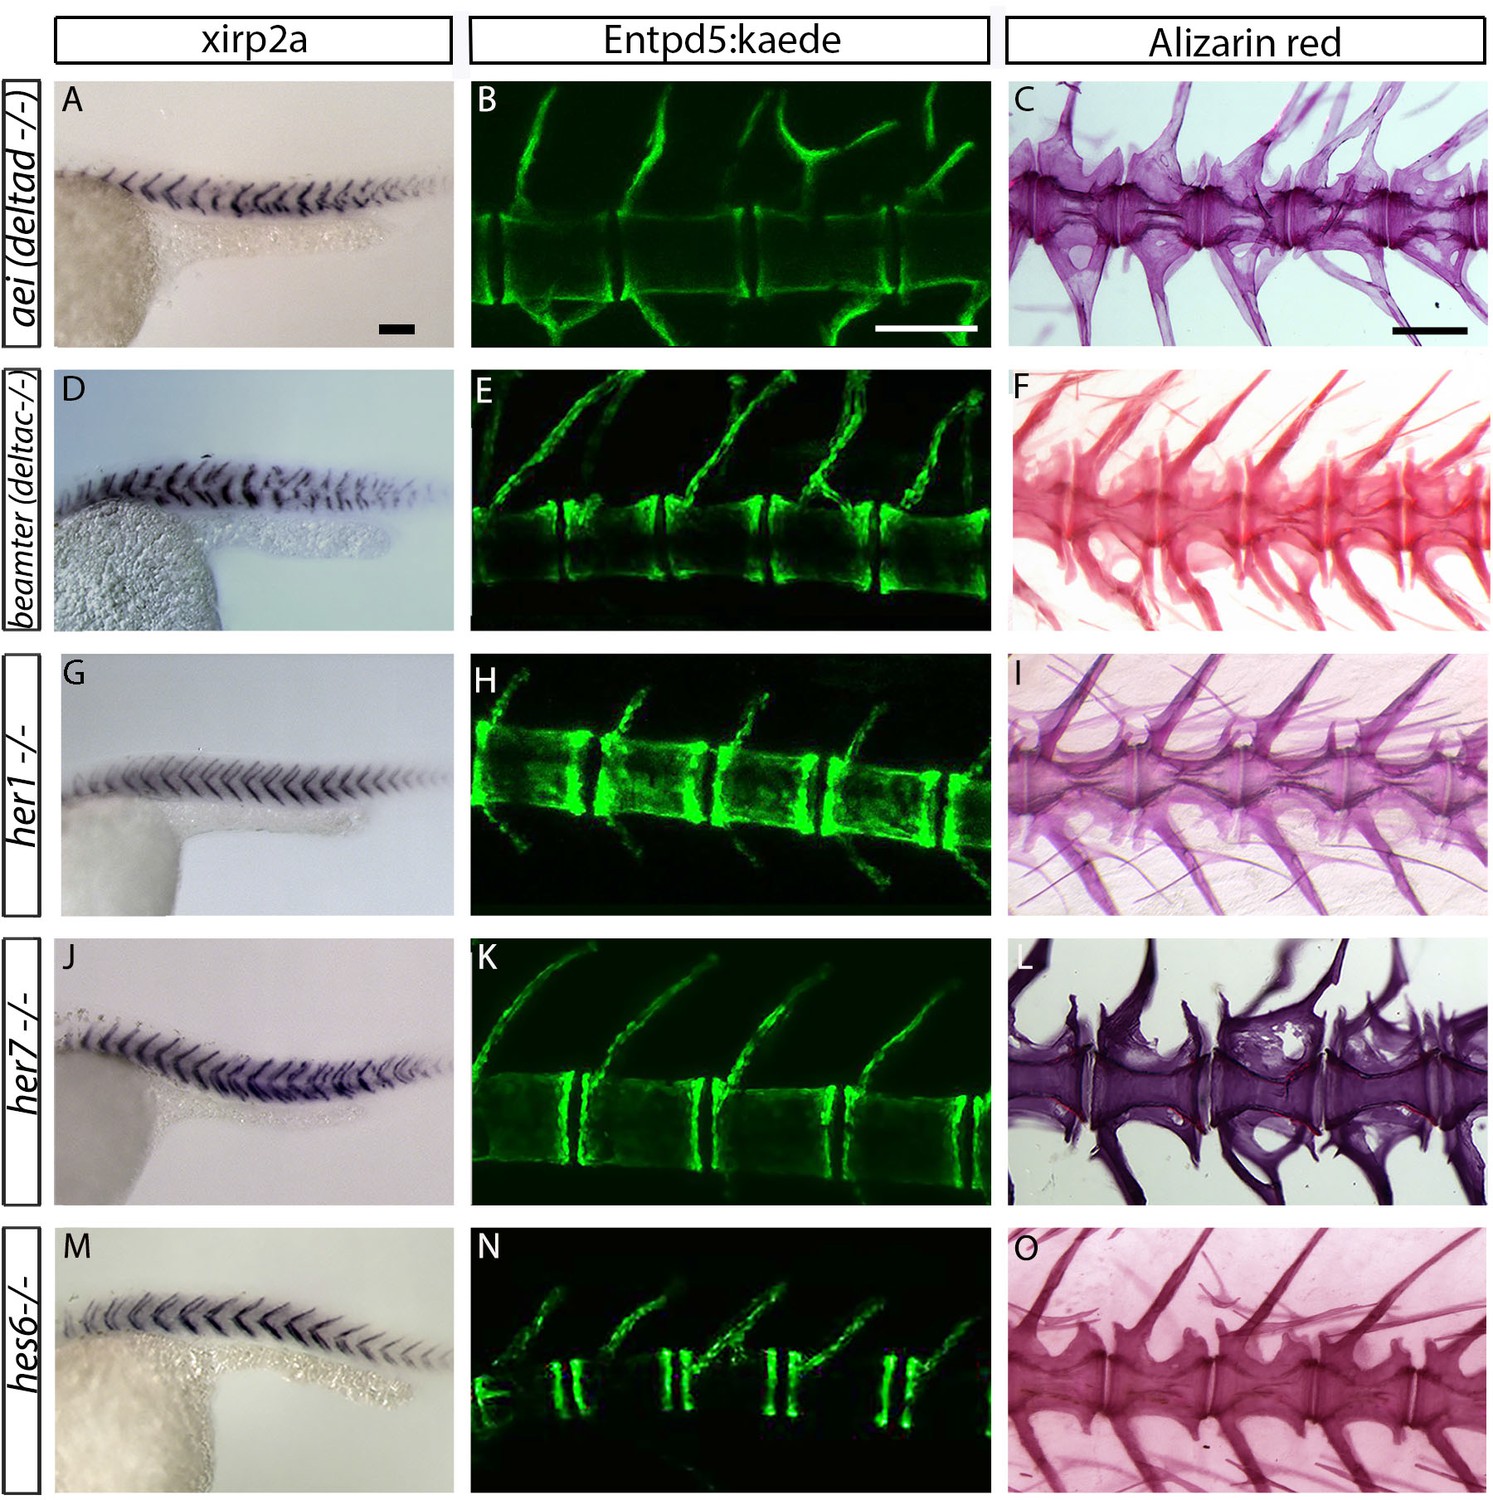
Centra are well-formed in deltaD, deltaC, her1, her7 and hes6 segmentation clock single gene mutants.
(A, D, G, J and M) xirp2a myotome marker in situ hybridization at 27 hpf. (B, E, H, K and N) entpd5:kaede expression between 15 dpf and 20 dpf. (C, F, I, L, O) Alizarin Red bone stain in adults between 6 months and 1 year. Centra segmentation is normal in aei/deltaD, beamter/deltaC, her1, her7, and hes6 mutants. In aei/deltaD (A), bea/deltaC (D) and her7 (J) mutants, where the myotome boundaries are disordered only in the posterior trunk and tail, the neural and hemal arches of the caudal vertebrae are fused (B, C, E, F and L). All animals in lateral view with anterior to the left. Scale bars are 100 µm in A, D, G, J, M; 300 µm in B, E, H, K, N; and 0.6 mm in C, F, I, L, O).
Figure 2—figure supplement 4
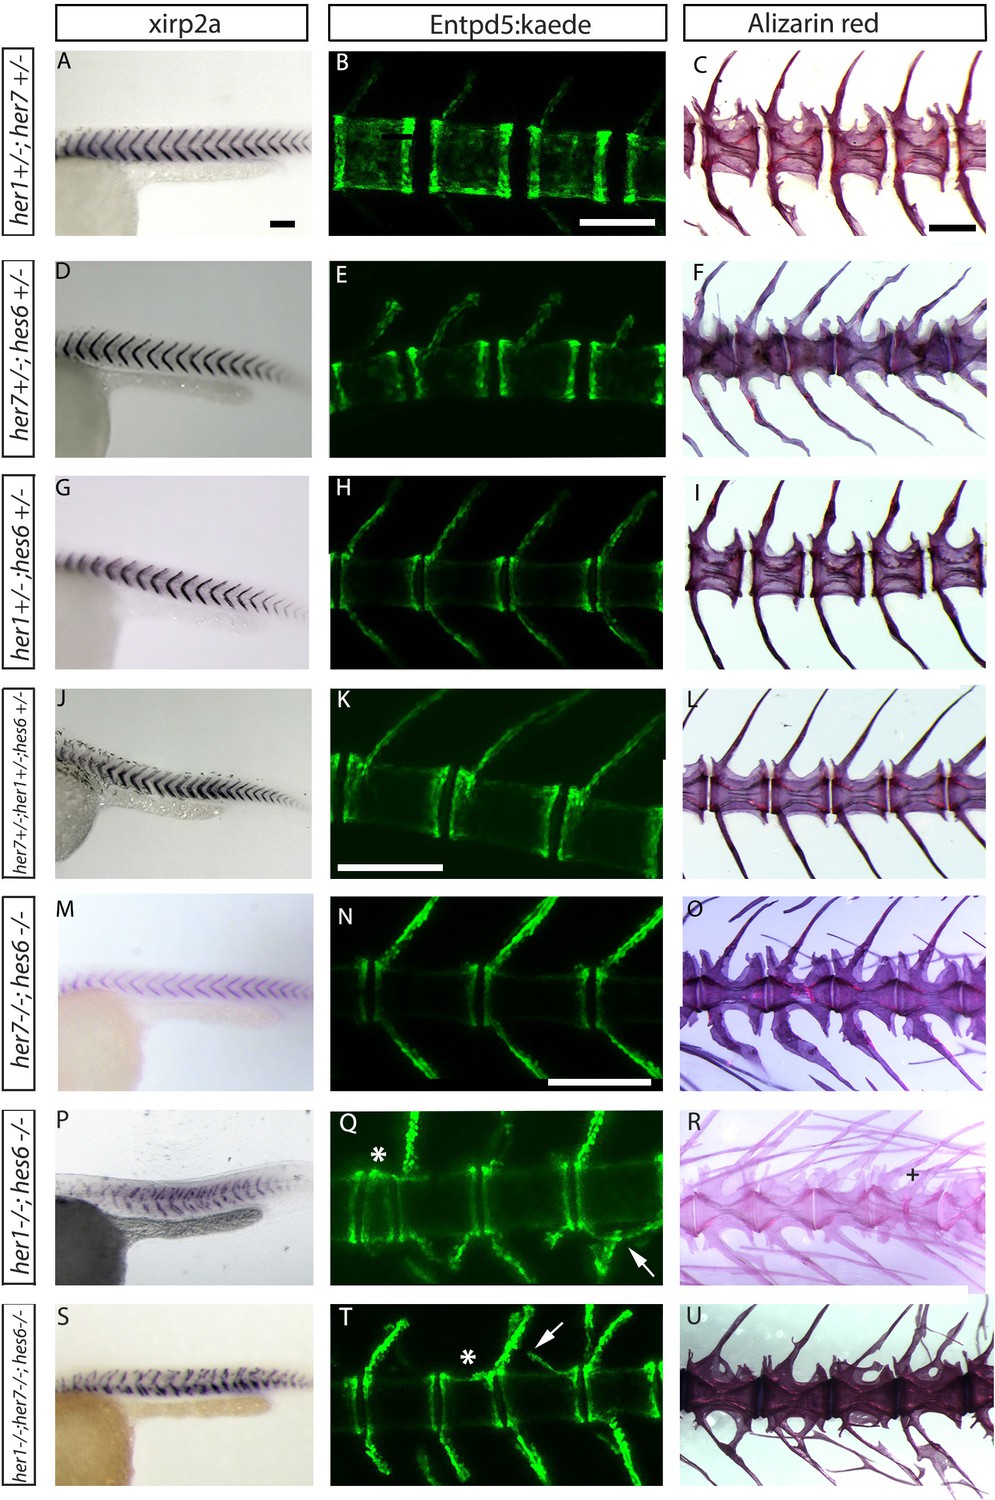
Segmentation clock gene double and triple heterozygous mutants have well-formed centra.
(A, D, G, J, M, P, S) xirp2a myotome marker in situ hybridization at 27 hpf. (B, E, H, K, N, Q, T) entpd5:Kaede expression between 15 dpf and 20 dpf. (C, F, I, L, O, R, U) Alizarin Red bone preparations of adults between 6 months and 1 year of age. (A to L) Triple and double heterozygote embryos for her1, hes6 and her7, have wild type myotome boundaries, arches and chordacentra. (M) The her7;hes6 homozygous mutants have normal myotome segmentation (n = 36). At both embryonic (N (n = 5)) and adult stages (O (n = 6)) her7;hes6 mutants have well-formed centra and neural and hemal arches. (P) her1;hes6 mutants (n=15) and (S) her1;her7;hes6 mutants (n=9) have disordered myotome boundaries. In both cases, neural and hemal arches show fusions (arrow in Q and T) (Q (n = 3), R (n = 1), T (n = 5) and U (n = 6)) and small vertebrae (asterisk in Q and T) and fusion between two vertebrae (cross in R). All animals in lateral view with anterior to the left. Scale bars are 100 µm in A, D, G, J, M, P, S; 300 µm in B, E, H, K, N, Q, T; and 0.6 mm in C, F, I, L, O,R,U).
Figure 3 with 1 supplement
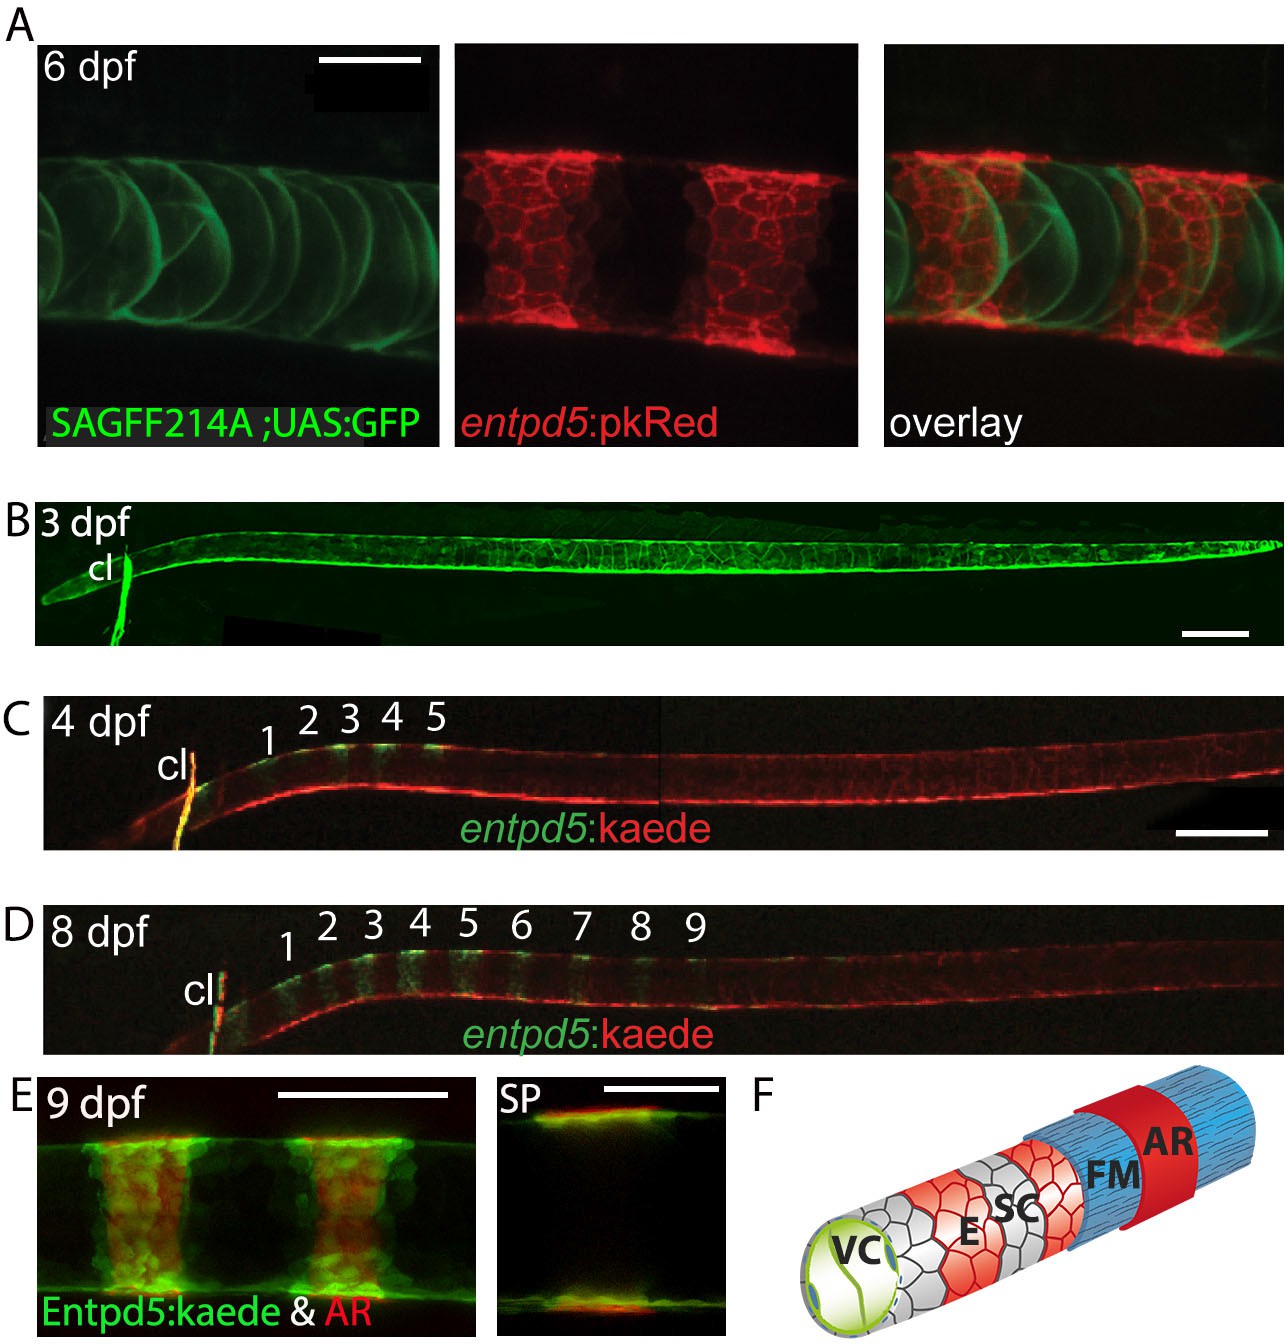
Segmental entpd5 expression in notochord sheath cells marks the sites of chordacentrum mineralization.
(A-D) Confocal images of live transgenic entpd5 reporter larvae in lateral view with anterior to left. (A) At 6 dpf, entpd5 is expressed only in notochord sheath cells and not in vacuolated notochord cells, labelled by SAGFF214A;UAS:GFP. (B) At 3 dpf entpd5 is expressed in the whole notochord and does not display a segmented pattern. (C,D) Transgenic entpd5:Kaede embryos were photoconverted at 3 dpf and imaged at 4 dpf (C) and 8 dpf (D), respectively. New axial expression domains (green) are restricted to a segmental pattern within the axis and the cleithrum (cl). (E) Live confocal imaging of entpd5:Kaede expression in larvae also stained with Alizarin Red (AR) in lateral view (left) and sagittal view (SP). entpd5+ expression domains overlap with areas of mineralization (left), and notochord sheath cells (green) localize proximal to the site of mineralization of the future chordacentra. (F) Schematic illustration depicting the innermost vacuolated cells (VC) and the alternating pattern of entpd5+ (red, E) and entpd5- (grey) notochord sheath cells (SC). The sheath cells are surrounded by a fibrous matrix (FM), which in turn becomes mineralized in entpd5+ areas. cl, cleithrum. Scale bar for A and E is 40 µm, scale bar for B and C is 150 µm.
Figure 3—figure supplement 1
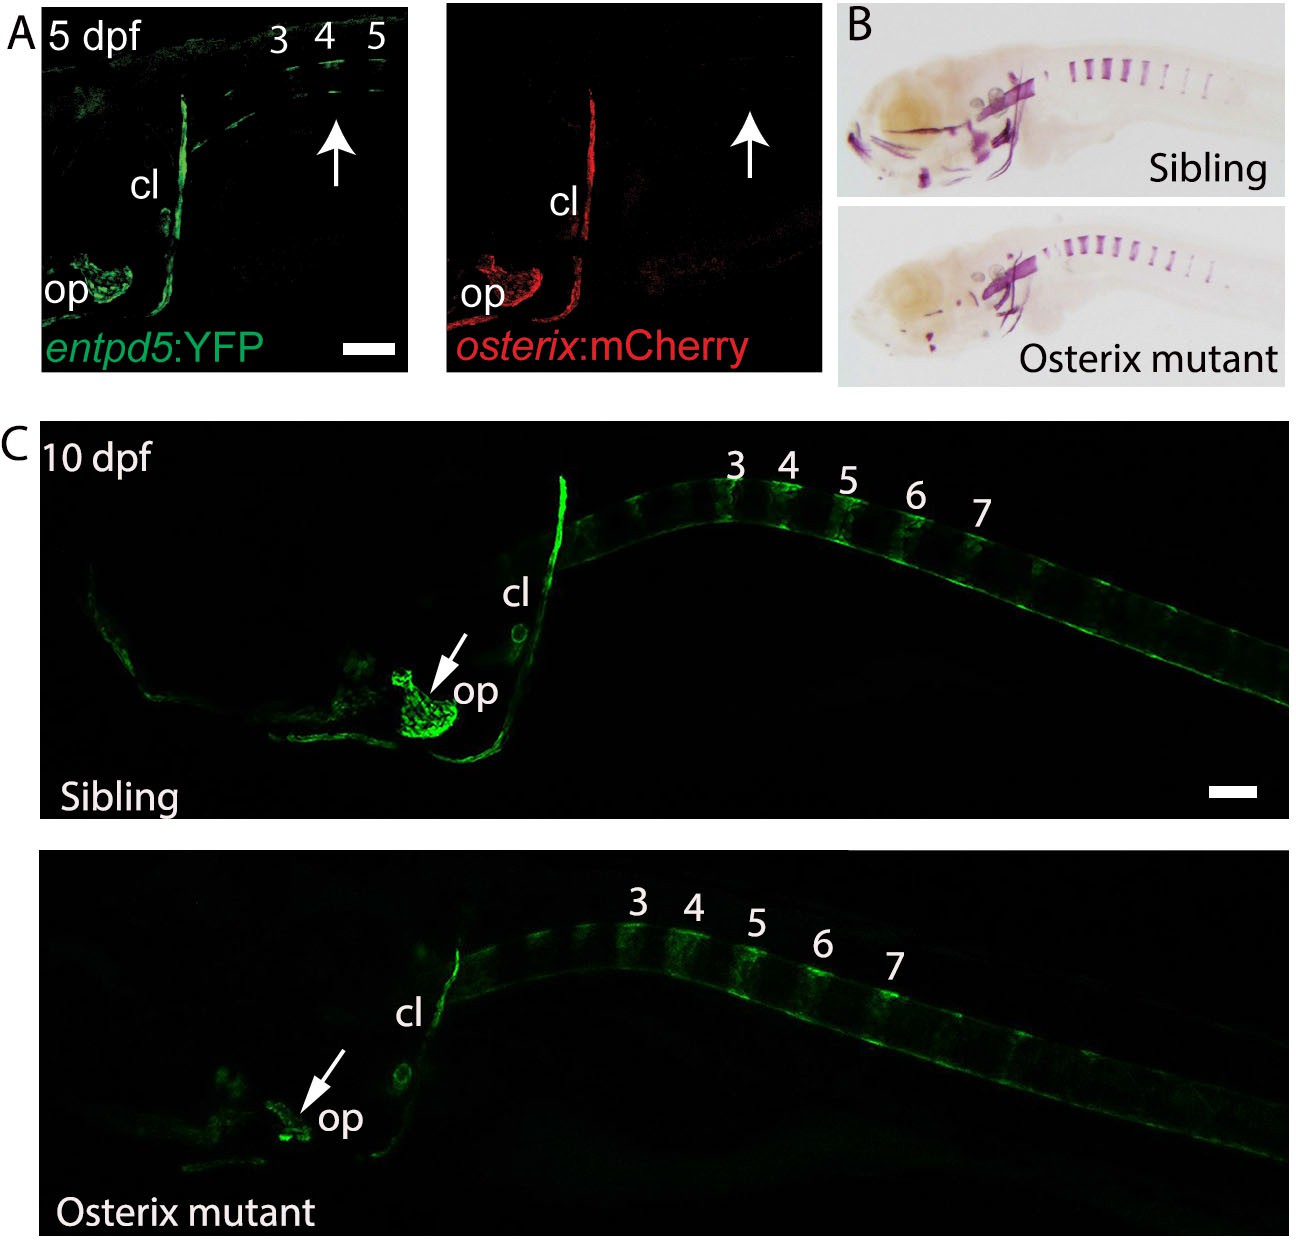
osterix is required for the formation of cranial bone structures, but not for the axial skeleton.
(A) Lateral view of a transgenic entpd5:YFP; osterix:mCherry embryo. entpd5:YFP expressing cells are present at positions (arrows; numbers refer to prospective vertebrae 3–5) where mineralization of the vertebral centra are predicted to occur. osterix:mCherry expressing cells are not observed at these positions. (B) Lateral view of sibling and osterix mutant embryos, stained with Alizarin Red. Reduced mineralization seen in the head of mutants, but not around the notochord. (C) Lateral view of sibling and osterix mutant embryos, where all bone elements are labelled with entpd5:kaede. entpd5 expression is reduced in the craniofacial bones of the mutant compared with the sibling. The axial skeletons show no changes in vertebral expression pattern. All images are lateral views, with anterior to the left. Scale bars are 100 µm.
Figure 4 with 5 supplements
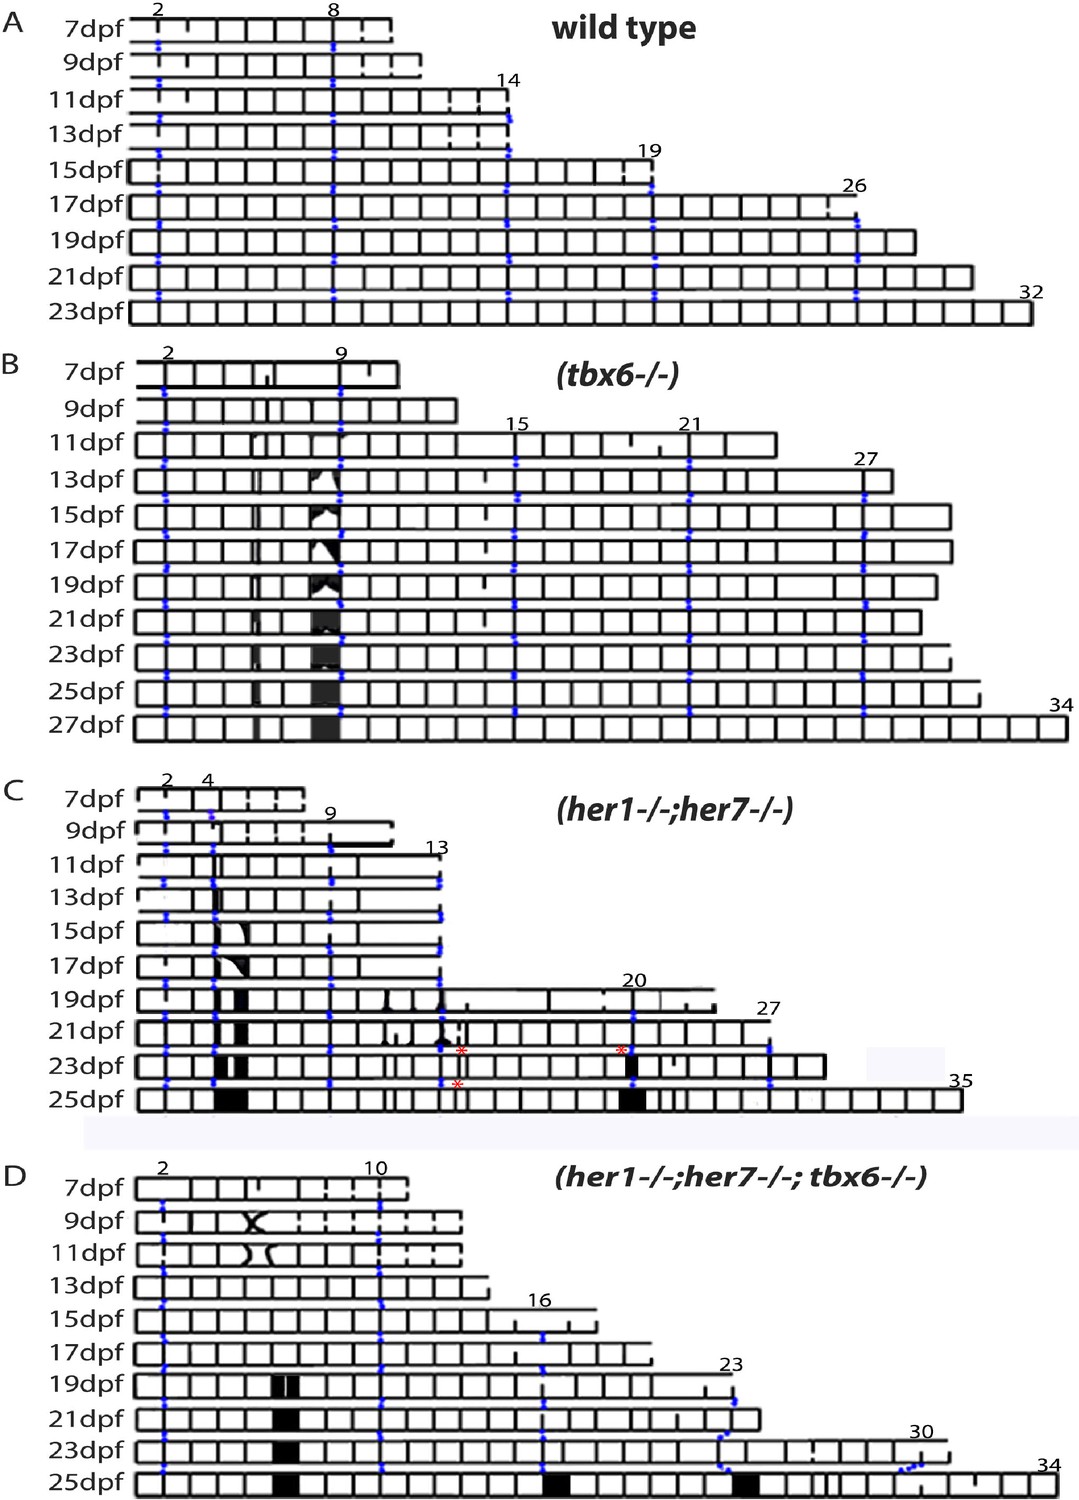
Mutants with disturbed segmentation clock form a metameric order of chordacentra with scattered defects.
(A–D) Kymogram representation of virtual time lapse observations of representative entpd5:kaede-expressing larvae of each genotype. (A) In wild type (n = 16), entpd5+ segments are added in an orderly manner from anterior to posterior (black lines). (B) tbx6−/− (n = 4), (C) her1−/−;her7−/− (n = 4), and (D) her1−/−;her7−/−;tbx6−/− mutants (n = 4) also form entpd5+ rings in an anterior to posterior manner, but in an error-prone fashion. Defects such as gaps in the segmental pattern (increased intervertebral spaces), or small vertebrae followed by fusions (black boxes) can be seen scattered along the axis. Red asterisks (*) in her1−/−;her7−/− kymogram (C) represent sites of transient bending of the axis. Blue dots follow the development of the numbered chordacentra over time.
Figure 4—figure supplement 1

Wild type entpd5:kaede larvae develop axial segmentation in an orderly manner from anterior to posterior.
Virtual time lapse of one larva from 7 dpf to 23 dpf showing entpd5 positive segment development in the axial skeleton progressing continuously from anterior to posterior, with regular distance between segments. Scale bars are 300 µm.
Figure 4—figure supplement 2

fss (tbx6−/−);entpd5:kaede larvae develop axial segmentation with occasional gaps that are later filled by a smaller entpd5+ ring domain.
Virtual time lapse of one larva from 7 dpf to 27 dpf. Scale bars are 300 µm.
Figure 4—figure supplement 3
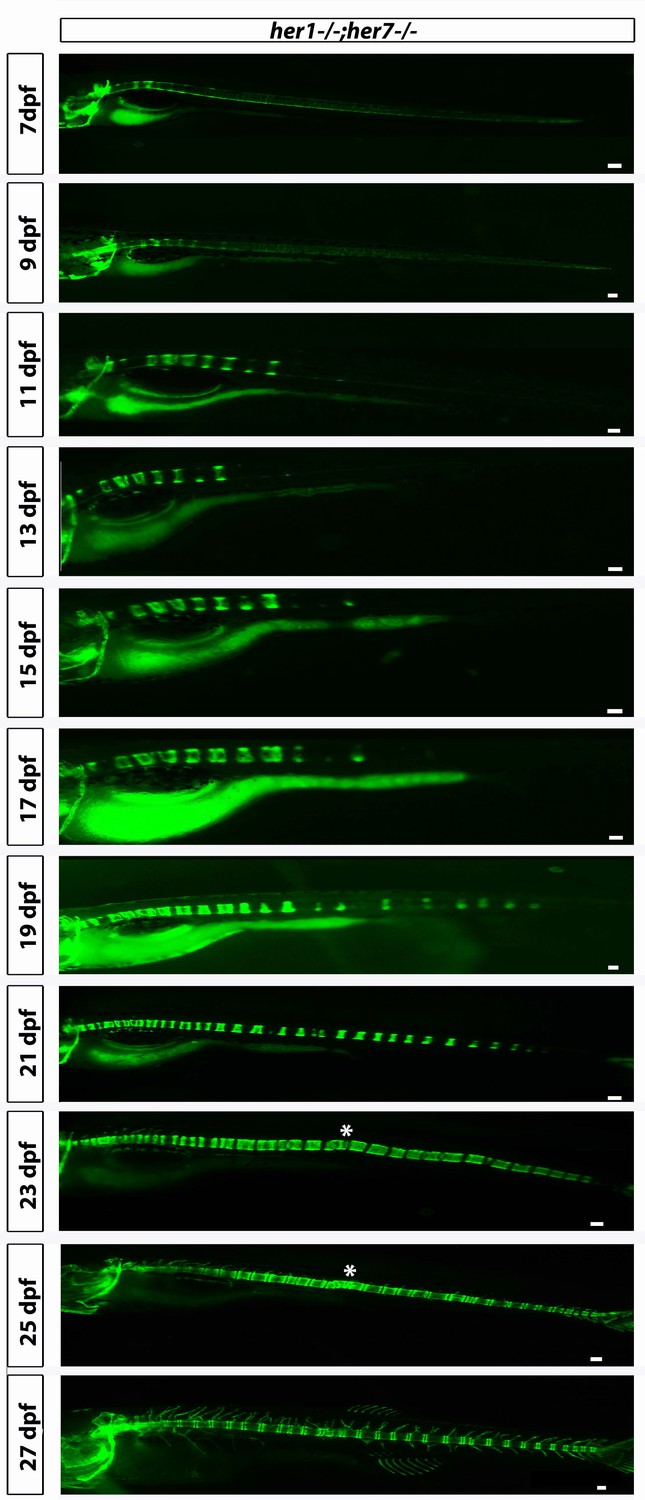
her1−/−;her7−/−;entpd5:kaede larvae develop axial segmentation in a disorganized manner, occasionally missing one or two segments or inserting additional segments.
Fusions of adjacent chordacentra, non-regular entpd5+ segment shapes, thicker and thinner segments and a transient bending of the axis (asterisk) can be seen. Virtual time lapse of one larva from 7 dpf to 27 dpf. Scale bars are 300 µm.
Figure 4—figure supplement 4
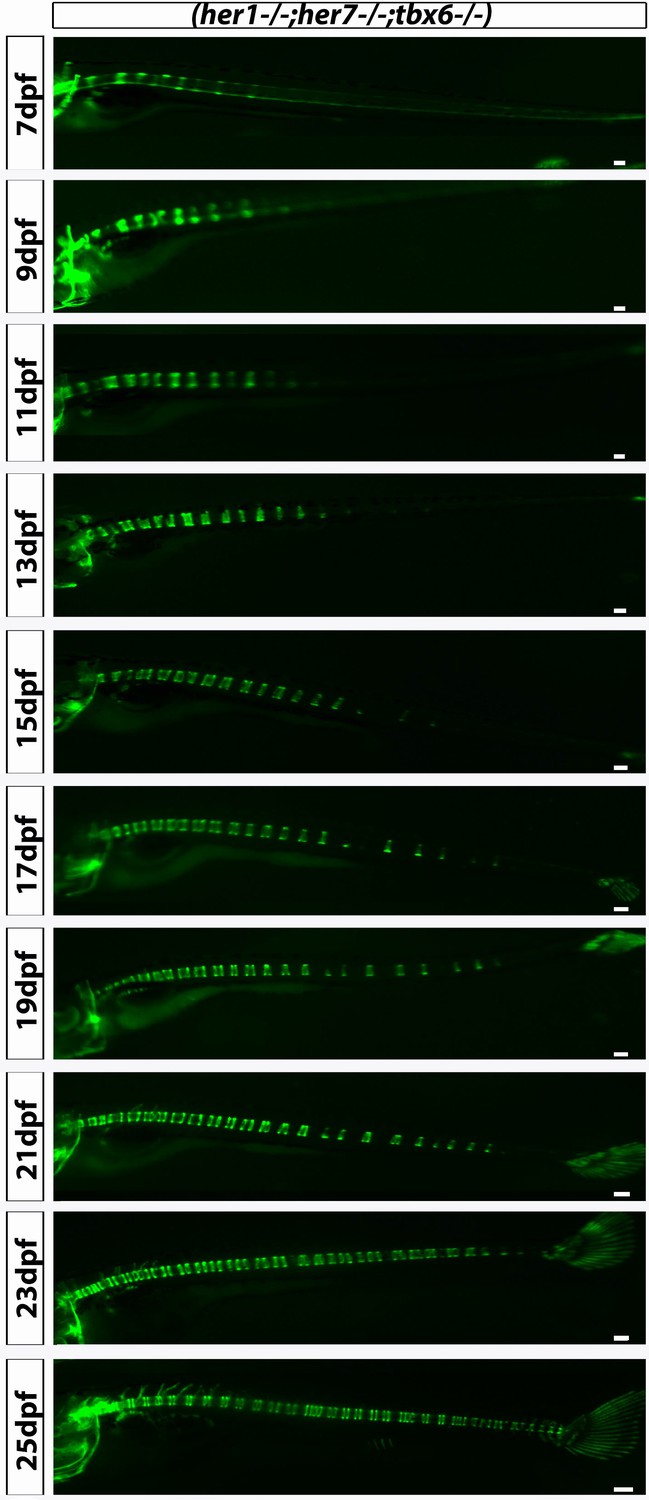
her1−/−;her7−/−;tbx6−/−;entpd5:kaede larvae showed disorganized axial segmentation.
These defects are not as strong or as frequent as in her1−/−;her7−/−, but gaps in segmentation, insertion of additional segments, fusions of adjacent centra, non-regular entpd5+ segment shapes, thicker and thinner segment can still be seen. Scale bars are 300 µm.
Figure 4—figure supplement 5

hes6−/−;entpd5:kaede larvae segment their axis in an orderly manner.
Even though segmentation is overtly normal, the hes6 mutant forms fewer chordacentra than wild type, as expected. Scale bars are 300 µm.
Figure 5
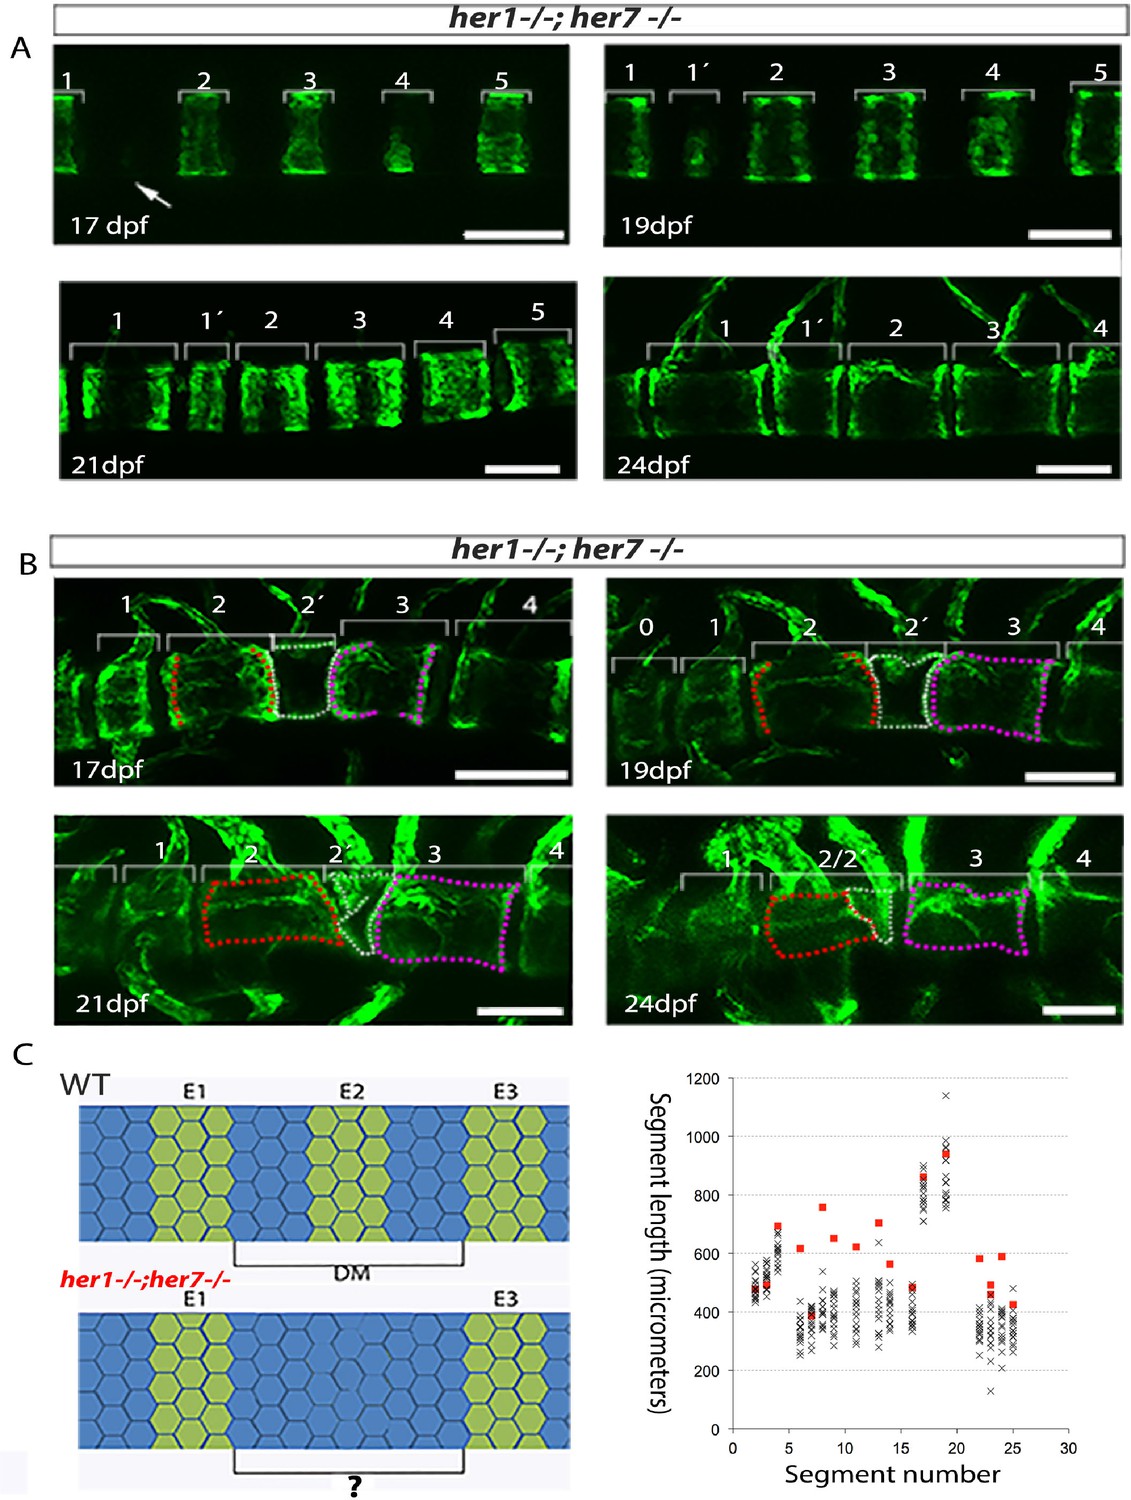
Inaccurate spacing of entpd5+ segments results in erroneous chordacentrum formation.
(A, B) Time series images of entpd5+ segments around the notochord in her1;her7 mutants, in lateral view with anterior to the left. (A) An atypically wide space between entpd5+ segments (arrow) results in the subsequent intercalation of an additional, smaller entpd5+ segment (1´). (B) An additional smaller segment (2') fuses to adjacent vertebra. (C) The length between existing entpd5+ segments was measured in her1;her7 mutants (n = 4) in positions where an entpd5 ring would be intercalated (red dots) and compared to the equivalent axial position in wild type (WT, n = 16) (black crosses). The distance preceding an intercalation in her1;her7 mutants was either similar or larger than wild type. DM, distance measured; E entpd5+ segment. All scale bars are 100 µm.
Figure 6
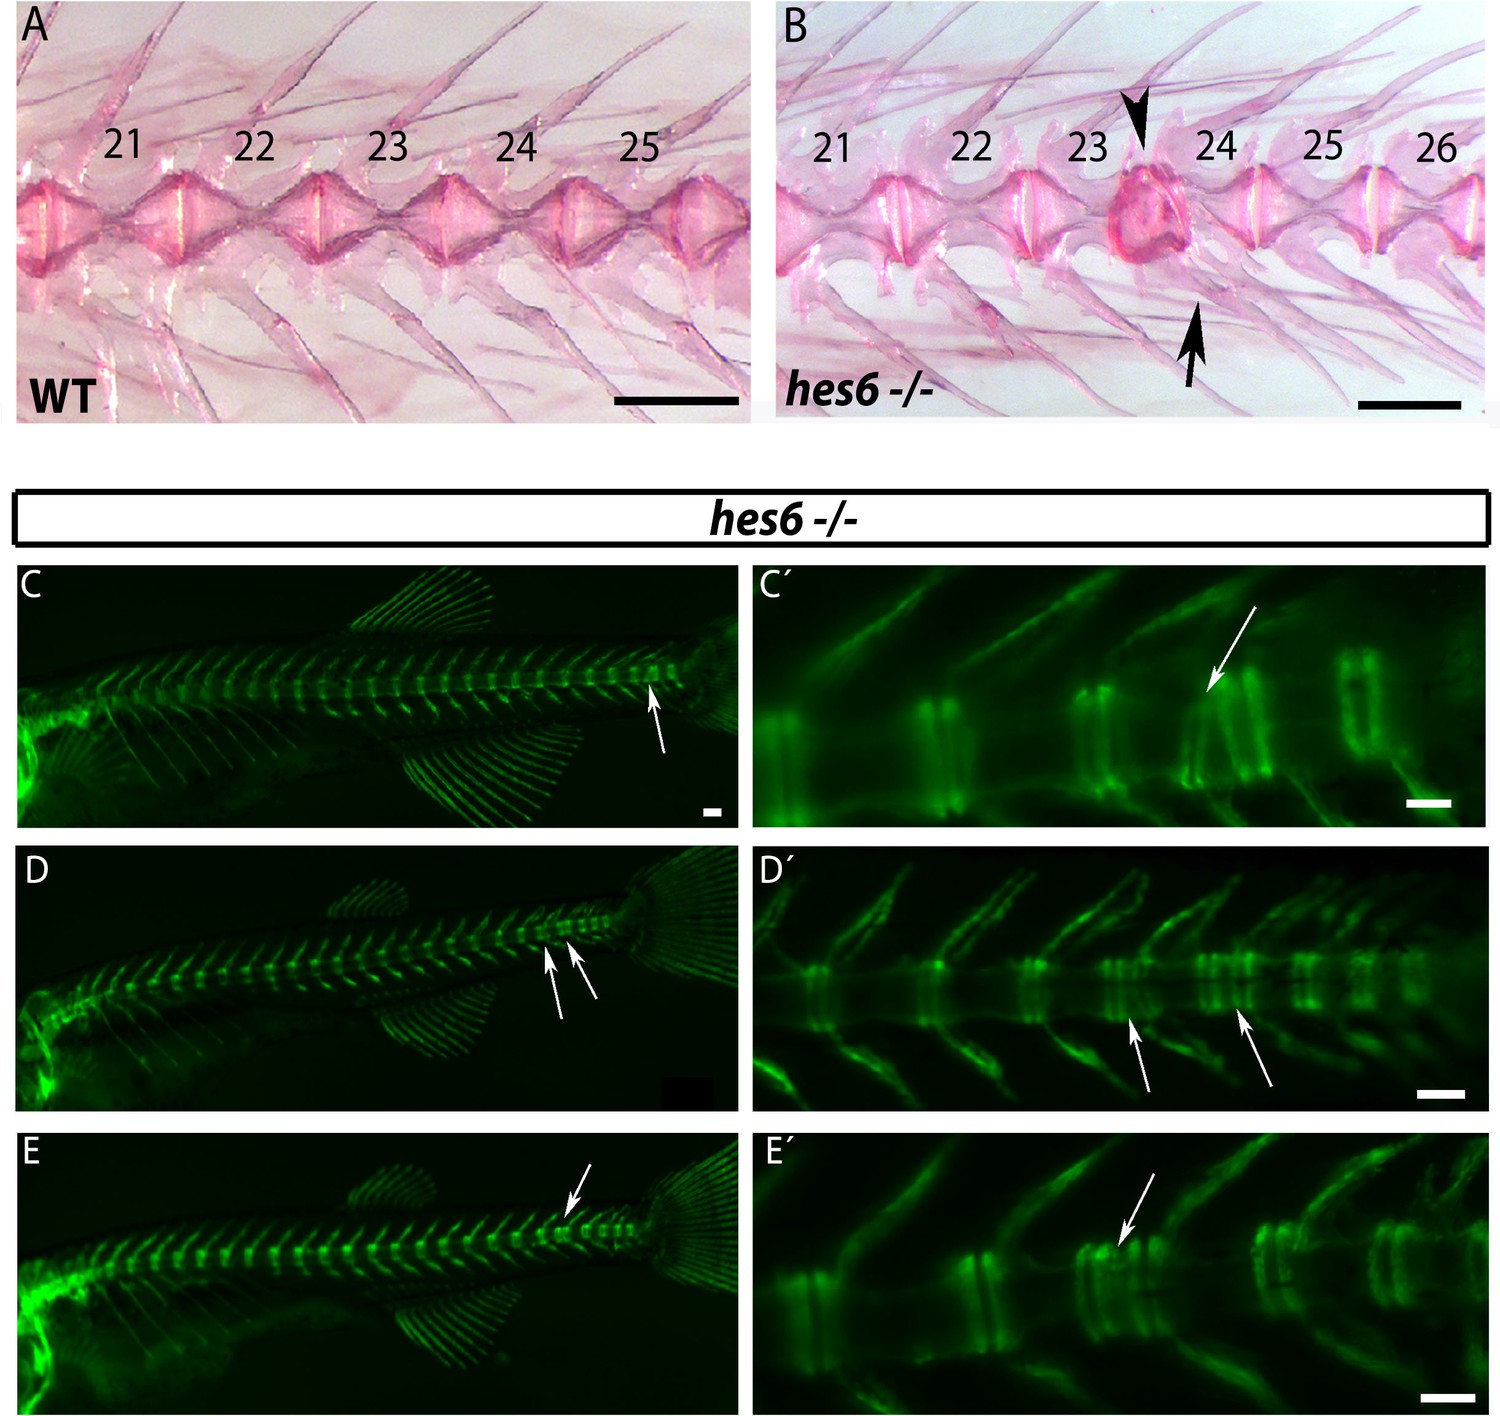
hes6 mutant embryos can form defective caudal vertebrae.
(A,B) Alizarin Red bone preparations of wild type and hes6−/− adults. (B) 27% of hes6−/− adult bone stains presented with defects in caudal chordacentra (n=4/15) wildtype. Arrow points at fused hemal arches, arrow head at chordacentra segment defect. (C to E´) entpd5:YFP expression in hes6 mutants at 28 dpf . 20% of hes6 mutants have one or more defective small vertebrae (arrows) exclusively in the caudal axis (n=8/41). Scale for A and B is 2.5 mm, C is 300 µm and C´ to E´ is 200 µm.
Figure 7 with 9 supplements

A reaction diffusion theory accounts for key experimental findings.
A sink profile (blue) describes cues from myotomes that bias the position of segments. The Entpd5 pattern is given by the concentration of an activator (green) that is regulated by an inhibitor (red). (A) The system is capable of autonomous pattern formation in the absence of sinks. (B) Wild type condition is described by regularly placed strong sinks, according to the output of a functioning segmentation clock. (C) In her1−/−;her7−/− strong sinks are misplaced due to a malfunctioning segmentation clock, causing segments to be also misplaced and giving rise to defects. (D) tbx6 and her1;her7;tbx6 mutants are characterized by weaker segmentation clock output and fragmented and scattered myotome boundaries, here described by weaker sinks with a shorter wavelength. (E) The hes6 mutant is here characterized by a sink profile wavelength that is 6% larger than wild type. Parameters: a = 10−3, b = 10−2, τ= 0.1, d = 0.5. Sink profile parameters: (A) S0 = 0, (B) S0 = 8, λ = 0.57, σ = 0.05, (C) S0 = 8, λ = 0.57, σ = 0.18, (D) S0 = 4, λ = 0.30, σ = 0.15, and (E) S0 = 8, λ = 0.60, σ= 0.05. See also Videos 1–5 and Figure 7—figure supplement 1–9 for animations and snapshots for all conditions. Source data files for this figure and the supplemental figures have been supplied.
Figure 7—figure supplement 1
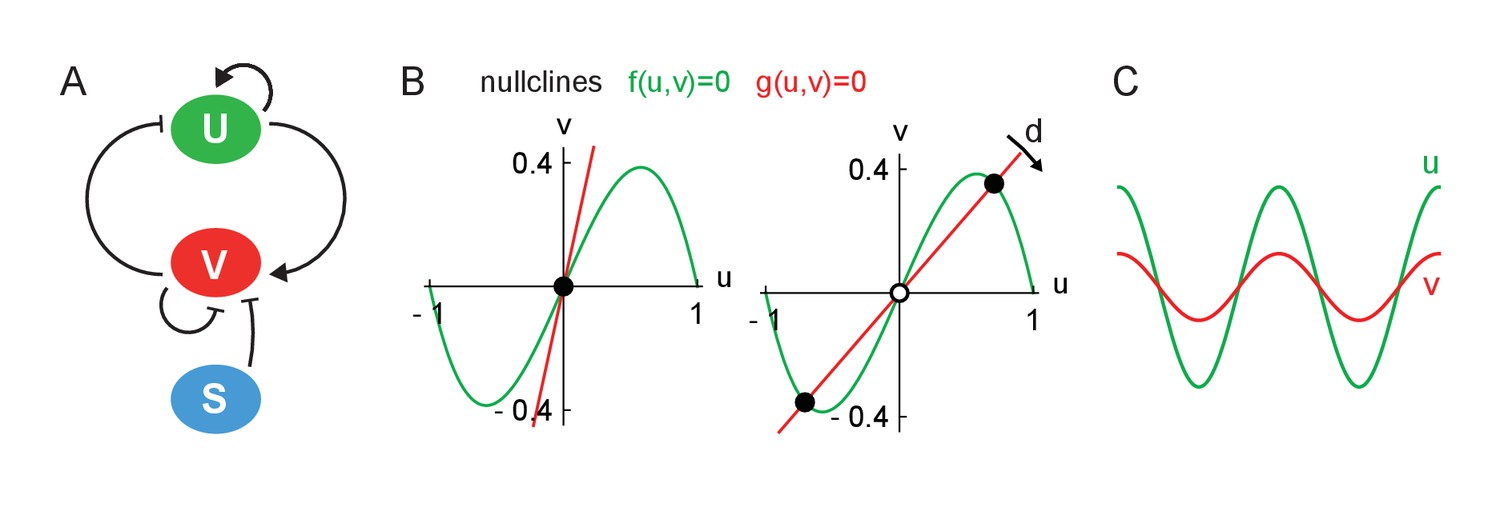
Theory schematics.
(A) Scheme of the reactions between the activator U, the inhibitor V and the inhibitor sinks S. Pointed arrows indicate activation and blunt arrows inhibition. (B) Nullcline plots for the homogeneous theory showing a situation with three fixed points (left panel) and only one fixed point (right panel). Full dots are stable fixed points and open dots are unstable fixed points. (C) Pattern type generated by diffusion instability for the class of nullcline crossing displayed in right panel in (B), in which the activator u (green) and inhibitor v (red) coexist in space.
Figure 7—figure supplement 2
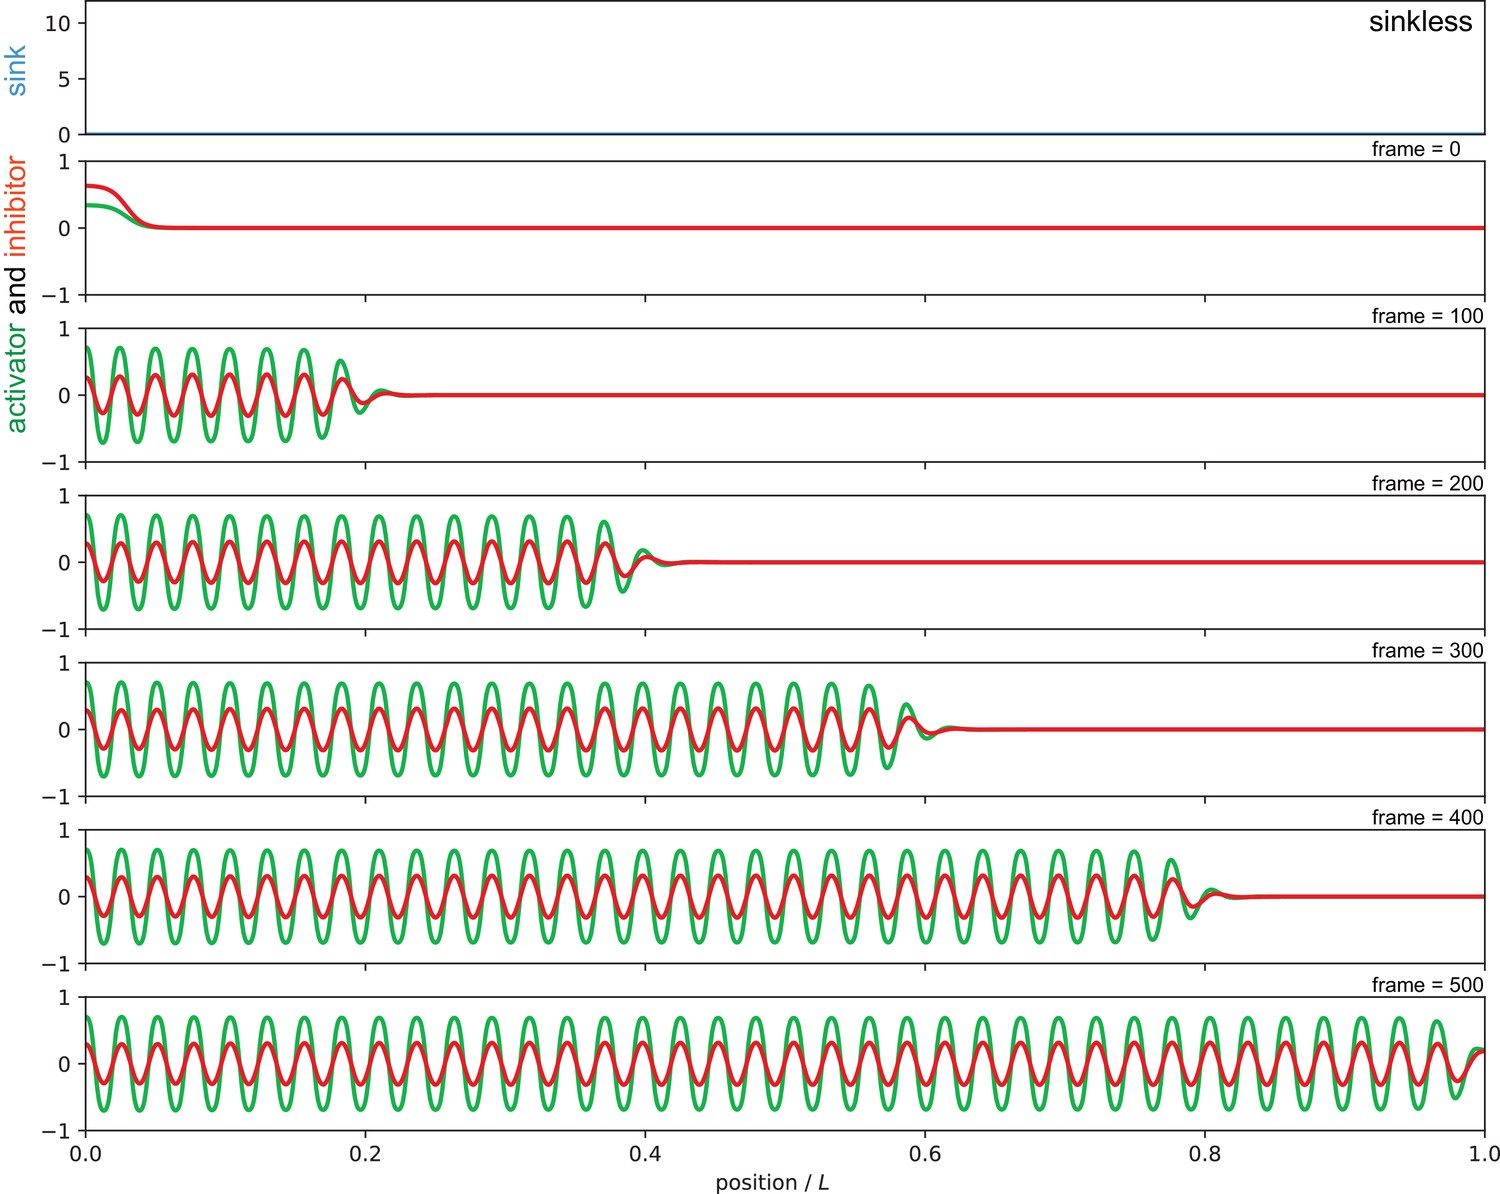
Sequence of snapshots from Video 1 showing simulation of the autonomous sinkless condition, in which patterning occurs sequentially from anterior to posterior.
The absence of sink profile (blue) in the top panel and corresponding activator (green) and inhibitor (red) patterns in a sequence of snapshots from the simulation for the sinkless condition. Parameters as in Figure 7 of the main text.
Figure 7—figure supplement 3
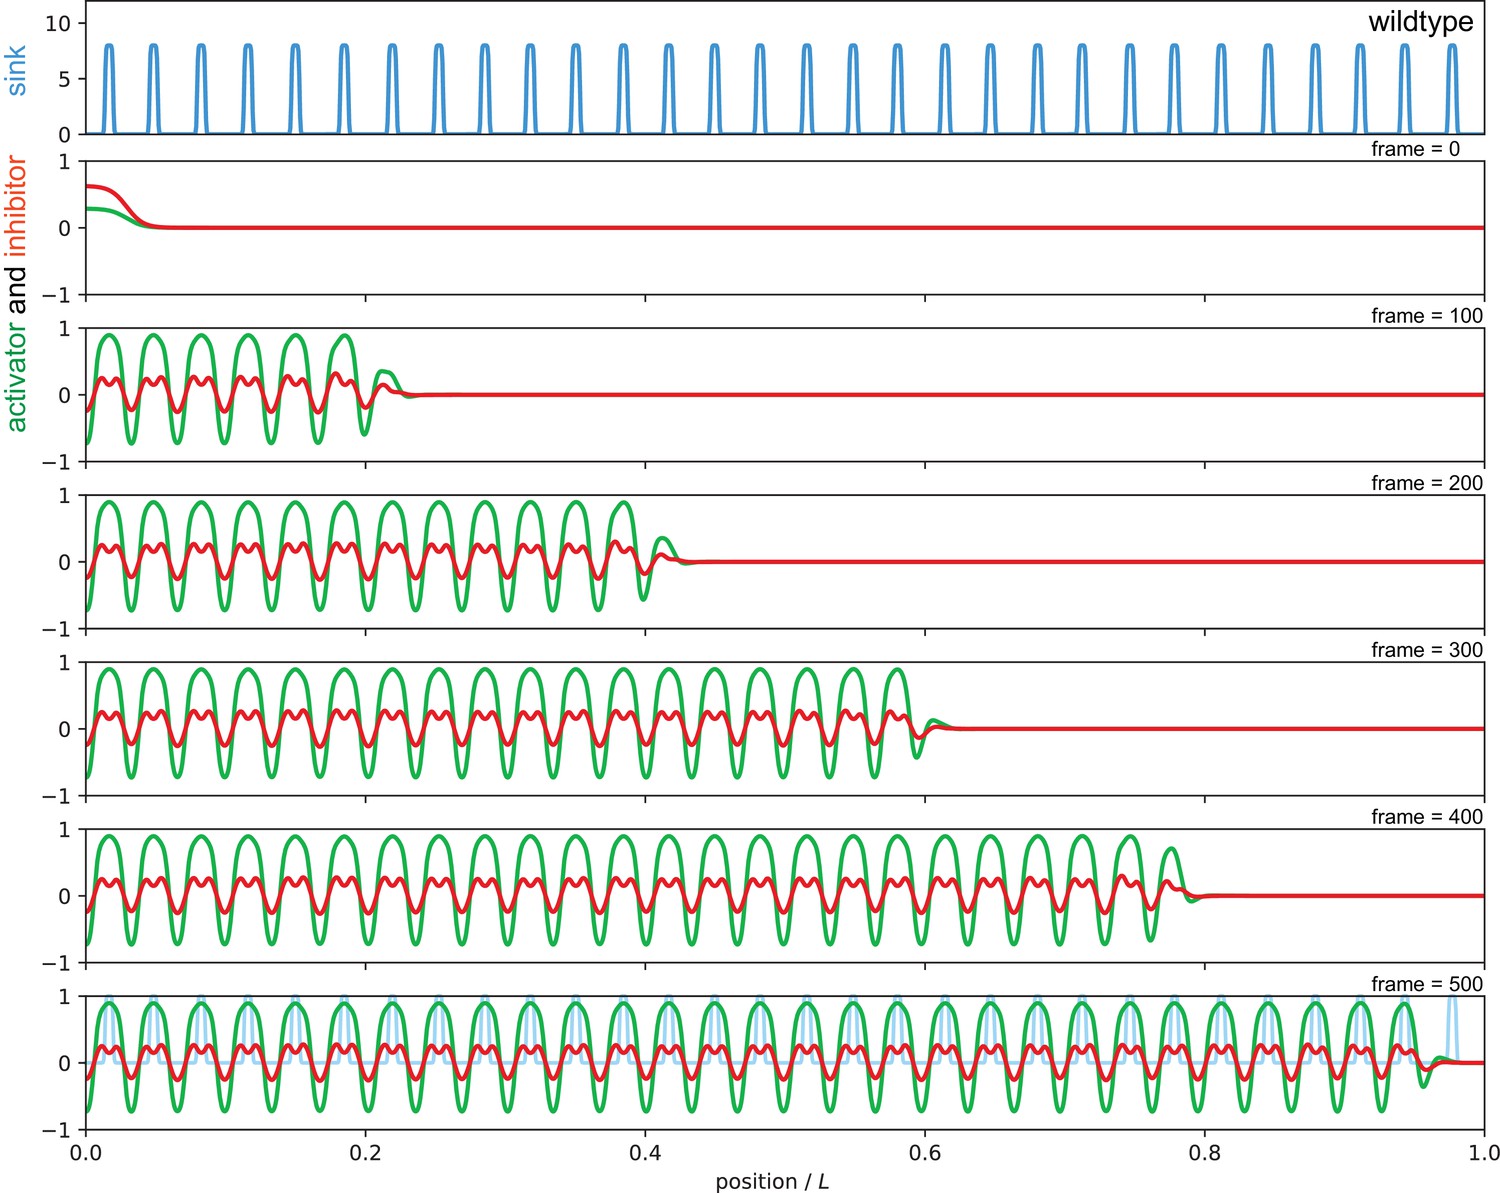
Sequence of snapshots from Video 2 showing simulation of the wild type condition.
The sink profile (blue) for the wild type condition in the top panel and corresponding activator (green) and inhibitor (red) patterns. Parameters as in Figure 7 of the main text.
Figure 7—figure supplement 4
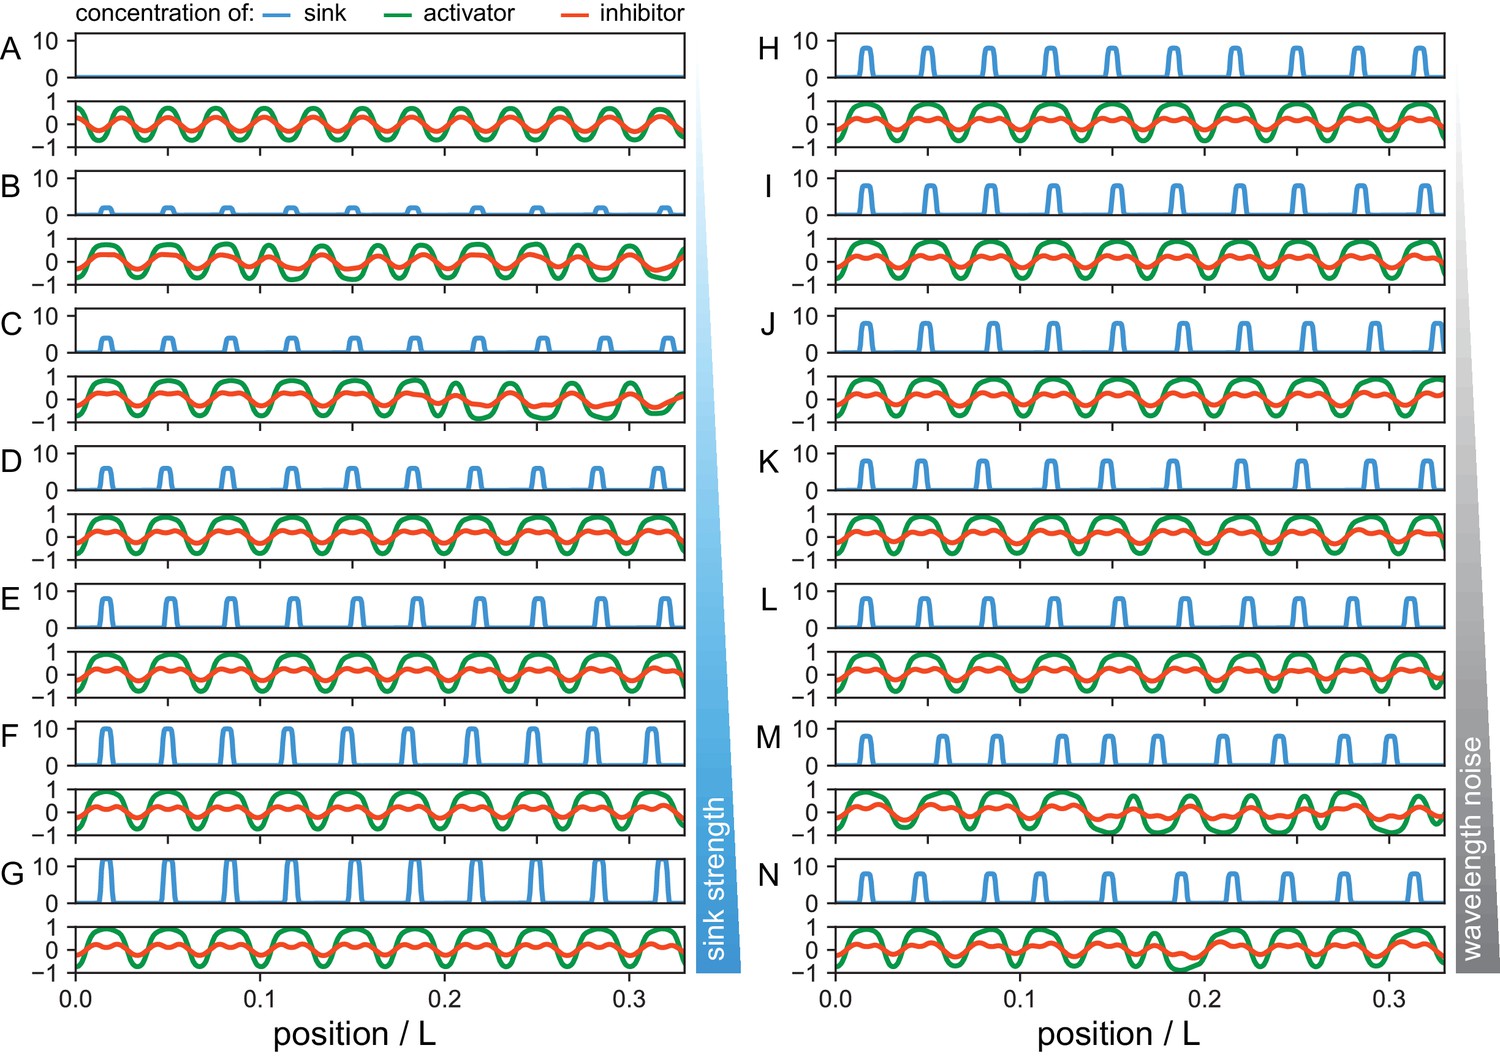
Theoretical effects of sink strength and sink wavelength noise on notochord patterning mechanism.
Steady state concentration of the activator (green) and inhibitor (red) for different sink profiles (blue) as indicated. (A–G) Increasing sink strength S0. For vanishing sinks S0 = 0 the patterning mechanism is free from external perturbations and progresses without noise in a deterministic way, giving rise to regular shorter segments. As sink strength S0 is increased, the reaction diffusion mechanism fails to match some sink positions, giving rise to some shorter segments in the activator pattern. For stronger sinks the sink profile is able to pin the position of activator peaks. (H–N) As noise in sink positions σ is increased, the distance between sinks in the sink profile can be either too short or too large for the intrinsic reaction diffusion system to cope with, giving rise to sink skipping and intercalations in the activator pattern. Parameters: a = 10−3, b = 10−2, τ = 0.1, d = 0.5. Sink profile parameters: (A–N) λ = 0.57, (A–G) σ = 0.05, (A) S0 = 0, (B) S0 = 2, (C) S0 = 4, (D) S0 = 6, (E) S0 = 8, (F) S0 = 10, (G) S0 = 12, (H–N) S0 = 8, (H) σ = 0.00, (I) σ = 0.05, (J) σ = 0.10, (K) σ = 0.15, (L) σ = 0.20, (M) σ = 0.25, (N) σ = 0.30.
Figure 7—figure supplement 5
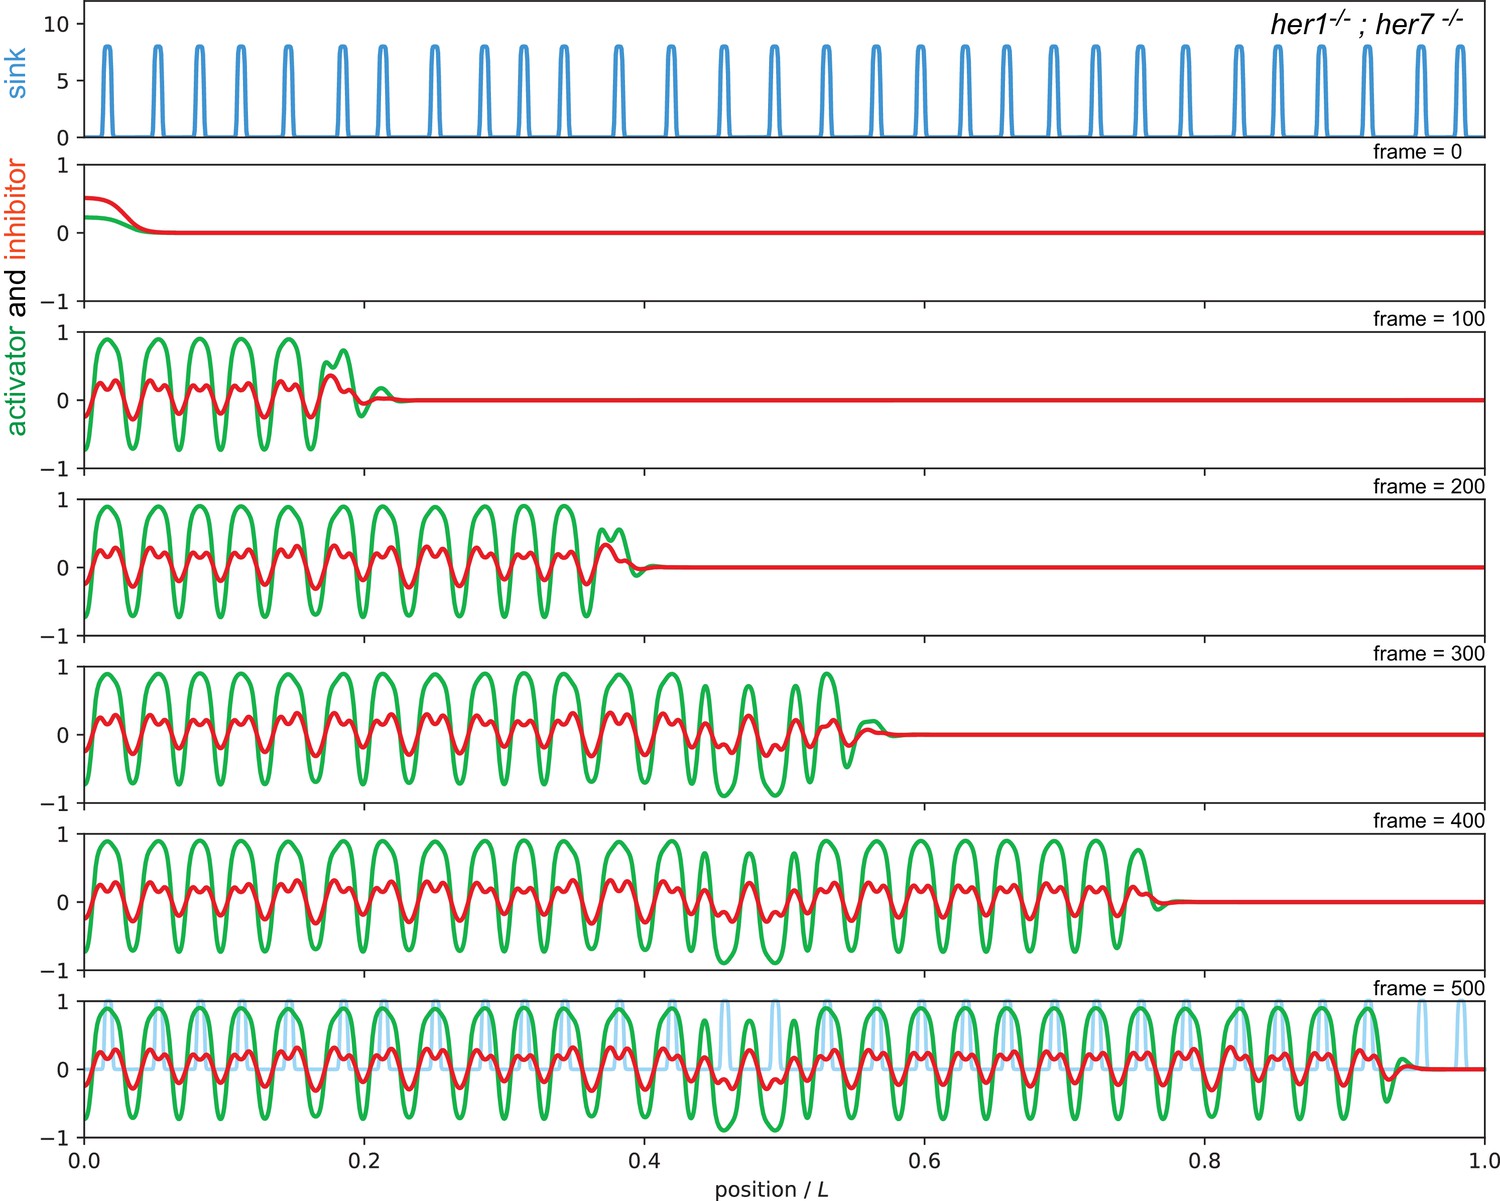
Sequence of snapshots from Video 3 showing simulation of the her1;her7 mutant condition.
The sink profile (blue) representing the noisy spatial distribution of the her1;her7 mutant in the top panel and corresponding activator (green) and inhibitor (red) patterns. Parameters as in Figure 7 of the main text.
Figure 7—figure supplement 6
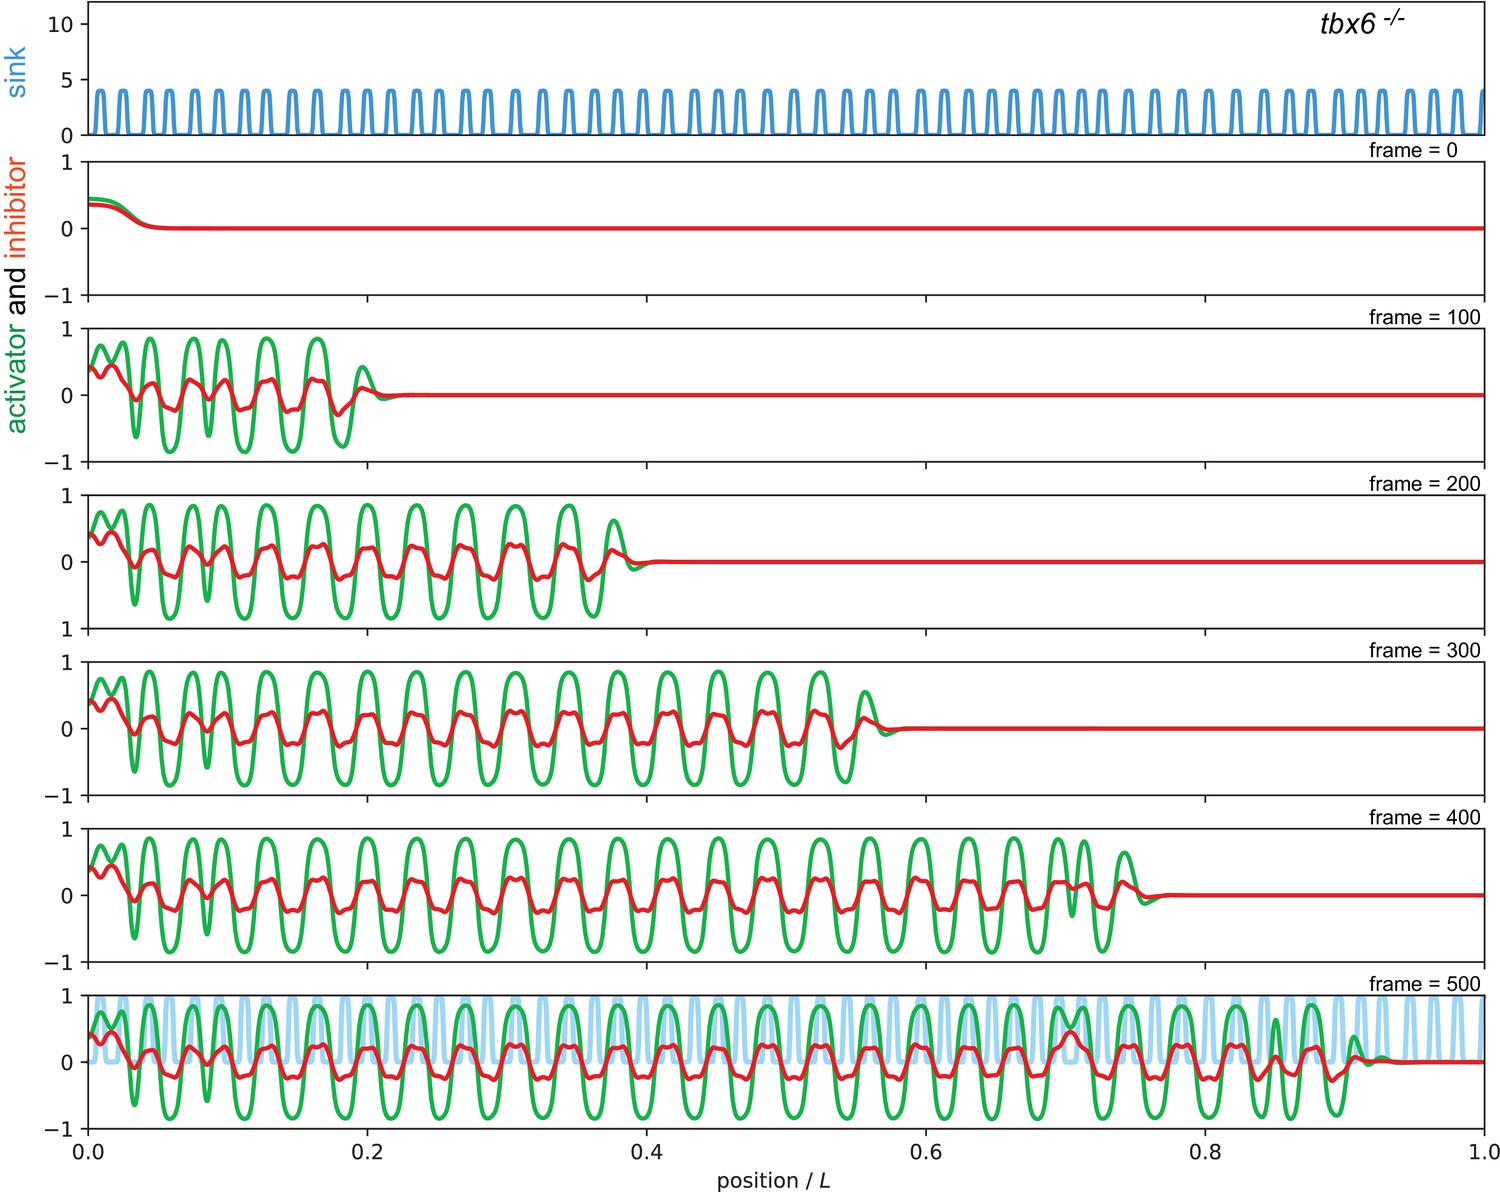
Sequence of snapshots from Video 4 showing simulation of the tbx6 mutant condition.
The sink profile (blue) representing the noisy spatial distribution and the reduced amplitude of sinks in the tbx6 mutant in the top panel and corresponding activator (green) and inhibitor (red) patterns. This simulation also represents the her1;her7;tbx6 mutant. Parameters as in Figure 7 of the main text.
Figure 7—figure supplement 7
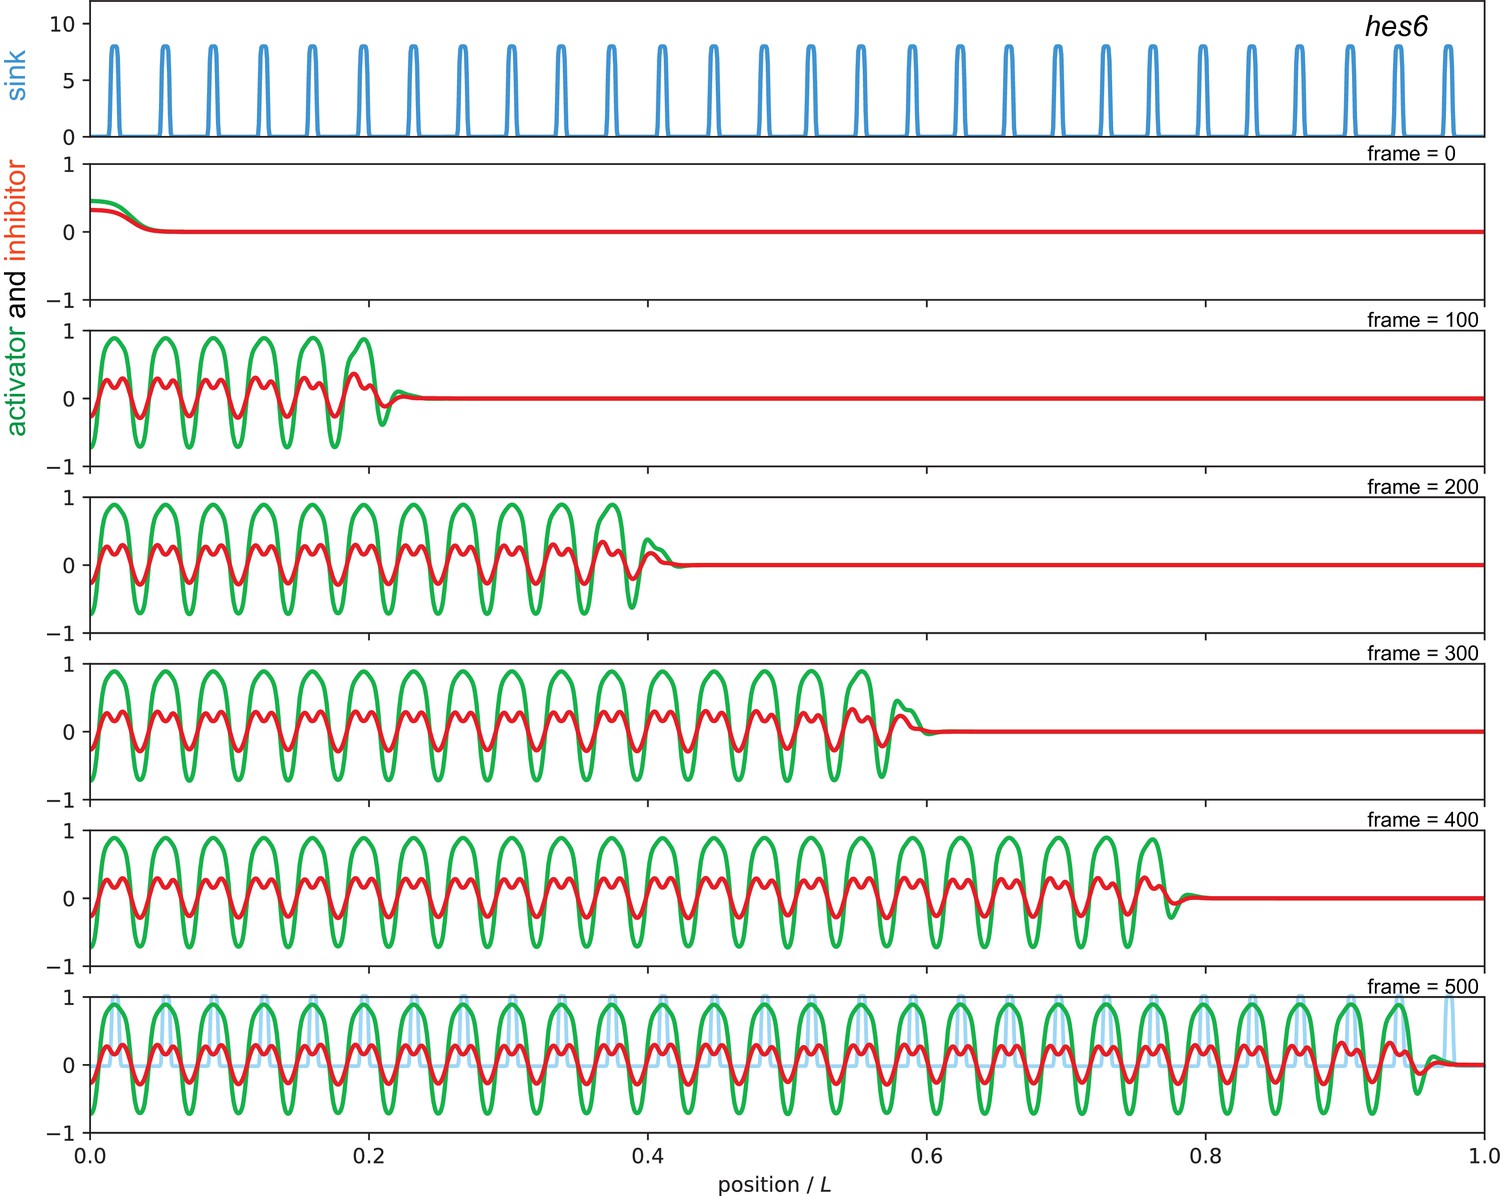
Sequence of snapshots from Video 5 showing simulation of the hes6 mutant condition.
The sink profile (blue) representing the longer spatial wavelength of sinks in the hes6 mutant in the top panel and corresponding activator (green) and inhibitor (red) patterns. Parameters as in Figure 7 of the main text.
Figure 7—figure supplement 8
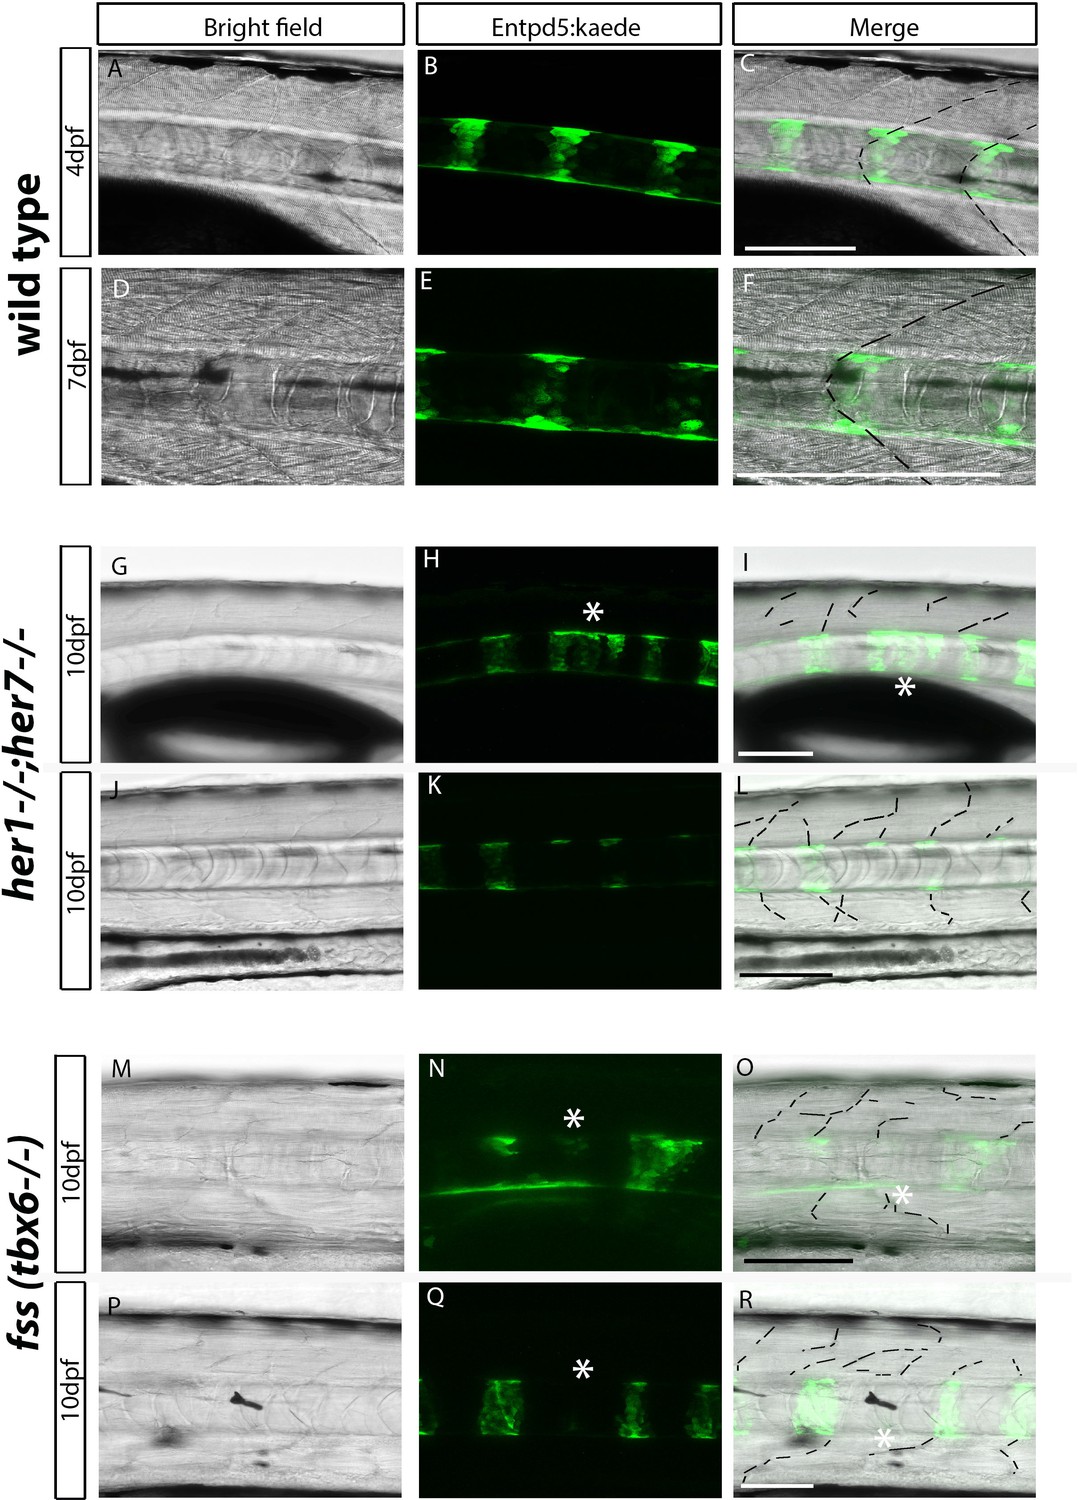
Chordacentra always align with the myotome boundaries in wild type larvae, but not in mutants.
(A-R) Live confocal images of entpd5:Kaede in the trunk of wild type, her1−/−;her7−/− and fss (tbx6−/−) larvae, in lateral view, anterior to the left. (A-F) Live images at 4 dpf and 7 dpf show entpd5:kaede positive notochord segments (B and E) are aligned with the myotome boundary (A and D) in wild types. In her1;her7 (G-L) and tbx6 (M-R) mutants at 10 dpf, the myotome boundaries are disrupted and are no longer in strict alignment with the entpd5:kaede segment. Asterisks (*) denote defects in axial segmentation; dashed lines trace myotome boudaries and boudary fragments. Scale bars are 100 µm.
Figure 7—figure supplement 9
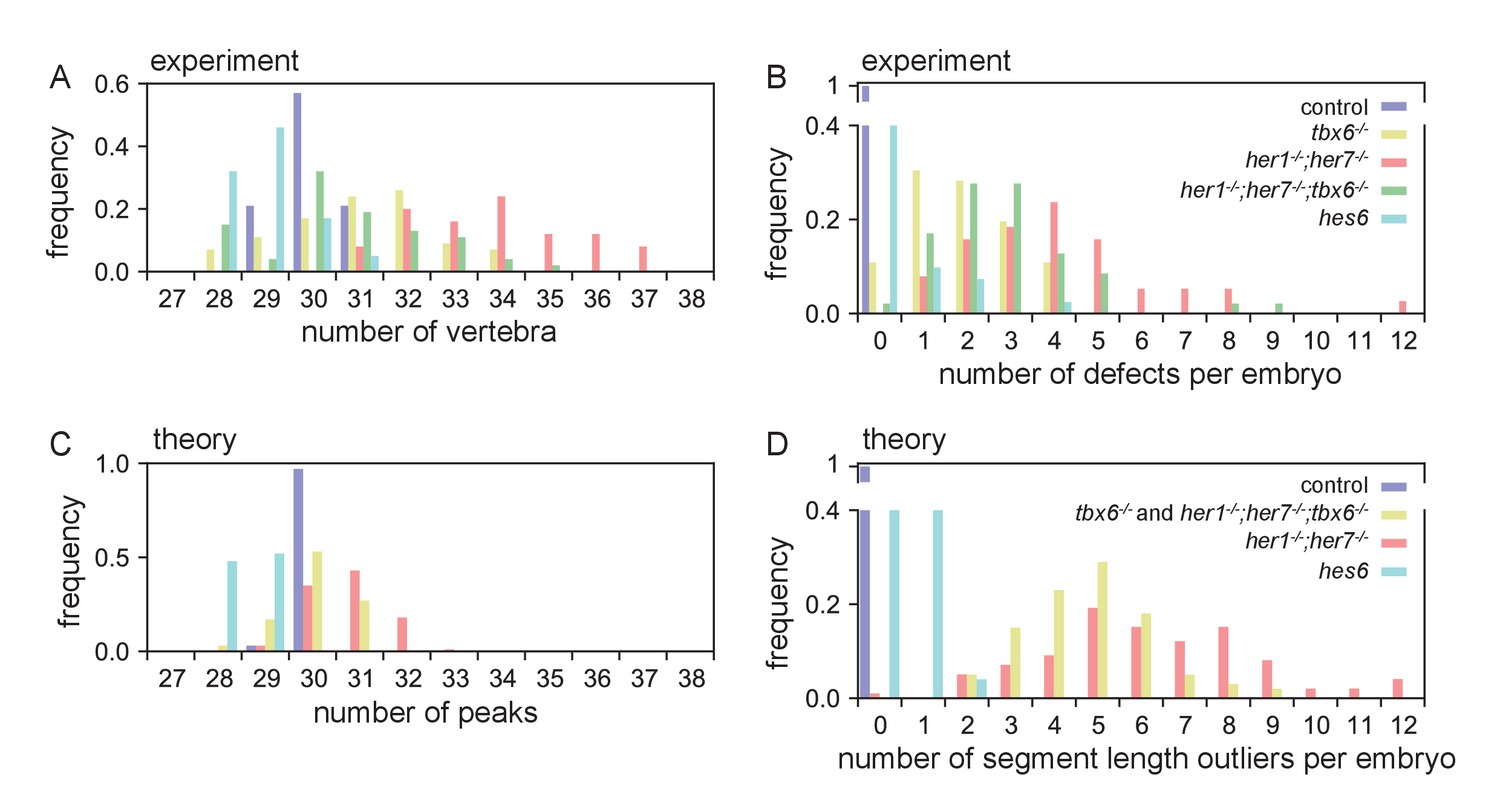
Quantification of mutant phenotype observables and comparison to theoretical description.
(A) The number of entpd5+ segments at 28 dpf, including smaller vertebrae, is increased in mutants. (B) At 28 dpf her1−/−;her7−/− have the highest number of segmentation defects, which is partially rescued to tbx6−/− levels in her1−/−;her7−/−;tbx6−/−. (C) Histograms of the number of peaks in the activator pattern and (D) number of segment length outliers, quantifying the number of defects, for conditions simulating the mutants with parameters defined in Figure 7. Histograms were computed over 50 realizations.
Author response image 1
Videos
Video 1
Simulation of the autonomous sinkless condition.
The absence of sink profile (blue) in the top panel and corresponding activator (green) and inhibitor (red) patterns in the bottom with patterning occurring sequentially from anterior to posterior. Parameters as in Figure 7 of the main text.
Video 2
Simulation of the wild type condition.
The sink profile (blue) for the wild type condition in the top panel and corresponding activator (green) and inhibitor (red) patterns in the bottom. Parameters as in Figure 7 of the main text.
Video 3
Simulation of the her1;her7 mutant condition.
The sink profile (blue) showing the noisy spatial distribution for the her1;her7 mutant condition in the top panel and corresponding activator (green) and inhibitor (red) patterns in the bottom. Parameters as in Figure 7 of the main text.
Video 4
Simulation of the tbx6 mutant condition.
The sink profile (blue) representing the noisy spatial distribution and the reduced amplitude of sinks in the tbx6 mutant in the top panel and corresponding activator (green) and inhibitor (red) patterns in the bottom. This simulation also represents the her1;her7;tbx6 mutant. Parameters as in Figure 7 of the main text.
Video 5
Simulation of the hes6 mutant condition.
The sink profile (blue) representing the longer spatial wavelength of sinks in the hes6 mutant in the top panel and corresponding activator (green) and inhibitor (red) patterns in the bottom. Parameters as in Figure 7 of the main text.
Tables
Key resources table
| Reagent type or resource | Designation | Source or reference | Identifiers | Additional information |
|---|---|---|---|---|
| Gene (Danio rerio) | sagff214 | NA | ||
| Gene (Danio rerio) | entpd5 | NA | ||
| Gene (Danio rerio) | her1 | NA | ||
| Gene (Danio rerio) | her7 | NA | ||
| Gene (Danio rerio) | tbx6 | NA | ||
| Gene (Danio rerio) | hes6 | NA | ||
| Gene (Danio rerio) | deltaD | NA | ||
| Gene (Danio rerio) | deltaC | NA | ||
| Gene (Danio rerio) | osterix | NA | ||
| Genetic reagent | ||||
| Genetic reagent (Danio rerio) | Tg(entpd5:kaede) | Geurtzen et al., 2014 doi: 10.1242/dev.105817 | hu6867 | Same BAC used as Huitema et al., 2012 with kaede insertion at first translated ATG |
| Genetic reagent (Danio rerio) | Tg(entpd5:pkred) | This paper | hu7478 | Same BAC used as Huitema et al., 2012 with pkred insertion at first translated ATG |
| Genetic reagent (Danio rerio) | Tg(SAGFF214:GFP) | Yamamoto et al., 2010 DOI: 10.1242/dev.051011 | ||
| Genetic reagent (Danio rerio) | Osterix:mcherry | Spoorendonk et al., 2008 DOI: 10.1242/dev.024034 | hu4008 | |
| Genetic reagent (Danio rerio) | her1 | Schröter et al., 2012 doi: 10.1371/journal.pbio.1001364 | hu2124 | |
| Genetic reagent (Danio rerio) | her7 | Schröter et al., 2012 doi:10.1371/journal.pbio.1001364 | hu2526 | |
| Genetic reagent (Danio rerio) | tbx6 | Busch-Nentwich et al., 2013 ZFIN ID: ZDB-PUB-130425–4 | sa38869 | |
| Genetic reagent (Danio rerio) | hes6 | Schröter and Oates, 2010 doi: 10.1016/j.cub.2010.05.071 | zm00012575Tg | Also called zf288Tg |
| Genetic reagent (Danio rerio) | deltaD | van Eeden et al., 1996 PMID: 9007237 | ar33 | Also called tr233 |
| Genetic reagent (Danio rerio) | deltaC | van Eeden et al., 1996 PMID: 9007237 | tm98 | |
| Recombinant DNA reagent (plasmid) | ||||
| Plasmid (Danio rerio) | her7 | Oates and Ho, 2002 | ||
| Plasmid (Danio rerio) | mespb | Sawada et al., 2000 | ||
| Plasmid (Danio rerio) | xirp2a | Deniziak et al., 2007 | ||
| Plasmid (Danio rerio) | papc | Yamamoto et al., 1998 | ||
| Plasmid (Danio rerio) | en2a | Erickson et al., 2007 | ||
| Plasmid (Danio rerio) | ripply1 | PCR template: Rip1 F (CGTGGCTTGTGACCAGAAAAG) Rip1 R T7 325 (TAATACGACTCACTATAGGCT GTGAAGTGACTGTTGTGT) | ||
| Plasmid (Danio rerio) | ripply2 | PCR template: Rip2 F(ACGCGAATCAACCCTGGAGA) and Rip2 R T7 281 (AATACGACTCACTATAGGGAGA GAGCTCTTTCTCGTCCTCTTCAT) | ||
| Plasmid (Danio rerio) | dlc | Oates and Ho, 2002 | ||
| Plasmid (Danio rerio) | her1 | Müller et al., 1996 | ||
| Sequence-based reagent | ||||
| Talen | hes6 | this paper | See Figure 1, Figure 1—figure supplement 1 | |
| Talen | her1 | this paper | See Figure 1, Figure 1—figure supplement 1 | |
| Commercial assay or kit | ||||
| Commercial assay or kit | RNeasy MinElute Cleanup Kit | Qiagen | Cat No./ID: 74204 | |
| Commercial assay or kit | Gene jet plasmid (miniprep kit) | Thermo scientific | Cat no: K0502 | |
| Chemical compound, drug | ||||
| Chemical compound, drug | Alizarin red | Sigma | CAS Number 130-22-3 | |
| Software, algorithm | ||||
| Software, algorithm | LAS X | Leica microsystems | ||
| Software, algorithm | Fiji (RRID:SCR_002285) | ImageJ 1.51 n | ||
| Software, algorithm | Python (RRID:SCR_008394) | Version Python 2.7.14: : Anaconda custom (64-bit) | ||
| Software, algorithm | Libraries: numpy (RRID:SCR_008633), matplotlib (RRID:SCR_008624) | Anaconda distribution | ||
| Software, algorithm | Lleras_fhn_1d_ solve_and_animate_ eLife.py | This paper | Custom PDE solver and animator | Provided as supplementary data. |
| Software, algorithm | Spyder | Anaconda distribution, Spyder 3.2.6 | The Scientific PYthon Development EnviRonment |
Table 1
Genotyping of lines using sequencing or restriction enzyme digestion
https://doi.org/10.7554/eLife.33843.036| Zebrafish line | FW | RV | Restriction enzymes |
|---|---|---|---|
| her1 | TCTAGCAAGGACACGCATGA | GATGAAGAGGAGTCGGTGGA | |
| her7 | GATGAAAATCCTGGCACAGACT | TCTGAATGCAGCTCTGCTCG | |
| hes6 | TCACGACGAGGATTATTACGG | GGGCGACAACGTAGCGTA | NHEI |
| her1−/−;her7−/− and her1−/−;her7−/−;tbx6 −/− | ACTCCAAAAATGGCAAGTCG | GCCAATTCCAGAATTTCAGC | AGEI |
| aei | AGGGAAGCTACACCTGCTCA | TTCTCACAGTTGAATCCAGCA | |
| fss | GGGTCATTGTTGGGTTGCA | ATGAACACCGCCCTTCCAAT |
Table 2
Genotyping using Kaspar
https://doi.org/10.7554/eLife.33843.037| Zebrafish line | FW X | FW Y | RV |
|---|---|---|---|
| bea | GAAGGTGACCAAGTTCATGCT | GAAGGTCGGAGTCAACGGATT | AGTCCTTGCCTGACAAACCAA |
Additional files
-
Source code 1
Custom python code.
- https://doi.org/10.7554/eLife.33843.038
-
Transparent reporting form
- https://doi.org/10.7554/eLife.33843.039
Download links
A two-part list of links to download the article, or parts of the article, in various formats.
Downloads (link to download the article as PDF)
Open citations (links to open the citations from this article in various online reference manager services)
Cite this article (links to download the citations from this article in formats compatible with various reference manager tools)
Segmentation of the zebrafish axial skeleton relies on notochord sheath cells and not on the segmentation clock
eLife 7:e33843.
https://doi.org/10.7554/eLife.33843


