Differential temporal dynamics during visual imagery and perception
- Radboud University, Netherlands
Figures
Figure 1
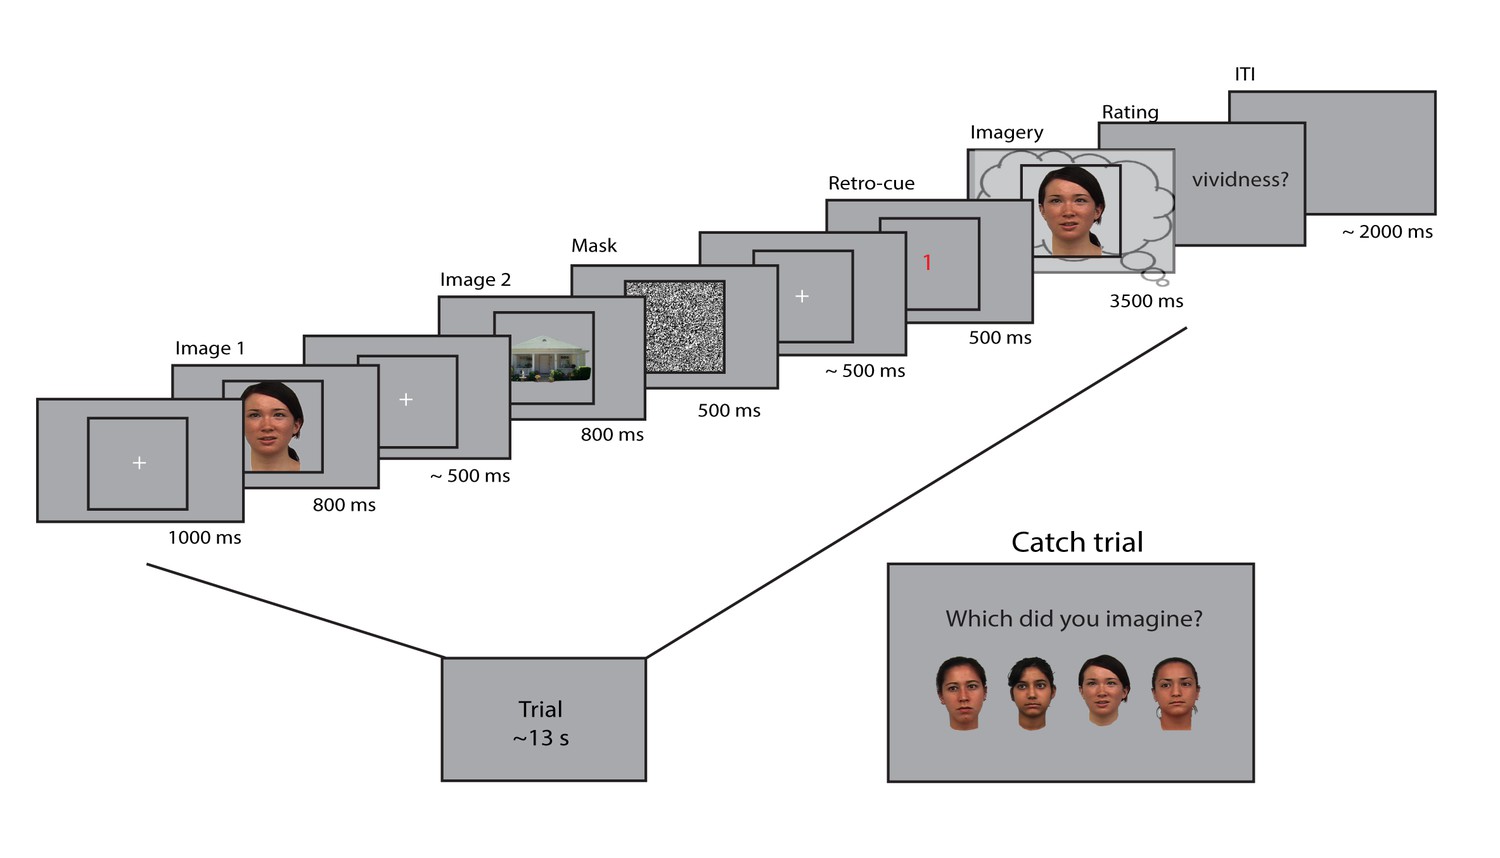
Experimental design.
Two images were presented for 0.8 seconds each, with a random inter-stimulus interval (ISI) between 400 and 600 ms. After the second image, a mask with random noise was on screen for 500 ms. The retro-cue indicating which of the two images the participants had to imagine was shown for 500 ms. Subsequently, a frame was presented for 3.5 s within which the participants imagined the cued stimulus. After this, they rated their experienced vividness on a continuous scale. On a random subset (7%) of trials, the participants indicated which of four exemplars they imagined that trial. The face stimuli were adapted from the multiracial face database (courtesy of Michael J Tarr, Center for the Neural Basis of Cognition and Department of Psychology, Carnegie Mellon University (http://www.tarrlab.org) and available at http://wiki.cnbc.cmu.edu/Face_Place under a Creative Commons Attribution-NonCommercial-ShareAlike 3.0 Unported License (https://creativecommons.org/licenses/by-nc-sa/3.0/)).
Figure 2 with 3 supplements
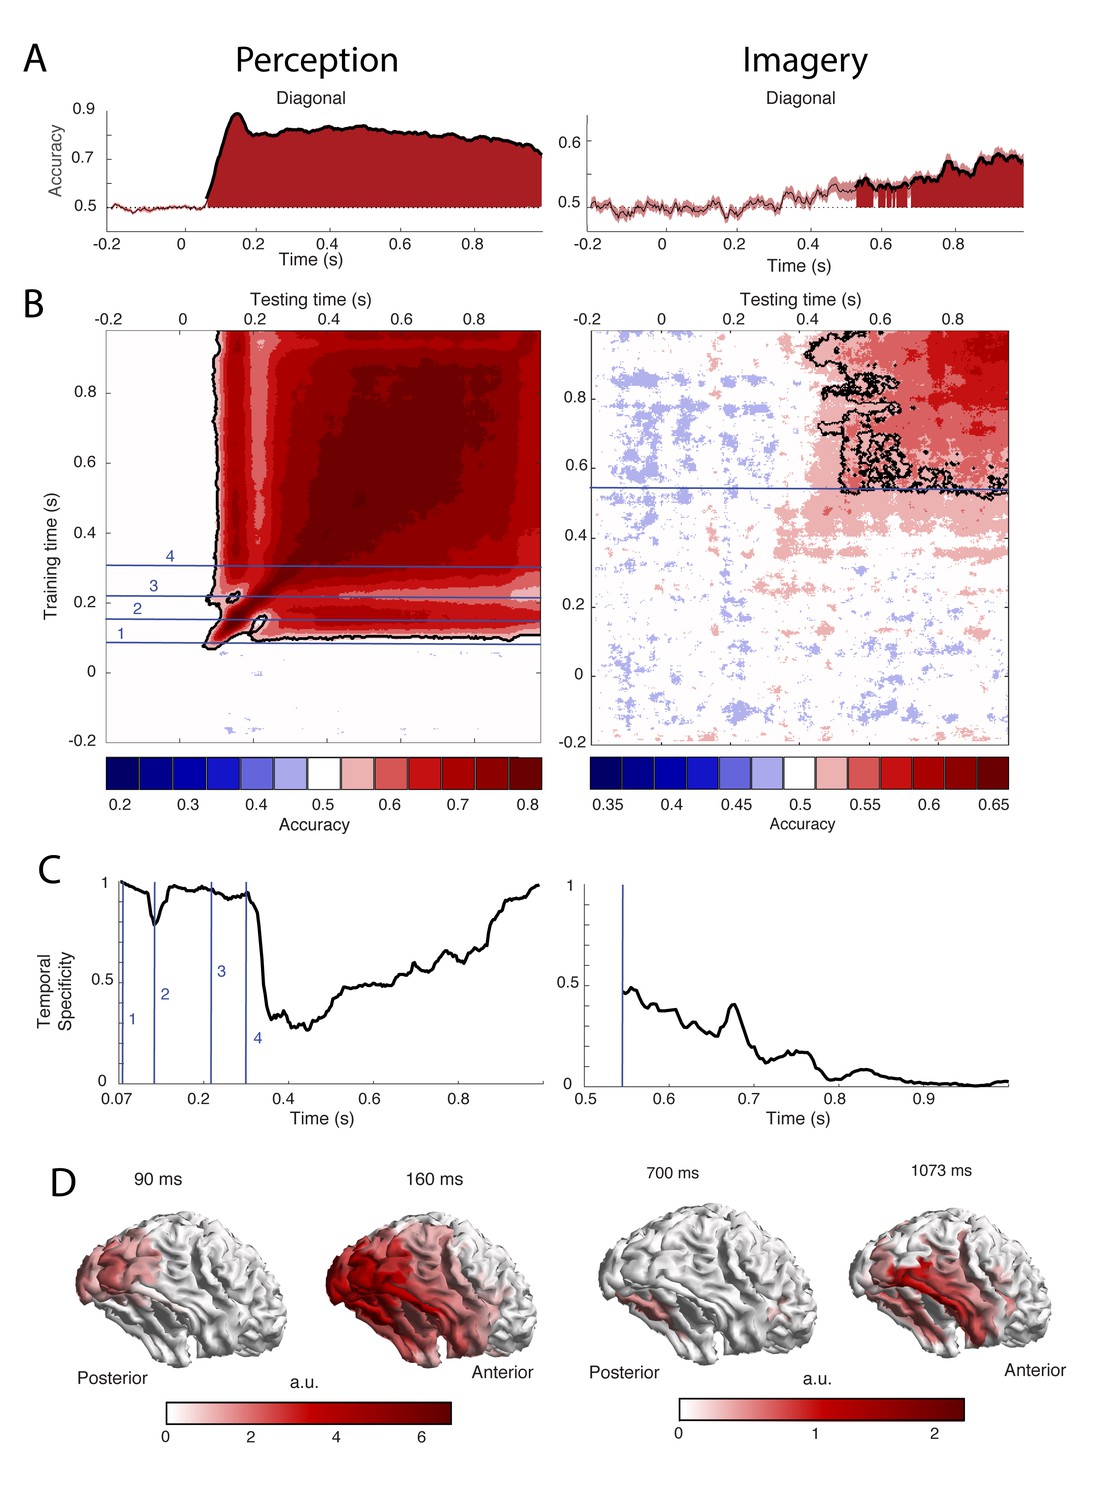
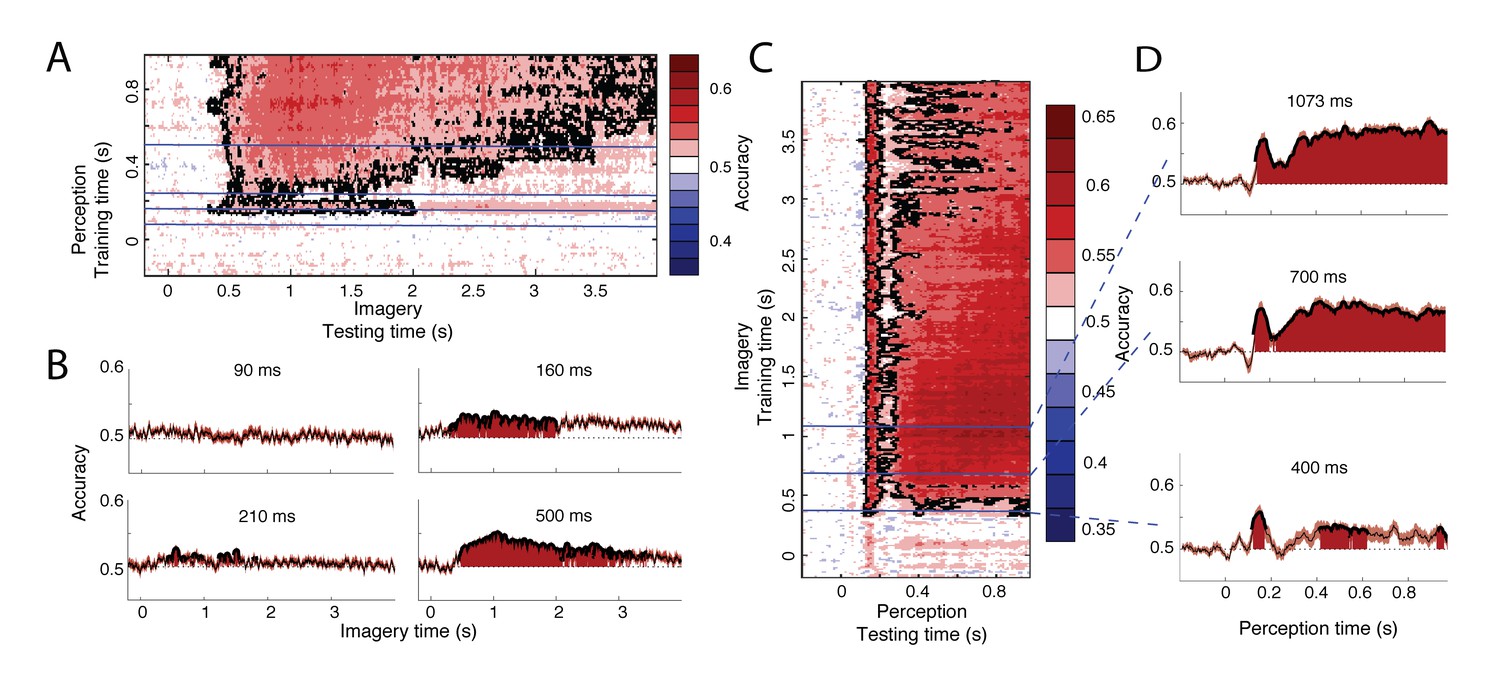
Decoding performance of perception and imagery over time.
(A) Decoding accuracy from a classifier that was trained and tested on the same time points. Filled areas and thick lines indicate significant above chance decoding (cluster corrected, p<0.05). The shaded area represents the standard error of the mean. The dotted line indicates chance level. For perception, zero signifies the onset of the stimulus, for imagery, zero signifies the onset of the retro-cue. (B) Temporal generalization matrix with discretized accuracy. Training time is shown on the vertical axis and testing time on the horizontal axis. Significant clusters are indicated by black contours. Numbers indicate time points of interest that are discussed in the text. (C) Proportion of time points of the significant time window that had significantly lower accuracy than the diagonal, that is specificity of the neural representation at each time point during above chance diagonal decoding (D) Source level contribution to the classifiers at selected training times. Source data for the analyses reported here are available in Figure 2—source data 1.
-
Figure 2—source data 1
Temporal dynamics within perception and imagery.
The files '...Acc.mat' contain the subjects x time x time decoding accuracy within perception and imagery. The files '...Sig.mat' contain the time x time cluster p values of the comparison of these accuracies with chance level.
- https://doi.org/10.7554/eLife.33904.008
-
Figure 2—source data 2
Decoding from eye tracker data.
The file '..eyeAcc.mat' contains the subject x time decoding accuracies from the x and y eye tracker channels within perception and imagery. The file '.. EyeSig.mat' contains the cluster based p values of these accuracies compared to chance level.
- https://doi.org/10.7554/eLife.33904.009
-
Figure 2—source data 3
Vividness median split.
The file '...ImaVivSplit.mat contains the subjects x time x time decoding accuracy within imagery for the high vividness and low vividness group and the time x time p values of the comparison between the two groups. The file '...PercVivSplit.mat' contains the same for the decoding within perception.
- https://doi.org/10.7554/eLife.33904.010
Figure 2—figure supplement 1
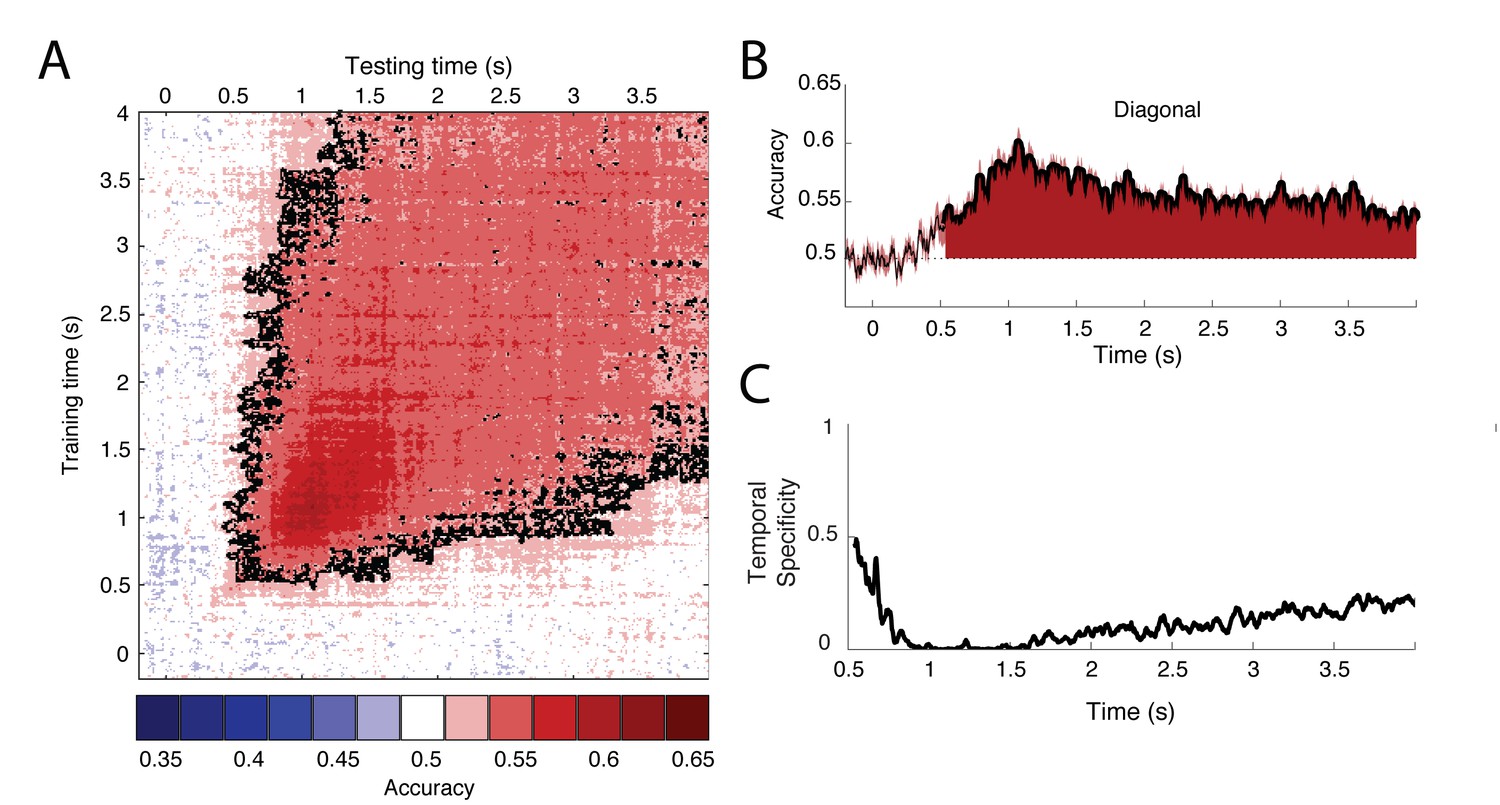
Decoding results throughout the entire imagery period.
(A) Temporal generalization matrix. Training time is shown on the vertical axis and testing time on the horizontal axis. (B) Decoding accuracy from a classifier that was trained and tested on the same time points during imagery. (C) For each testing point, the proportion of time points that resulted in significantly lower accuracy than the diagonal decoding at that time point, that is the temporal specificity of the representations over time. Source data for the analyses reported here are available in Figure 2—source data 1.
Figure 2—figure supplement 2
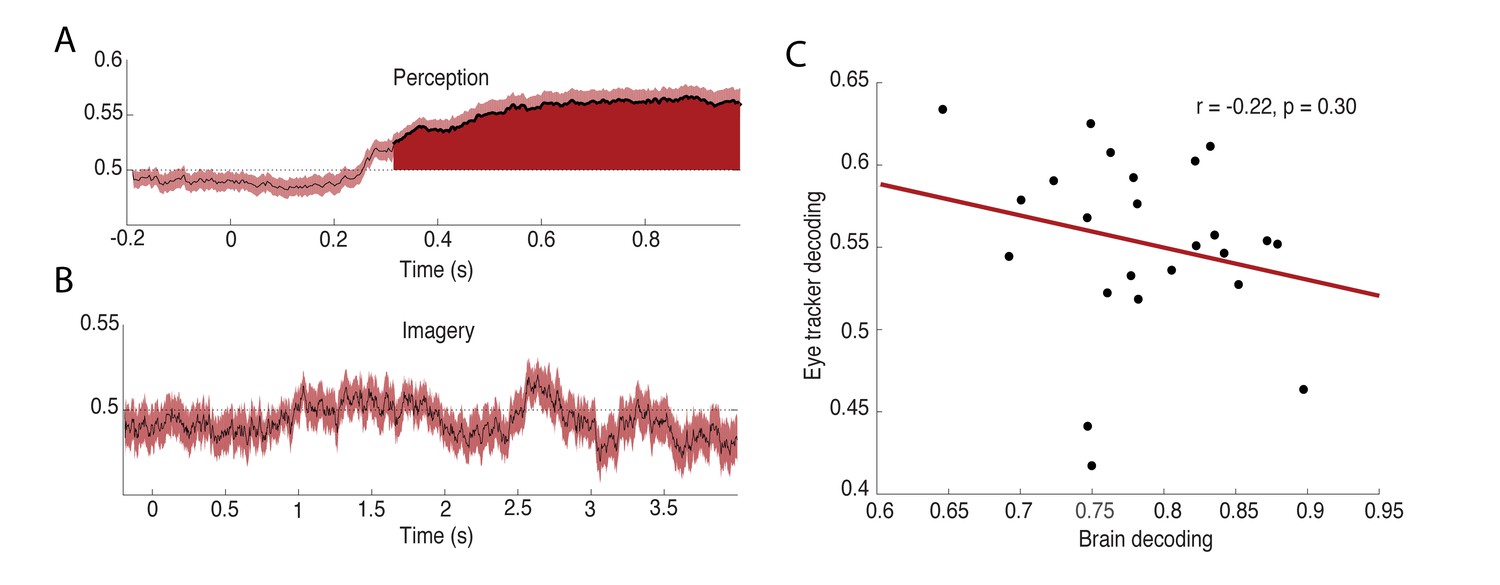
Decoding on eye tracker data.
(A) Decoding accuracy over time on eye tracker data during perception. Filled areas and thick lines indicate significant above chance decoding (cluster corrected, p<0.05). The shaded area represents the standard error of the mean. The dotted line indicates chance level. (B) Decoding accuracy over time on eye tracker data during imagery. (C) Correlation over participants between eye tracker decoding accuracy and brain decoding accuracy, averaged over the period during which eye tracker decoding was significant. Source data for the analyses reported here are available in Figure 2—source data 2.
Figure 2—figure supplement 3
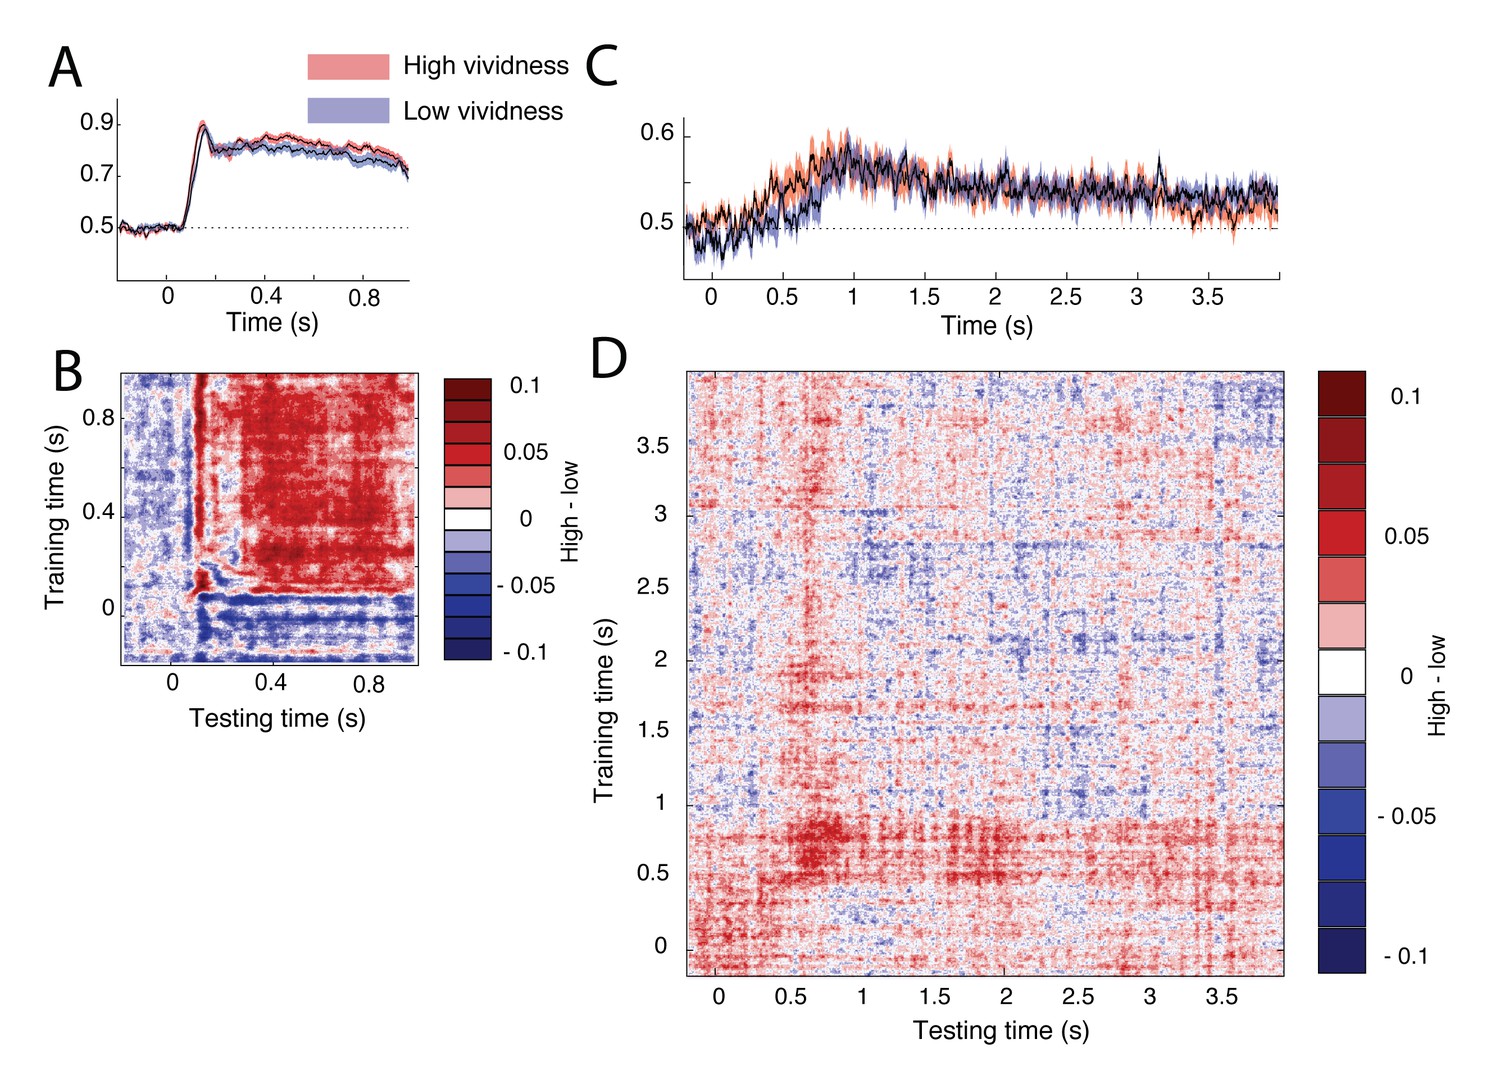
Differences in decoding accuracy between high and low vivid participants during perception and imagery.
None of the differences were significant after correction for multiple comparisons. (A) Decoding accuracy from a classifier that was trained and tested on the same time points during perception and (C) during imagery. The red line denotes the accuracy for the high vividness group, the blue line the accuracy for the low vividness group. (B) Difference between participants with high and low vividness on temporal generalization accuracy during perception (B), and (D) imagery. Reddish colors indicate higher accuracy for the high vividness group and blueish colors indicate higher accuracy for the low vividness group. Source data for the analyses reported here are available in Figure 2—source data 3.
Figure 3 with 1 supplement
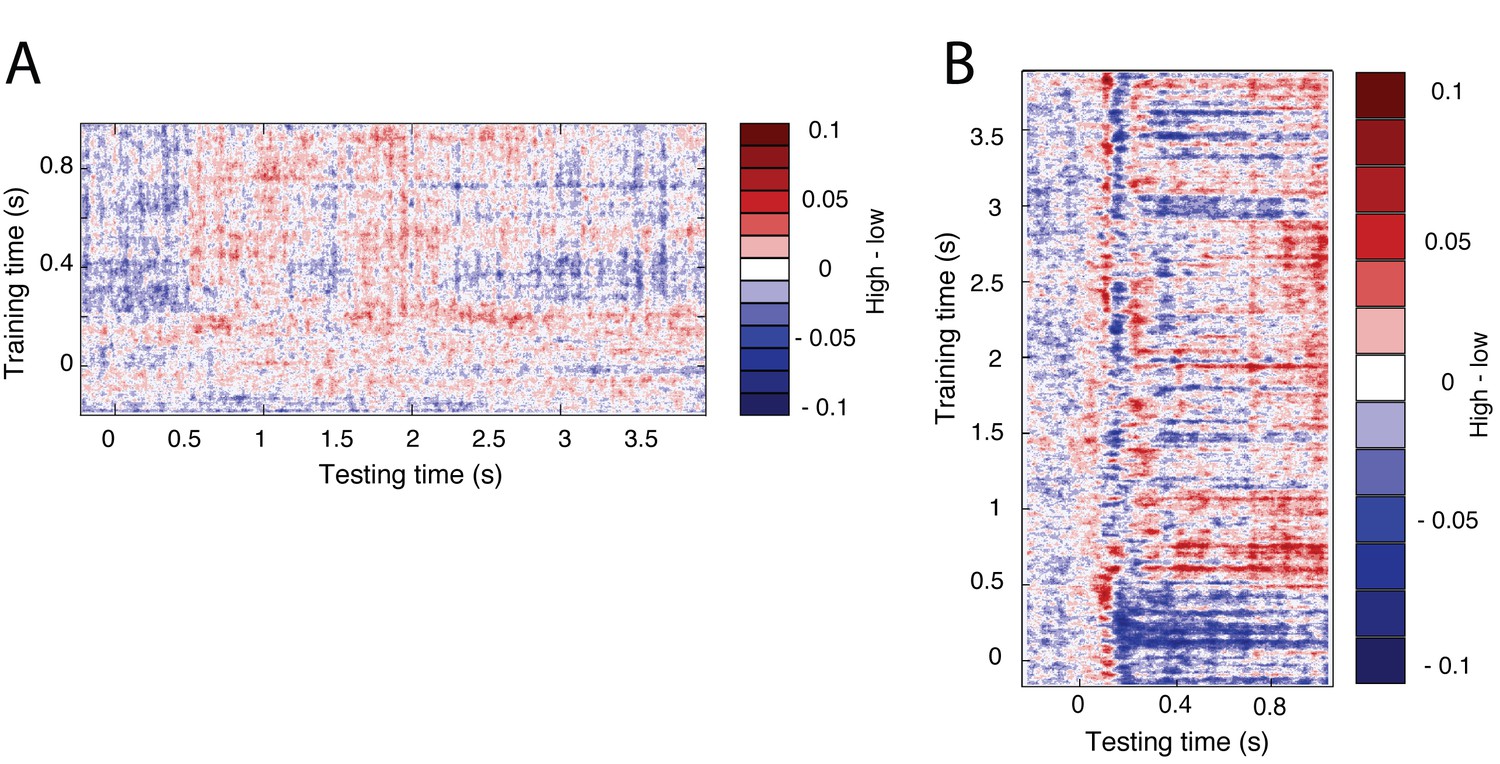
Generalization between perception and imagery over time.
(A) Decoding accuracy from classifiers trained on perception and tested during imagery. The training time during perception is shown on the vertical axis and the testing time during imagery is shown on the horizontal axis. (B) Decoding accuracies for classifiers trained on the four stages during perception. (C) Decoding accuracy from classifiers trained on imagery and tested during perception. The training time during imagery is shown on the vertical axis and the testing time during perception is shown on the horizontal axis. (D) Decoding accuracies for different training times during imagery. Source data for the analyses reported here are available in Figure 3—source data 1.
-
Figure 3—source data 1
- https://doi.org/10.7554/eLife.33904.013
-
Figure 3—source data 2
- https://doi.org/10.7554/eLife.33904.014
Figure 3—figure supplement 1
Differences in cross-decoding accuracy between high and low vivid participants.
None of the differences were significant after correction for multiple comparisons. The difference between the two vividness groups on cross-decoding accuracy for (A) a classifier trained during perception and tested during imagery and (B) a classifier trained during imagery and tested during perception. Source data for the analyses reported here can be available in Figure 3—source data 2.
Author response image 1

Within category decoding accuracy for perception (left) and imagery (right).
At the top the pairwise decoding accuracies for the different stimuli are shown where F are the face stimuli and H are the house stimuli. At the bottom, the averaged accuracies for the different comparisons (within faces, within houses, between categories) are shown as a distribution over participants.
Additional files
-
Transparent reporting form
- https://doi.org/10.7554/eLife.33904.015
Download links
A two-part list of links to download the article, or parts of the article, in various formats.
Downloads (link to download the article as PDF)
Open citations (links to open the citations from this article in various online reference manager services)
Cite this article (links to download the citations from this article in formats compatible with various reference manager tools)
Differential temporal dynamics during visual imagery and perception
eLife 7:e33904.
https://doi.org/10.7554/eLife.33904


