MCM2–7-dependent cohesin loading during S phase promotes sister-chromatid cohesion
- University of Texas Southwestern Medical Center, United States
Figures
Figure 1 with 1 supplement
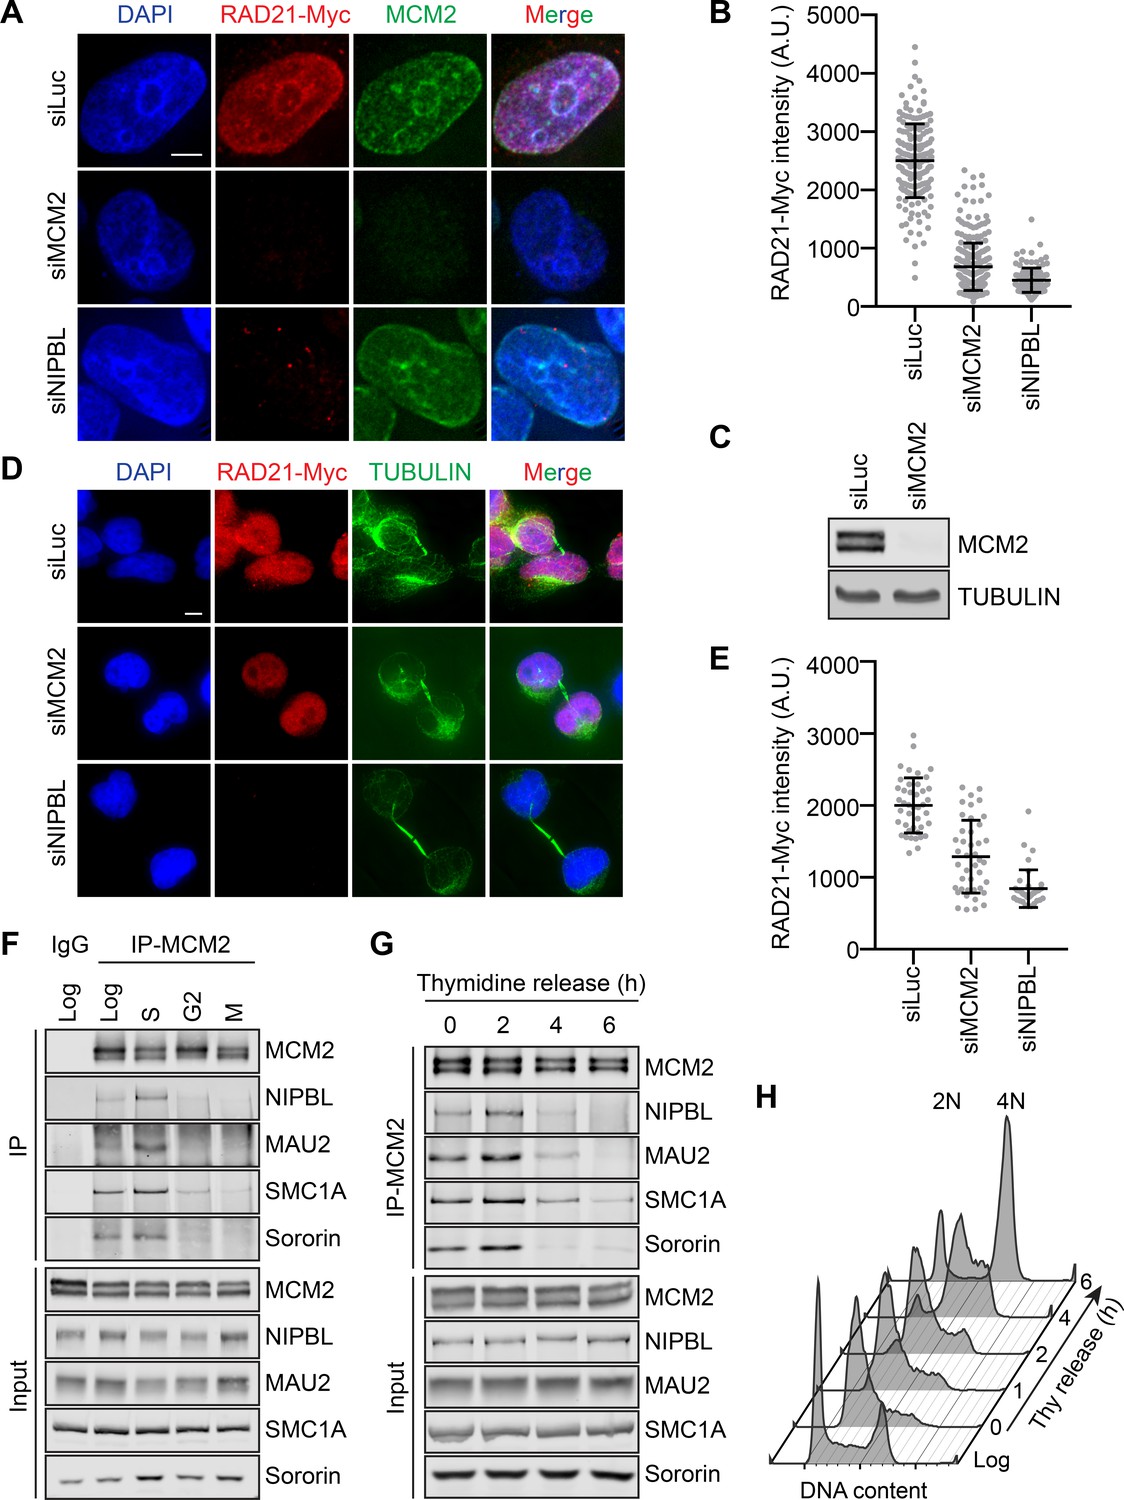
The MCM2–7 complex is required for cohesin loading during early S phase.
(A) DAPI (blue), anti-Myc (red), and anti-MCM2 (green) staining of HeLa cells that stably expressed RAD21-Myc. Cells were transfected with the indicated siRNAs and arrested in early S phase with thymidine before fixation and staining. Scale bar, 5 μm. (B) Quantification of the chromatin intensities of RAD21-Myc of cells in (A). Each dot in the graph represents a single cell. Mean ± SD (siLuc, n = 184; siMCM2, n = 295; siNIPBL, n = 115). (C) Lysates of HeLa cells either mock transfected or transfected with siMCM2 were blotted with the indicated antibodies. (D) DAPI (blue), anti-Myc (red), and anti-TUBULIN (green) staining of telophase HeLa cells that stably expressed RAD21-Myc. Cells were transfected with the indicated siRNAs and released from nocodazole-mediated mitotic arrest for 4 hr before fixation. Scale bar, 5 μm. (E) Quantification of the RAD21-Myc chromatin intensities of cells in (D). Each dot in the graph represents a single cell. Mean ± SD (siLuc, n = 42; siMCM2, n = 42; siNIPBL, n = 38). (F) Log-phase HeLa cells and cells synchronized in early S phase by thymidine, G2 by the CDK1 inhibitor, or mitosis by nocodazole were collected and lysed in the presence of nuclease. The total cell lysates (input) and anti-MCM2 immunoprecipitate (IP) were blotted with the indicated antibodies. IgG IP from log-phase cells was used as a negative control. (G) HeLa cells were synchronized with thymidine for 16–18 hr, released from thymidine, and harvested at the indicated time points. Cells were lysed in the presence of nuclease. The total cell lysates (input) and anti-MCM2 IP were blotted with the indicated antibodies. (H) Flow cytometry analysis of log-phase HeLa cells and cells released from the thymidine arrest for the indicated times.
Figure 1—figure supplement 1
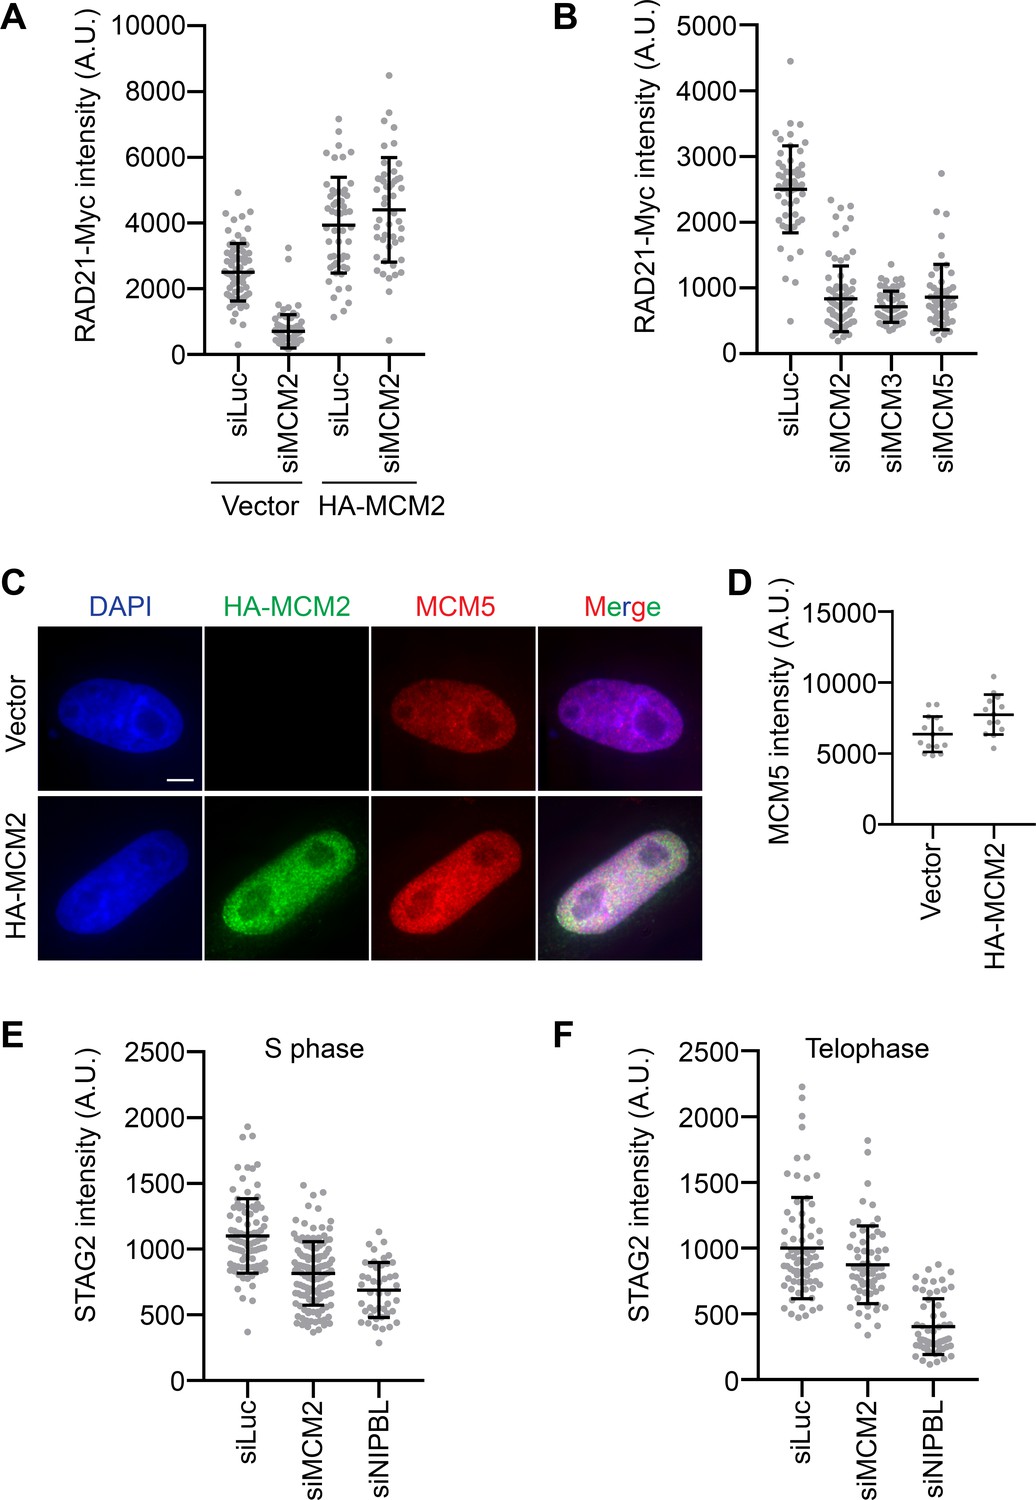
MCM2–7 promotes cohesin loading in early S phase human cells.
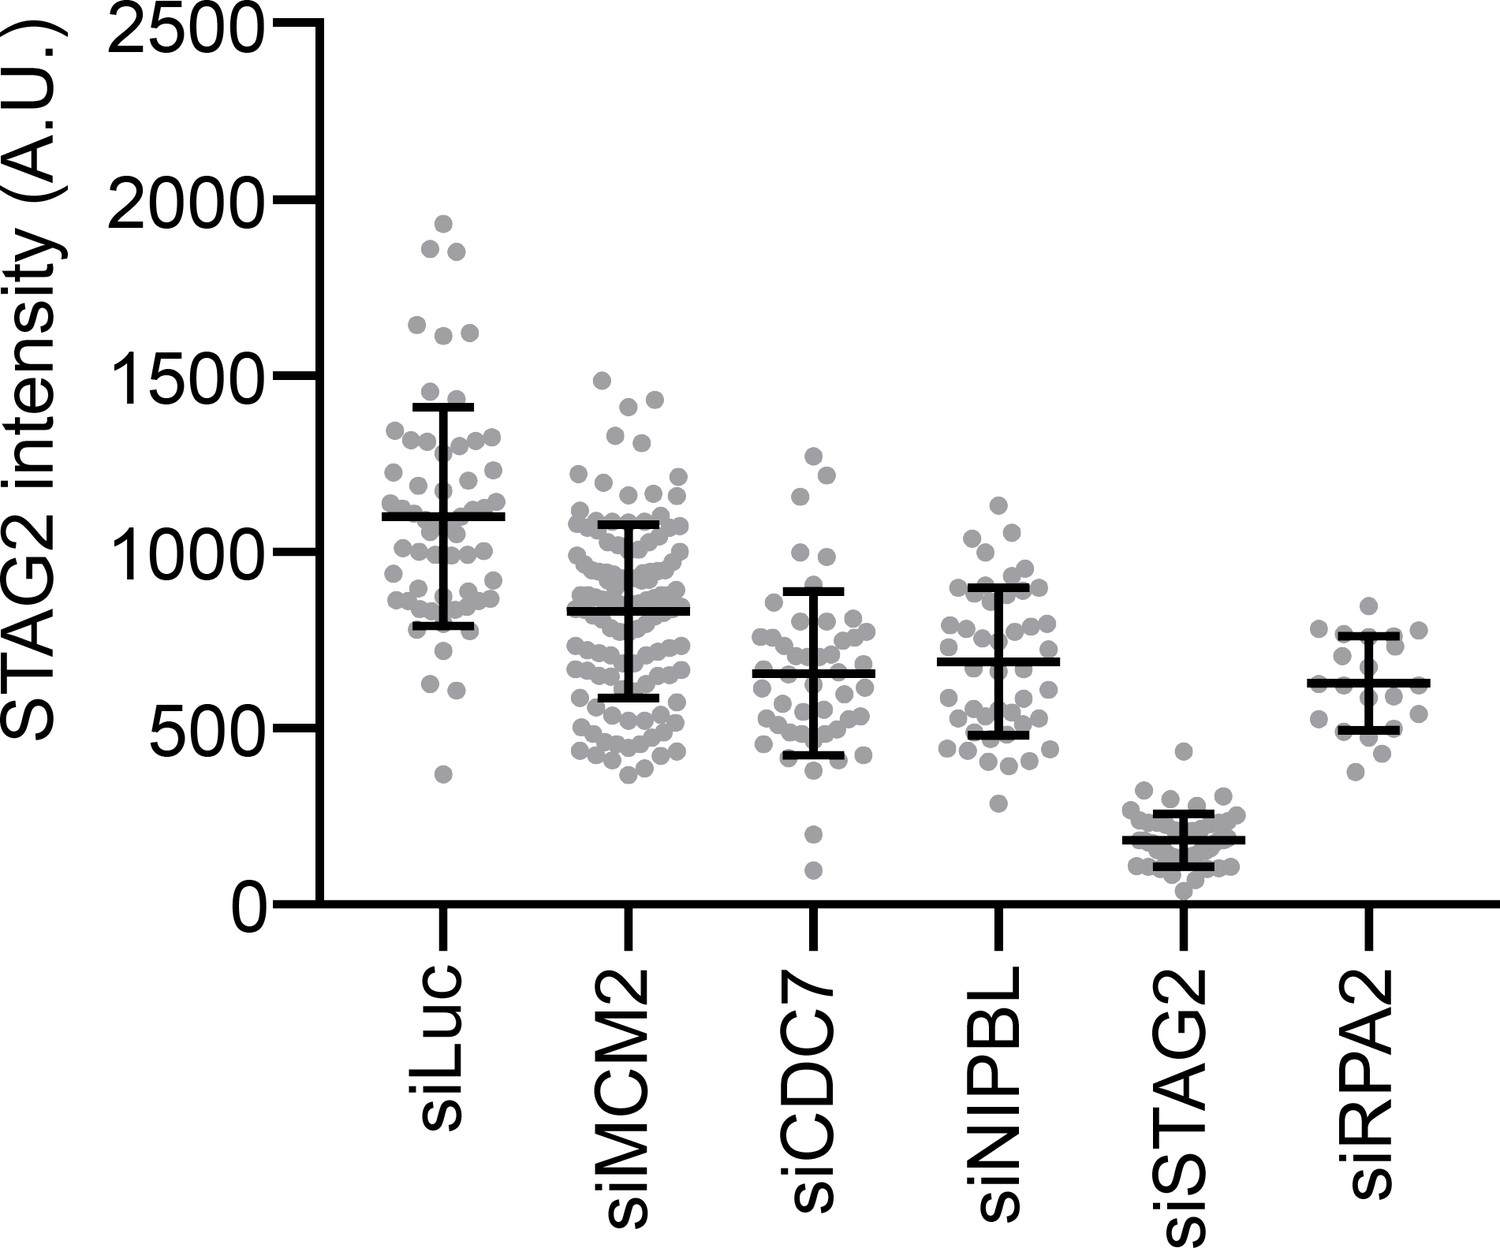
(A) Quantification of the intensities of chromatin-bound RAD21-Myc in HeLa cells transfected with the indicated plasmids and siRNAs and synchronized in early S phase by thymidine. Each dot in the graph represents a single cell. Mean ± SD (Vector + siLuc, n = 73; Vector + siMCM2, n = 77; HA-MCM2 + siLuc, n = 52; HA-MCM2 +siMCM2, n = 48). (B) Quantification of the intensities of chromatin-bound RAD21-Myc in HeLa cells transfected with the indicated siRNAs and synchronized in early S phase by thymidine. Each dot in the graph represents a single cell. Mean ± SD (siLuc, n = 55; siMCM2, n = 78; siMCM3, n = 57; siMCM5, n = 51). (C) DAPI (blue), anti-HA (green), and anti-MCM5 (red) staining of HeLa cells transfected with vector or HA-MCM2. Scale bar, 5 μm. (D) Quantification of MCM5 intensities on chromatin of cells in C). Each dot in the graph represents a single cell. Mean ± SD (Vector, n = 14; HA-MCM2, n = 13). (E) Quantification of the STAG2 intensities on chromatin in HeLa cells transfected with the indicated siRNAs and synchronized in early S phase by thymidine. Each dot in the graph represents a single cell. Mean ± SD (siLuc, n = 89; siMCM2, n = 130; siNIPBL, n = 45). (F) Quantification of the STAG2 intensities on chromatin in telophase HeLa cells transfected with the indicated siRNAs. Each dot in the graph represents a single cell. Mean ± SD (siLuc, n = 74; siMCM2, n = 61; siNIPBL, n = 58).
Figure 2 with 2 supplements
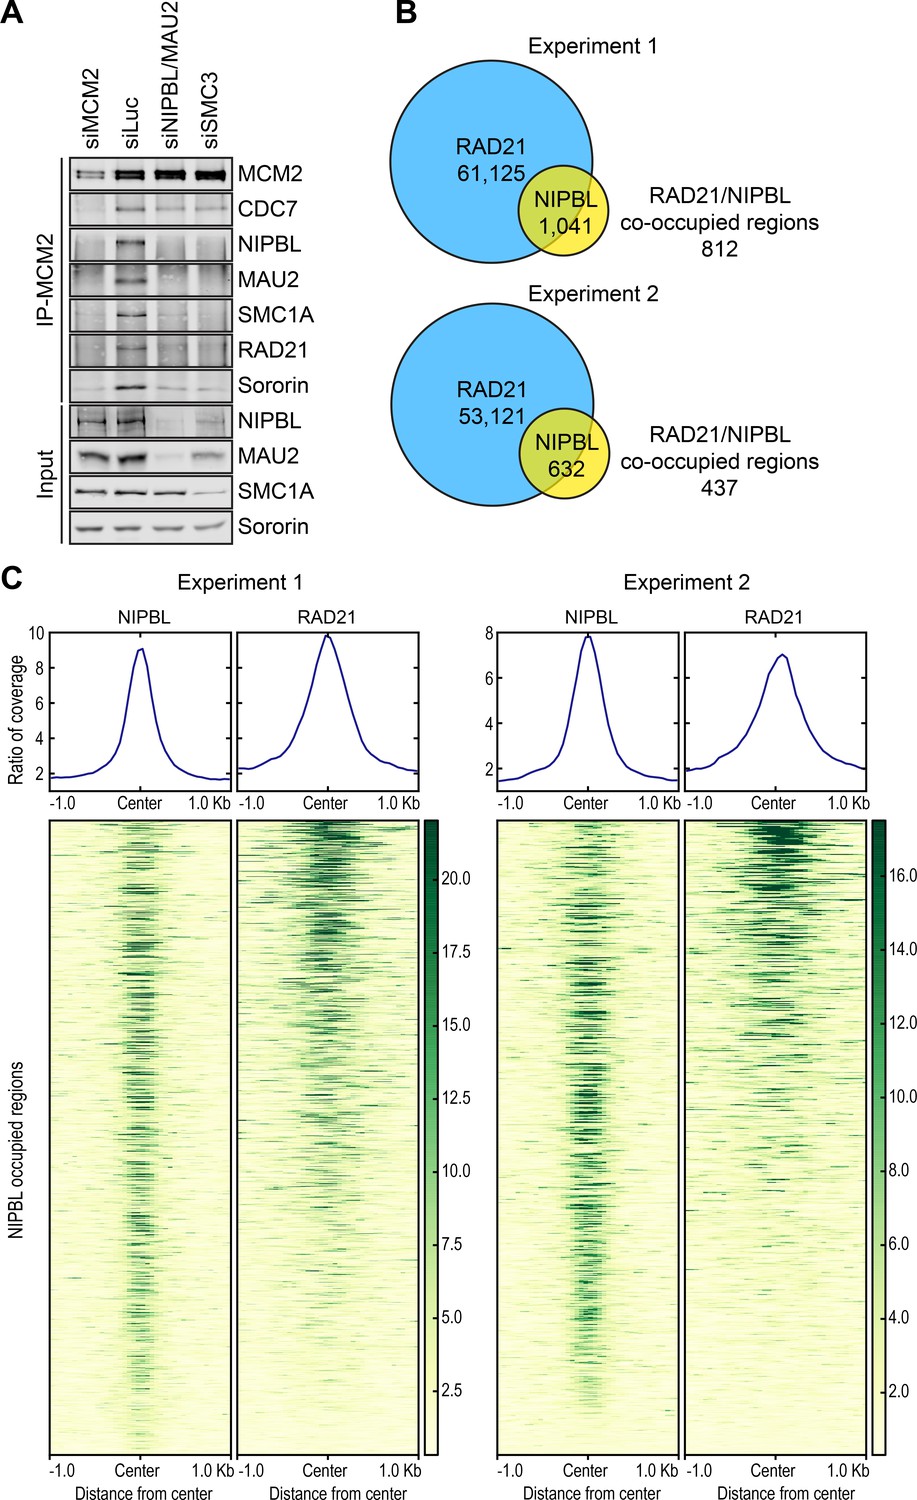
NIPBL and cohesin bind to MCM2–7 interdependently and co-localize in the genome.
(A) HeLa cells were transfected with the indicated siRNAs, arrested in early S phase with thymidine, and lysed in the presence of nuclease. The total lysates (input) and anti-MCM2 IP were blotted with the indicated antibodies. (B) Venn diagrams showing the overlap of cohesin (RAD21)-occupied sites with those bound by NIPBL in two independent ChIP-seq experiments. (C) Region map showing that, at the majority of the NIPBL-occupied regions, the occupancy of RAD21 was detected reproducibly in the two ChIP-seq experiments.
Figure 2—figure supplement 1
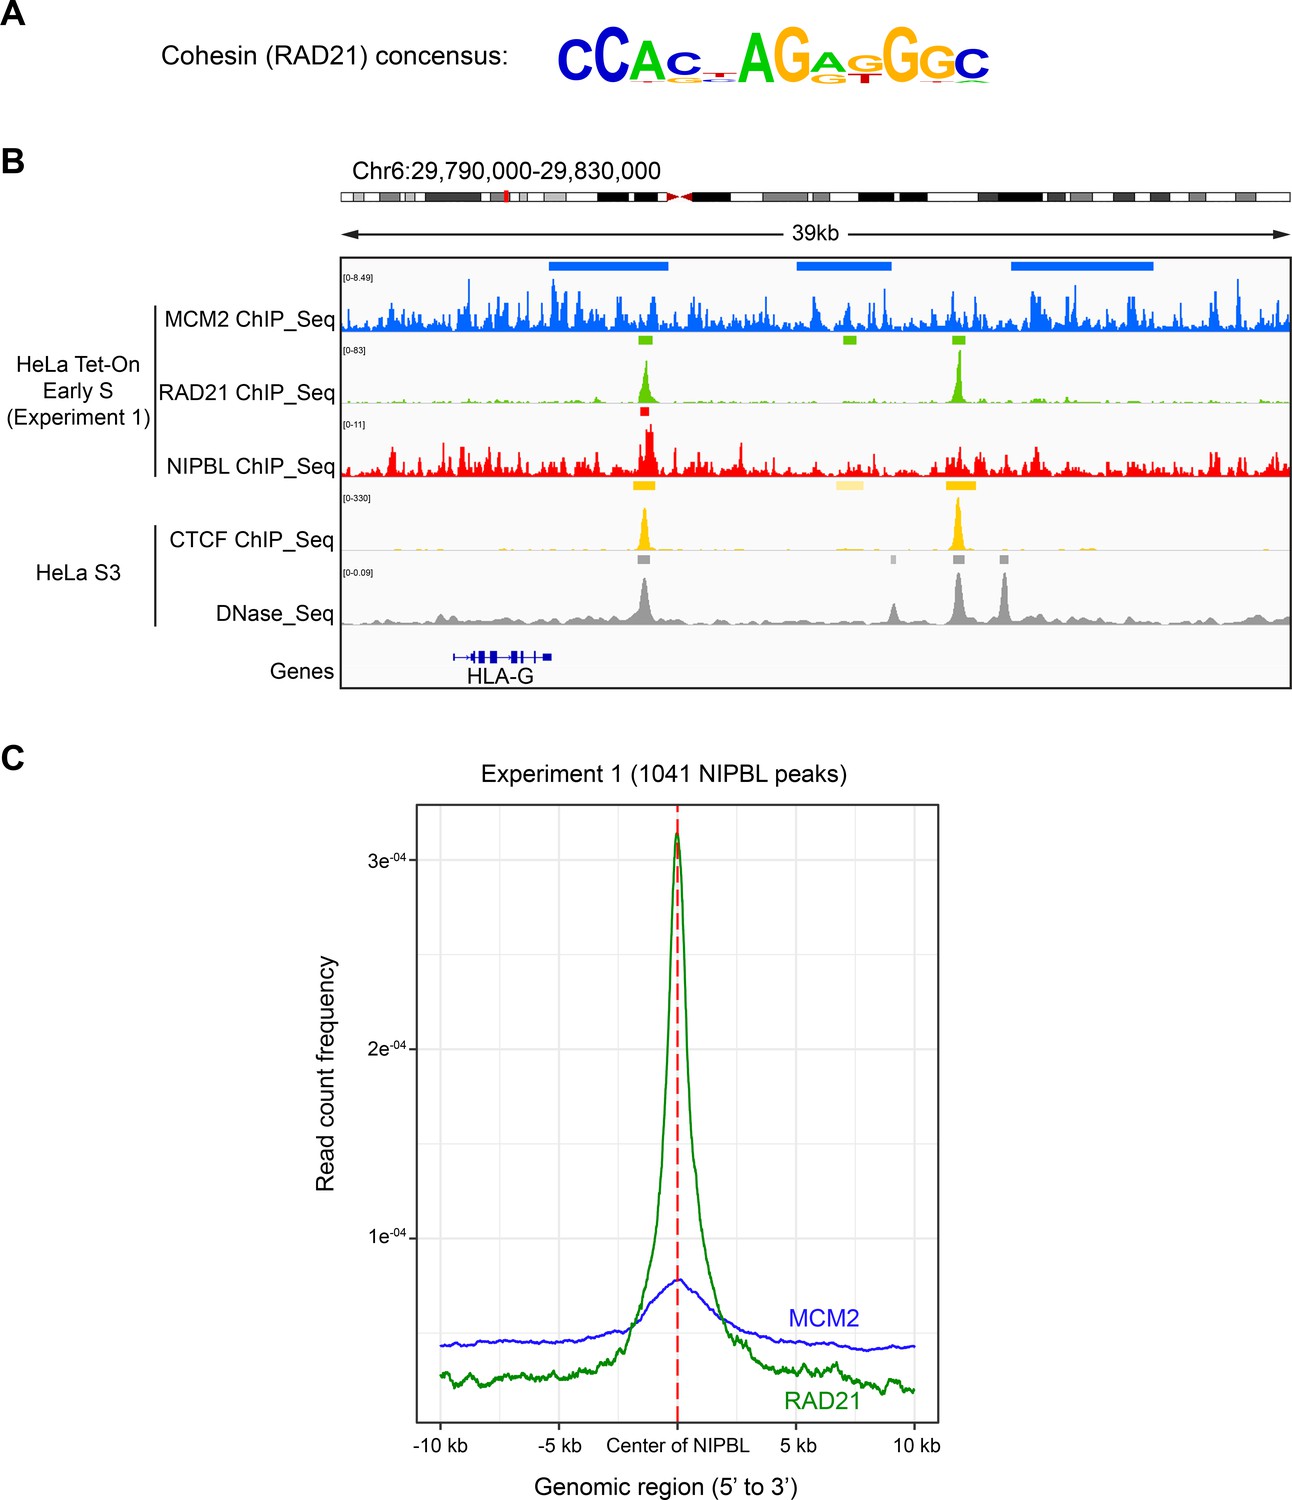
ChIP-seq analysis of cohesin, NIPBL, and MCM2 in human cells.
(A) The top consensus motif of RAD21 binding. (B) Annotated peaks and tracks of MCM2, RAD21, and NIPBL ChIP-seq samples in the selected region of chromosome six were visualized in the IGV browser. The MCM2 peaks were identified using SICER, and the RAD21 and NIPBL peaks were identified using MACS2. CTCF ChIP-seq and DNase-seq from HeLa S3 cells were obtained from ENCODE. (C) Average profiles of RAD21 and MCM2 ChIP-seq peaks in the ±10 kb range of NIPBL-enriched regions. All identified NIPBL peaks in Experiment one were aligned and used as the reference.
Figure 2—figure supplement 2
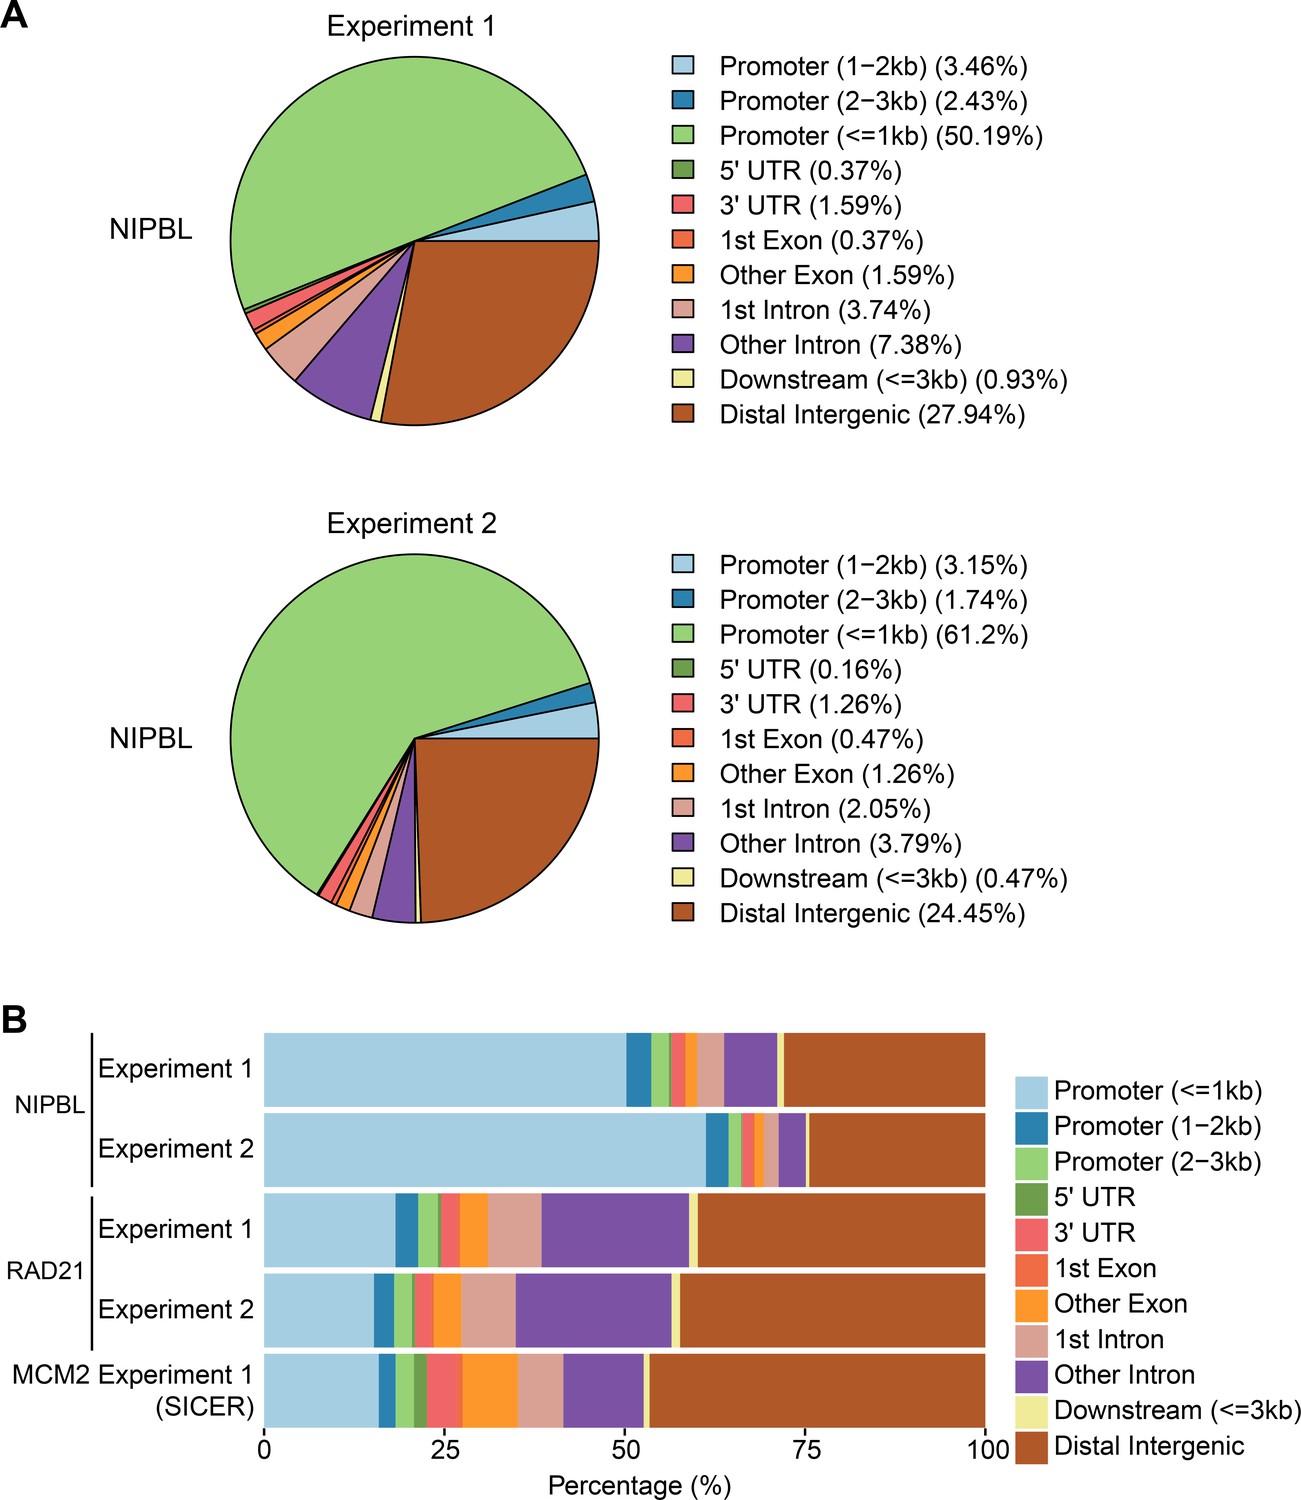
ChIP-seq analysis of cohesin, NIPBL, and MCM2 in human cells.
(A) Pie charts showing the genome distribution of the annotated NIPBL-enriched peaks in two independent ChIP-seq experiments. (B) Bar graphs showing the genome distribution of NIPBL and RAD21 in the two ChIP-seq experiments and that of MCM2 in Experiment 1.
Figure 3 with 4 supplements
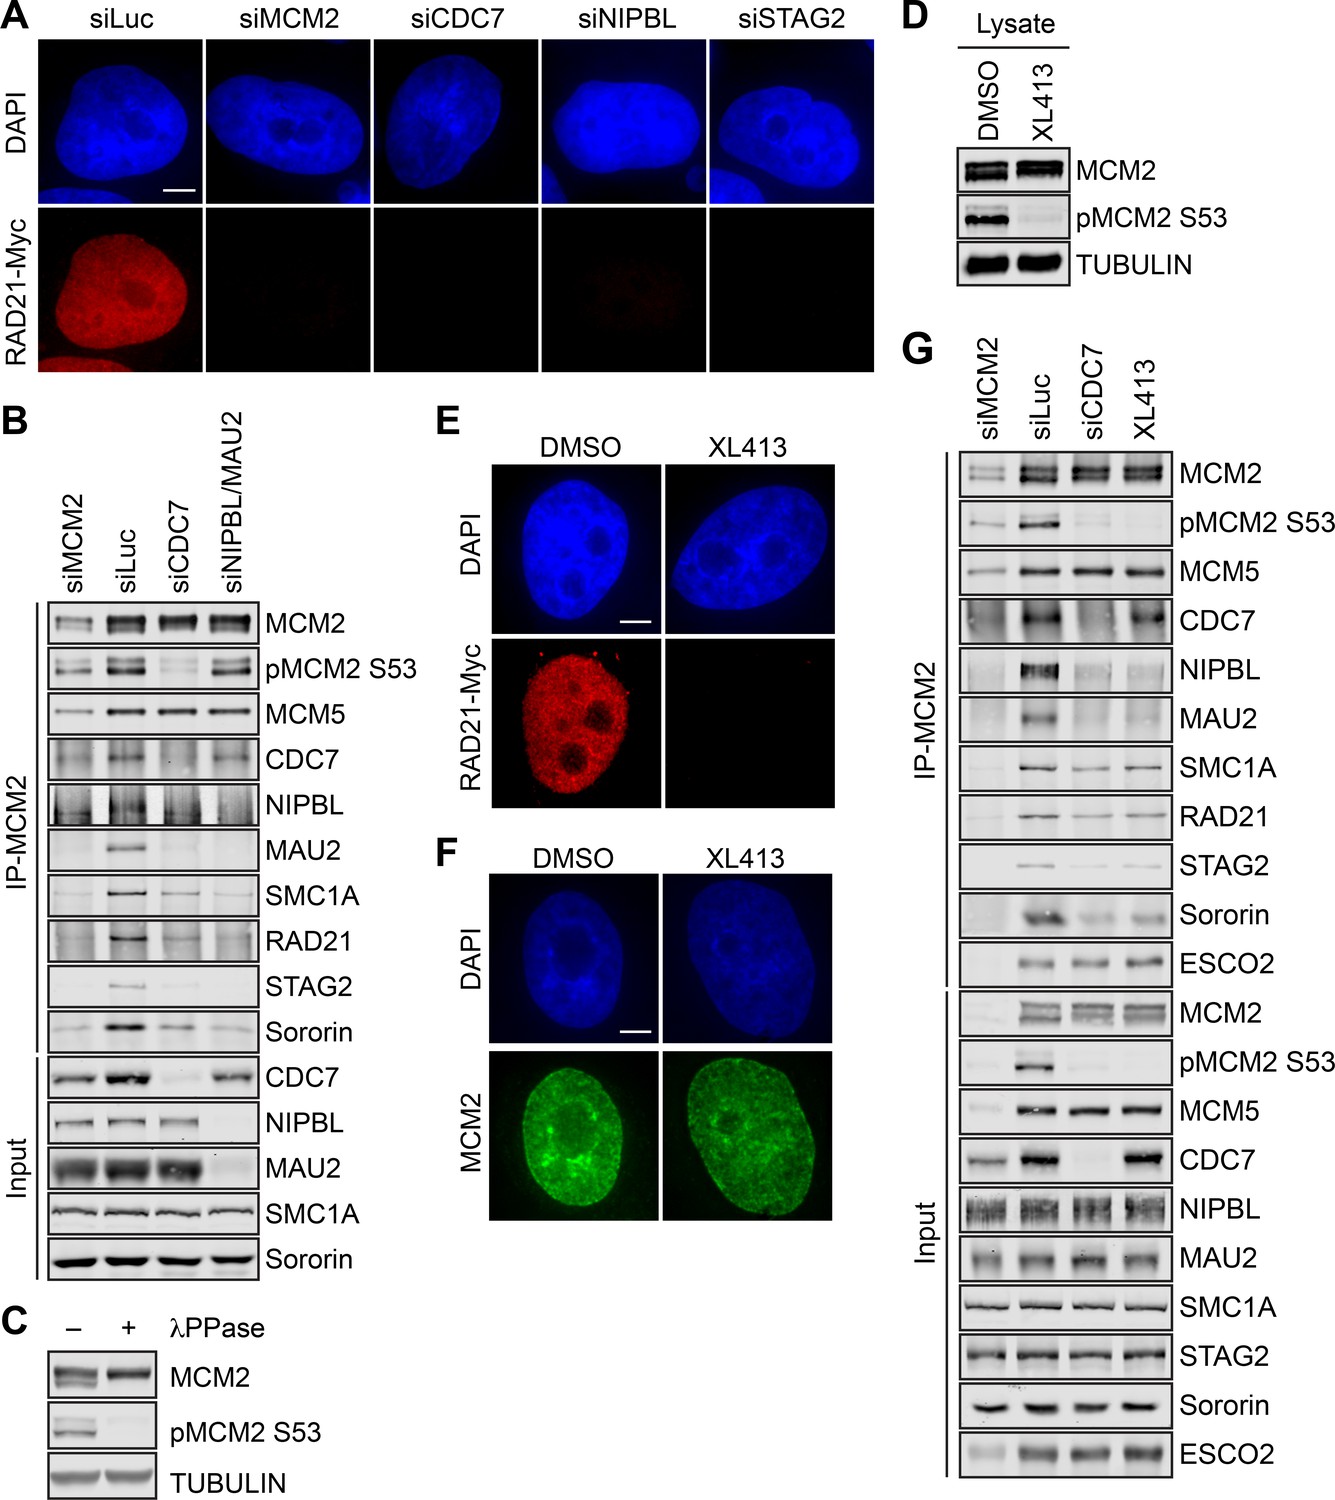
DDK promotes the MCM–NIPBL–cohesin interaction.
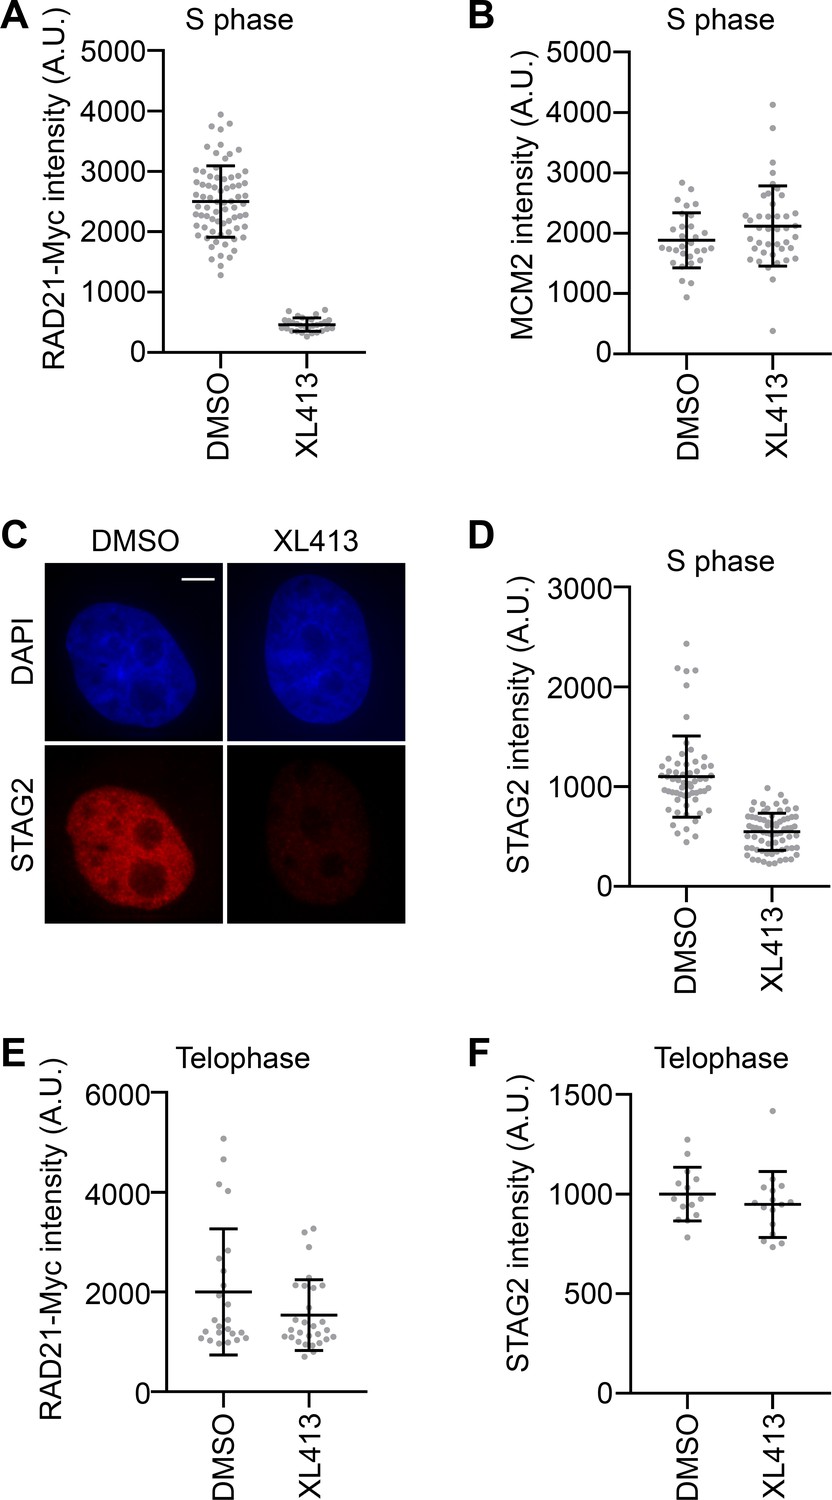
(A) DAPI (blue) and anti-Myc (red) staining of HeLa cells that stably expressed RAD21-Myc. Cells were transfected with the indicated siRNAs and arrested in early S phase with thymidine. Scale bar, 5 μm. (B) Lysates of HeLa cells transfected with the indicated siRNAs and synchronized in early S phase were treated with Turbo nuclease and immunoprecipitated with anti-MCM2. The total lysates (input) and anti-MCM2 immunoprecipitate (IP) were blotted with the indicated antibodies. (C) Lysates of HeLa cells were incubated with or without λPPase and blotted with the indicated antibodies. (D) Lysates of HeLa cells treated DMSO or the DDK kinase inhibitor XL413 (dissolved in DMSO) were blotted with the indicated antibodies. (E,F) DAPI (blue), anti-Myc (red), and anti-MCM2 (green) staining of RAD21-Myc-expressing HeLa cells that were treated with DMSO or XL413 and arrested in early S phase by thymidine. Scale bar, 5 μm. (G) HeLa cells were either transfected with the indicated siRNAs or treated with XL413, arrested in early S phase by thymidine, and lysed in the presence of Turbo nuclease. The total lysates (input) and anti-MCM2 IP were blotted with the indicated antibodies.
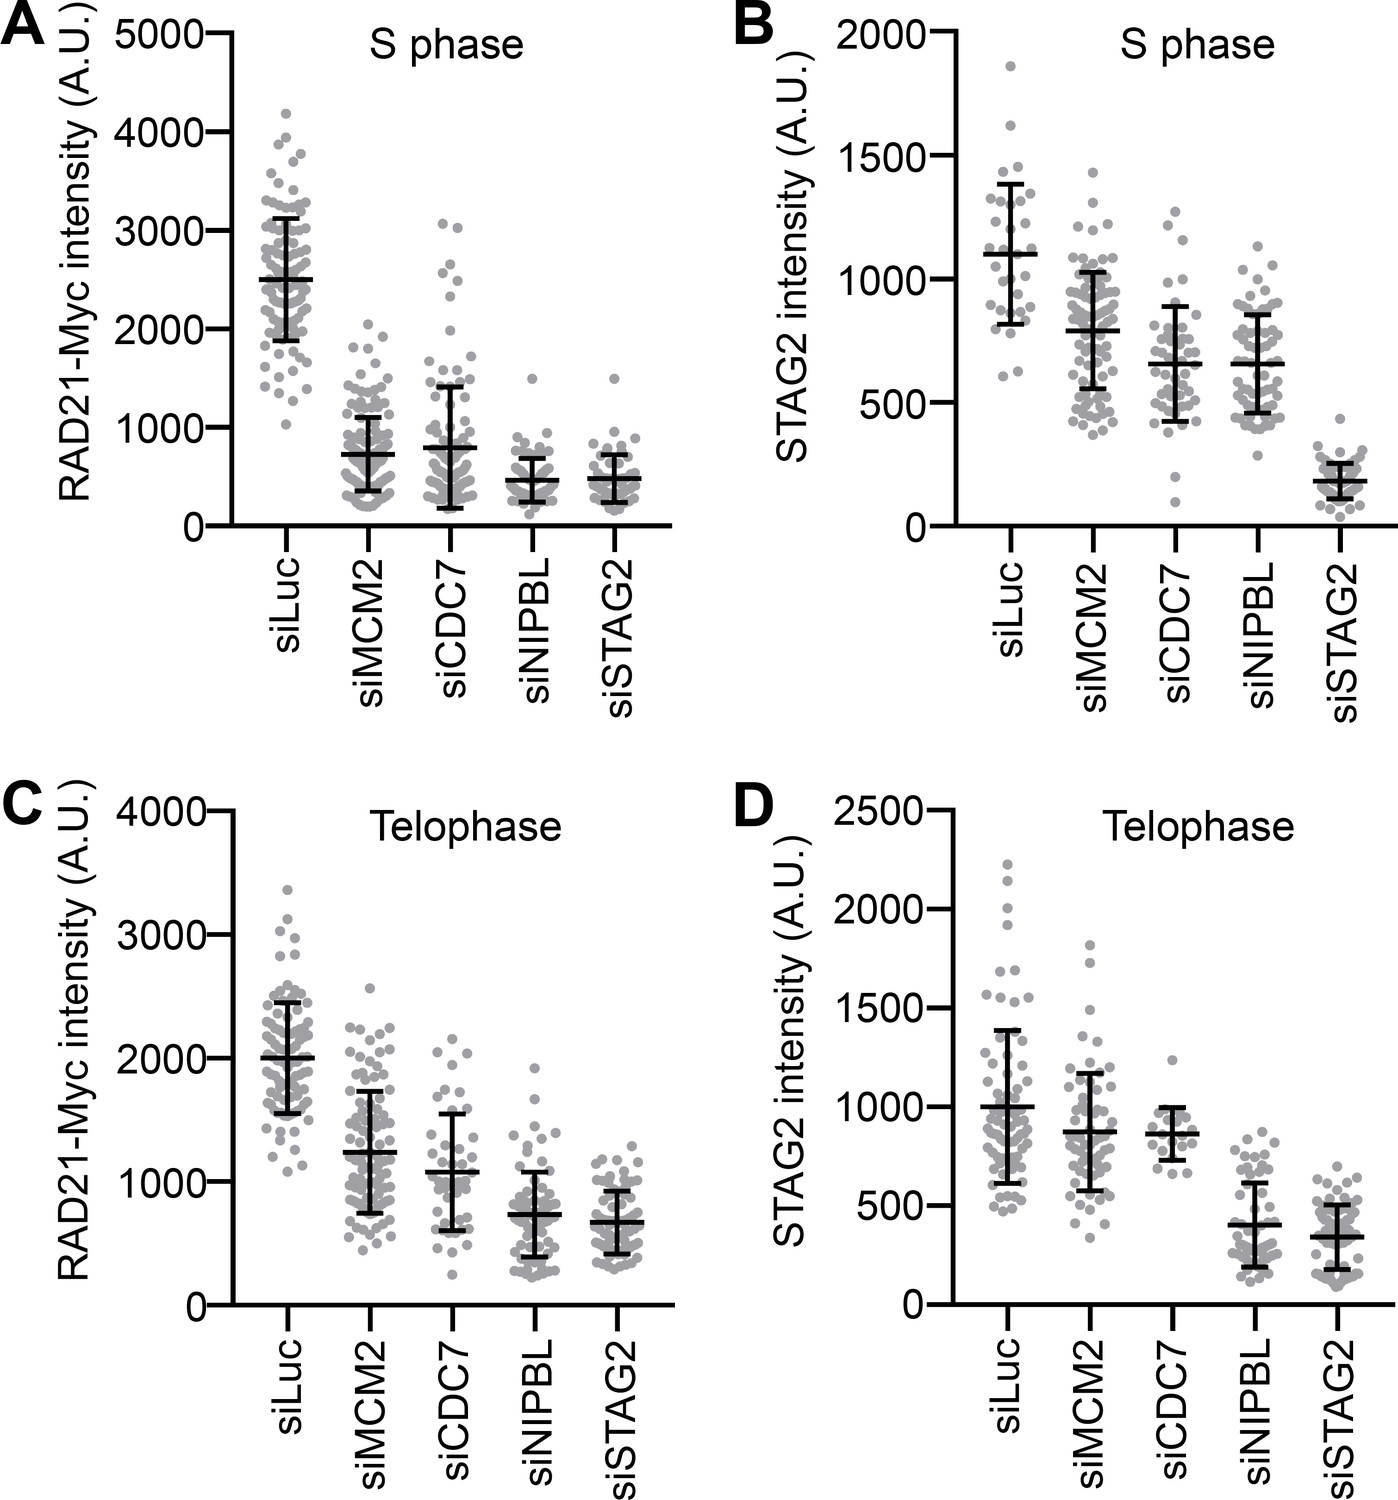
Figure 3—figure supplement 1
DDK promotes cohesin loading in early S phase, but not in telophase.
(A) Quantification of the intensities of chromatin-bound RAD21-Myc of cells in Figure 3A. Each dot in the graph represents a single cell. Mean ± SD (siLuc, n = 101; siMCM2, n = 141; siCDC7, n = 102; siNIPBL, n = 69; siSTAG2, n = 52). (B) Quantification of the intensities of chromatin-bound STAG2 in HeLa cells transfected with the indicated siRNAs and synchronized in early S phase by thymidine. Mean ± SD (siLuc, n = 31; siMCM2, n = 84; siCDC7, n = 47; siNIPBL, n = 66; siSTAG2, n = 62). (C) Quantification of the intensities of chromatin-bound RAD21-Myc in telophase HeLa cells that stably expressed RAD21-Myc and were transfected with the indicated siRNAs. Mean ± SD (siLuc, n = 90; siMCM2, n = 96; siCDC7, n = 45; siNIPBL, n = 75; siSTAG2, n = 76). (D) Quantification of the intensities of chromatin-bound STAG2 in telophase HeLa cells transfected with the indicated siRNAs. Mean ± SD (siLuc, n = 74; siMCM2, n = 61; siCDC7, n = 20; siNIPBL, n = 58; siSTAG2, n = 69).
Figure 3—figure supplement 2
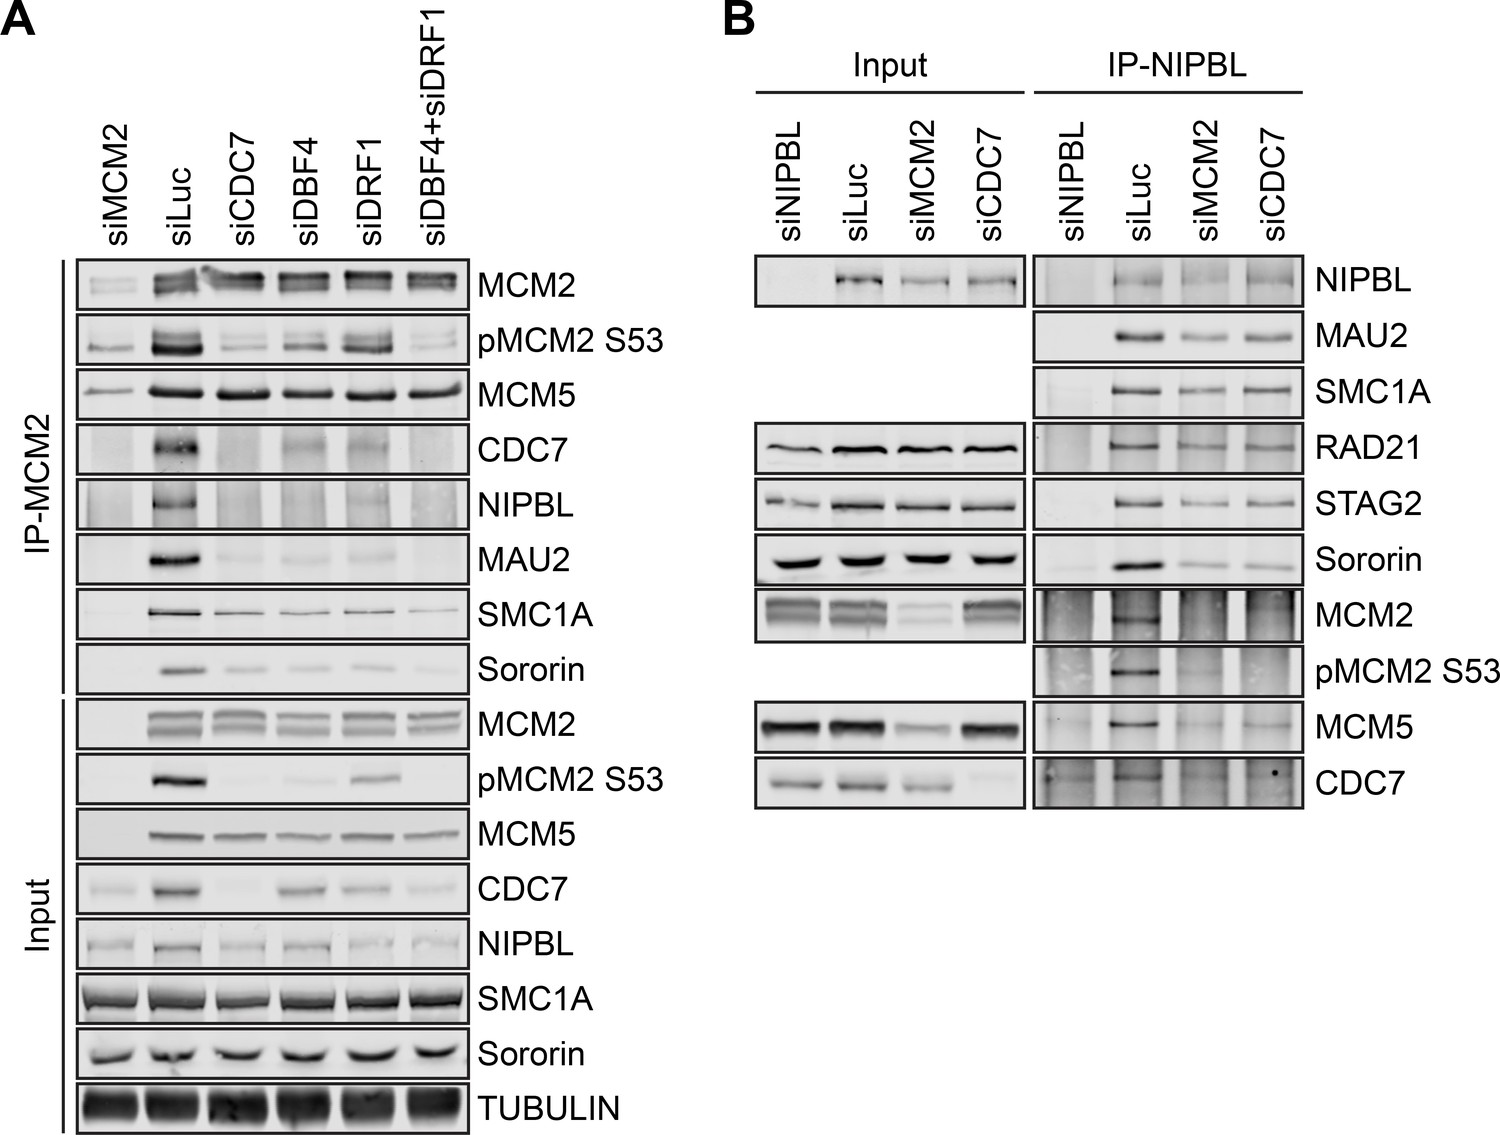
DDK promotes the MCM–NIPBL–cohesin interaction in early S phase.
(A) HeLa cells were transfected with the indicated siRNAs, enriched in early S phase by thymidine, and lysed in the presence of Turbo nuclease. The total lysates (input) and anti-MCM2 immunoprecipitate (IP) were blotted with the indicated antibodies. (B) Lysates of HeLa cells transfected with the indicated siRNAs and synchronized in early S phase were treated with nuclease and immunoprecipitated with the anti-NIPBL antibody. The total lysates (input) and anti-NIPBL IP were blotted with the indicated antibodies.
Figure 3—figure supplement 3
The kinase activity of DDK is critical for cohesin loading in early S phase, but not in telophase.
(A) Quantification of the intensities of chromatin-bound RAD21-Myc of cells in Figure 3E. Each dot in the graph represents a single cell. Mean ± SD (DMSO, n = 72; XL413, n = 29). (B) Quantification of the intensities of chromatin-bound MCM2 of cells in Figure 3F. Mean ± SD (DMSO, n = 30; XL413, n = 41). (C) DAPI (blue) and anti-STAG2 (red) staining of HeLa cells that were treated with DMSO or the DDK kinase inhibitor XL413 in early S phase. Scale bar, 5 μm. (D) Quantification of the intensities of chromatin-bound STAG2 of cells in C). Mean ± SD (DMSO, n = 60; XL413, n = 71). (E) Quantification of the intensities of chromatin-bound RAD21-Myc in telophase HeLa cells stably expressing RAD21-Myc treated with DMSO or XL413. Mean ± SD (DMSO, n = 24; XL413, n = 28). (F) Quantification of the intensities of chromatin-bound STAG2 in telophase HeLa cells treated with DMSO or XL413. Mean ± SD (DMSO, n = 14; XL413, n = 16).
Figure 3—figure supplement 4
CDC45 and GINS are dispensable for cohesin loading and the MCM–NIPBL–cohesin interaction.
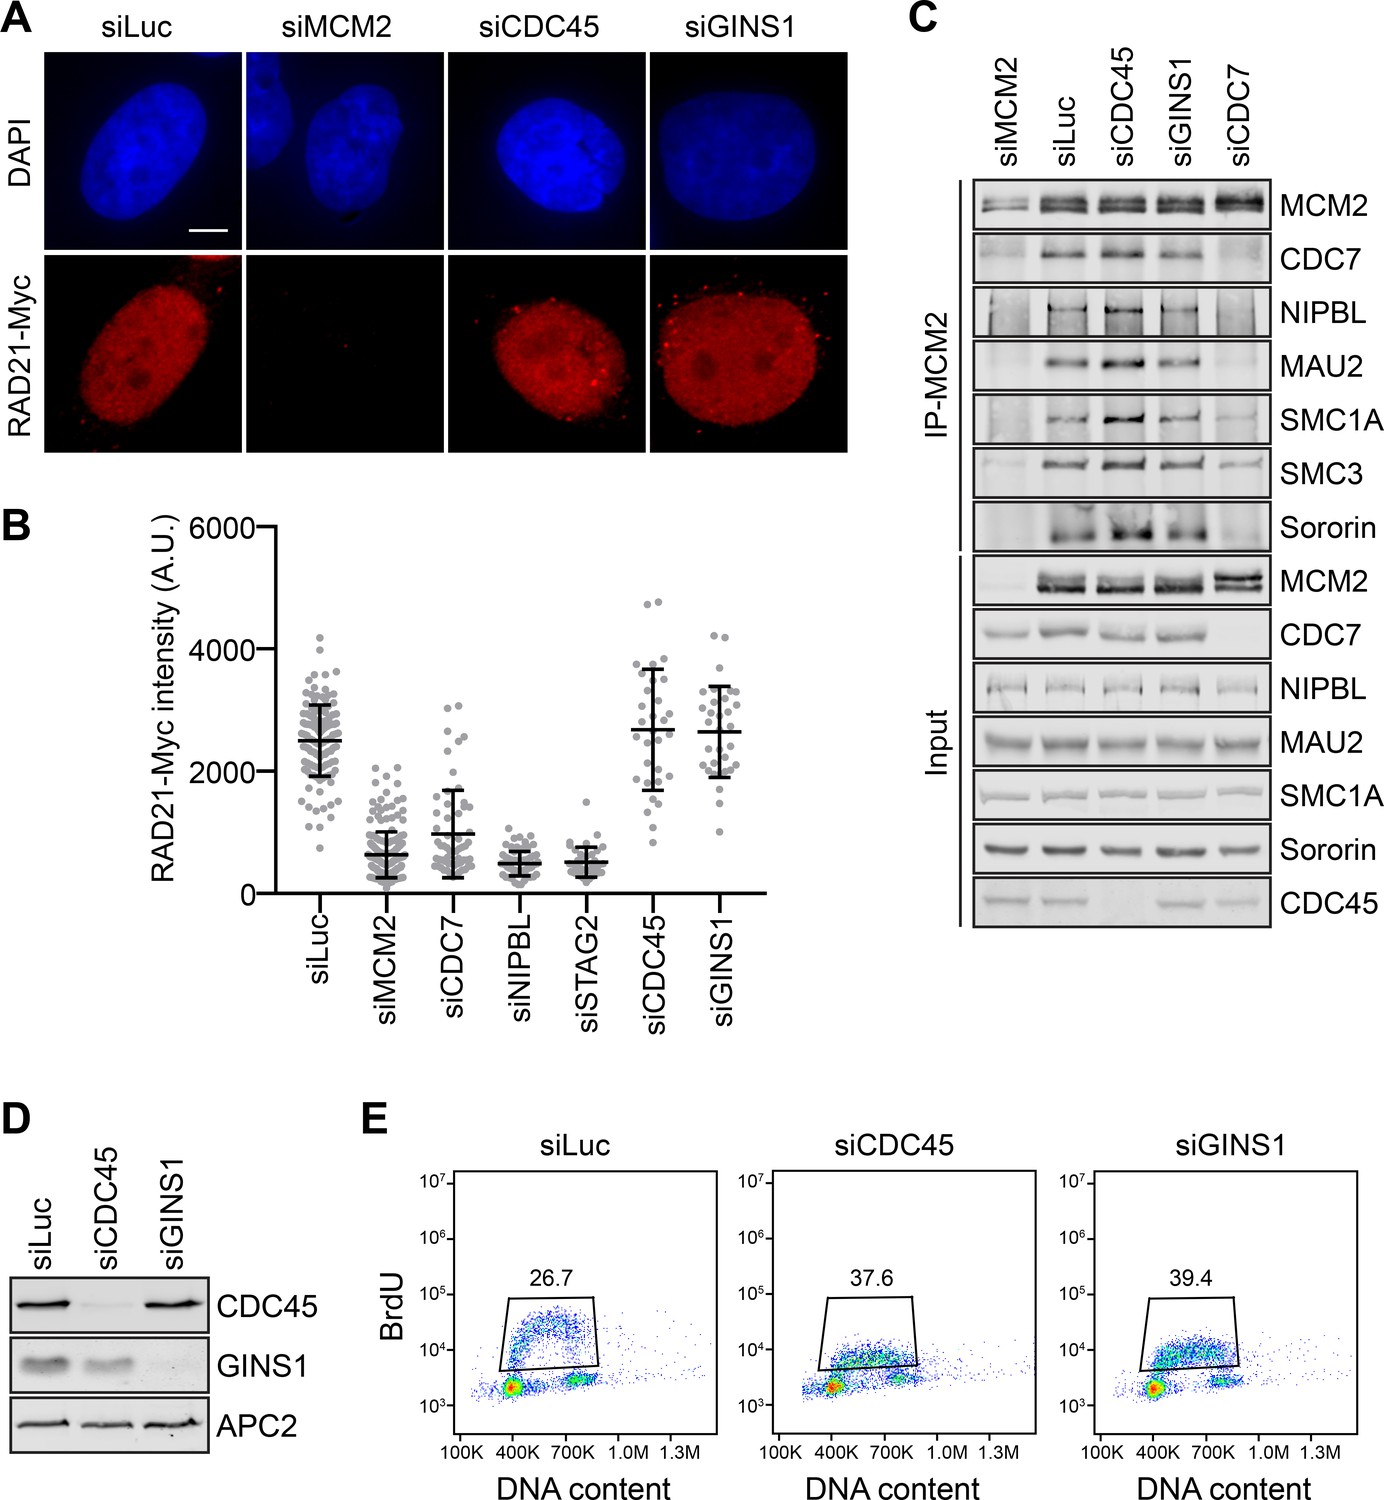
(A) DAPI (blue) and anti-Myc (red) staining of HeLa cells stably expressing RAD21-Myc. Cells were transfected with the indicated siRNAs and arrested in ealy S phase by thymidine before fixation and staining. Scale bar, 5 μm. (B) Quantification of the intensities of chromatin-bound RAD21-Myc of cells in A). Each dot in the graph represents a single cell. Mean ± SD (siLuc, n = 128; siMCM2, n = 196; siCDC7, n = 59; siNIPBL, n = 70; siSTAG2, n = 38; siCDC45, n = 31; siGINS1, n = 32). (C) HeLa cells were transfected with the indicated siRNAs, arrested in early S phase by thymidine, and lysed in the presence of Turbo nuclease. The total lysates (input) and anti-MCM2 immunoprecipitate (IP) were blotted with the indicated antibodies. (D) Lysates of HeLa cells transfected with siLuc, siCDC45, or siGINS1 were blotted with the indicated antibodies. (E) Flow cytometry analysis of HeLa cells treated with the indicated siRNAs and then incubated with BrdU. Cells with BrdU incorporation were gated and quantified.
Figure 4 with 1 supplement

Replisome components are required for interphase sister-chromatid cohesion.
(A) Representative images of G2-enriched HeLa cells transfected with the indicated siRNAs and stained with DAPI (blue in merge) and the FISH probe (red in merge). Cells were treated with thymidine for 16–18 hr and released into fresh medium for 4 hr before fixation. Selected paired FISH signals are magnified in inset. Scale bar, 5 μm. (B) Quantification of the distances between paired FISH signals in G2-enriched HeLa cells transfected with the indicated siRNAs. Mean ± SD (siLuc, n = 502; siSororin, n = 243; siMCM2, n = 70; siCDC7, n = 44; siDBF4, n = 30; siDRF1, n = 30; siDBF4/DRF1, n = 32; siNIPBL, n = 191; siCDC45, n = 66; siGINS1, n = 68; siCDC45/GINS1, n = 26; siWDHD1, n = 198; siTIMELESS, n = 58; siTIPIN, n = 31; siTIMELESS/TIPIN, n = 51; siWDHD1/TIMELESS, n = 375; siWDHD1/TIMELESS/TIPIN, n = 71; siDDX11, n = 154; siWDHD1/DDX11, n = 52; siTIMELESS/DDX11, n = 65). The red dashed line indicates the mean of the siLuc sample. (C) Quantification of the percentage of cells with two unreplicated single FISH dots. Cells were transfected with the indicated siRNAs, treated with thymidine for 16–18 hr, and released into fresh medium for 4 hr. siLuc, n = 507 (mean ± SD; four independent experiments); siCDC7, n = 109; siNIPBL, n = 66; siCDC45, n = 71; siGINS1, n = 139; siCDC45/GINS1, n = 116; siFEN1, n = 112; siLIG1, n = 115; siCHAF1A, n = 226 (mean ± SD; two independent experiments). (D) Lysates of HeLa cells transfected with the indicated siRNAs were blotted with the indicated antibodies. (E) Quantification of the distances between paired FISH signals in G2-enriched HeLa cells transfected with the indicated siRNAs. Mean ± SD (siLuc, n = 382; siSororin, n = 82; siWDHD1/TIMELESS, n = 226; siFEN1, n = 60; siLIG1, n = 44; siCHAF1A, n = 110). (F) A simplified model delineating the molecular events during DNA replication. Cohesion establishment can occur without the maturation of Okazaki fragments and the deposition of histones.
Figure 4—figure supplement 1
Replisome components promote sister-chromatid cohesion at least in part through antagonizing WAPL.
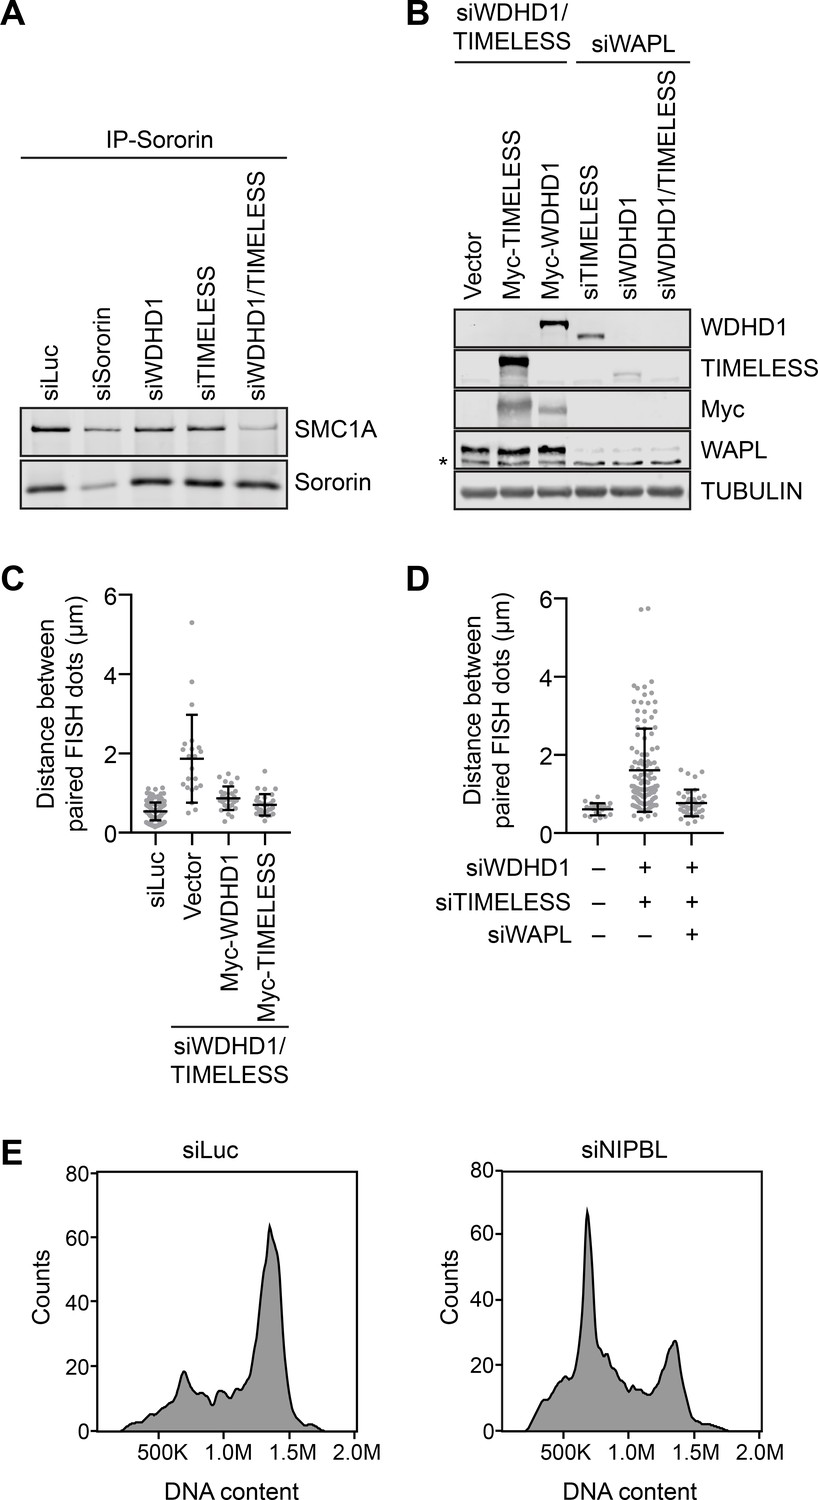
(A) HeLa cells were transfected with the indicated siRNAs, arrested in early S phase by thymidine, lysed in the presence of Turbo nuclease and immunoprecipitated with anti-sororin antibody beads. The anti-sororin immunoprecipitates (IP) were blotted with the indicated antibodies. (B) Lysates of HeLa cells transfected with the indicated plasmids and siRNAs were blotted with the indicated antibodies. (C) Quantification of the distances between paired FISH signals in G2-enriched HeLa cells transfected with the indicated plasmids and siRNAs. Mean ± SD (siLuc, n = 150; Vector, n = 22; Myc-WDHD1, n = 28; Myc-TIMELESS, n = 30). (D) Quantification of the distances between paired FISH signals in G2-enriched HeLa cells transfected with the indicated siRNAs. Mean ± SD (siLuc, n = 22; siWDHD1/TIMELESS, n = 114; siWDHD1/TIMELESS/WAPL, n = 36). (E) Flow cytometry analysis of HeLa cells transfected with siLuc or siNIPBL and treated with thymidine for 48 hr. The DNA content histograms are shown.
Figure 5 with 1 supplement
Replisome components are required for cohesin loading and the MCM–NIPBL–cohesin interaction during early S phase.
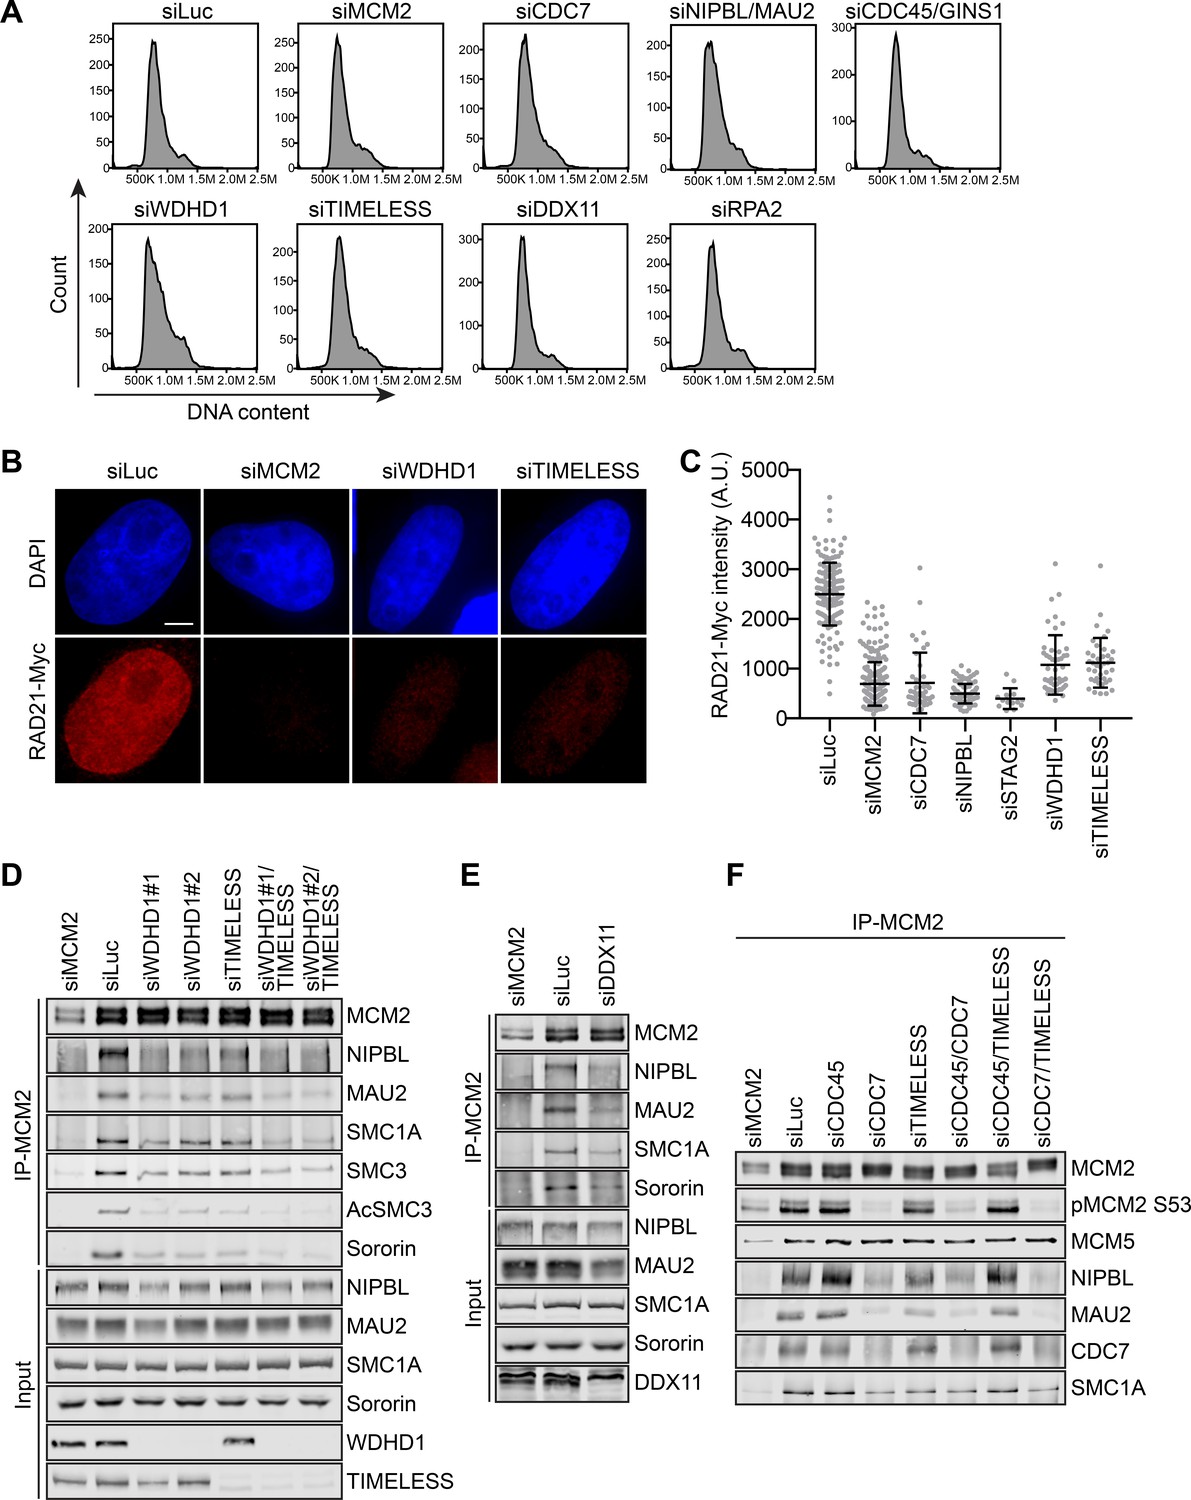
(A) Flow cytometry analysis of HeLa cells transfected with the indicated siRNAs and treated with thymidine for 16–18 hr. The DNA content histograms were shown. (B) DAPI (blue) and anti-Myc (red) staining of HeLa cells that stably expressed RAD21-Myc. Cells were transfected with the indicated siRNAs and arrested in early S phase by thymidine before fixation and staining. Scale bar, 5 μm. (C) Quantification of the chromatin intensities of RAD21-Myc of cells in (B). Each dot in the graph represents a single cell. Mean ± SD (siLuc, n = 151; siMCM2, n = 238; siCDC7, n = 43; siNIPBL, n = 97; siSTAG2, n = 14; siWDHD1, n = 47; siTIMELESS, n = 39). (D–F) HeLa cells were transfected with the indicated siRNAs, arrested in early S phase by thymidine, and lysed in the presence of Turbo nuclease. The total lysates (input) and anti-MCM2 immunoprecipitate (IP) were blotted with the indicated antibodies.
Figure 5—figure supplement 1
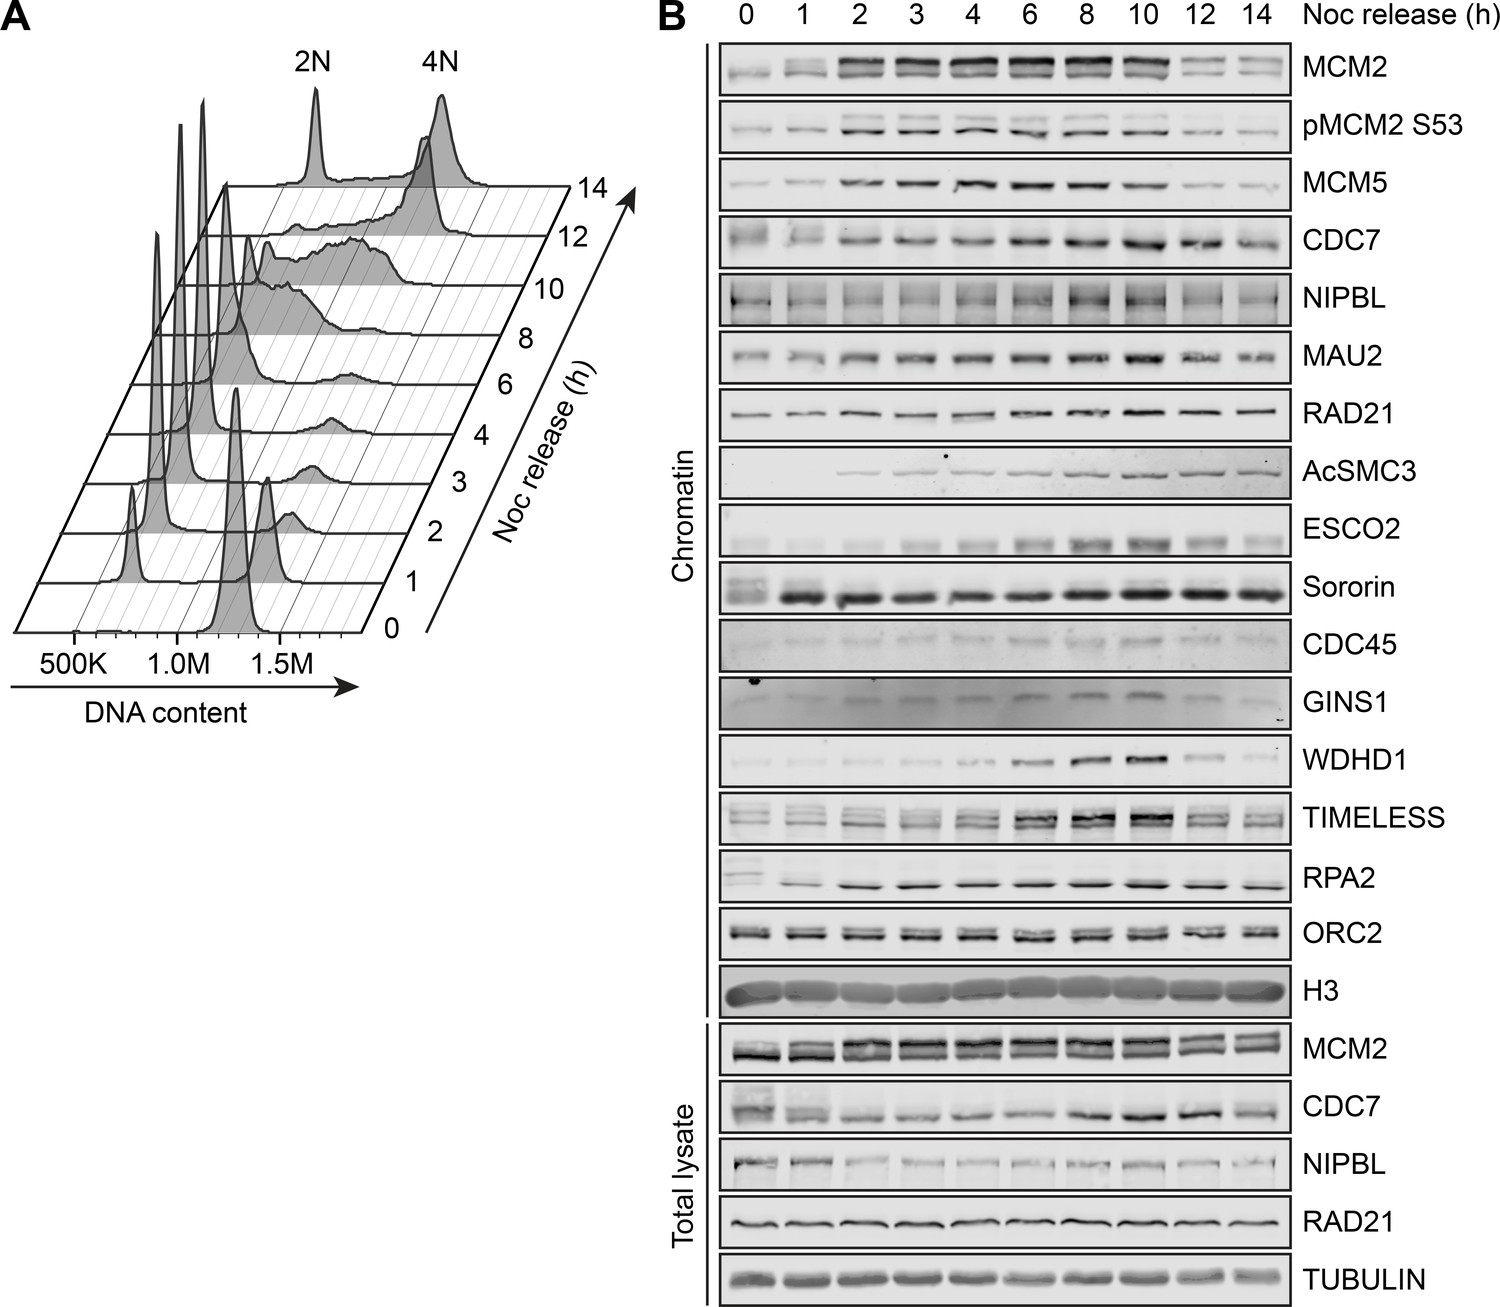
Chromatin binding of replisome components peaks in S phase.
(A) HeLa cells were arrested in mitosis with nocodazole and released from nocodazole treatment for the indicated times. Cells were harvested for flow cytometry analysis. The DNA content histograms are shown. (B) Total lysates and chromatin fractions of cells in A were blotted with the indicated antibodies.
Figure 6 with 4 supplements
RPA promotes interphase sister-chromatid cohesion, cohesin loading in early S phase, and the MCM–NIPBL–cohesin interaction.
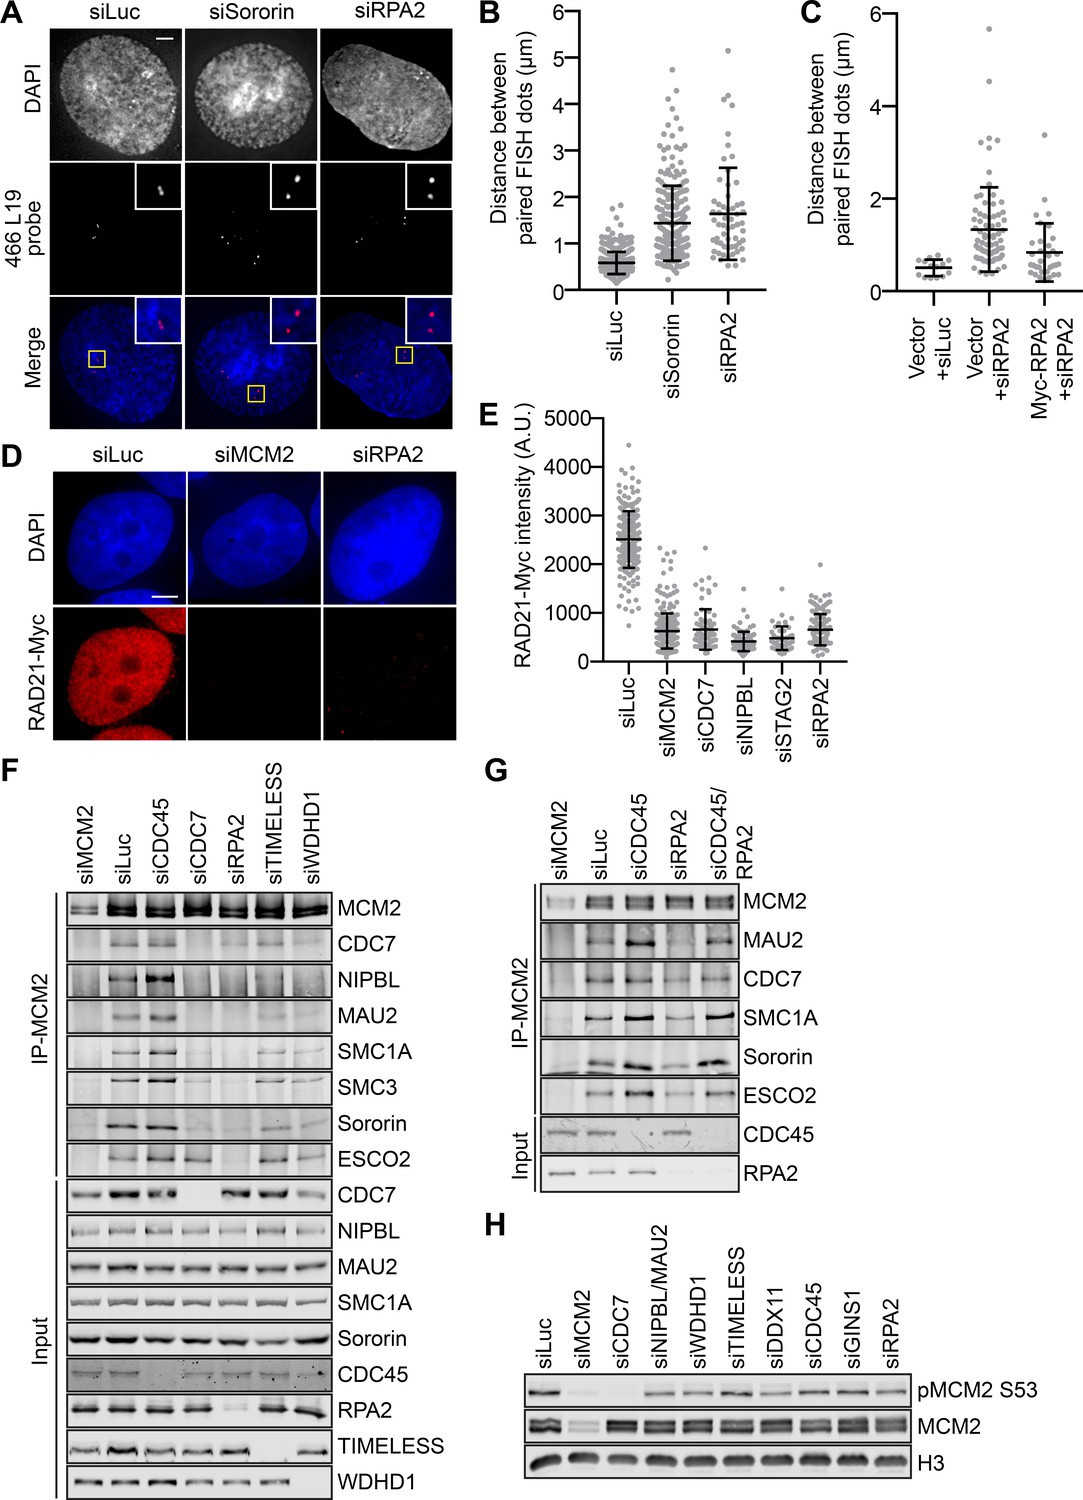
(A) Representative images of G2-enriched HeLa cells transfected with the indicated siRNAs and stained with DAPI (blue in merge) and the early-replicating 466L19 FISH probe (red in merge). Selected paired FISH signals are magnified in inset. Scale bar, 5 μm. (B) Quantification of the distances between paired FISH signals of cells in (A). Mean ± SD (siLuc, n = 439; siSororin, n = 226; siRPA2, n = 59). (C) Quantification of the distances between paired FISH signals in G2-enriched HeLa cells transfected with the indicated plasmids and siRNAs. Mean ± SD (Vector + siLuc, n = 14; Vector + siRPA2, n = 78; Myc-RPA2 +siRPA2, n = 34). (D) DAPI (blue) and anti-Myc (red) staining of HeLa cells that stably expressed RAD21-Myc. Cells were transfected with the indicated siRNAs and arrested in early S phase with thymidine before fixation and staining. Scale bar, 5 μm. (E) Quantification of the chromatin intensities of RAD21-Myc of cells in (D). Mean ± SD (siLuc, n = 215; siMCM2, n = 298; siCDC7, n = 75; siNIPBL, n = 91; siSTAG2, n = 52; siRPA2, n = 131). (F,G) HeLa cells were transfected with the indicated siRNAs, synchronized in early S phase by thymidine, and lysed in the presence of Turbo nuclease. The total lysates (input) and anti-MCM2 immunoprecipitate (IP) were blotted with the indicated antibodies. (H) Lysates of HeLa cells transfected with the indicated siRNAs and arrested at early S phase with thymidine were blotted with the indicated antibodies.
Figure 6—figure supplement 1
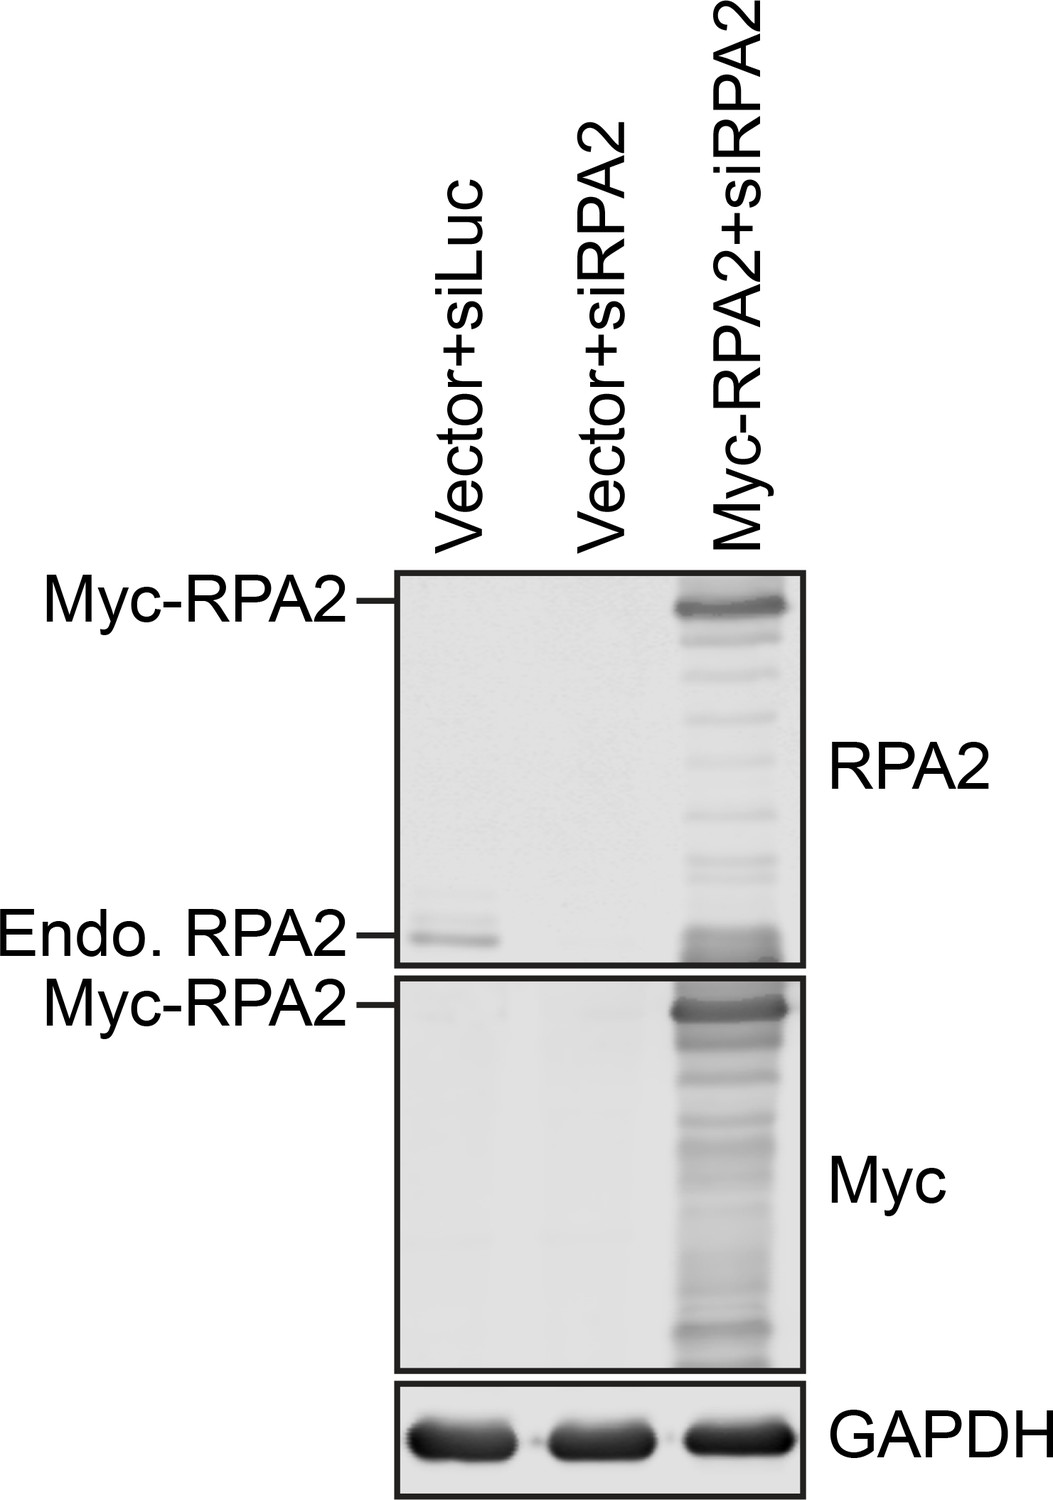
RPA2 promotes sister-chromatid cohesion.
Lysates of cells in Figure 6C were blotted with the indicated antibodies.
Figure 6—figure supplement 2
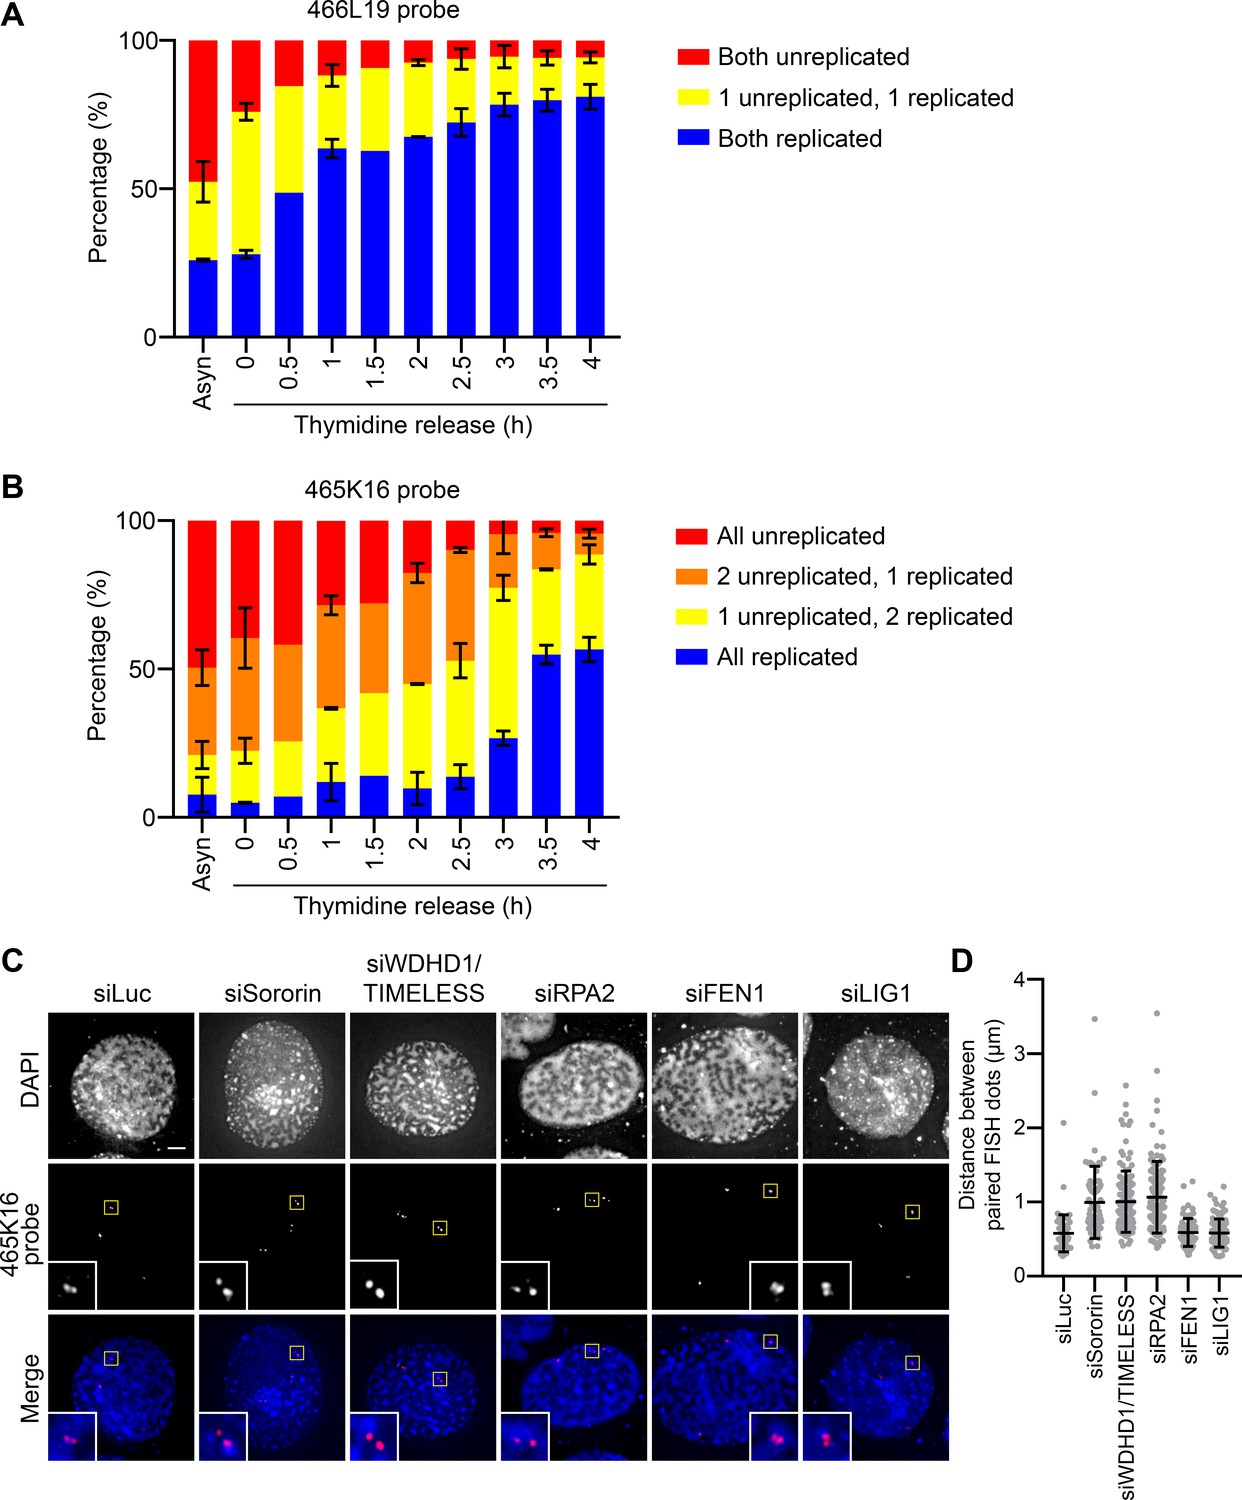
RPA2 promotes sister-chromatid cohesion.
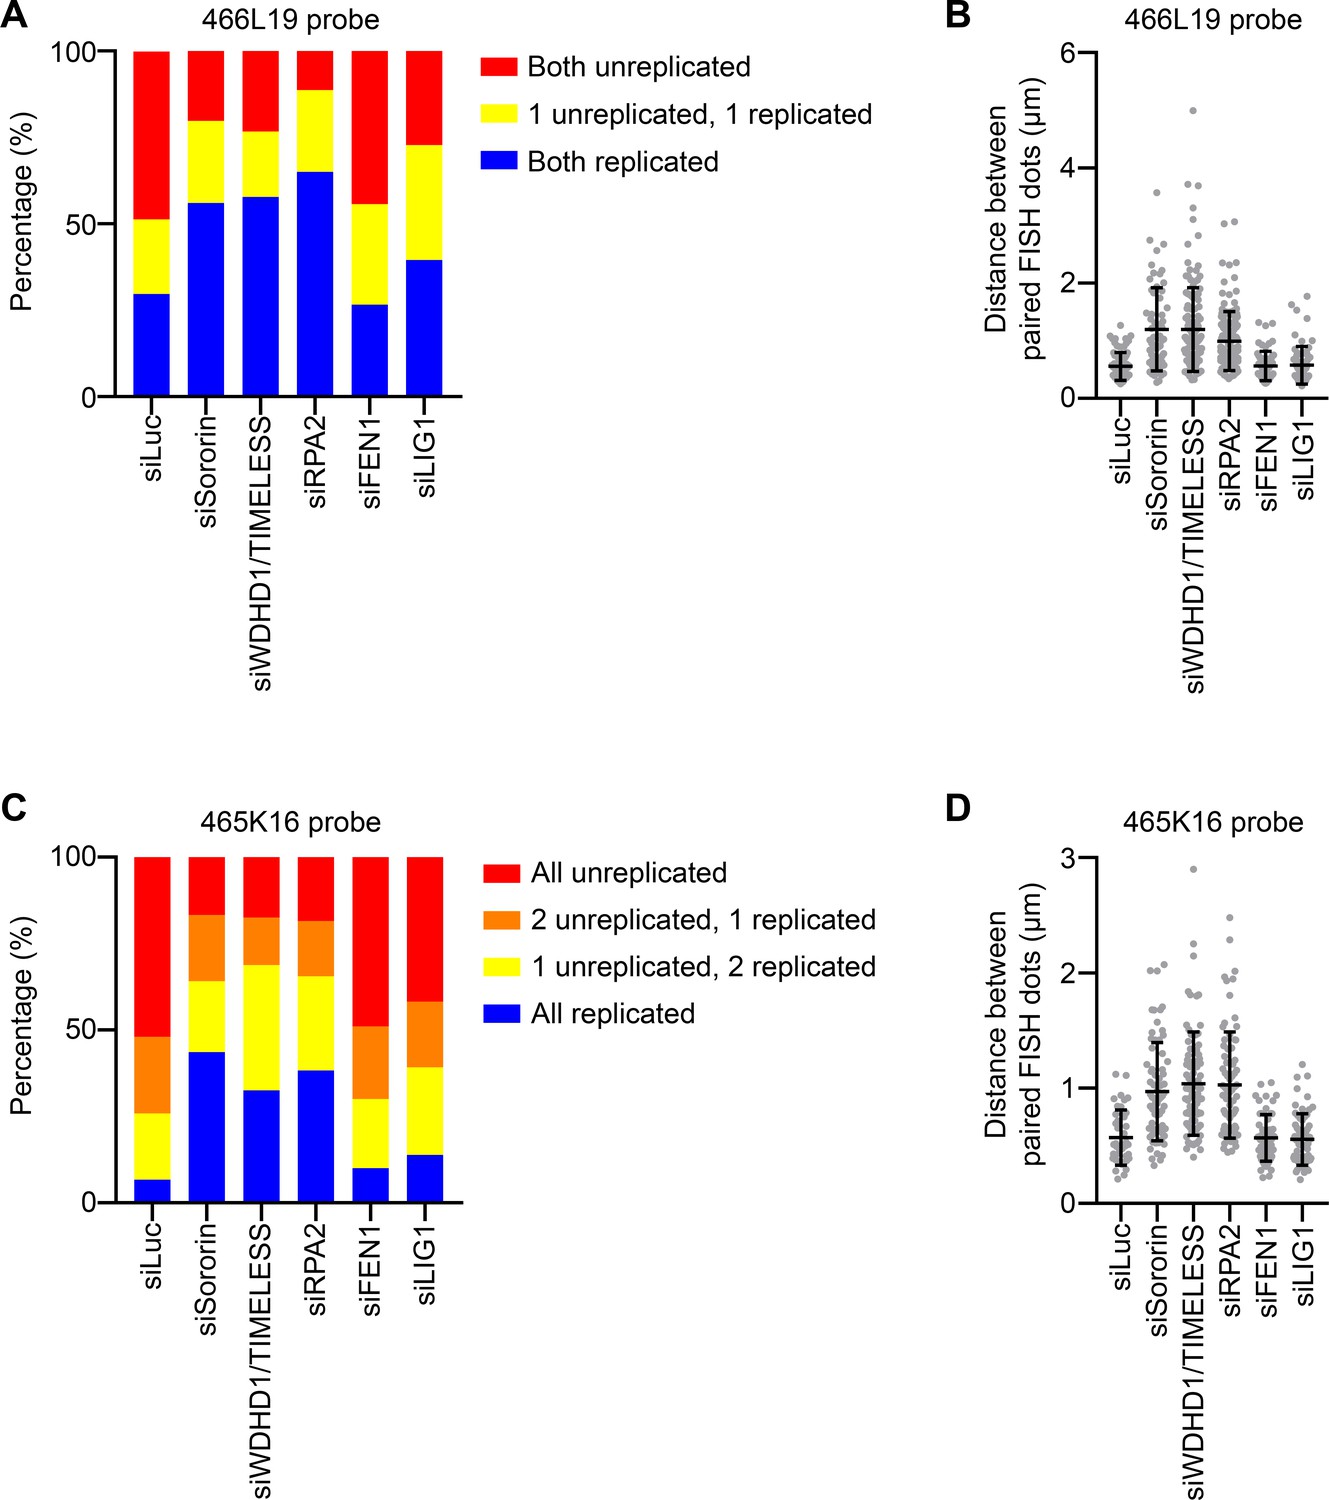
(A) Asynchronous cells or cells released from the thymidine arrest for the indicated times were harvested and stained with the 466L19 FISH probe. Quantification of the percentages of cells with two unreplicated single FISH dots (red), cells with one unreplicated FISH dot and one pair of replicated FISH dots (yellow), or cells with two pairs of replicated FISH dots (blue). (B) Asynchronous cells or cells released from the thymidine arrest for the indicated times were harvested and stained with the 465K16 FISH probe. Note that HeLa cells contains three copies of the chromosome locus recognized by this probe. Quantification of the percentages of cells with three unreplicated single FISH dots (red), cells with two unreplicated single FISH dots and one pair of replicated FISH dots (orange), cells with one unreplicated FISH dot and two pairs of replicated FISH dots (yellow), or cells with three pairs of replicated FISH dots (blue). (C) Representative images of G2-enriched HeLa cells transfected with the indicated siRNAs and stained with DAPI (blue in merge) and the 465K16 FISH probe (red in merge). Selected paired FISH signals are magnified and shown in inset. Scale bar, 5 μm. (D) Quantification of the distances between paired FISH signals of cells in C). Mean ±SD (siLuc, n = 65; siSororin, n = 70; siWDHD1/TIMELESS, n = 125; siRPA2, n = 116; siFEN1, n = 67; siLIG1, n = 97).
Figure 6—figure supplement 3
Depletion of RPA causes interphase cohesion defects in asynchronous cells.
(A) HeLa cells were transfected with the indicated siRNAs and stained with the 466L19 FISH probe. The percentages of cells with two unreplicated single FISH dots (red), cells with one unreplicated FISH dot and one pair of replicated FISH dots (yellow), or cells with two pairs of replicated FISH dots (blue) were quantified and shown. (B) Quantification of the distances between paired FISH signals of cells transfected with the indicated siRNAs and stained with the 466L19 FISH probe. Mean ±SD (siLuc, n = 81; siSororin, n = 60; siWDHD1/TIMELESS, n = 140; siRPA2, n = 133; siFEN1, n = 63; siLIG1, n = 68). (C) HeLa cells were transfected with the indicated siRNAs and stained with the 465K16 FISH probe. Quantification of the percentages of cells with three unreplicated single FISH dots (red), cells with two unreplicated single FISH dots and one pair of replicated FISH dots (orange), cells with one unreplicated FISH dot and two pairs of replicated FISH dots (yellow), or cells with three pairs of replicated FISH dots (blue). (D) Quantification of the distances between paired FISH signals of cells transfected with the indicated siRNAs and stained with the 465K16 FISH probe. Mean ±SD (siLuc, n = 40; siSororin, n = 70; siWDHD1/TIMELESS, n = 83; siRPA2, n = 74; siFEN1, n = 59; siLIG1, n = 64).
Figure 6—figure supplement 4
RPA2 promotes cohesin loading in S phase.
Quantification of the intensities of chromatin-bound STAG2 in HeLa cells transfected with the indicated siRNAs and synchronized in early S phase by thymidine. Each dot in the graph represents a single cell. Mean ±SD (siLuc, n = 58; siMCM2, n = 117; siCDC7, n = 47; siNIPBL, n = 45; siSTAG2, n = 48; siRPA2, n = 21).
Figure 7 with 1 supplement
MCM2–7-mediated cohesin loading and mobilization promote sister-chromatid cohesion.
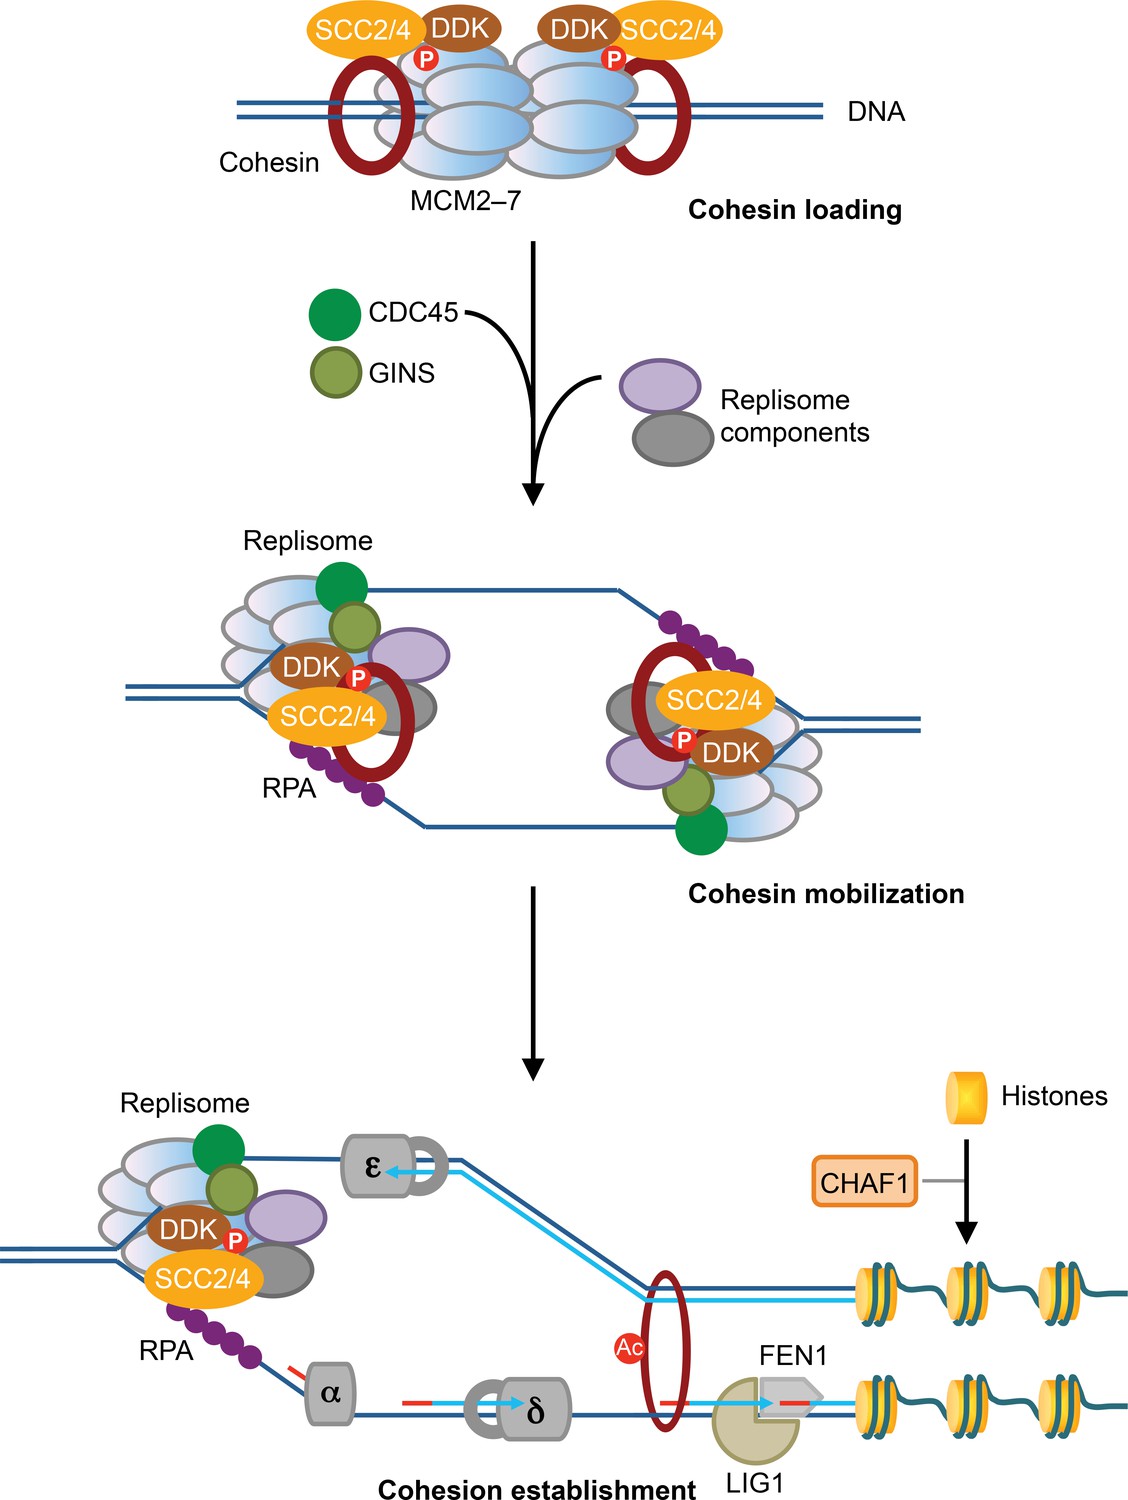
In this speculative model, SCC2/4 (NIPBL/MAU2 in humans) associates with DDK and the dormant, phosphorylated MCM2–7, and promotes cohesin loading at the G1/S boundary. The loaded cohesin remains physically associated with SCC2/4, DDK, and MCM2–7. Upon the activation of the helicase activity of MCM2–7 and the initiation of DNA replication, cohesin bound to the dormant MCM2–7 is mobilized and held at the active replication forks, through a process that requires SCC2/4, DDK, and a multitude of replisome components, including RPA. Cohesin bound to the replication fork is then deposited behind the fork prior to the completion of lagging strand synthesis and histone deposition, and entraps both sister chromatids to establish sister-chromatid cohesion.
Figure 7––Figure Supplement 1
DDK-bound, potentiated MCM promotes cohesin loading and mobilization.
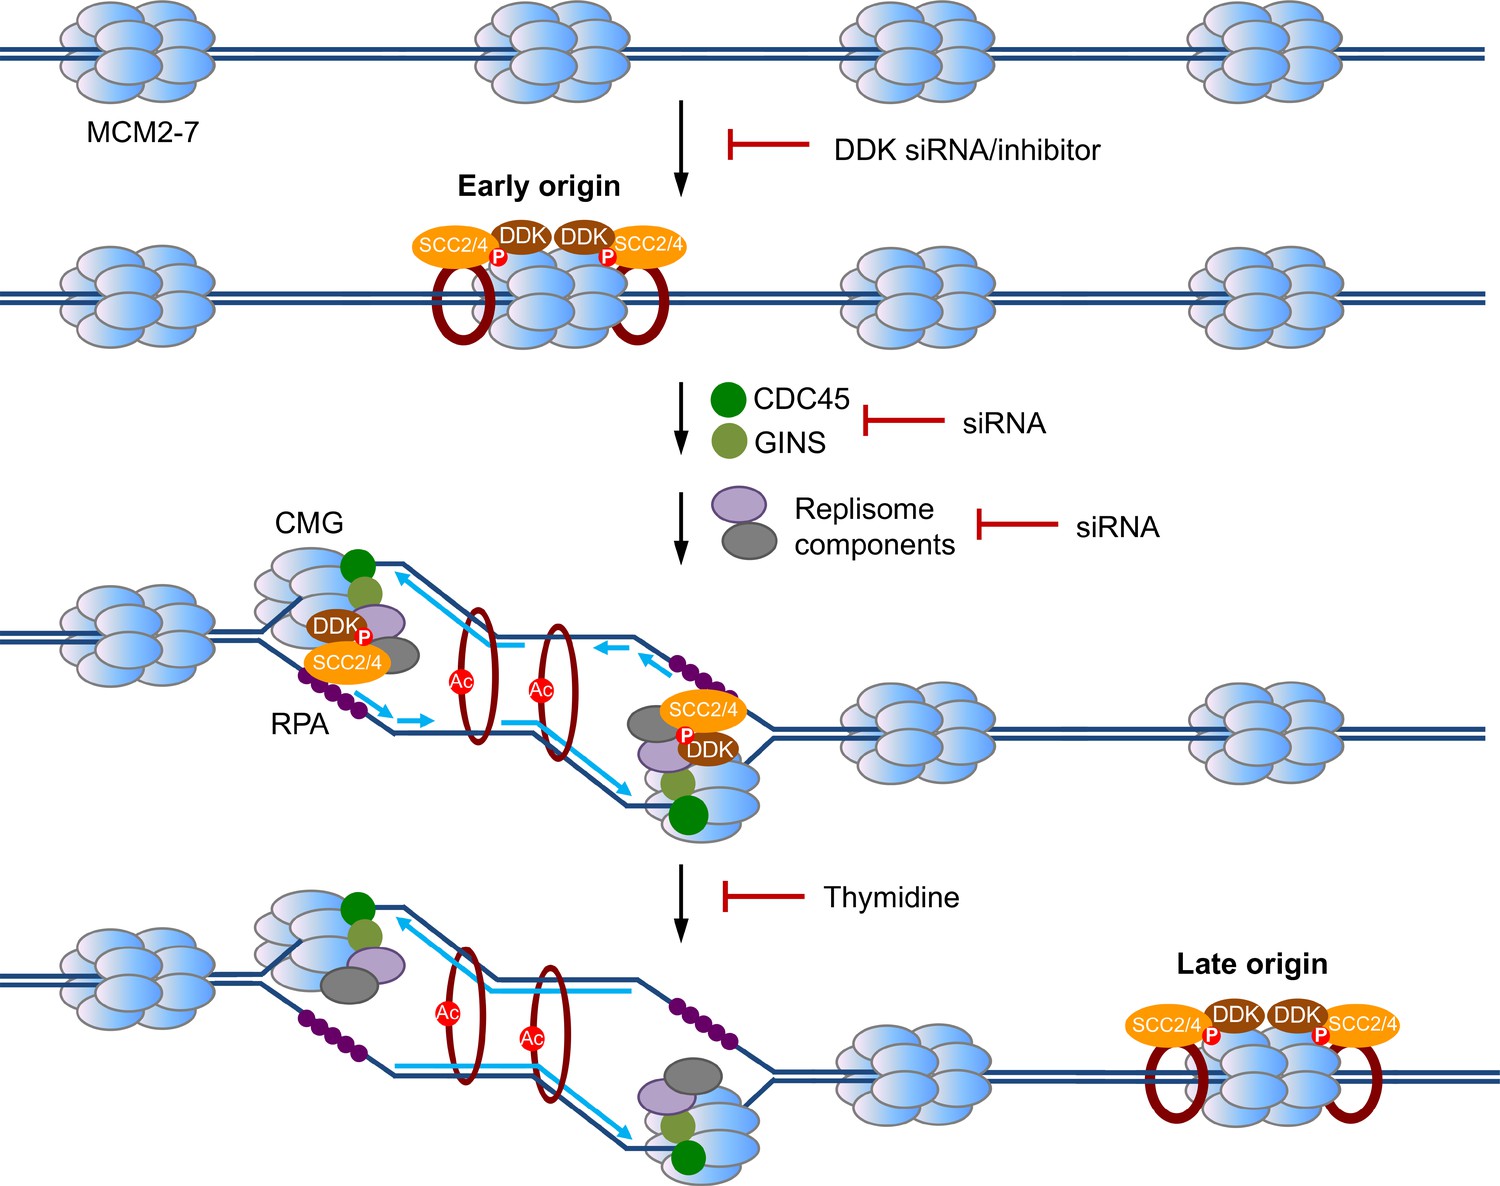
Based on this model, only the potentiated MCM complexes bound to DDK (which is limiting) can recruit cohesin and SCC2/4 (NIPBL/MAU2 in humans). These potentiated complexes are destined to fire early during DNA replication, thus marking the early-replicating origins. In thymidine-arrested cells, a large fraction of these early-replicating origins has fired. Continued binding of cohesin and SCC2/4 at these origins requires replisome components in these early S phase cells. During S phase progression, DDK is mobilized and binds to other MCM complexes. These potentiated MCM complexes at late-replicating origins then recruit cohesin and SCC2/4 and repeat the process of cohesin loading and mobilization.
Additional files
-
Supplementary file 1
siRNAs used in this study.
- https://doi.org/10.7554/eLife.33920.023
-
Transparent reporting form
- https://doi.org/10.7554/eLife.33920.024
Download links
A two-part list of links to download the article, or parts of the article, in various formats.
Downloads (link to download the article as PDF)
Open citations (links to open the citations from this article in various online reference manager services)
Cite this article (links to download the citations from this article in formats compatible with various reference manager tools)
MCM2–7-dependent cohesin loading during S phase promotes sister-chromatid cohesion
eLife 7:e33920.
https://doi.org/10.7554/eLife.33920


