Drosophila Fezf coordinates laminar-specific connectivity through cell-intrinsic and cell-extrinsic mechanisms
- Harvard Medical School, United States
- European Neuroscience Institute, Germany
- Stanford University, United States
Figures
Figure 1
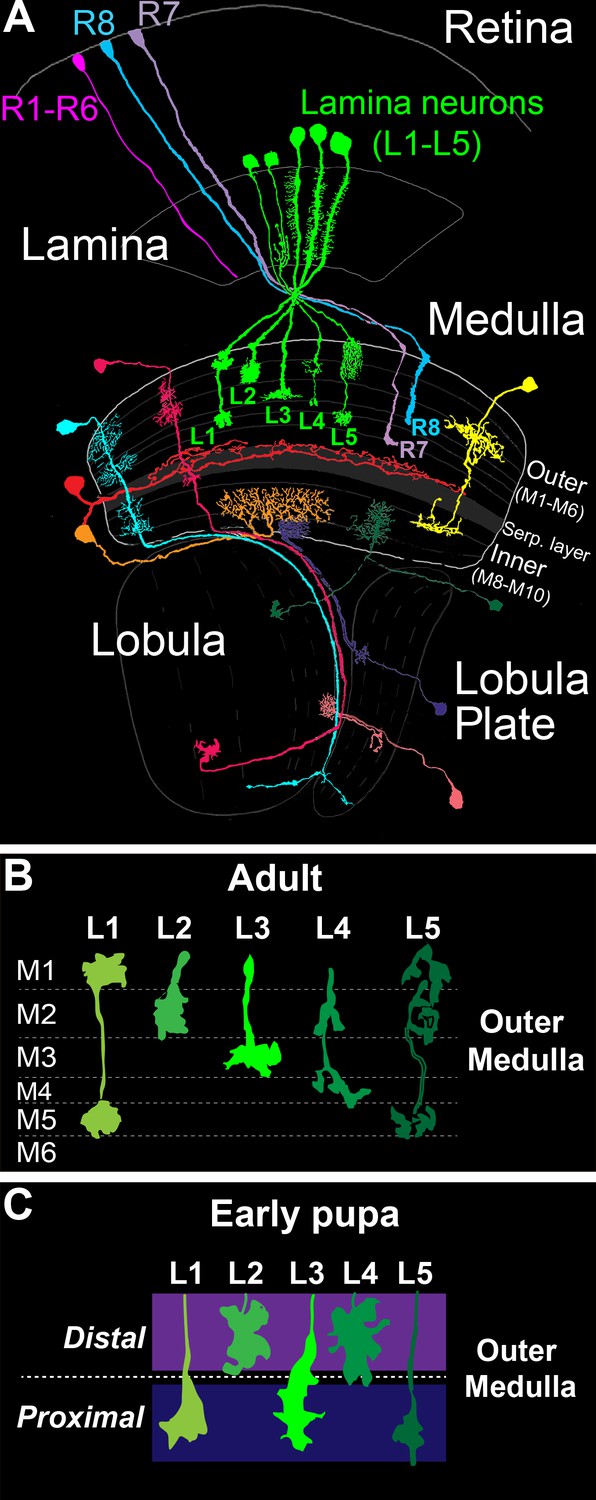
The Drosophila visual system and lamina monopolar neurons.
(A) Anatomy of the Drosophila visual system (Adapted from Fischbach and Dittrich, 1989). The optic lobe comprises four consecutive neuropil regions called the lamina, medulla, lobula and lobula plate. (B) Cartoon of lamina neuron axons in adult flies. The nearly mutually exclusive axonal arborizations of lamina neurons help define layers M1-M5. (C) Cartoon of lamina neuron growth cones in early pupal development. Prior to innervating discrete layers, lamina growth cones terminate in broad distal or proximal domains within the outer medulla.
Figure 2
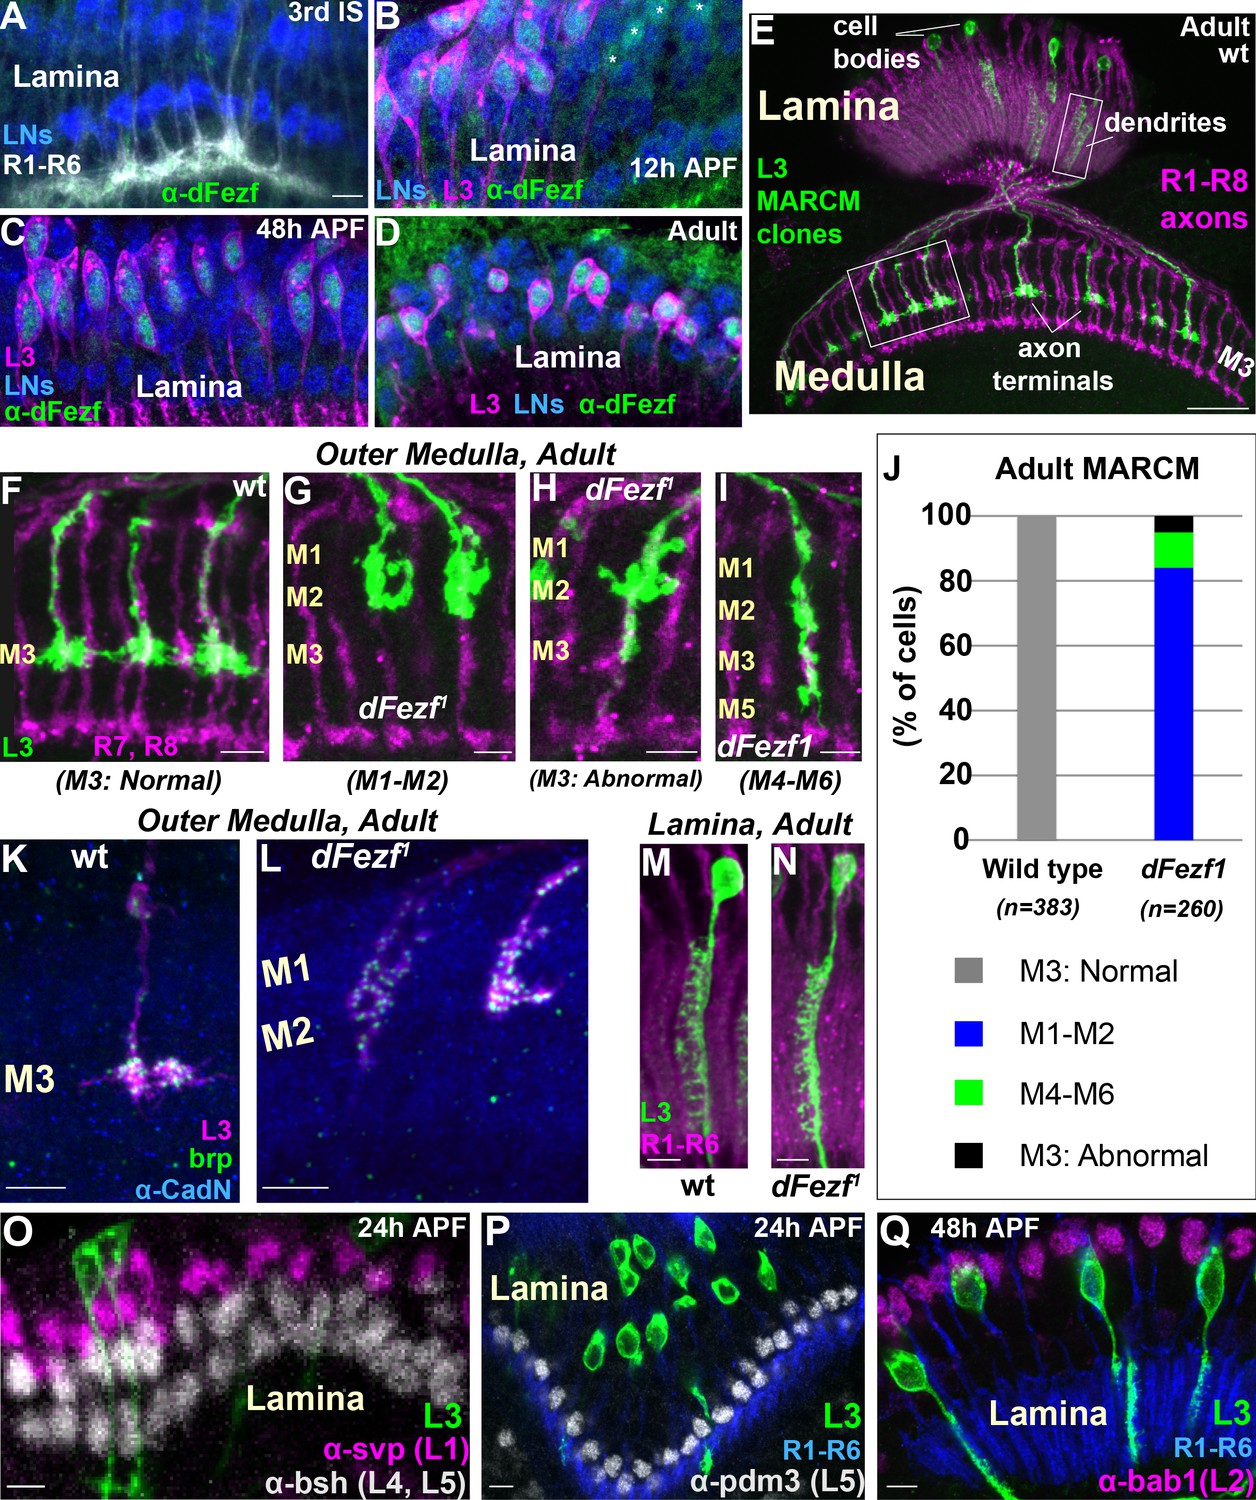
DFezf is cell autonomously required for L3 layer specificity and axon terminal morphology.
(A–D) Confocal images showing dFezf protein expression in the lamina from the late 3rd Instar larval stage through to adulthood (newly eclosed flies). DFezf expression (green) was observed through immunohistochemistry using a specific antibody. Elav immunostaining (blue) labels all lamina neurons (LNs). At least five brains were examined per time point. Scale bar = 5 microns and applies to all images. (A) DFezf (green) is not expressed in the lamina during the 3rd Instar larval stage. Lamina neurons (blue) differentiate in close proximity to R1-R6 axons (white, mAB24B10) forming columnar-like cartridges oriented orthogonally to the lamina plexus (thick white band) comprising R1-R6 terminals. (B–D) DFezf (green) is expressed exclusively in L3 neurons in the lamina during pupal development and in newly eclosed adults. L3 neurons (magenta) express myr::GFP (anti-GFP) driven by 9–9 GAL4 (Nern et al., 2008). Asterisks in (B) indicate dFezf-expressing lamina neurons (green + blue) that are most likely L3 neurons that have yet to turn on GAL4 expression (youngest L3 neurons). (E–N) MARCM + STaR experiments in adult flies. See Materials and methods section for a detailed description. Scale bars when shown are five microns with the exception of the scale bar shown in (E), which is twenty microns. L3 clones (green) expressed myr::tandem Tomato (tdTomato) and were visualized using a DsRed antibody. (E) Broad view (confocal image) of the morphologies of wild type L3 clones (green) in the lamina and medulla, which are indicated by R1-R8 axons (magenta, mAB24B10). Boxed regions indicate examples of the regions shown in confocal images in F-I, M and N. (F–I) Confocal images of terminals from wild type or dFezf1 L3 neurons (green), within the outer medulla (M1-M6), defined by R7 and R8 axons (magenta, mAB24B10). (J) Adult MARCM quantification. N is the total number of neurons counted per genotype. 10 brains were analyzed for each genotype. (K, L) Confocal images show L3 clones (magenta) within the outer medulla and, within L3 terminals, Brp (green) expression and localization. Brp expressed from its native promoter within a bacterial artificial chromosome (BAC) was selectively tagged with smFPV5 in L3 MARCM clones, and visualized using an anti-V5 antibody. N-Cadherin (CadN) immunostaining (blue) serves as a neuropil marker. All dFezf1 L3 neurons displayed Brp puncta in their terminals. At least five brains were analyzed for each genotype. (M and N) Morphologies of dendrites from wild type or dFezf1 L3 neurons in the lamina. The lamina is indicated by R1-R6 axons (magenta, mAB24B10). (O–Q) MARCM experiments analyzed at 24 or 48 hr APF. DFezf1 L3 clones (green) express myr::GFP (9–9 GAL4) and are visualized using a GFP antibody. Co-labeling of L3 somas and transcription factors specific for other lamina neuron subtypes (using specific antibodies) show that the mutant neurons do not express these proteins. (P and Q) R1-R6 axons (blue, mAB24B10) demarcate lamina cartridges and the lamina plexus.
-
Figure 2—source data 1
Input data for bar graph Figure 2J.
- https://doi.org/10.7554/eLife.33962.004
Figure 3 with 2 supplements
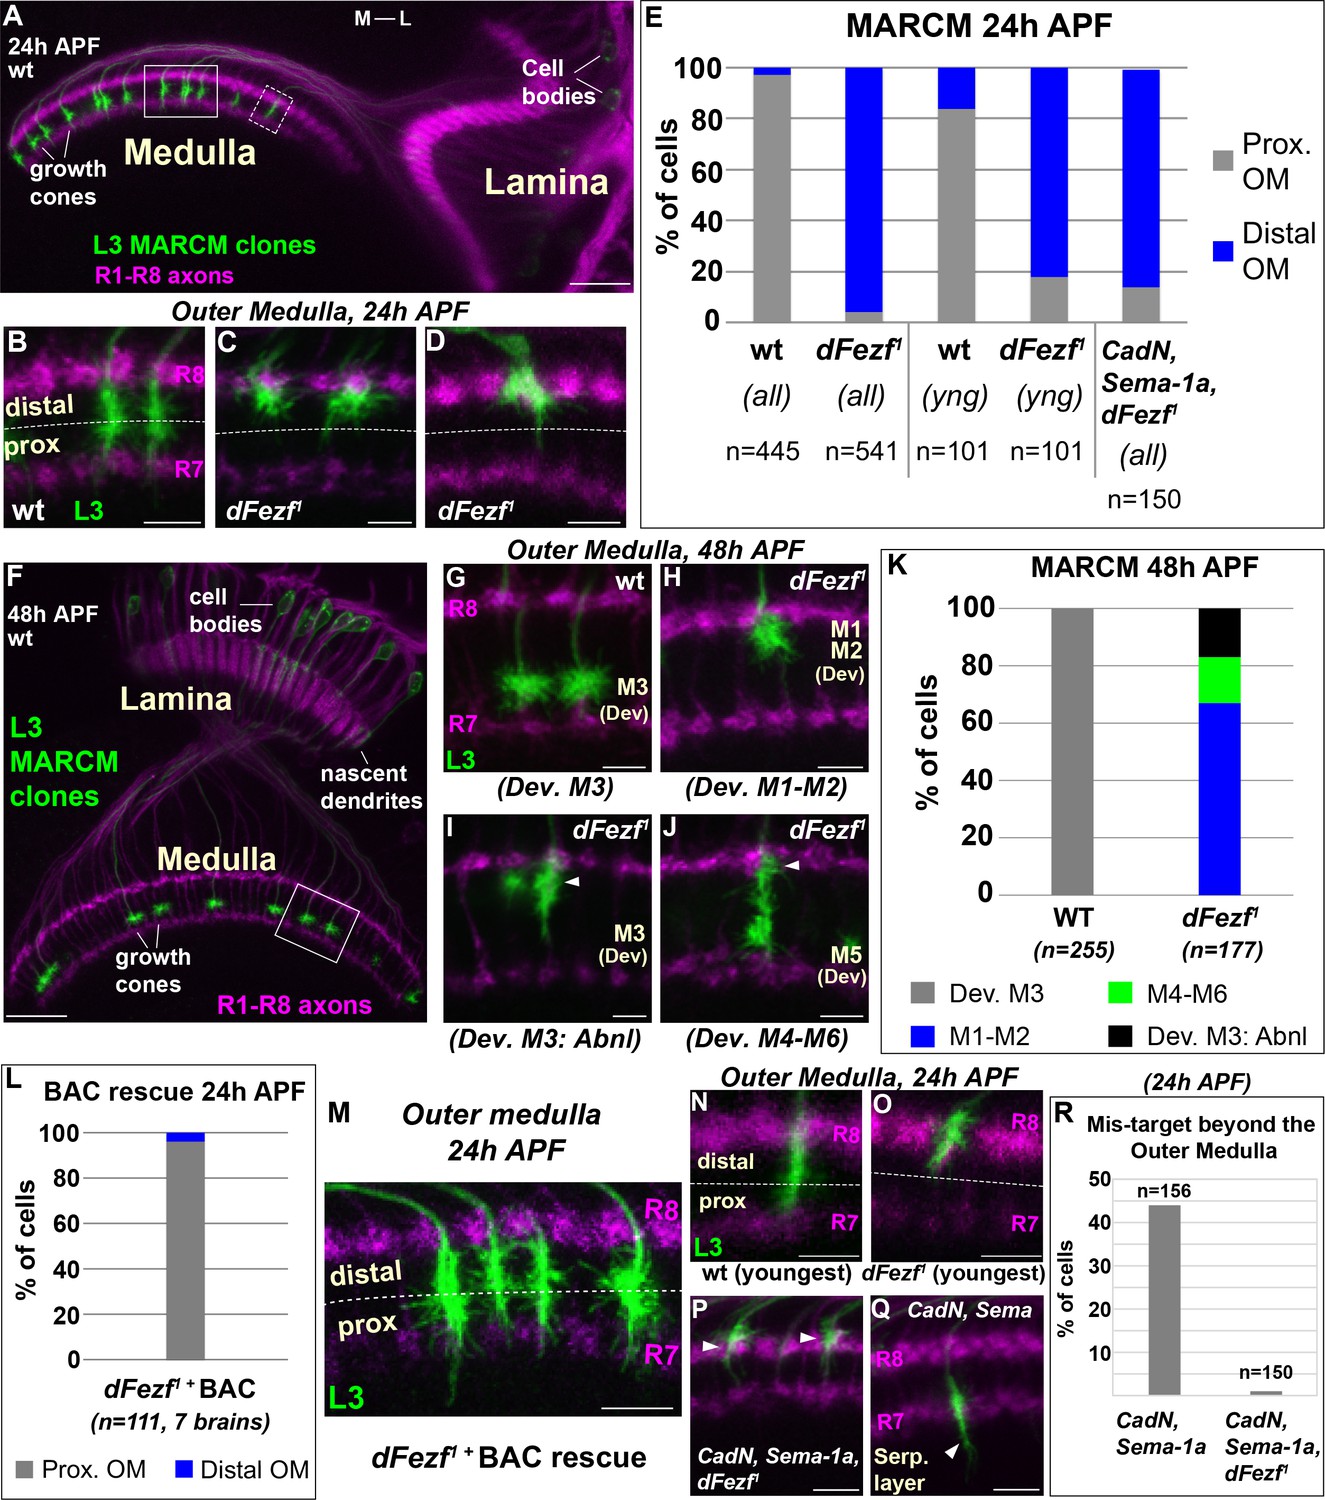
DFezf is required for the targeting of L3 growth cones to the proximal domain of the outer medulla.
(A–R) MARCM experiments analyzed at 24 or 48 hr APF. L3 clones expressed myr::GFP driven by 9–9 GAL4 and were visualized in confocal images using a GFP antibody. In confocal images, mAB24B10 (magenta) was used to label photoreceptor axons, which demarcate the lamina and medulla. Within the medulla, mAB24B10 labels R8 and R7 growth cones, which define the boundaries of the outer medulla. In some images R7 growth cones may appear faint. This reflects normal variations in antibody staining between brains of slightly different ages (e.g. ±2 hr). No defects in photoreceptor axon targeting were observed in these experiments. (A) Broad view of the morphologies of wild type L3 clones (green) within the lamina and medulla (indicated by R1-R8 axons, magenta [mAB24B10]) at 24 hr APF. The solid boxed region indicates an example of confocal images shown in B-D. The dashed boxed region shows an example of a newly born L3 clone in the most lateral part of the medulla array similar to N and O. M-L indicates medial and lateral. Scale bar = 20 microns. (B–D, G–J, M–Q) Confocal images show a zoomed in view of L3 growth cones within the outer medulla. At these stages of development the boundaries of the outer medulla are defined by R7 and R8 growth cones (magenta, mAB24B10). Scale bars = 5 microns. (E, K, L, R) Quantification of MARCM experiments. N is the total number of neurons per genotype that were counted. (E) WT (seven brains), dFezf1 (12 brains), CadN, Sema-1a, dFezf1 (two brains). (all) means that all L3 clones were counted while (yng) indicates that the L3 clones present within the most lateral five medulla columns containing R7 growth cones were counted (i.e. youngest L3 clones). Prox. OM = proximal domain of the outer medulla, Distal OM = distal domain of the outer medulla. (F) Broad view of the morphologies of wild type L3 clones in the lamina and medulla (indicated by R1-R8 axons, magenta [mAB24B10]) at 48 hr APF. The solid boxed region is an example of regions shown in confocal images in G-J. Scale bar = 20 microns. (I and J) Arrowheads indicate abnormal swellings within the developing M1-M2 layers. (K) Wild type (six brains), dFezf1 (six brains). (L) Prox. OM = proximal domain of the outer medulla, Distal OM = distal domain of the outer medulla. (P and Q) Arrowheads indicate the depths within the medulla at which L3 growth cones terminate. The serpentine layer (indicated in Q) lies directly beneath the outer medulla. (R) CadN, Sema-1a (two brains), CadN, Sema-1a, dFezf1 (two brains).
-
Figure 3—source data 1
Input data for bar graphs Figure 3E, K, L, R, and Figure 3—figure supplement 1; Figure 3—figure supplement 2B,2D and 2F.
- https://doi.org/10.7554/eLife.33962.008
Figure 3—figure supplement 1
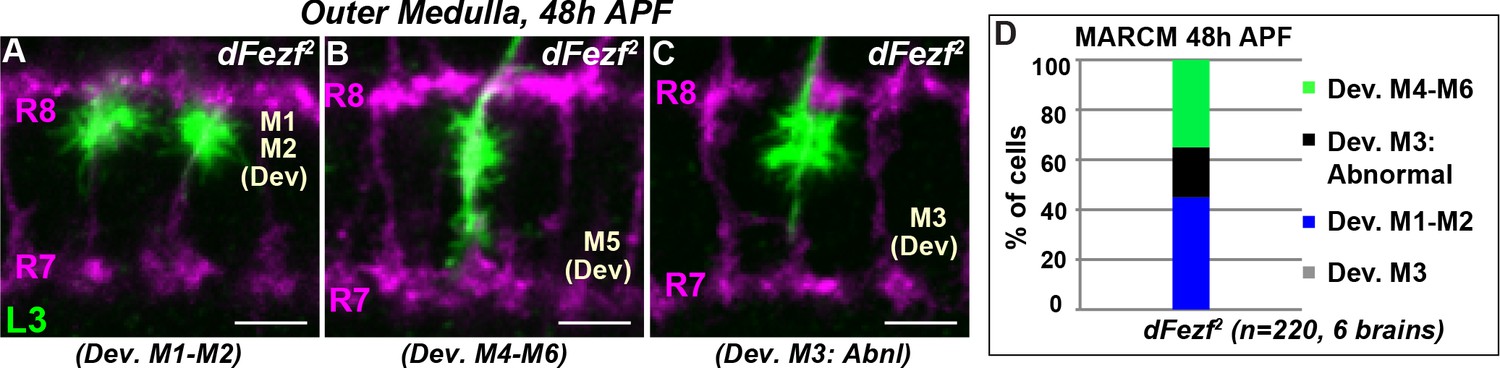
DFezf2 L3 neurons show mis-targeting phenotypes similar to those caused by the dFezf1 allele.
(A–C) As in Figure 3, MARCM experiments were performed to generate dFezf2 L3 clones (green) labeled by myr::GFP driven by 9–9 GAL4. At 48 hr APF, L3 clones are visualized by confocal microscopy using a GFP antibody. Confocal images show L3 growth cones within the outer medulla which is defined by R7 and R8 axons (magenta, mAB24B10). The abnormal targeting and morphologies of the growth cones of mutant neurons resembles that observed for the growth cones of dFezf1 neurons (Figure 3H–J). All scale bars = 5 microns. (D) Quantification of MARCM experiments at 48 hr APF. N is the number of neurons that are quantified.
Figure 3—figure supplement 2
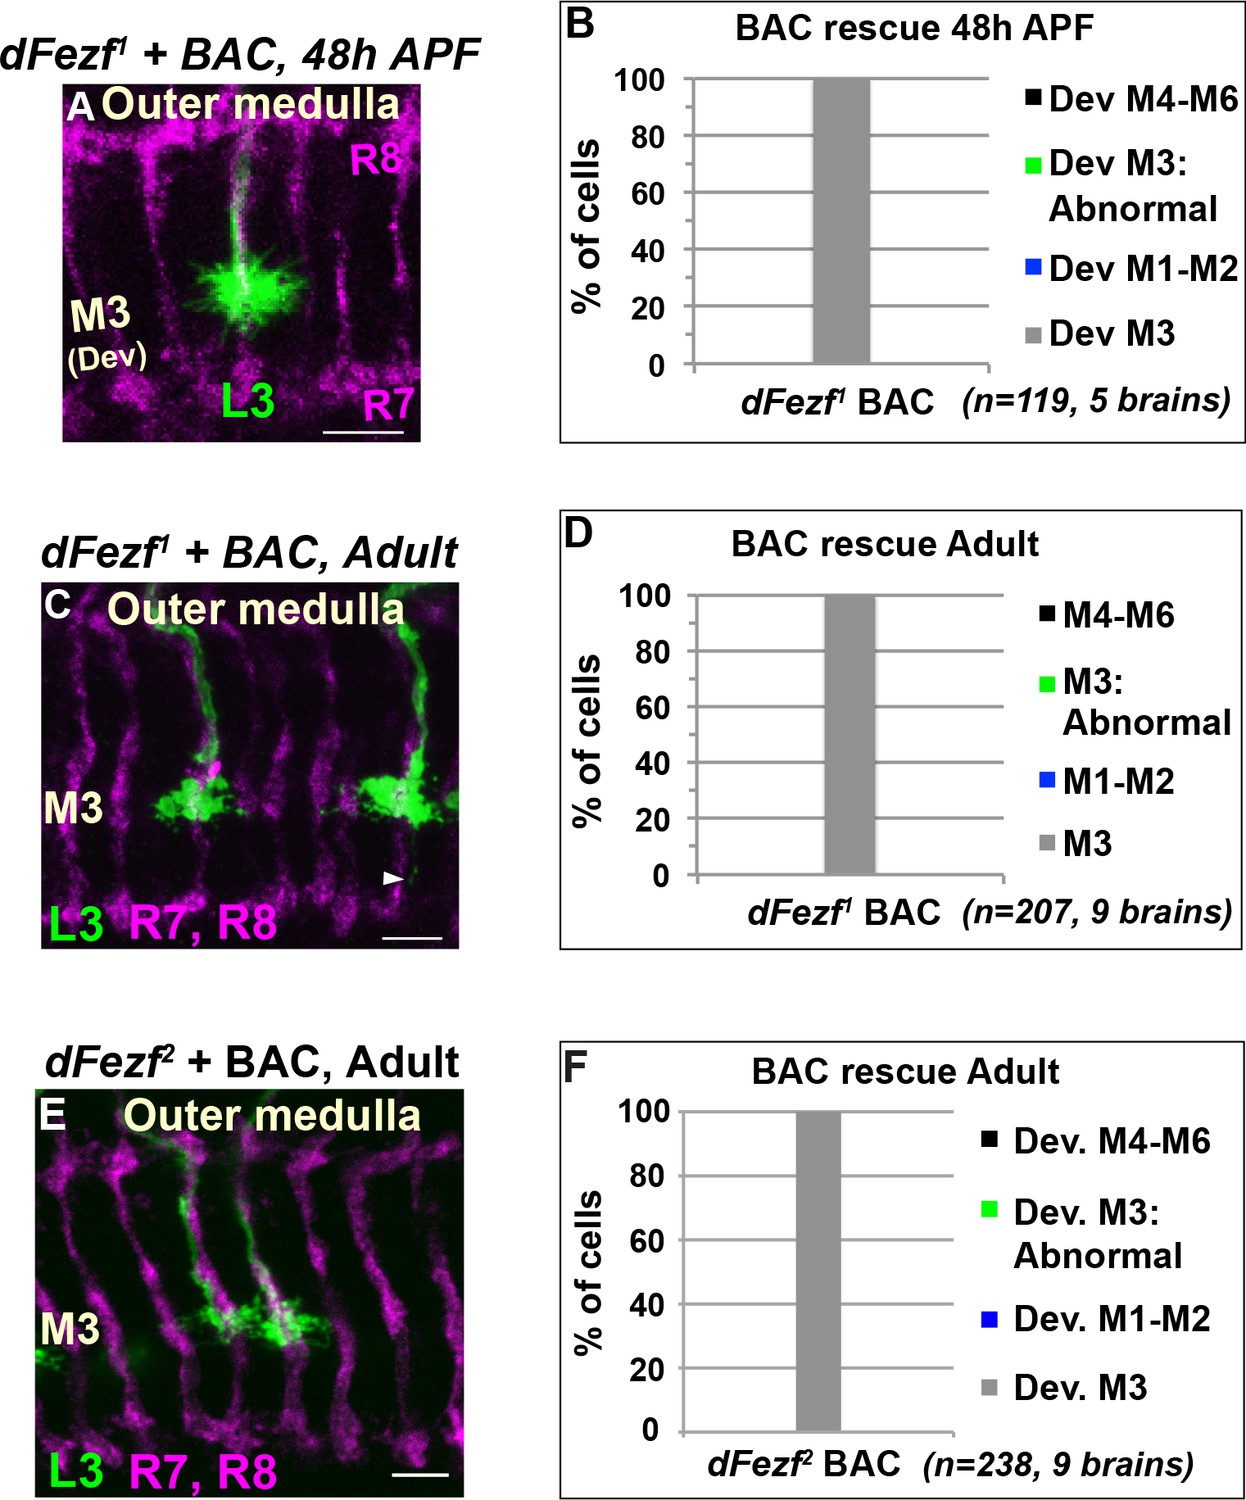
A BAC containing the dFezf locus rescues defects in growth cone targeting, layer specificity and axon terminal morphology caused by dFezf null mutations.
(A–F) MARCM experiments analyzed at 48 hr APF or just after eclosion (Adult). L3 neurons are made homozygous for dFezf1 or dFezf2 in the presence of a single copy of a bacterial artificial chromosome (BAC) containing the dFezf locus (18B02). (A, C, E) Confocal images of L3 clones (myr::GFP driven by 9–9 GAL4) in the outer medulla. R7 and R8 axons (magenta, mAB24B10) define the boundaries of the outer medulla (24 and 48 hr APF) or provide a reference for outer layers (adult). Scale bars = 5 microns. (B, D, F) Quantification of MARCM experiments. N = the number of cells counted. (C) Arrowhead indicates a thin process from an L3 terminal extending toward the M6 layer. ~30% of L3 clones in this experiment display this minor abnormality. This likely reflects a partial defect in growth cone retraction from the proximal outer medulla.
Figure 4 with 1 supplement
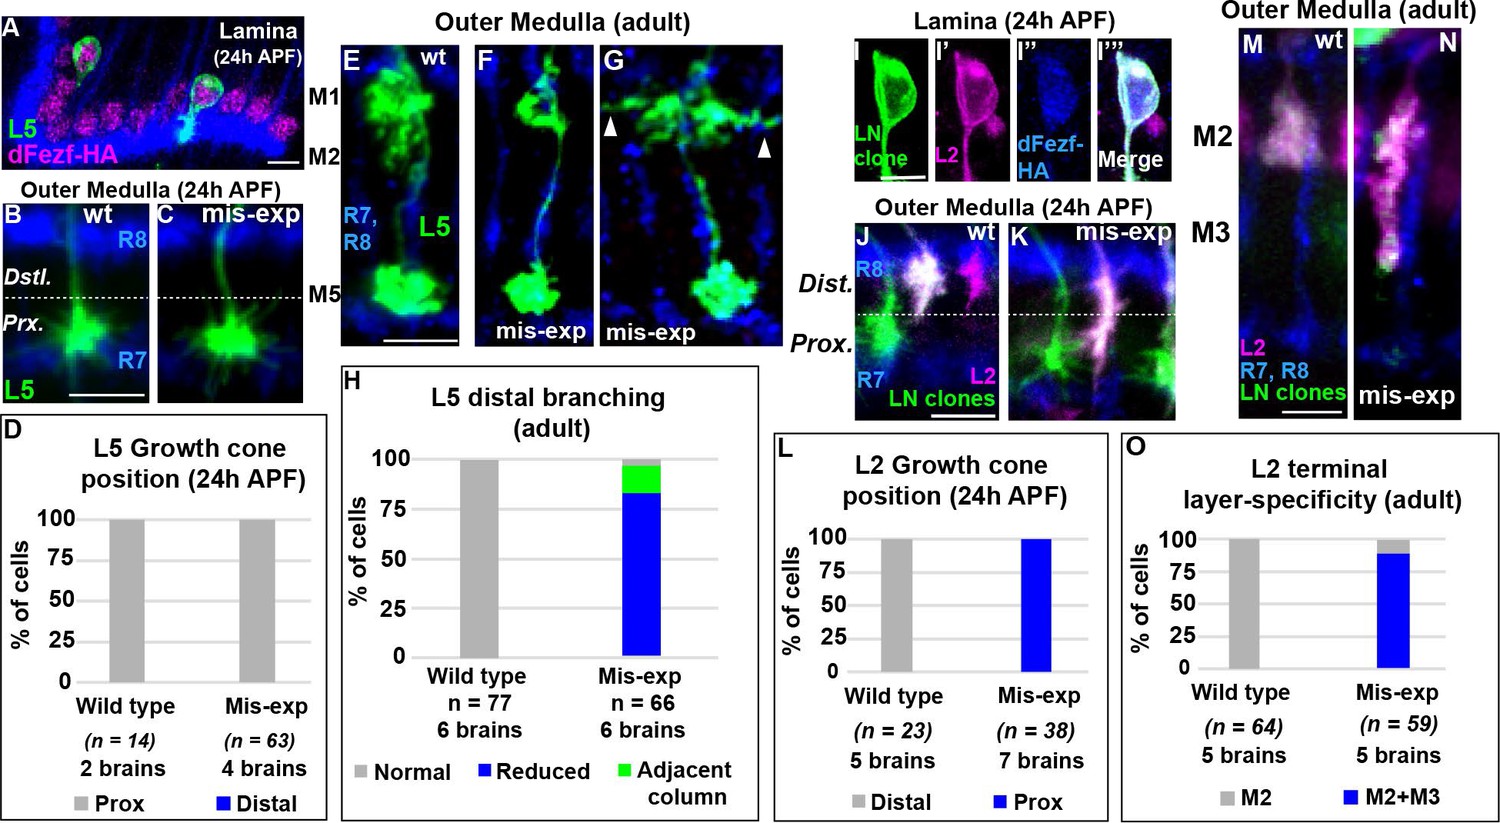
DFezf plays an instructive role in regulating growth cone targeting.
(A–H) L5 mis-expression experiments. DFezf-HA was expressed in L5 neurons using 6–60 GAL4, and sparse labeling of L5 neurons (myr::GFP, α-GFP) was achieved using the FlpOut method (see Materials and methods for detailed description). (A) DFezf-HA (magenta) is expressed in all L5 neurons, a subset of which are labeled with myr::GFP (green) using FlpOut. L5 neurons are easily identified based on position, as their somas are located directly distal to the lamina plexus defined by R1-R6 axons (blue, mAB24B10), which appears as a thick band. (B and C) Confocal images of L5 growth cones (green) within the outer medulla at 24 hr APF. R7 and R8 growth cones (blue, mAB24B10) define the boundaries of the outer medulla. (D) Quantification of L5 mis-expression experiments at 24 hr APF. N = the number of cells counted. (E–G) Confocal images of L5 axons (green) within the outer medulla in adult flies. Outer medulla layers are identified using R8 and R7 axons (mAB24B10, blue) as a reference. (H) Quantification of L5 mis-expression experiments in adult flies. N = the number of cells counted. (I–O) Mis-expression of dFezf-HA in L2 neurons in MARCM experiments. DFezf-HA was expressed in lamina neuron clones (green, myr::GFP: α-GFP) by 11–164 GAL4 (Nern et al., 2008). L2 neurons (magenta) were labeled with myr::tdTomato (α-DsRed) driven by 16H03-LexA. L2 MARCM clones are double positive for myr::GFP and myr::tdTomato and appear white. (I–I’’’) DFezf-HA (blue, α-HA) is expressed in L2 MARCM clones (white) that are double positive for myr::GFP and myr::tdTomato. (J and K) Confocal images showing L2 growth cone targeting within the outer medulla at 24 hr APF. R7 and R8 growth cones (blue, mAB24B10) define the boundaries of the outer medulla. Scale bar = 5 microns. (L) Quantification of L2 mis-expression experiments at 24 hr APF. N = the number of cells counted. (M and N) Confocal images showing L2 axon targeting within the outer medulla in adult flies. R7 and R8 axons (blue, mAB24B10) define outer medulla layers. Scale bar = 5 microns. (O) Quantification of L2 mis-expression experiments in adult flies. N = the number of cells counted.
-
Figure 4—source data 1
Input data for bar graphs Figure 4D, H, L, and O.
- https://doi.org/10.7554/eLife.33962.011
Figure 4—figure supplement 1

DFezf mis-expression in L5 and L2 neurons.
(A) 6–60 GAL4 drives expression of UAS-dFezf-3xHA (magenta, α-HA) in L5 neurons in the lamina (white arrowhead) and a subset of medulla (green arrowhead) and lobula neurons (yellow arrowhead). DFezf-HA is localized to cell bodies. Lamina (la), medulla (me), lobula (lo). (B–D) DFezf mis-expression in L2 neurons using a ‘weak’ FLP construct (27G05-FLP[attp18]) to generate sparse lamina neuron clones. 39D12-LexA was used to label L2 neurons (magenta, myr::tdTomato: α-DsRed), and L2 clones also expressed myr::GFP and so appear white in confocal images. (B and C) Confocal images of wild type and dFezf-HA expressing L2 axons in the outer medulla of adult flies. (D) Quantification of L2 mis-expression experiments in adult flies. L2 neurons were considered ‘isolated’ if they were the only clone within a column, and surrounded by columns without other MARCM clones. Thirteen of the sixteen L2 neurons mis-expressing dFezf-HA mis-targeted to M3. Of the thirteen mis-targeting neurons seven were ‘isolated’. These findings strongly support that dFezf cell autonomously instructs L2 mis-targeting in mis-expression experiments.
Figure 5 with 3 supplements
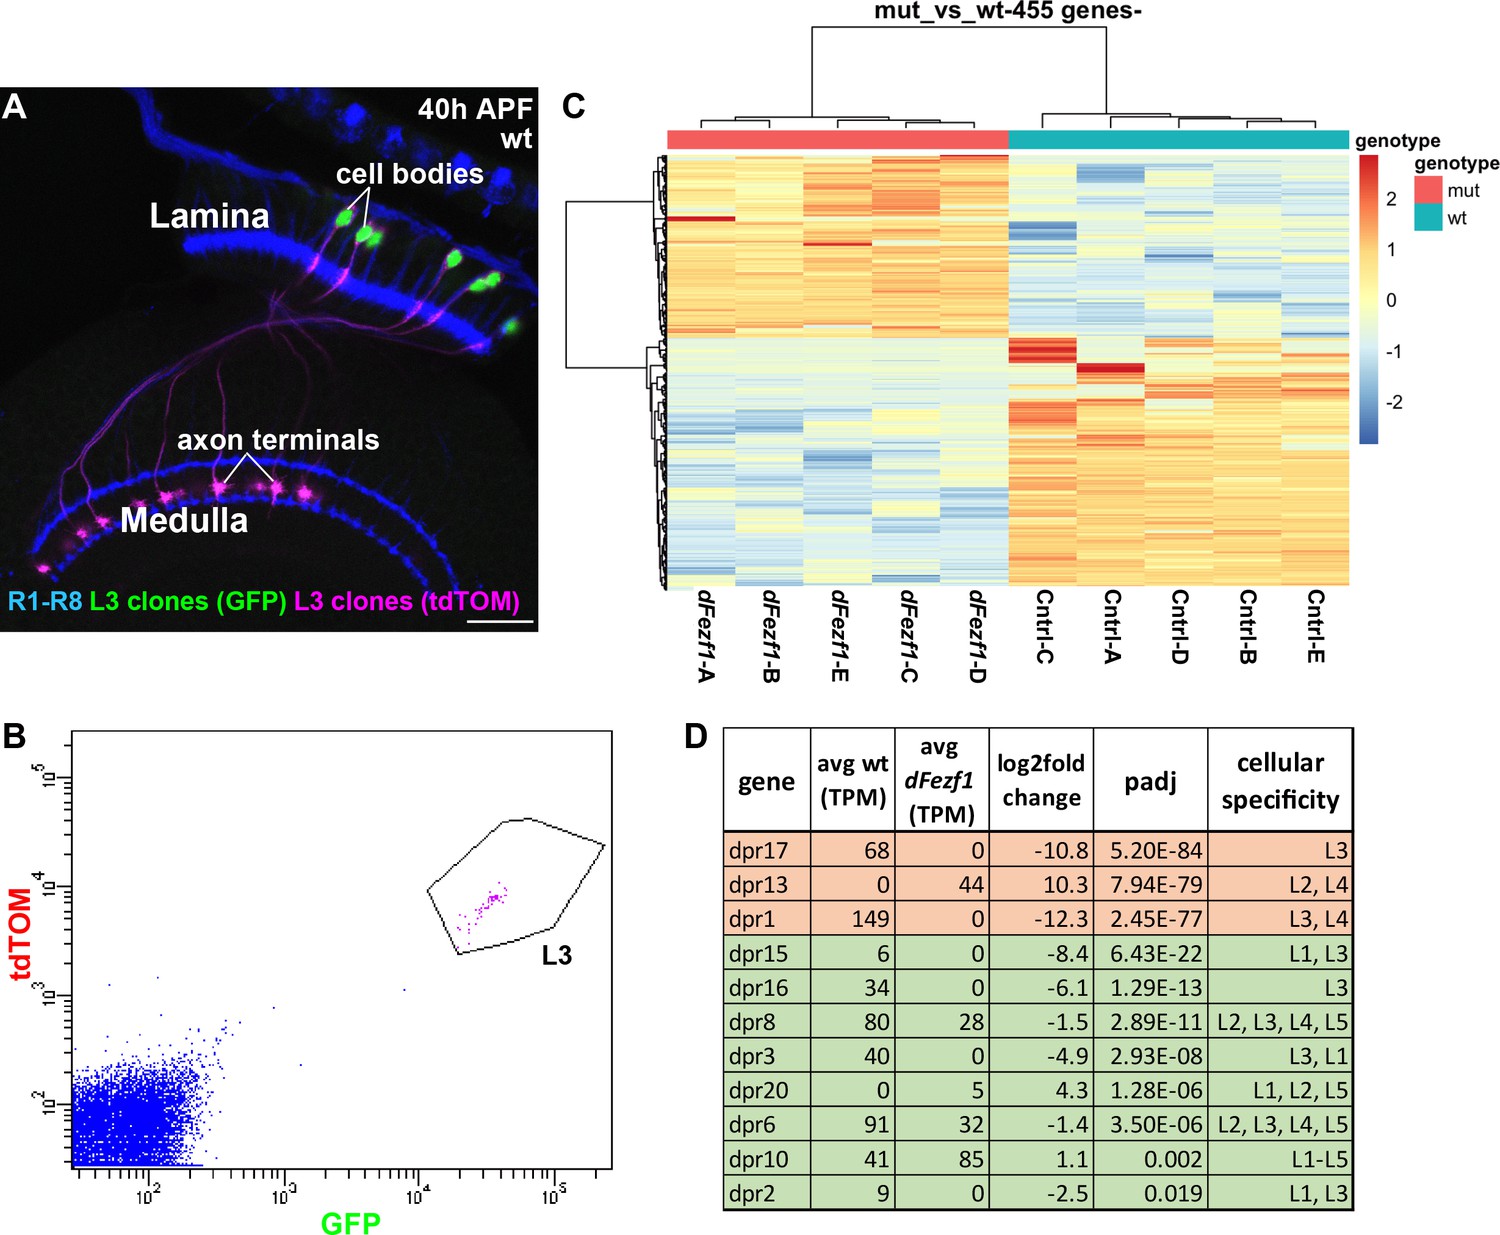
DFezf regulates a complex program of cell surface gene expression.
(A and B) MARCM was performed to generate and specifically label single wild type or dFezf1 L3 neurons at 40 hr APF. L3 clones were labeled with a nuclear reporter (H2A-GFP) and a transmembrane reporter (myr::tdTomato) by 9–9 GAL4. (A) A representative confocal image shows that L3 neurons are the only cell type labeled by both GFP (green) and tdTOM (magenta). Photoreceptor neurons (R1-R8) (blue, mAB24B10) are labeled as a reference for the lamina and medulla. Scale bar = 20 microns. (B) A representative FACS plot shows that L3 neurons expressing H2A-GFP and myr::tdTomato separated as a tight cluster from background cells (100K events are shown). (C) A heat map (row scaled) of differentially expressed genes that includes data from all samples. Each row represents the normalized expression of a differentially expressed gene, and each column represents a sample. Presenting the data in this manner shows that samples clearly separate based on genotype, and that large fractions of differentially expressed genes are either up or downregulated. (D) Table showing dpr genes that are differentially expressed between wild type and dFezf null L3 neurons. The genes are listed in order of significance (padj). The top three most significant DE genes overall, dprs 17, 13, and 1 are shown in red, and the rest of the genes are shown in green. TPM (transcripts per million mapped reads) values are averages across all samples for a given genotype.
Figure 5—figure supplement 1
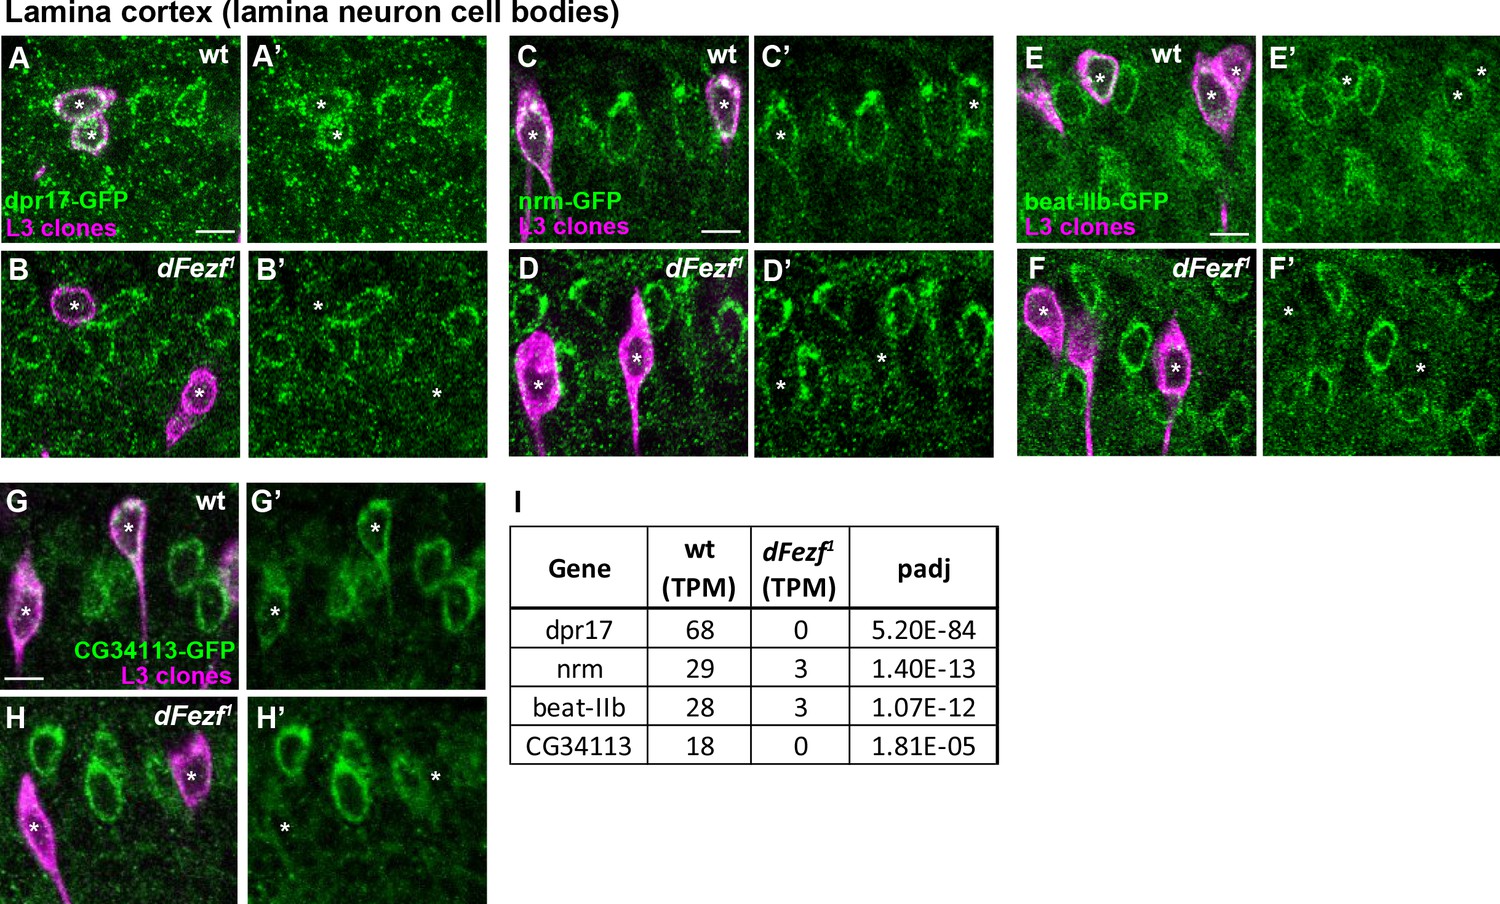
Validation of mRNA changes identified through RNA-seq at the protein level.
The endogenous protein expression of a subset of DE genes identified through RNA-seq was visualized in wild type or dFezf null L3 neurons (9–9 GAL4, myr::tdTomato: α-DsRed) using GFP-protein traps (Nagarkar-Jaiswal et al., 2015), in MARCM experiments. All the experiments were performed at 40 hr or 48 hr APF to be consistent with the RNA-seq data. Each panel shows a confocal image within the region of the lamina wherein lamina neuron cell bodies reside (i.e. the lamina cortex). All scale bars = 5 microns. (A–B’) Dpr17-expressing cells (green, α-GFP). Asterisks indicate the positions of wild type (A and A’) or mutant (B and B’) L3 clones (magenta). Dpr17 protein is considerably reduced in L3 neurons lacking dFezf function. (C–D’) Nrm expression (green, α-GFP). Asterisks indicate wild type (C and C’) or mutant (D and D’) L3 clones (magenta). Nrm protein is strongly reduced in dFezf null L3 neurons. (E–F’) Beat-IIb expression (green, α-GFP). Asterisks indicate wild type (E and E’) or mutant (F and F’) L3 clones (magenta). Beat-IIb protein expression is considerably downregulated when dFezf is disrupted. (G–H’) CG34113 expression (green, α-GFP). Asterisks indicate wild type (G and G’) or mutant (H and H’) L3 clones (magenta). CG34113 protein is drastically reduced in the absence of dFezf function. (I) Table showing levels of expression for the genes assessed in A-H’ in wild type or dFezf null L3 neurons at 40 hr APF. The TPM (transcripts per million mapped reads) levels shown are an average of all samples for each genotype.
Figure 5—figure supplement 2
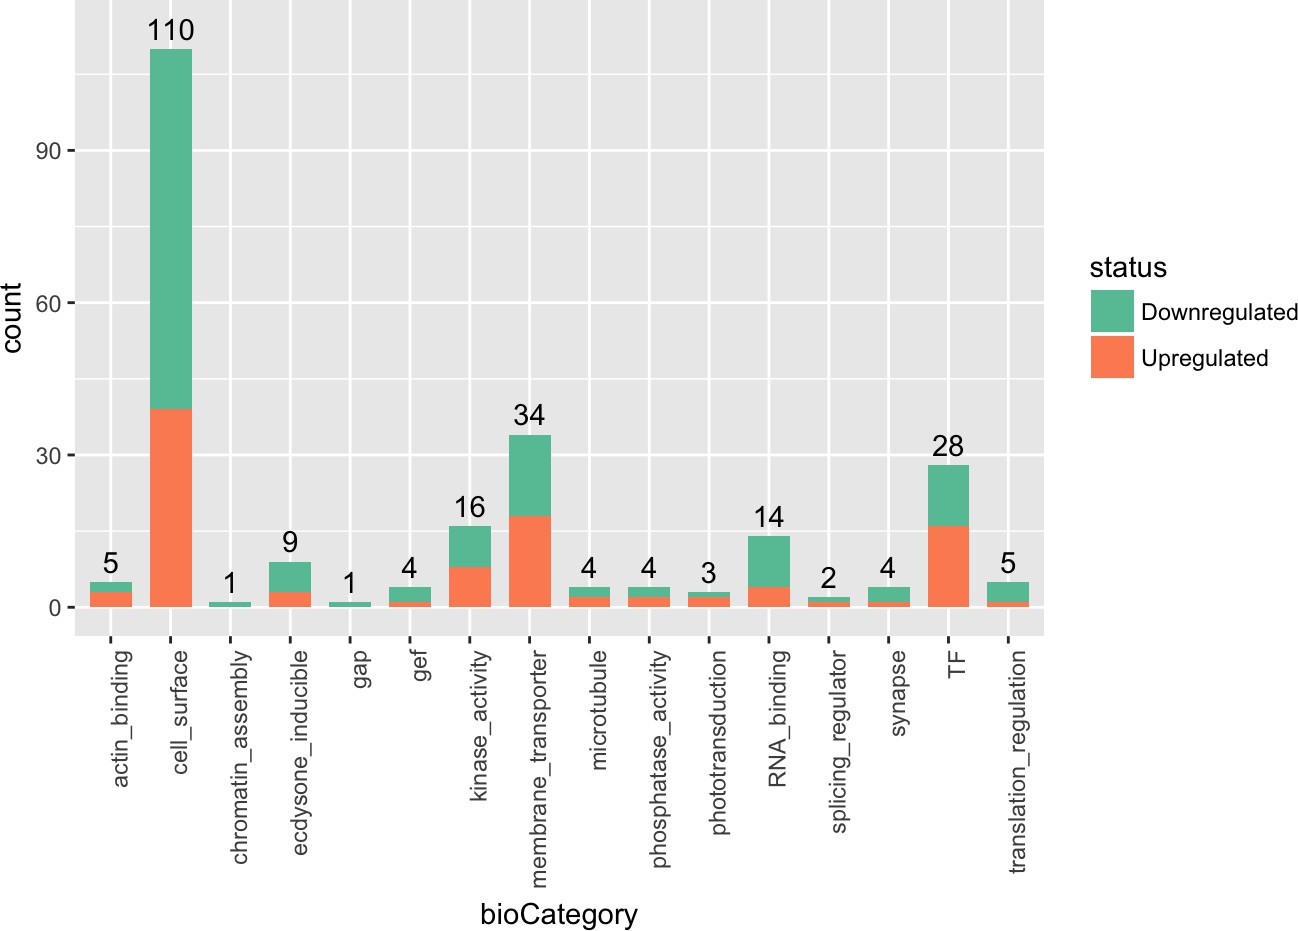
Biological categories of DE genes.
This shows the numbers of DE genes that fall within particular biological categories based on previously curated databases (Kurusu et al., 2008; Tan et al., 2015). The proportion of genes that are up or down regulated are indicated in different colors.
Figure 5—figure supplement 3
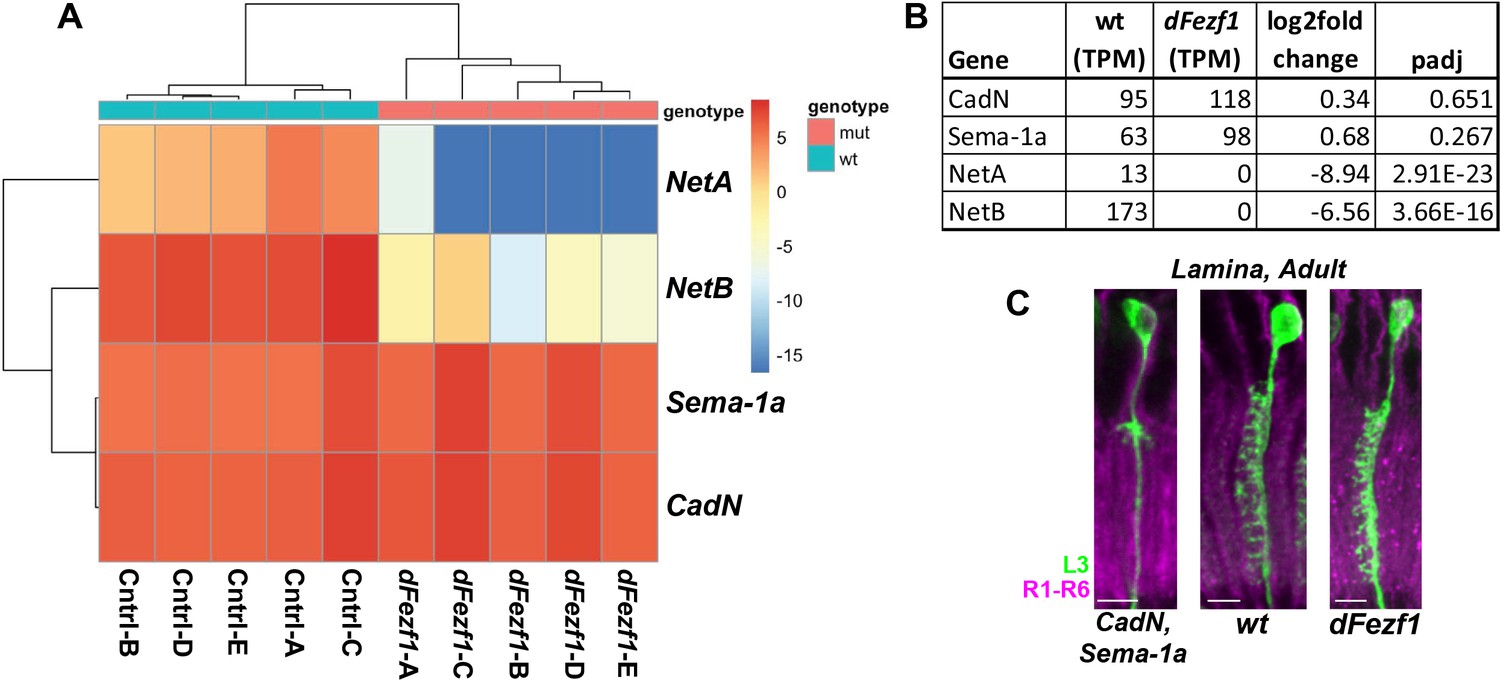
Expression of CadN, Sema-1a and Netrin-A/B in wild type and dFezf null L3 neurons.
(A) Heatmap of normalized counts for CadN, Sema-1a, Netrin-A and B (NetA/B) after applying an rlog transformation. This is a variance-stabilizing transformation, which transforms the count data to the log2 scale in a way that minimizes differences between samples for rows with small counts, and which normalizes with respect to library size. CadN and Sema-1a remain strongly expressed in the absence of dFezf function, while NetA and B are drastically reduced. (B) The average TPM (transcripts per million mapped reads) values for CadN, Sema-1a and NetA/B across all wild type and mutant samples are shown. (C) Disrupting Sema-1a and CadN in L3 neurons in MARCM experiments (as in Figure 3Q) drastically reduced L3 dendritic branches, while dendrites are not affected by the loss of dFezf function. L3 clones expressed myr::GFP driven by 9–9 GAL4 and were visualized in confocal images using a GFP antibody. R1-R6 axons (mAB24B10) were used as a reference for the lamina. Note that the wt and dFezf1 images shown here are the same as in Figure 2M and N.
Figure 6 with 1 supplement
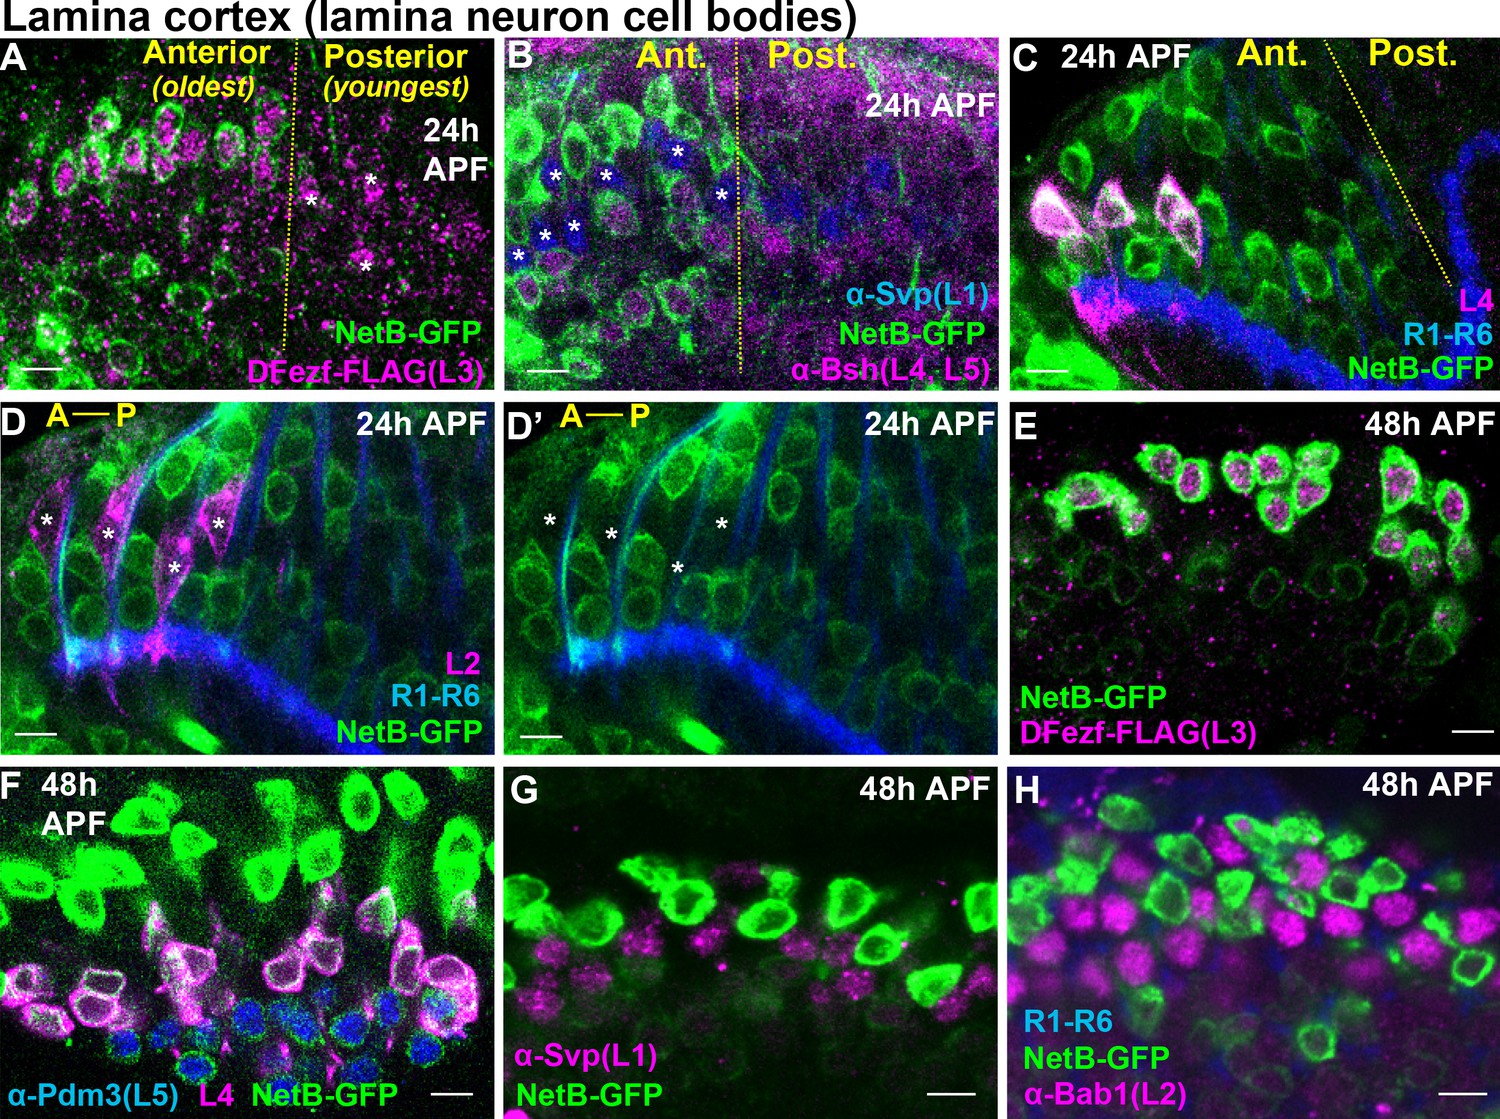
Cellular expression of NetB in the lamina during pupal development.
(A–H) NetB expression in the lamina at 24 or 48 hr APF. Endogenous NetB was visualized using a NetB-GFP protein trap (α-GFP). All confocal images are representative examples, and at least five brains were examined per genotype. All scale bars = 5 microns. (A–D’) In the lamina, lamina neurons are born in a wave (Anterior = oldest, Posterior = youngest). The yellow dashed lines in (A–C) indicate the anterior-posterior region of the lamina where NetB expression is first observed. In D and D’ anterior-posterior is indicated by A-P. (A) At 24 hr APF, NetB (green) was expressed in the anterior side of the developing lamina (to the left of the yellow dashed line) containing the oldest lamina neurons. NetB was expressed in L3 neurons (magenta, dFezf-FLAG). The youngest L3 neurons on the posterior side of the lamina that had not turned on NetB expression are indicated by asterisks. (B) At 24 hr APF, NetB (green) was detected in L4 and L5 neurons (magenta, α-bsh) in the oldest region of the lamina (to the left of the yellow dashed line). NetB (green) was not detected in L1 neurons (blue, α-svp, asterisks in the anterior region). (C) Consistent with findings shown in B, at 24 hr APF NetB (green) was expressed in the oldest L4 neurons (magenta) in the anterior region of the lamina (left of the dashed yellow line). L4 neurons were labeled using an L4-specific driver (31C06-LexA, LexAop-myr::tdTomato). At this stage 31C06-LexA drives expression in a small population of L4 neurons in the anterior region of the lamina. R1-R6 axons (blue. mAB24B10) provided a reference for the lamina. The image shown here is taken from a pupa that is slightly older than in A and B, as NetB is expressed in nearly all the lamina neurons in the field of view. (D and D’) NetB (green) was not expressed in L2 neurons (magenta) at 24 hr APF. L2 neurons were visualized using a specific driver (16H03-LexA, LexAop-myr::tdTomato) that drives expression in the most anterior (oldest) L2 neurons at this stage. R1-R6 axons (blue, mAB24B10) serve as a reference for the lamina. Asterisks show the positions of L2 somas. The image shown here is taken from a pupa that is slightly older than in A and B, as NetB is expressed in all the lamina neurons in the field of view. (E) NetB (green) is expressed in all L3 neurons (magenta, dFezf-FLAG) at 48 hr APF. (F) All L4 (magenta, 31C06-LexA, LexAop-myr::tdTomato) and L5 (blue, α-Pdm3) neurons express NetB at 48 hr APF. NetB expression in L4 and L5 neurons is weaker than in L3 neurons (green only). (G) NetB (green) is not expressed in L1 neurons (magenta, α-Svp) at 48 hr APF. (H) NetB (green) is not expressed in L2 neurons (magenta, α-Bab1) at 48 hr APF.
Figure 6—figure supplement 1
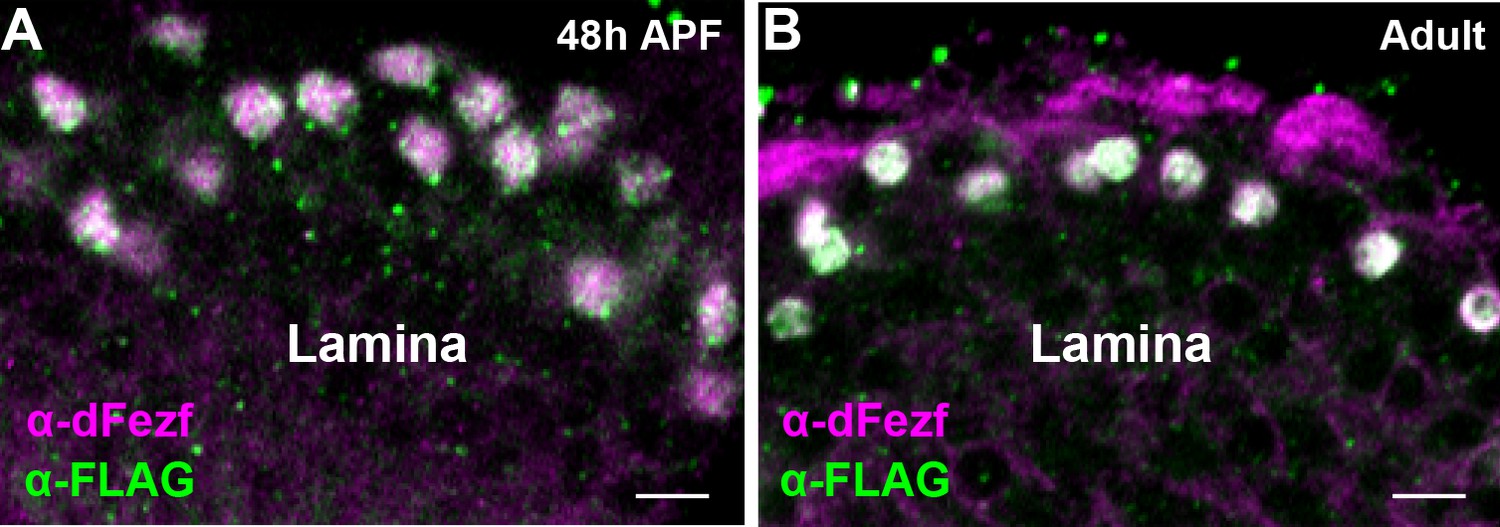
Characterization of dFezf-FLAG (BAC).
(A and B) A BAC (18B02) containing the dFezf locus was modified to incorporate sequence encoding three consecutive FLAG epitopes (3xFLAG) at the C-terminus prior to the translational stop. DFezf-FLAG (green) was detected in L3 somas by confocal microscopy using a FLAG antibody at 48 hr APF or in newly eclosed flies. All dFezf-FLAG expressing cells also expressed endogenous dFezf (magenta, α-dFezf), and all cells expressing endogenous dFezf expressed dFezf-FLAG. This confirms that dFezf-FLAG recapitulates the normal pattern of dFezf expression in the lamina.
Figure 7
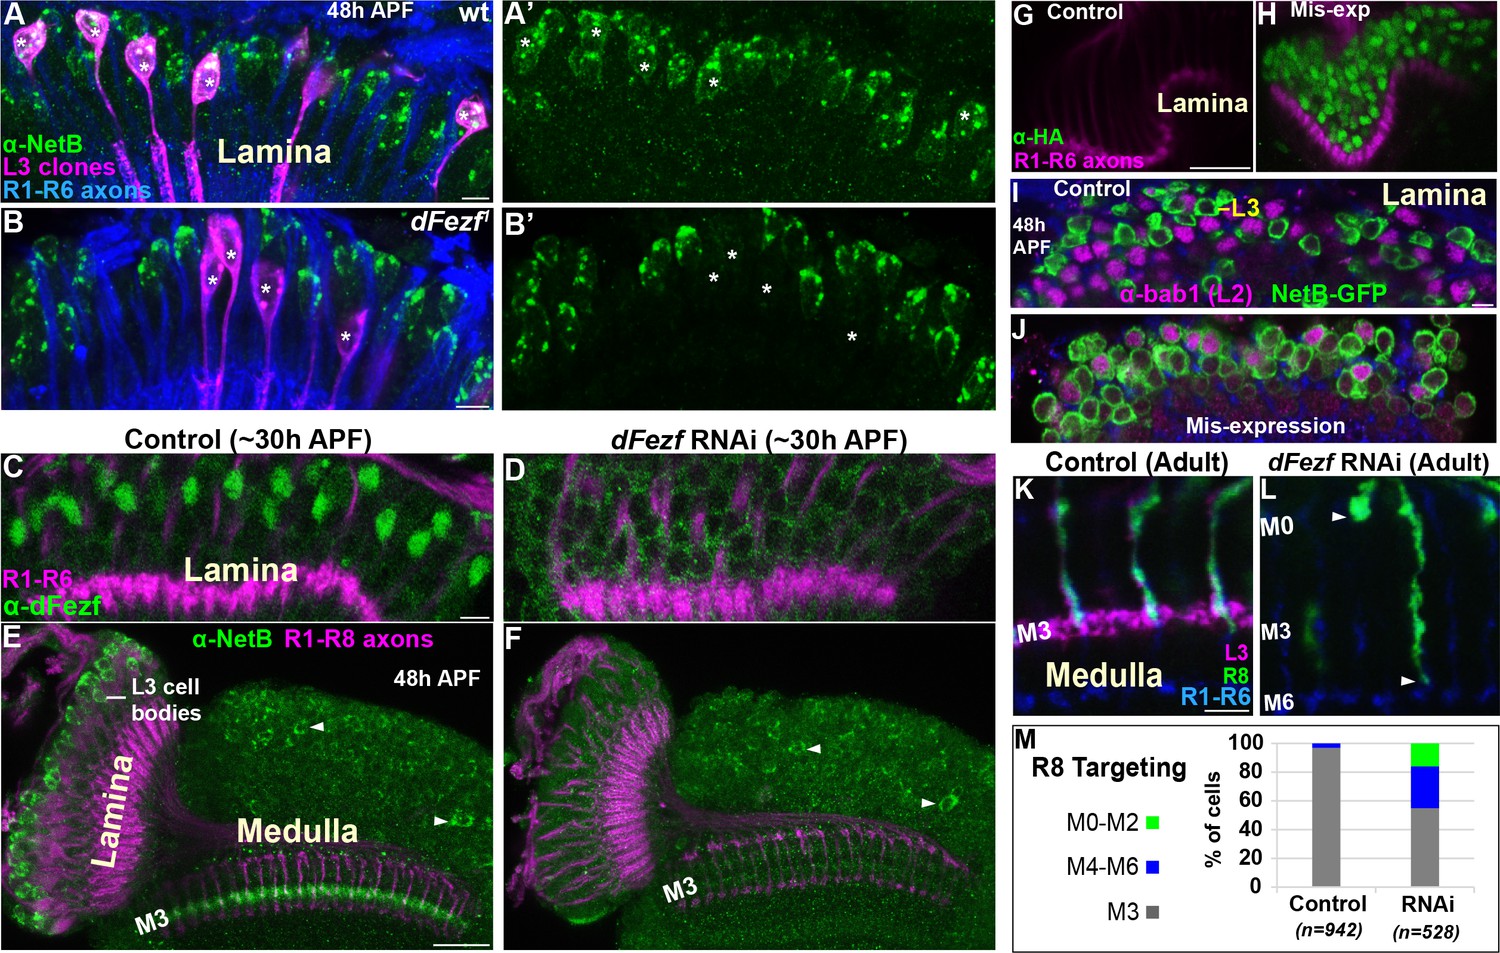
DFezf non-autonomously regulates R8 layer specificity through activation of Netrin expression in L3 neurons.
(A–B’) NetB expression (green, α-NetB) in the somas of wild type or dFezf1 L3 neurons was assessed at 48 hr APF in the lamina in MARCM experiments using confocal microscopy. L3 clones (magenta) expressed myr::GFP (9–9 GAL4) and were visualized using a GFP antibody. (A–A’) Asterisks indicate the positions of wild type L3 clones (magenta). The images are representative of NetB expression (green) assessed in five brains. (A) R1-R6 axons (blue, mAB24B10) were used as a reference for the lamina. Scale bar = 5 microns. (B–B’) Asterisks indicate the positions of dFezf1 L3 clones (magenta). The images are representative of NetB expression (green) assessed in six brains. (B) R1-R6 axons (blue, mAB24B10) were used as a reference for the lamina. Scale bar = 5 microns. (C and D) DFezf RNAi was expressed in lamina neurons and their precursor cells using 9B08-GAL4. DFezf expression (green) in L3 neurons was assessed through immunostaining (α-dFezf). R1-R6 axons (magenta, mAB24B10) provided a reference for the lamina. (C) Representative confocal image of dFezf expression in control flies, which include flies containing dFezf RNAi only or 9B08-GAL4 (seven brains total). Scale bar = 5 microns. (D) Shows a representative confocal image of dFezf expression in knockdown flies (eight brains examined). (E and F) NetB (green, α-Net-B) expression in the lamina and within the M3 layer was assessed in control brains and when dFezf RNAi was expressed in lamina neurons and their precursors using 9B08-GAL4. R1-R8 axons (magenta, mAB24B10) provided a reference for the lamina and outer medulla. Arrowheads indicate NetB expression in medulla neurons. (E) Shows a representative confocal image of NetB expression (green) in control flies, which contain dFezf RNAi only or 9B08-GAL4 (four brains total). Net-B was prominently observed in L3 cell bodies in the lamina, within the M3 layer in the medulla and in medulla neuron cell bodies (arrowheads) on a consistent basis. Scale bar = 20 microns. (F) A representative confocal image from flies containing dFezf RNAi +9B08 GAL4 (six brains). NetB (green) was consistently reduced in L3 cell bodies in the lamina and the M3 layer, but not in medulla neuron cell bodies (arrowheads). (G–J) DFezf-HA was expressed broadly in lamina neurons by 11–164 GAL4. (G and H) Confocal images of dFezf-HA expression (green, α-HA) in lamina neurons (~24 hr APF). The lamina was identified by visualizing R1-R6 axons (magenta, mAB24B10). (G) Representative confocal image from flies containing DFezf-HA or 11–164 GAL4 only (at least five brains). No HA labeling was detected in the lamina of these flies. (H) Shows a representative confocal image from flies containing DFezf-HA +11–164 GAL4 (at least five brains). Prominent HA staining (green) was always observed in the lamina of these flies at 24 hr APF. (I and J) Confocal images of NetB expression (green) (NetB-GFP, α-GFP) in the lamina at 48 hr APF. L2 neurons (magenta) were labeled using α-bab1, and R1-R6 axons (blue, mAB24B10) provided a reference for the lamina. (I) Representative confocal image from flies containing DFezf-HA or 11–164 GAL4 (four brains). No L2 neurons (magenta) expressed Net-B (green) (n = 308). NetB-expressing cells in the image are L3 neurons. Scale bar = 5 microns. (J) Representative confocal image from flies containing DFezf-HA +11–164 GAL4 (four brains). 99% of L2 neurons (magenta) expressed NetB (green) (n = 310). (K–M) DFezf RNAi was expressed in lamina neurons and their precursors using 9B08-GAL4 and R8 axon targeting was assessed within the outer medulla. (K and L) Confocal images showing R8 axon targeting within the outer medulla in adult flies. R8 axons (green) were visualized using an R8-specific marker (Rh6-GFP, α-GFP). L3 axons (magenta) are labeled by 22E09-LexA, LexAop-myr::tdTomato. DFezf knockdown inhibits 22E09-LexA activity, and serves as a positive control for the efficacy of dFezf RNAi. R7 and R8 axons (blue, mAB24B10) provide a reference for outer medulla layers. (K) A representative image from flies containing DFezf RNAi or 9B08-GAL4 only (six brains total). Scale bar = 5 microns. (L) A representative image from flies containing DFezf RNAi +9B08 GAL4 (four brains). Arrowheads indicate the depths at which R8 axons terminate. (M) Quantification of R8 axon targeting. N = the number of R8 axons counted.
-
Figure 7—source data 1
Input data for bar graph Figure 7M.
- https://doi.org/10.7554/eLife.33962.019
Figure 8
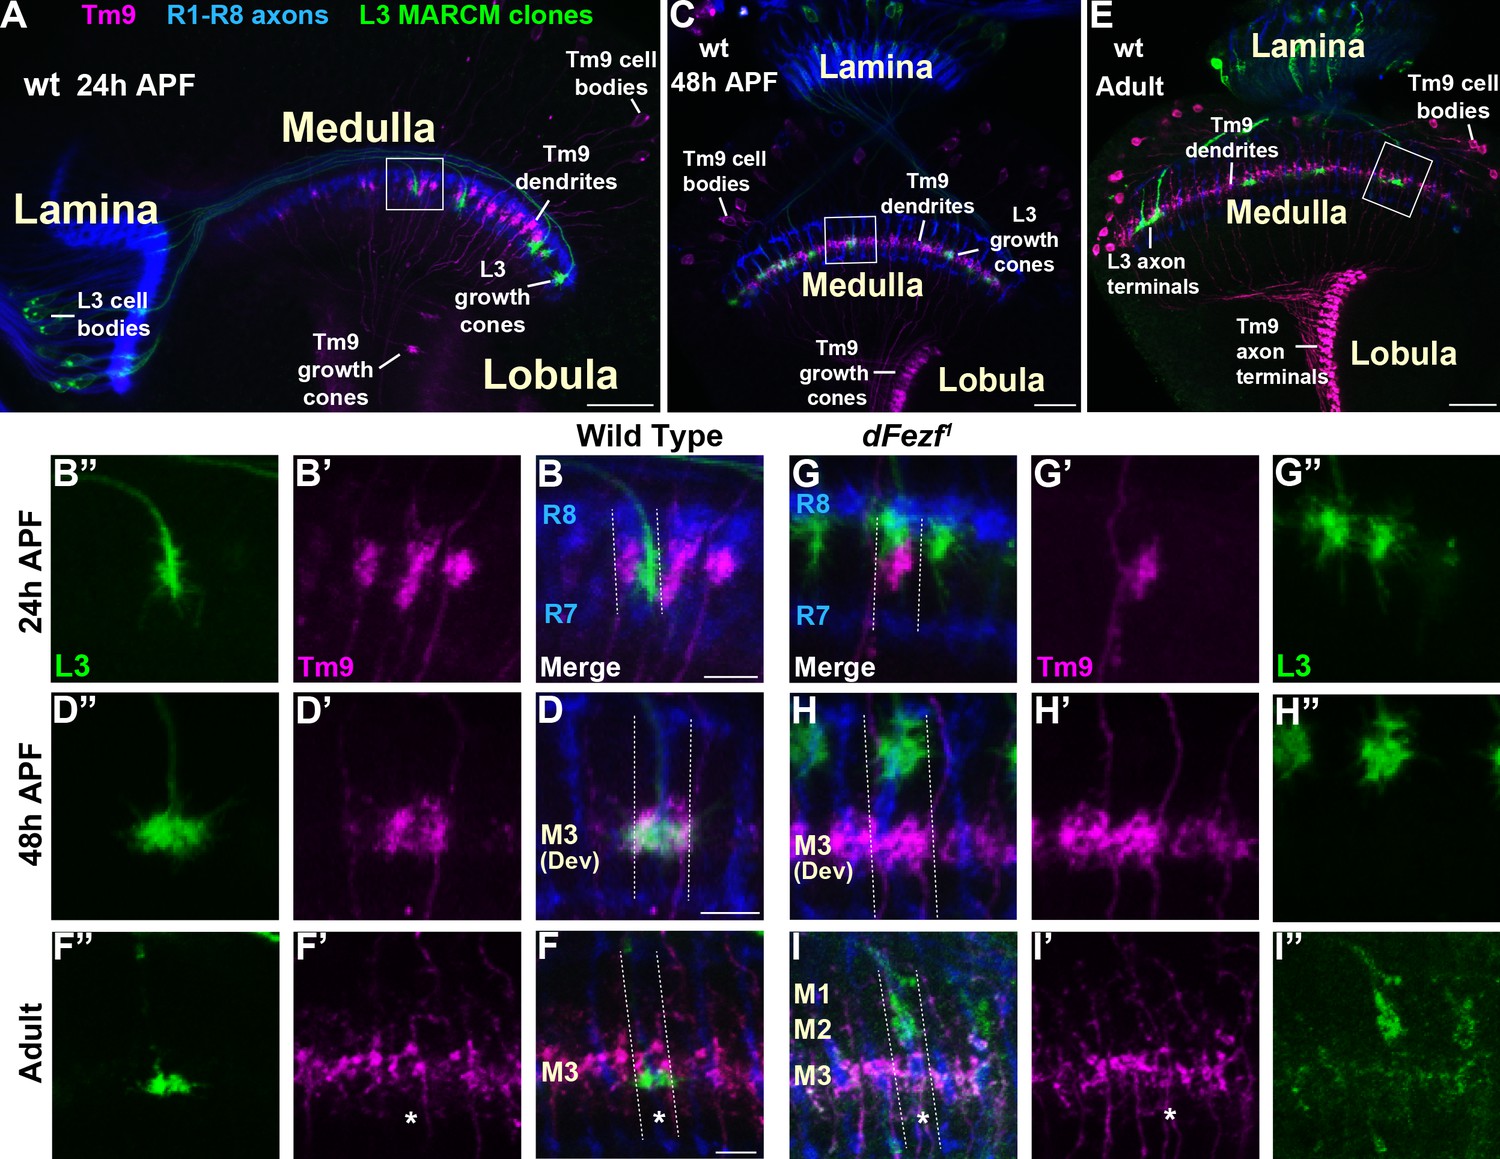
Disrupting dFezf in L3 neurons does not affect the layer innervation of Tm9 neurons.
(A–I”) Confocal images from MARCM experiments analyzed at 24 hr APF, 48 hr APF or in newly eclosed adults. The images shown are representative of neurons assessed from at least five brains per genotype per time-point. L3 clones (green) expressed myr::GFP (9–9 GAL4) and were visualized using a GFP antibody, wild type Tm9 neurons (magenta) expressed myr::tdTomato (24C08-LexA) and were visualized with a DsRed antibody. R1-R8 axons (blue, mAB24B10) define the lamina and outer medulla. (A, C, E) Broad views showing the entire lamina and medulla and the morphologies of wild type L3 (green) and Tm9 neurons (magenta). The solid boxed regions show examples of the regions of the outer medulla shown in B-B’, D-D’, F-F’, G-G’, H-H’, and I-I’. (B, D, F, G, H, I) Dashed lines indicate the estimated boundaries of a medulla column using R7 and R8 axons (blue) as a reference. (F and F’’, I and I’) Asterisks mark the positions of medulla columns containing L3 clones.
Figure 9
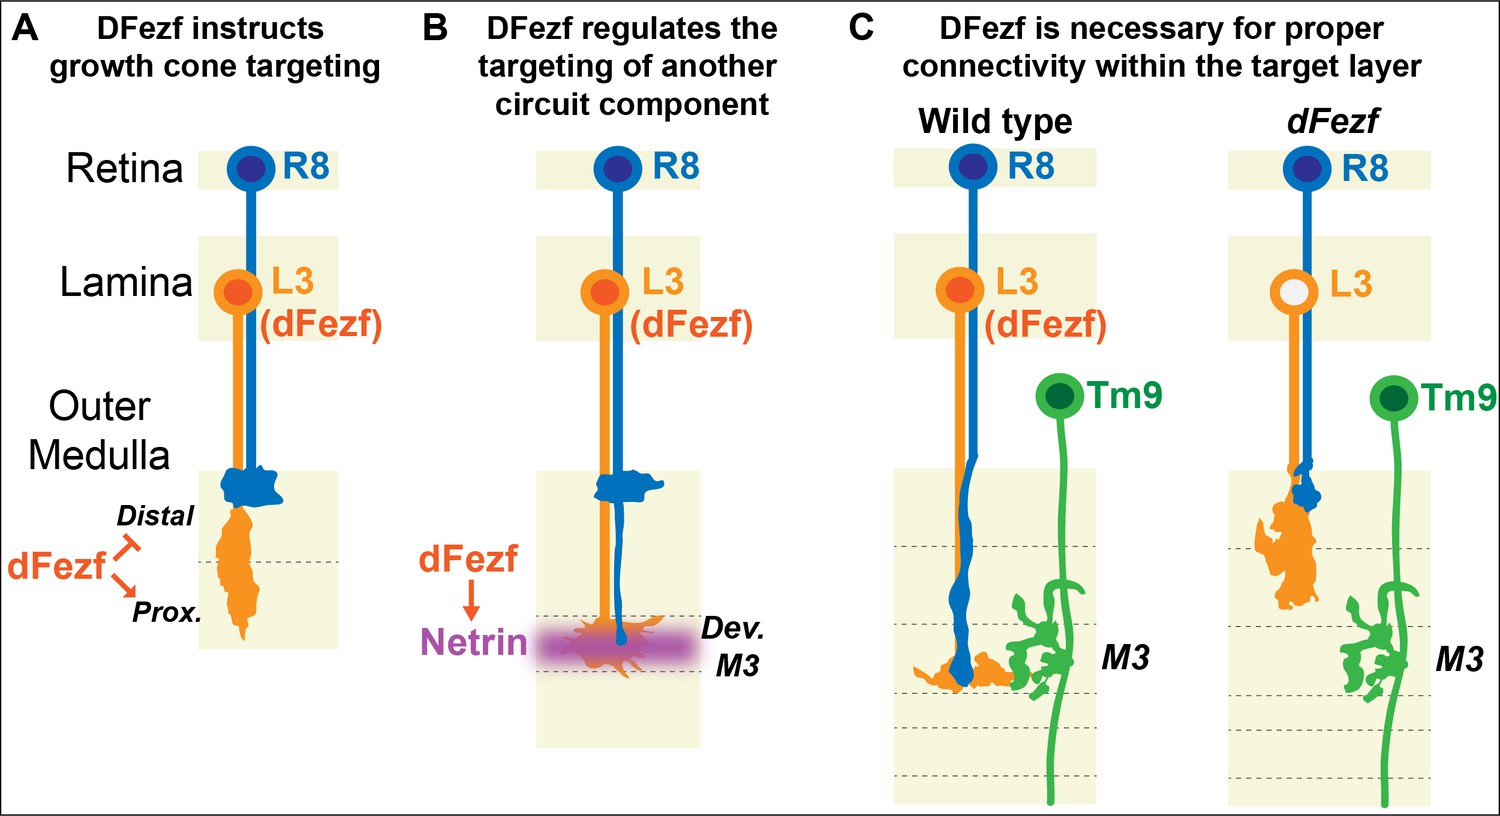
DFezf coordinates the formation of laminar-specific connections.
(A) Early in medulla development, dFezf promotes the targeting of L3 growth cones to the proximal versus distal domain of the outer medulla. DFezf may regulate this step by controlling a program of dpr gene expression. (B) L3 growth cones segregate into the developing M3 layer and secrete Netrin, which regulates the attachment of R8 growth cones within the layer. DFezf also regulates this step by activating the expression of Netrin in L3 neurons. (C) Within the M3 layer, L3 and R8 axons synapse onto Tm9 dendrites. When dFezf function is lost in L3 neurons, L3 and R8 axons innervate inappropriate layers while Tm9 dendrites innervate the M3 layer normally. As a result, connectivity with Tm9 neurons is disrupted.
Tables
Key resources table
| Reagent type (species) | Designation | Source or reference | Identifiers | Add. info. |
|---|---|---|---|---|
| Strain (Drosophila melanogaster) | 9–9 GAL4 | Gift from U. Heberlein (Nern et al., 2008) | N/A | |
| Strain (D. melanogaster) | P{10XUAS-IVS-myr::GFP}attP2 | Bloomington Drosophila Stock Center | RRID:BDSC_32197 | |
| Strain (D. melanogaster) | P{tubP-GAL80}LL10 P{neoFRT}40A | Bloomington Drosophila Stock Center | RRID:BDSC_5192 | |
| Strain (D. melanogaster) | P{R27G05-FLPG5.PEST}attP40 | Bloomington Drosophila Stock Center | RRID:BDSC_55765 | |
| Strain (D. melanogaster) | {LexAop-myr::tdTomato} su(Hw)attP5 | S.L. Zipursky (Chen et al., 2014) | N/A | |
| Strain (D. melanogaster) | P{20XUAS-RSR.PEST}attP2 | Bloomington Drosophila Stock Center | RRID:BDSC_55795 | |
| Strain (D. melanogaster) | 79C23S-GS-RSRT-STOP-RSRT-smFP_V5-2A-LexA | this paper | N/A | See details in ‘Construction of transgenic animals’ session in Materials and methods |
| Strain (D. melanogaster) | dFezf2 | C.Y. Lee (Weng et al., 2010) | N/A | |
| Strain (D. melanogaster) | dFezf1 | C.Y. Lee (Weng et al., 2010) | N/A | |
| Strain (D. melanogaster) | CadN1-2 Δ14 | T.R. Clandinin (Prakash et al., 2005) | N/A | |
| Strain (D. melanogaster) | Sema-1aP1 | Bloomington Drosophila Stock Center | RRID:BDSC_11097 | |
| Strain (D. melanogaster) | P{10XUAS-IVS-myr::GFP}su(Hw)attP8 | Bloomington Drosophila Stock Center | RRID:BDSC_32196 | |
| Strain (D. melanogaster) | P{GMR16H03-lexA}attP40 | Bloomington Drosophila Stock Center | RRID:BDSC_52510 | |
| Strain (D. melanogaster) | 11–164 GAL4 | Gift from U. Heberlein (Nern et al., 2008) | N/A | |
| Strain (D. melanogaster) | UAS-dFezf-3xHA | C.Y. Lee (Janssens et al., 2014) | N/A | |
| Strain (D. melanogaster) | 27G05-FLP (X) | Janelia Farm Research Campus | N/A | |
| Strain (D. melanogaster) | P{10XUAS(FRT.stop)GFP.Myr}su(Hw)attP5 | Bloomington Drosophila Stock Center | RRID:BDSC_55810 | |
| Strain (D. melanogaster) | 6–60 GAL4 | Gift from U. Heberlein (Nern et al., 2008) | N/A | |
| Strain (D. melanogaster) | P{UAS-Dcr-2.D}1 | Bloomington Drosophila Stock Center | RRID:BDSC_24648 | |
| Strain (D. melanogaster) | 22E09-LexA | Janelia Farm Research Campus | N/A | |
| Strain (D. melanogaster) | P{GMR24C08-lexA}attP40 | Bloomington Drosophila Stock Center | RRID:BDSC_62012 | |
| Strain (D. melanogaster) | P{GMR9B08-GAL4}attP2 | Bloomington Drosophila Stock Center | RRID:BDSC_41369 | |
| Strain (D. melanogaster) | P{TRiP.JF02342}attP2 | Bloomington Drosophila Stock Center | RRID:BDSC_26778 | |
| Strain (D. melanogaster) | P{20XUAS-RSR.PEST}attP2 | Bloomington Drosophila Stock Center | RRID:BDSC_55795 | |
| Strain (D. melanogaster) | 18B02-dFezf-C1-3xFLAG | this paper | N/A | See details in ‘Construction of transgenic animals’ session in Materials and methods |
| Strain (D. melanogaster) | UAS-H2A-GFP | S.L. Zipursky (Tan et al., 2015) | N/A | |
| Strain (D. melanogaster) | P{Rh6-EGFP.P}2 | Bloomington Drosophila Stock Center | RRID:BDSC_7461 | |
| Strain (D. melanogaster) | NetBCPTI-000168 | Kyoto Stock Center | RRID:DGGR_115011 | |
| Strain (D. melanogaster) | 18B02-dFezf | this paper | N/A | See details in ‘Construction of transgenic animals’ session in Materials and methods |
| Strain (D. melanogaster) | Mi{PT-GFSTF.1}dpr17[MI08707-GFSTF.1] | Bloomington Drosophila Stock Center | RRID:BDSC_61801 | |
| Strain (D. melanogaster) | Mi{PT-GFSTF.1}nrm[MI01630-GFSTF.1] | Bloomington Drosophila Stock Center | RRID:BDSC_60505 | |
| Strain (D. melanogaster) | Mi{PT-GFSTF.0}beat-IIb[MI03102-GFSTF.0] | Bloomington Drosophila Stock Center | RRID:BDSC_59406 | |
| Strain (D. melanogaster) | Mi{PT-GFSTF.1}CG34113[MI01139-GFSTF.1] | Bloomington Drosophila Stock Center | RRID:BDSC_60162 | |
| Strain (D. melanogaster) | PBac{GMR39D12-lexA}VK00027 | Bloomington Drosophila Stock Center | RRID_BDSC_52681 | |
| Antibody | anti-GFP (chicken) | Abcam | Cat# ab13970; RRID:AB_300798 | 1:1000 |
| Antibody | anti-HA (mouse) | Abcam | Cat# ab1424; RRID:AB_301017 | 1:1000 |
| Antibody | anti-V5 (mouse) | Bio-Rad/AbD Serotec | Cat# MCA2892GA; RRID:AB_1658039 | 1:200 |
| Antibody | anti-HA (rabbit) | Cell Signaling Technologies | Cat# 3724S; RRID:AB_1549585 | 1:1000 |
| Antibody | anti-DsRed (rabbit) | Clontech Laboratories, Inc. | Cat# 632496; RRID:AB_10013483 | 1:200 |
| Antibody | anti-chaoptin (mouse) | Developmental Studies Hybridoma Bank | Cat# 24B10; RRID:AB_528161 | 1:20 |
| Antibody | anti-elav (rat) | Developmental Studies Hybridoma Bank | Cat# 7E8A10; RRID:AB_528218 | 1:200 |
| Antibody | anti-CadN (rat) | Developmental Studies Hybridoma Bank | Cat# DN-Ex 8; RRID:AB_528121 | 1:20 |
| Antibody | anti-FLAG (mouse) | Sigma-Aldrich | Cat# F1804; RRID:AB_262044 | 1:1000 |
| Antibody | Goat anti-chicken IgG (H + L) Alexa Fluor 488 | Thermo Fisher Scientific | Cat# A-11039; RRID:AB_142924 | 1:500 |
| Antibody | Goat anti-rabbit IgG (H + L) Alexa Fluor 568 | Thermo Fisher Scientific | Cat# A-11011; RRID:AB_143157 | 1:500 |
| Antibody | Goat anti-mouse IgG (H + L) Alexa Fluor 647 | Thermo Fisher Scientific | Cat# A-21236; RRID:AB_141725 | 1:500 |
| Antibody | Goat anti-mouse IgG1 Alexa Fluor 568 | Thermo Fisher Scientific | Cat# A-21124; RRID:AB_2535766 | 1:500 |
| Antibody | Goat anti-guinea pig IgG (H + L) Alexa Fluor 568 | Thermo Fisher Scientific | Cat# A-11075; RRID:AB_2534119 | 1:500 |
| Antibody | Goat anti-Rat IgG (H + L) Alexa Fluor 647 | Thermo Fisher Scientific | Cat# A-21247; RRID:AB_141778 | 1:500 |
| Antibody | anti-dFezf (rabbit) | C. Y. Lee (Janssens et al., 2014) | RRID:AB_2568138 | 1:50 |
| Antibody | anti-svp (mouse) | Developmental Studies Hybridoma Bank | RRID:AB_2618079 | 1:10 |
| Antibody | anti-bsh (guinea pig) | S.L. Zipursky (Hasegawa et al., 2011) | RRID:AB_2567934 | 1:200 |
| Antibody | anti-pdm3 (guinea pig) | J.R. Carlson (Tichy et al., 2008) | RRID:AB_2569865 | 1:500 |
| Antibody | anti-bab1 (rabbit) | S.B. Carroll (Williams et al., 2008) | RRID:AB_2570113 | 1:200 |
| Antibody | anti-NetB (guinea pig) | B. Altenhein | N/A | 1:50 |
| Commercial assay or kit | Illumina Nextera XT DNA Library Preparation Kit | Illumina | Cat# FC-131–1024 | |
| Commercial assay or kit | Illumina Nextera XT Index Kit | Illumina | Cat# FC-131–1001 |
Additional files
-
Supplementary file 1
Table containing normalized transcript values for all genes across all samples (regardless of significance)
- https://doi.org/10.7554/eLife.33962.022
-
Supplementary file 2
QC and DE gene analyses.
- https://doi.org/10.7554/eLife.33962.023
-
Supplementary file 3
Table of differentially expressed genes containing: bio categories, gene family information, normalized transcript values across all samples, fold change, and p-values.
- https://doi.org/10.7554/eLife.33962.024
-
Transparent reporting form
- https://doi.org/10.7554/eLife.33962.025
Download links
A two-part list of links to download the article, or parts of the article, in various formats.
Downloads (link to download the article as PDF)
Open citations (links to open the citations from this article in various online reference manager services)
Cite this article (links to download the citations from this article in formats compatible with various reference manager tools)
Drosophila Fezf coordinates laminar-specific connectivity through cell-intrinsic and cell-extrinsic mechanisms
eLife 7:e33962.
https://doi.org/10.7554/eLife.33962


