Regulation of the Drosophila ID protein Extra macrochaetae by proneural dimerization partners
- Albert Einstein College of Medicine, United States
Figures
Figure 1
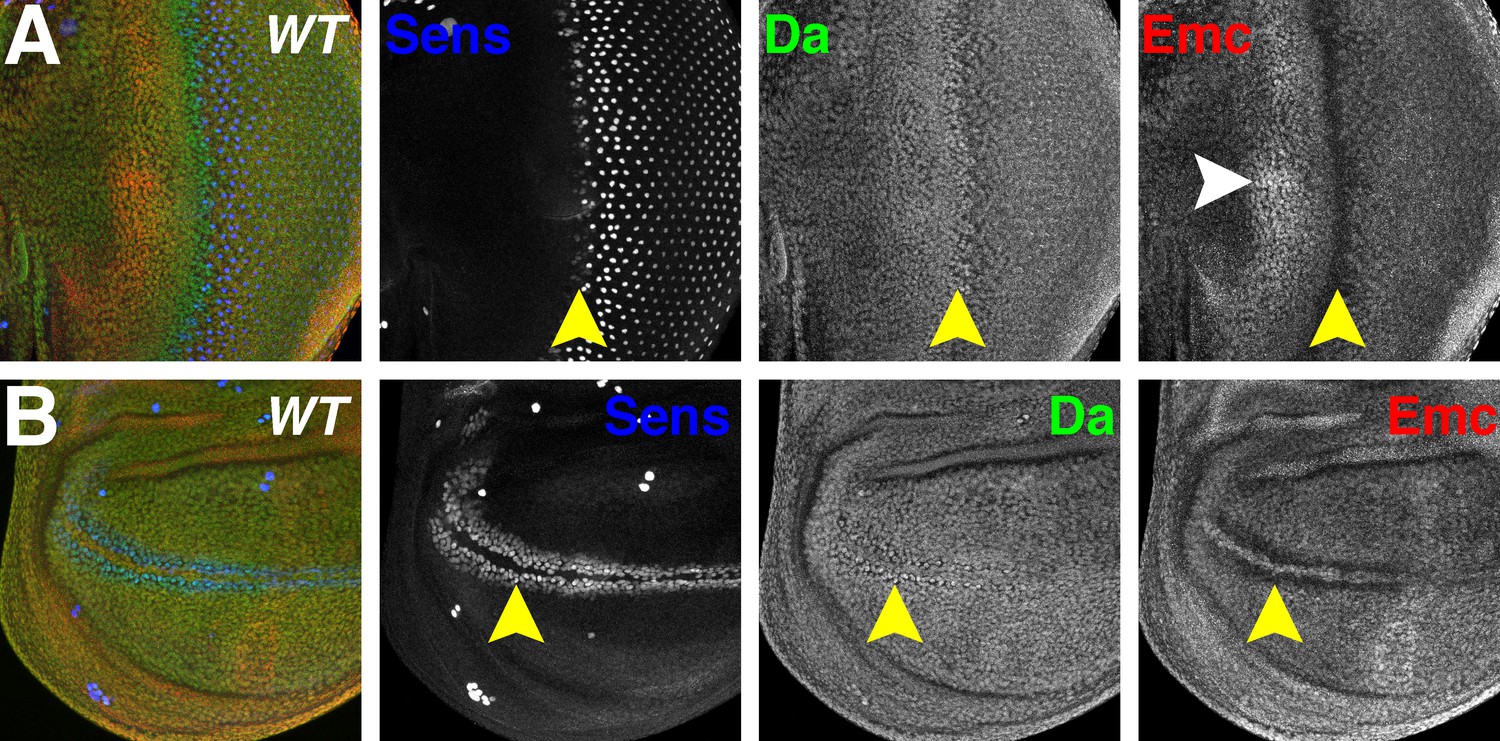
Da and Emc are broadly expressed proteins that are modulated in proneural regions.
Panels show immunofluorescence labeling of Drosophila eye imaginal discs (A) and wing imaginal discs (B). Yellow arrowheads indicate the morphogenetic furrow of the eye disc (A) and future anterior wing margin of the wing disc (B). Neural precursor cells arise in those proneural regions and are labeled by Sens (blue). Da (green) and Emc (red) proteins are broadly detected. Da levels are elevated within proneural regions whereas Emc levels are reduced. At the wing margin Da may be elevated in fewer cells than those where Emc is reduced. In addition, higher Emc protein levels are often higher in the equatorial region of the anterior eye disc (white arrowhead, panel A;see text). Genotype: w1118.
Figure 2 with 1 supplement
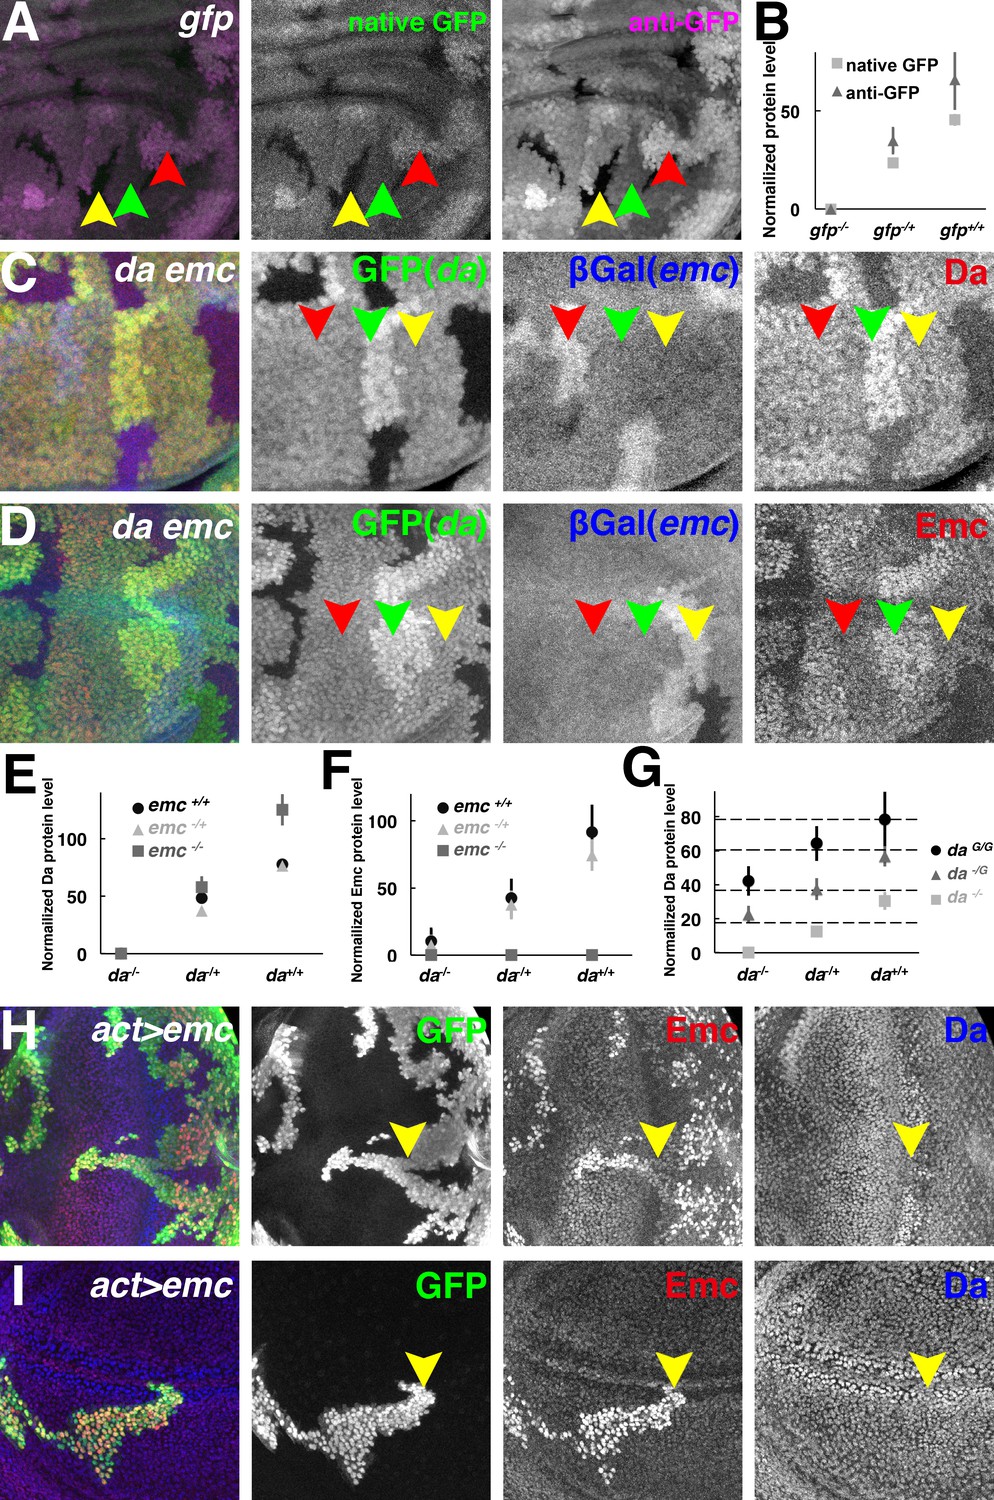
Both Da and Emc protein levels depend on da gene dose.
(A) GFP signals in wing imaginal disc mosaic for the ubi-GFP transgene detected simultaneously by native GFP fluorescence (green) and by anti-GFP antibody (magenta). (B) Quantification of native GFP signal and anti-GFP antibody signal in (A), showing their linearity to the gfp gene dose (N = 4). Panels (C–D) show mosaic imaginal disc tissues obtained after mitotic recombination of heterozygous genotypes (see text). Homozygous da and emc mutant clones are negatively marked by GFP (green) or βGal (blue), respectively, within the same wing disc. Reciprocal twin spots are brightly labeled while unrecombined heterozygous cells show intermediate labeling. (C) Anti-Da labeling (red) in cells with different da and emc gene copies. Note that da-/+ emc+/+ (red arrowheads) and da-/+; emc-/+ (yellow arrowheads) cells have indistinguishable levels of Da protein. Cells with higher da gene dose have more Da protein (green arrowheads). (D) Anti-Emc labeling (red) in cells with different da and emc gene copies. Note that da-/+; emc-/+ (red arrowheads) and da-/+ emc+/+ (yellow arrowheads) have similar Emc protein levels, while da+/+; emc-/+ (green arrowheads) cells express higher levels of Emc than da-/+; emc-/+ (red arrowheads) cells do. (E–F) Quantification of Da (E) and Emc (F) antibodies fluorescence intensities. Mean ± SEM is shown (N = 7). X-axes represent the endogenous da gene dose and different colors represent different emc gene dose (E–F). In panel (E), the Da level in da+/-; emc+/+ cells appears greater than half that in to da+/+; emc+/+ cells but this was not reproduced in other studies (see panel G and Figure 2—figure supplement 1C). The Da level in da+/-; emc+/+ cells was not statistically different from that in da+/-; emc+/- cells. Remarkably, da+/+; emc-/+ cells have higher Emc protein levels than da-/+ emc+/+ cells do (p=0.00068, two-tailed t-test). (G) Quantification of Da antibody labeling from mosaic wing discs where clones vary the copy number of the endogenous da locus from 0–2 and independently vary the copy number of an unlinked genomic rescue transgene from 0 to 2 (see text and Figure 2—figure supplement 1E). X-axis represents the endogenous da gene dose and different colors represent da rescue transgene dose. Dashed horizontal lines represent mean Da levels for 1,2,3 and 4 gene copy genotypes. Note that the genomic transgene consistently expresses more Da protein than the endogenous locus. Mean ± SEM is shown,(N = 10). (H–I) Random flip-on clones overexpressing emc using a UAS-emc line are marked by GFP (green). Emc (red) over-expression abolishes Da (blue) upregulation in the morphogenetic furrow of the eye disc (H, yellow arrowheads) and the presumptive wing margin in the wing disc (I, yellow arrowheads), but has no discernible effect elsewhere. Genotypes: (A) hsFLP; Ubi-GFP FRT40/FRT40, (C–D) hsFLP; da3 FRT40/Ubi-GFP FRT40; emcAP6 FRT80/arm-LacZ FRT80, (H–I) hsFLP; UAS-emc 5.3/+; act > CD2>Gal4, UAS-GFP/+.
Figure 2—figure supplement 1
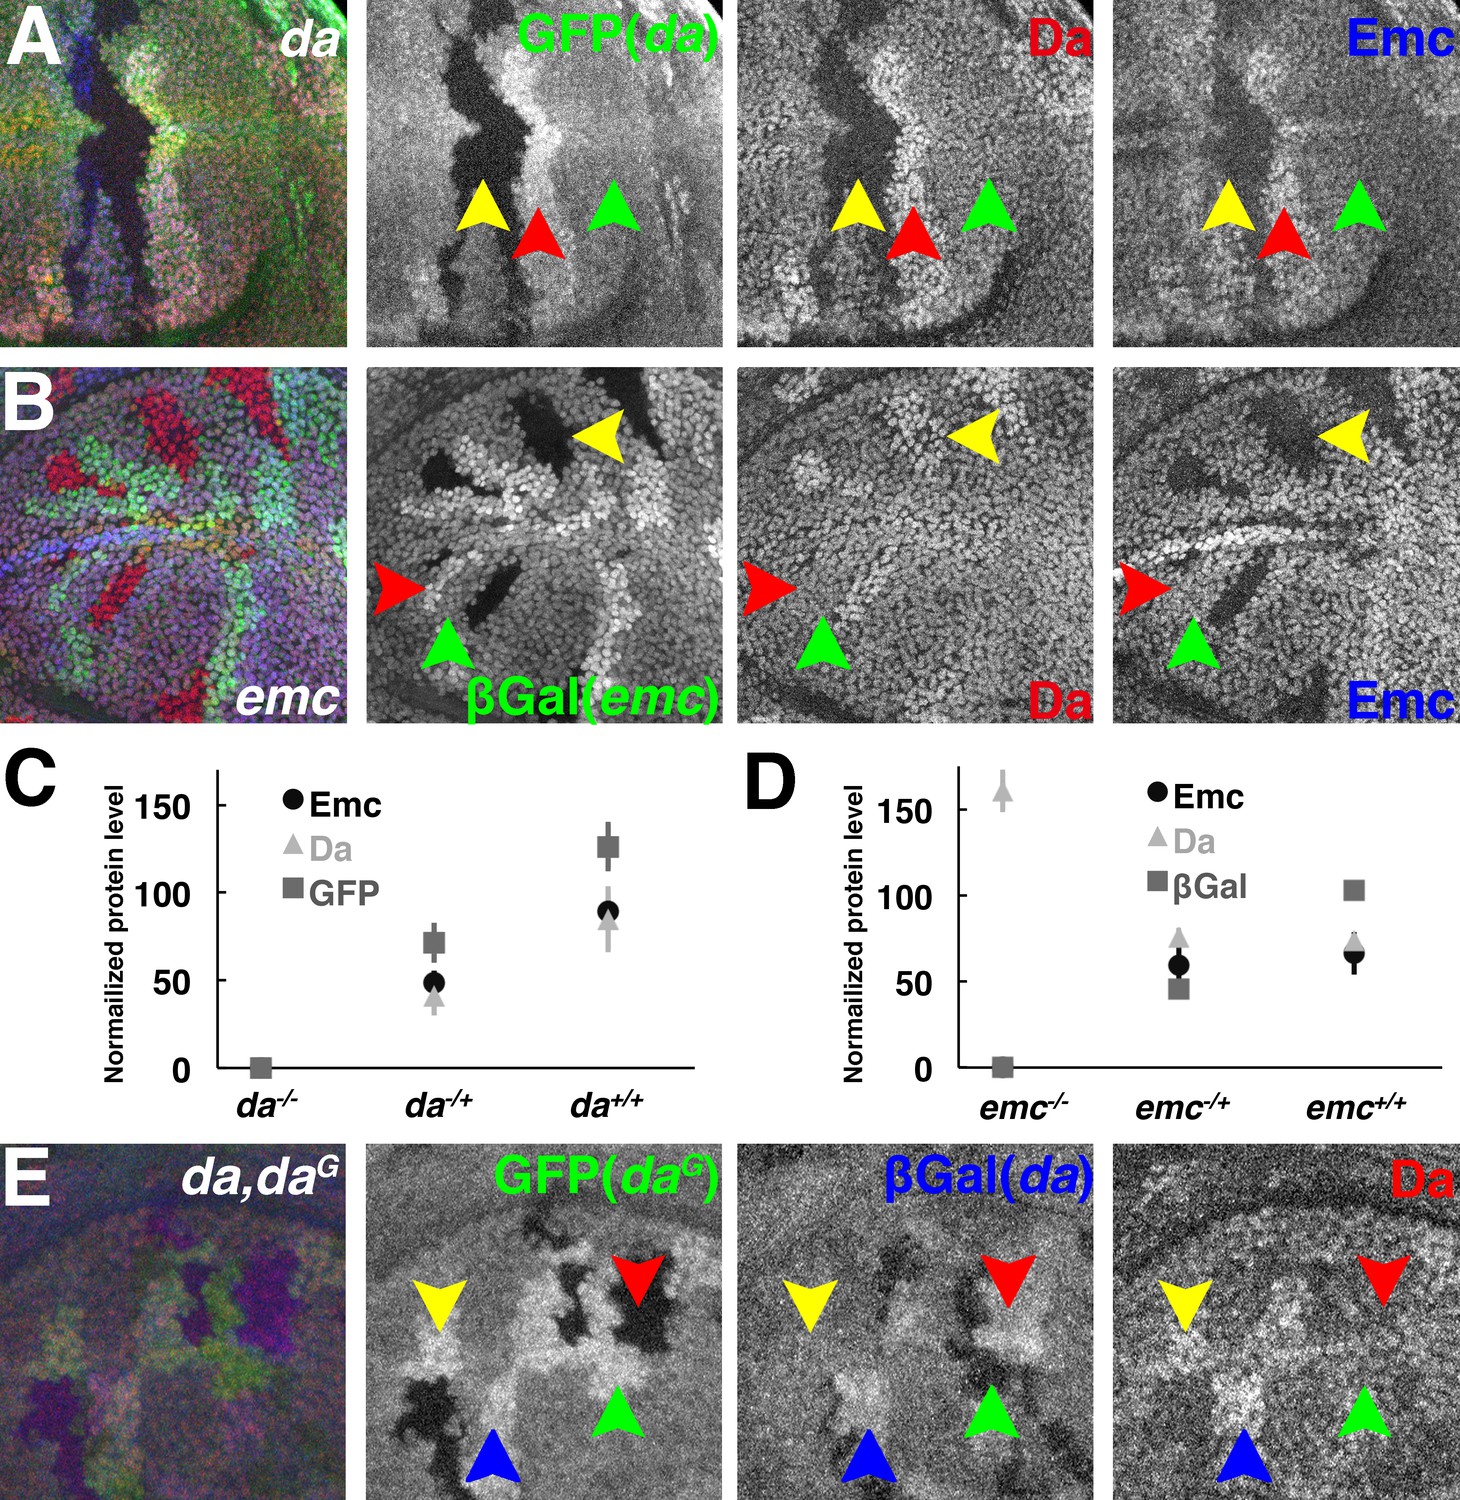
Panels A and B show gene dose mosaic experiments like those of Figure 2 except that the dose of only da (A) or emc (B) is varied.
Homyzygous mutant cells are negatively marked by GFP or βGal (green). (A) Very little Emc (blue) is detected in da-/- cells. da+/+ cells have more Da (red) and Emc (blue) proteins. (B) Da goes up in emc-/- cells, while emc -/+ and emc+/+ cells have similar Da (red) and Emc (blue) protein levels. (C) Mean ± SEM of GFP, Da and Emc protein levels showing their linear response to da (gfp) gene dose (N = 8). (D) Mean ± SEM of LacZ, Da and Emc protein levels. Da and Emc levels are indistinguishable in emc-/+ and emc+/+ (N = 8). (E) Panels showing Da protein in mosaic clones of different da gene dose. The endogenous da locus is negatively marked by βGal (blue) and the da rescue transgene is positively labeled by GFP (green). Da proteins (red) go up as the gene copies of da increase (two: red and green arrowheads; three: yellow arrowheads and four: blue arrowheads).
Figure 3
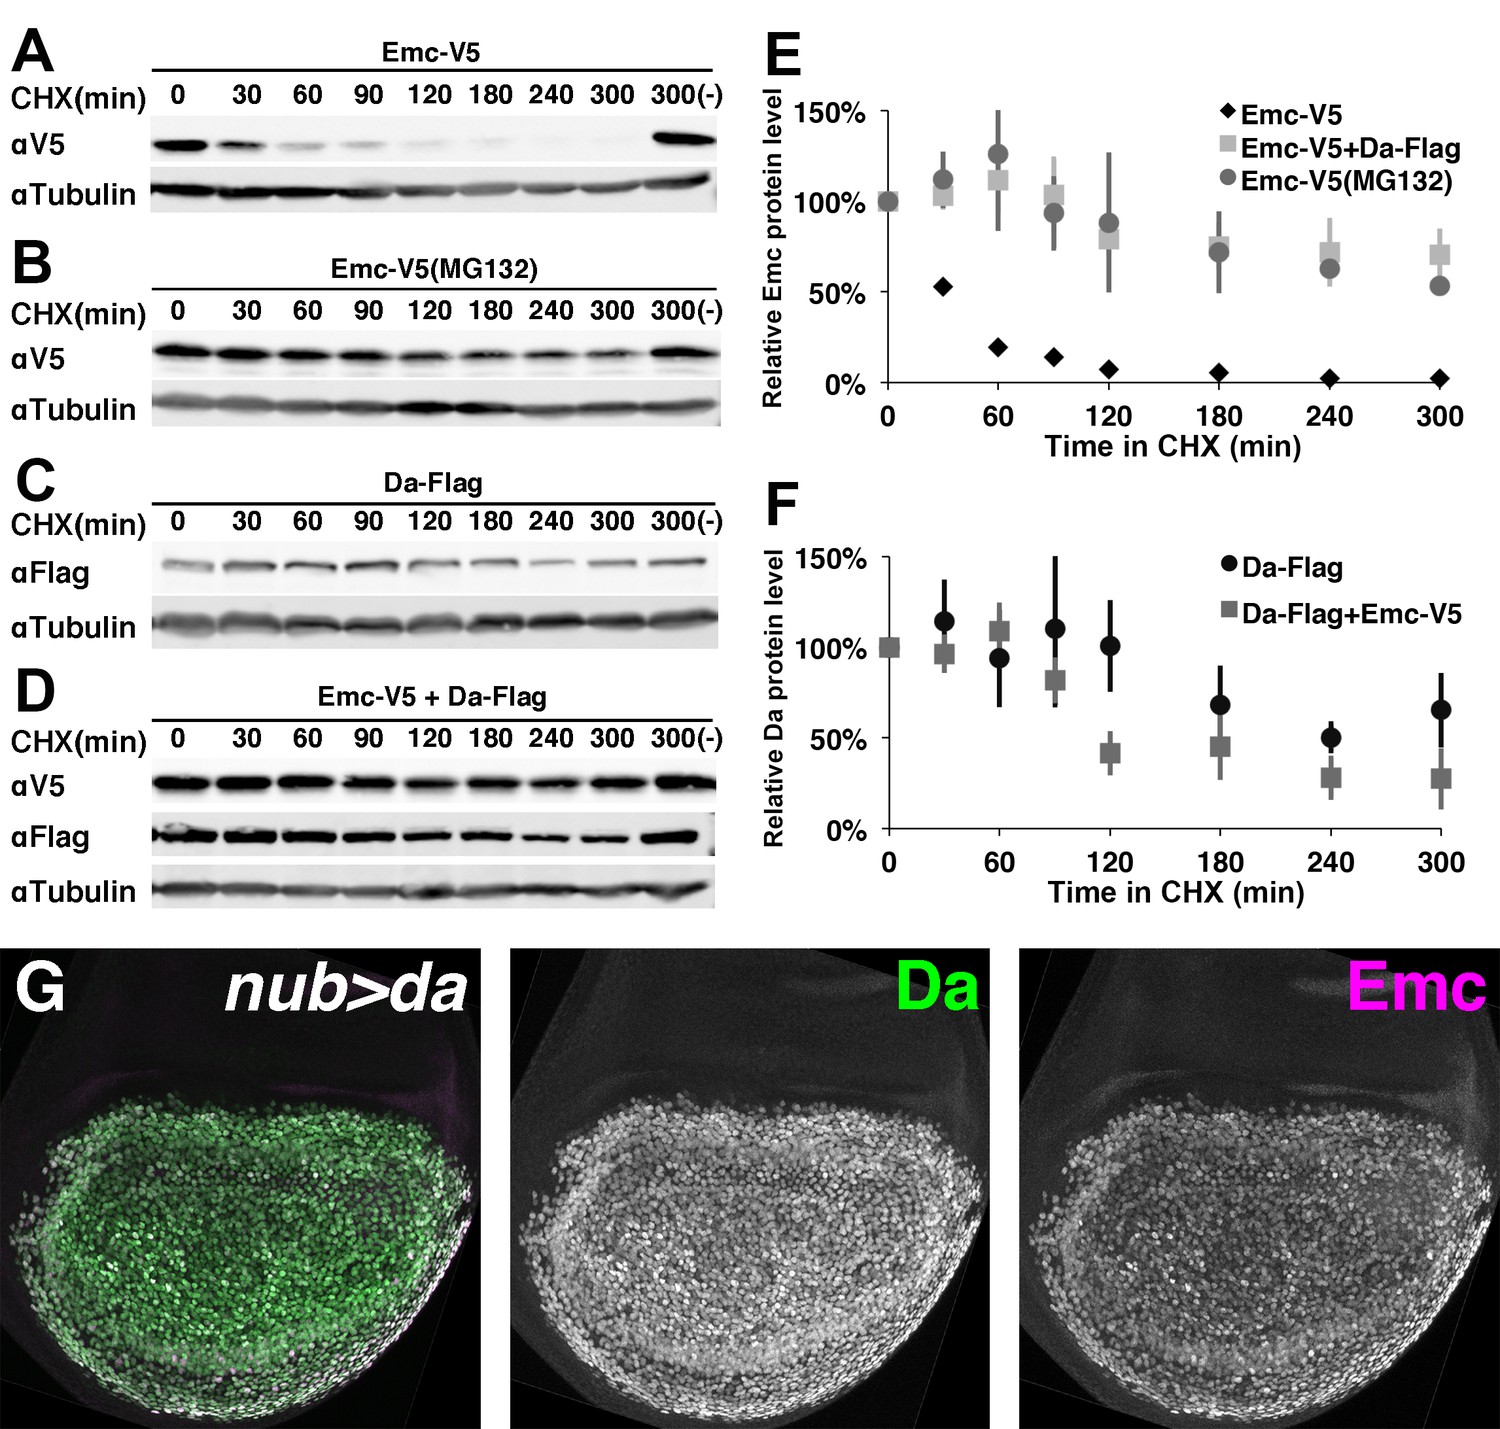
Emc is unstable alone but stabilized in the presence of Da.
In panels (A-F) proteins from S2 cells were analyzed by western blot following a time course after cycloheximide (CHX) addition. (-) indicates absence of CHX treatment. αTubulin is used as a loading control. (A) Western blot of Emc-V5 show Emc had a short life in S2 cells. (B) Cells are pretreated with a proteasomal inhibitor MG132 to block ubiquitin-proteasome mediated degradation before CHX addition. Emc-V5 degradation is significantly slower. (C) Western blot of Da-Flag show Da is a very stable protein in S2 cells. (D) Co-transfection of Da-Flag with Emc-V5 make Emc a stable protein, while the half-life of Da seems shorter in the presence of Emc. (E) Quantification of Emc-V5 half-lives in panels A,B and D. Mean ± SEM is shown and calculated from 3 to 5 biological replicates(ie independent transfections). All experiments performed were included for quantification. (F) Quantification of Da-Flag half-lives in panels C and D. Mean ± SEM is shown and calculated from 3 to 5 biological replicates. All experiments performed were included for quantification. (G) Expression of Da in the developing wing disc using nub-Gal4 drives a high level of Da protein (green: image underexposes the normal Da expression in surrounding cells in order to record the Da over-expression). Emc protein (magenta) is stabilized in a precisely corresponding pattern (normal Emc expression in surrounding cells underexposed). Note that Da over-expression is likely also to increase transcription of the endogenous emc gene(Bhattacharya and Baker, 2011).
Figure 4 with 1 supplement
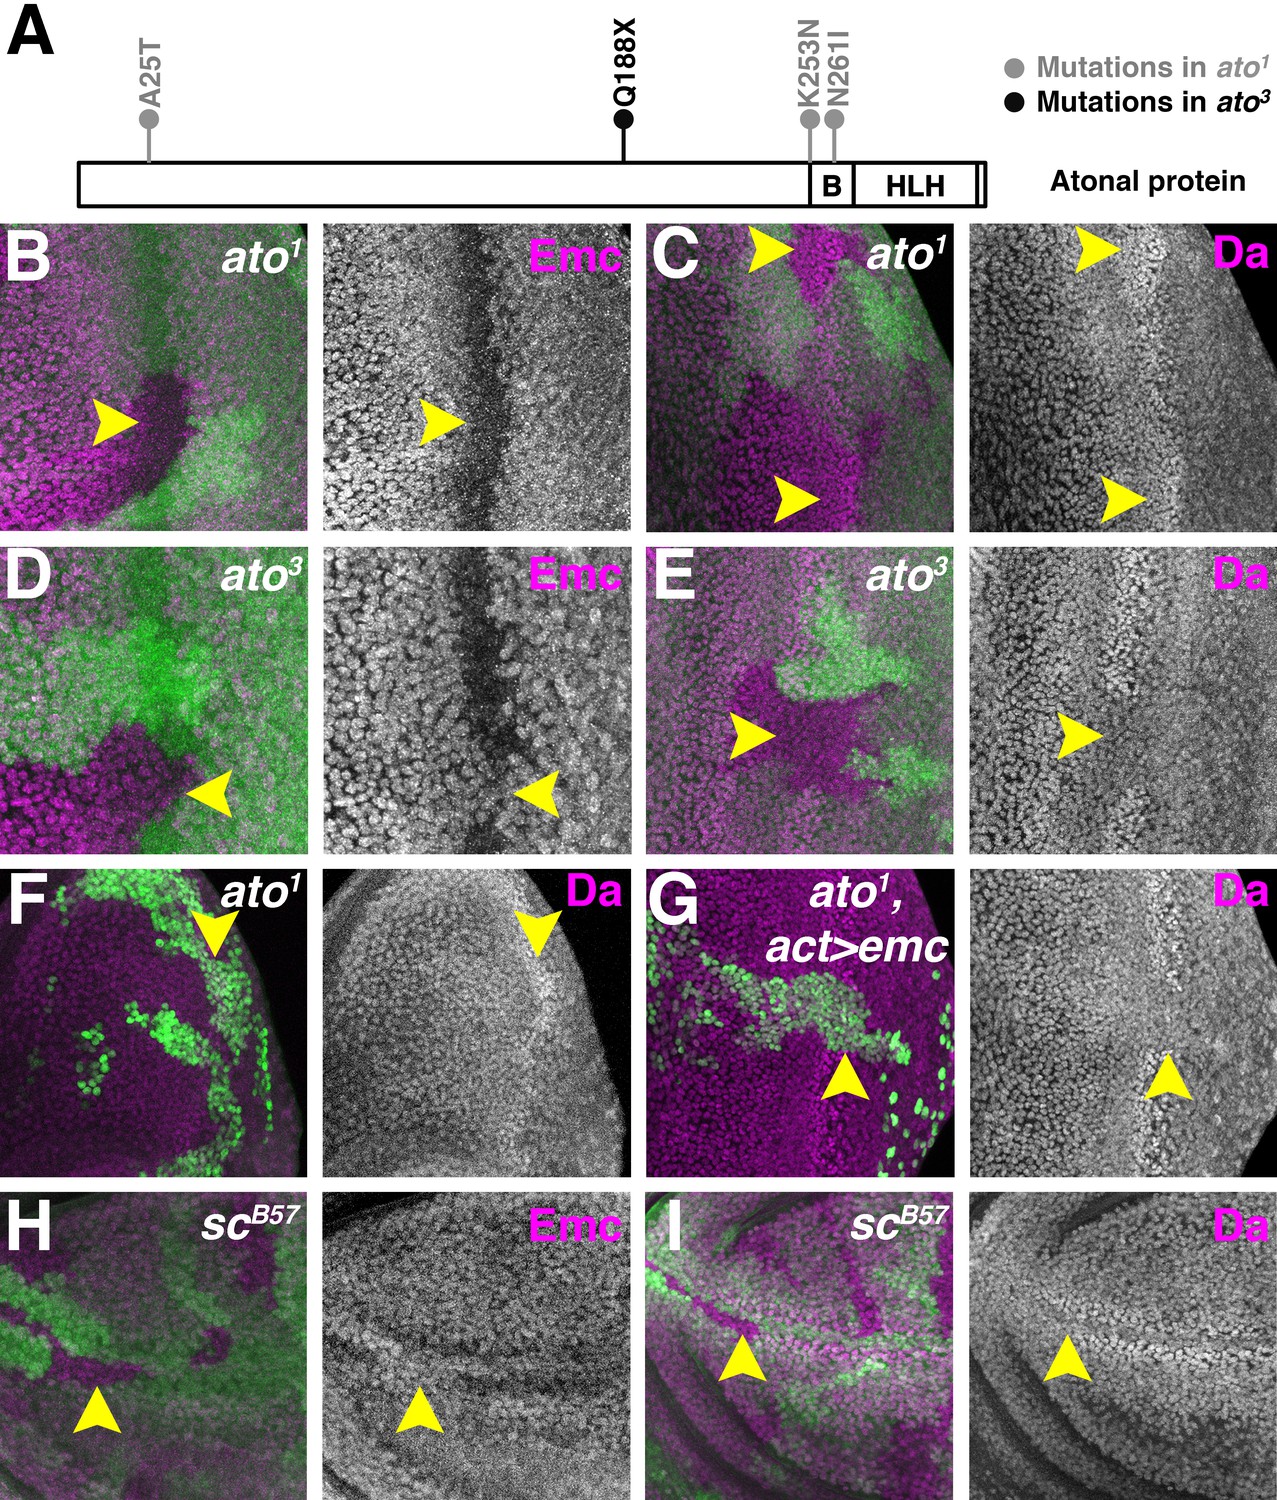
Proneural proteins are necessary for modulating Da and Emc levels.
(A) Cartoon of Ato protein showing sequence changes in ato1 and ato3 mutants. ‘B’ indicating the basic domain and ‘HLH’ indicating the helix-loop-helix domain of wild type Ato. (B–E) Homozygous ato1 (B and C) or ato3 (D and E) mutant clones are marked by the absence of βGal (green). (B) Emc (magenta) goes down in ato1 clones in the furrow (arrow). (C) Da (magenta) goes up in ato1 clones in the furrow (arrow), at levels comparable to (if not higher) than the normal high level of Da in the furrow. (D) Emc (magenta) is retained in ato3 clones in the furrow (arrow), at levels comparable to the normal Emc levels ahead of the furrow. (E) Da (magenta) fail to upregulate in ato3 clones in the furrow (arrow). (F–G) ato1 MARCM clones are positively labeled by GFP. (F) cells homozygous for ato1 mutant (arrow) upregulatd Da (magenta). (G) Overexpression of Emc in ato1 mutant clones prevents Da upregulation (arrow). (H–I) Homozygous scB57 mutant clones are marked by the absence of GFP (green). (H) Emc (magenta) is retained in cells lacking all the four AS-C genes in the wing margin of the wing discs (arrow). (I) Da (magenta) is not elevated in wing margin cells homozygous for the AS-C mutant (arrow). Genotypes: (B–C) hsFLP; FRT82 ato1/FRT82 arm-lacZ; (D–E) hsFLP; FRT82 ato3/FRT82 arm-lacZ; (F) hsFLP, UAS-GFP; tub-Gal4/+; FRT82 tub-Gal80/FRT82 ato1; (G) hsFLP, UAS-GFP; tub-Gal4/UAS-emc 5.3; FRT82 tub-Gal80/FRT82 ato1; (H–I) Df(1)scB57FRT101/Ubi GFP FRT101; hsFLP/+..
Figure 4—figure supplement 1

(A–B) Homozygous ato1 or ato3 mutant clones are marked by the absence of βGal (green). (A) Ato1 protein (magenta) is detected by an anti-Ato antibody in the ato1 clones. Initial expression of Ato appeared to be normal but the refinement of Ato expression was disrupted(Chen and Chien, 1999). (B) No protein is detected by the anti-Ato antibody in ato3 clones. Genotypes: (A) hsFLP; FRT82 ato1/FRT82 arm-lacZ; (B) hsFLP; FRT82 ato3/FRT82 arm-lacZ..
Figure 5
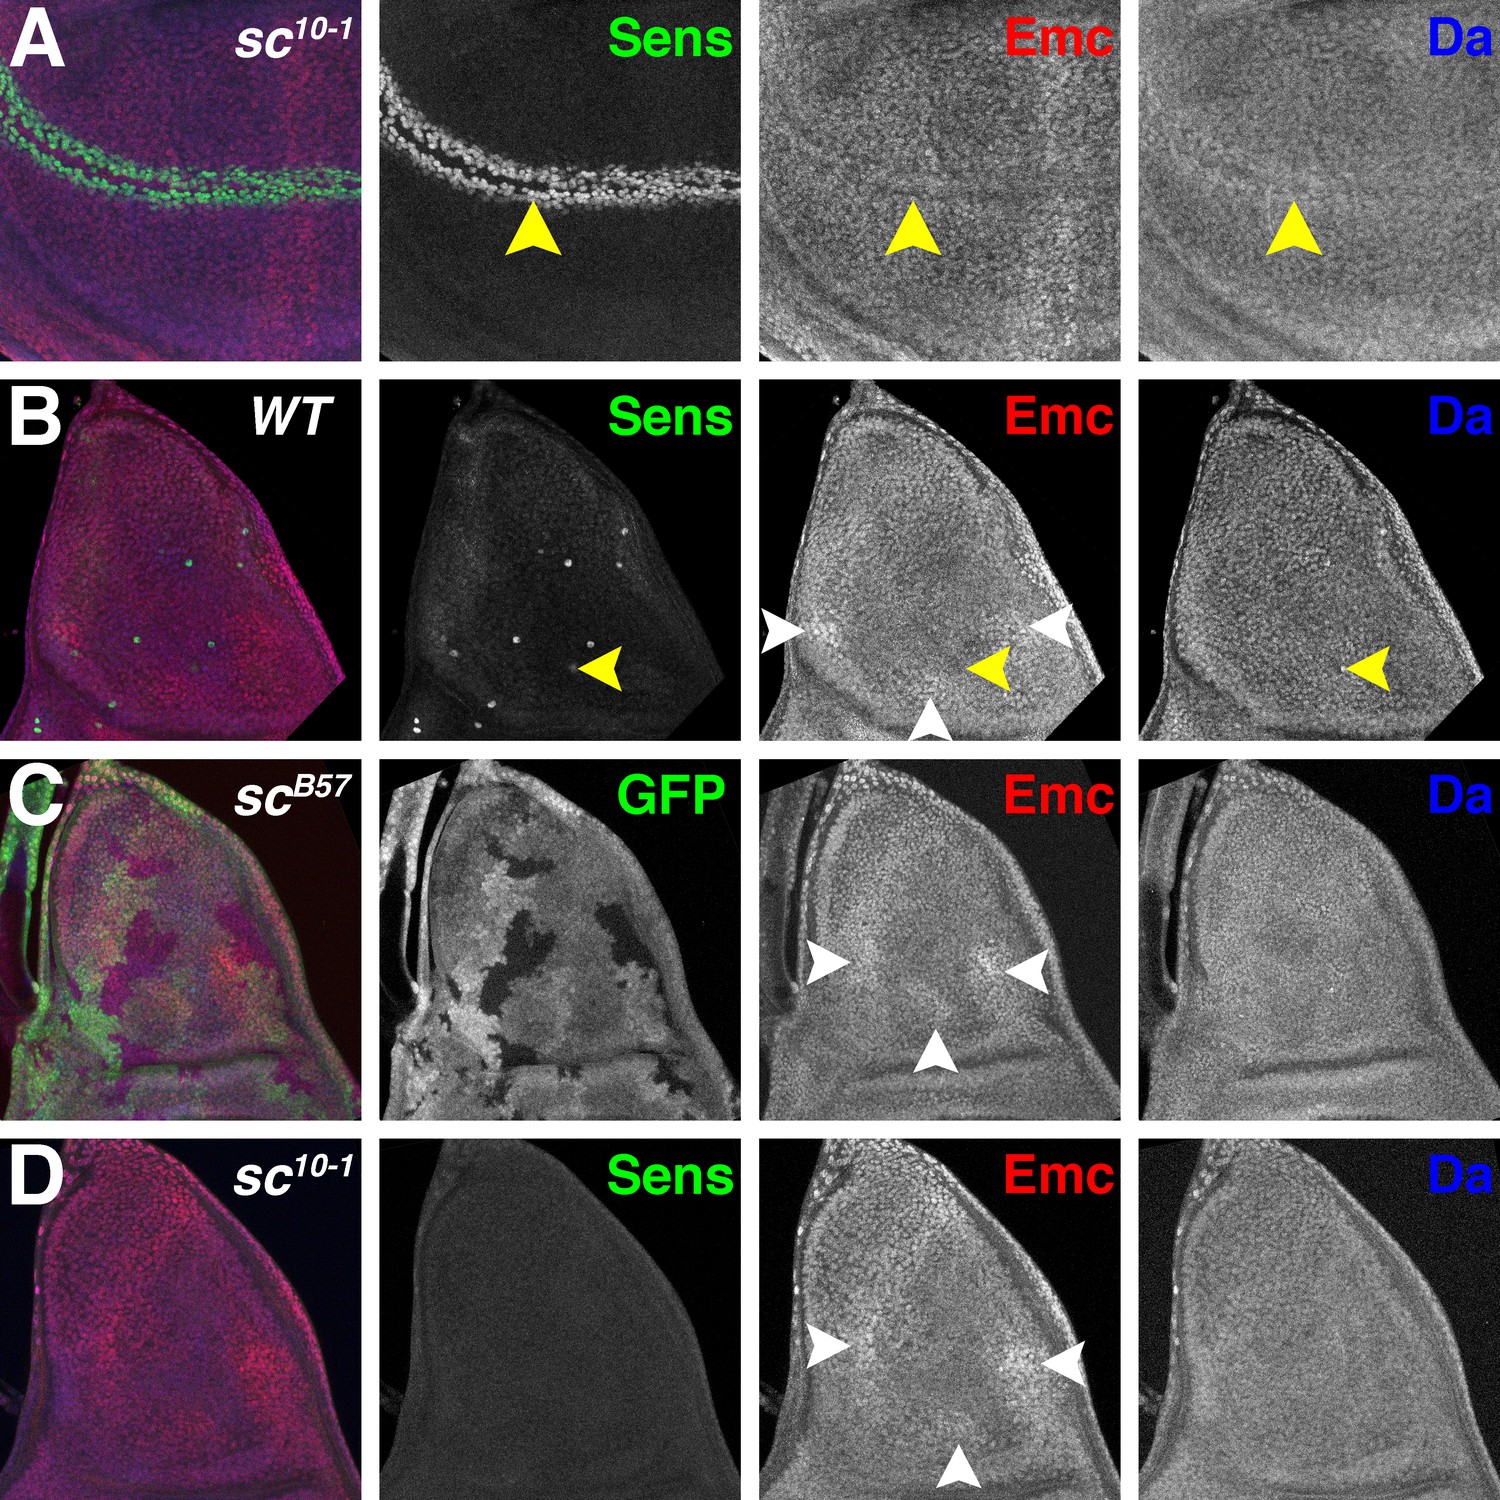
Proneural genes regulate Emc and Da in the notum.
(A) In sc10-1 wing discs, fewer cells are labeled by Sens (green) in the wing margin (yellow arrowheads). Emc (red) and Da (blue) levels are not affected as strongly as in the wild type (compare Figure 1B). (B) In wild type notum, Sens (green) marks single sensory organ precursor (SOP) cells. Emc (red) and Da (blue) proteins are expressed widely, although the SOP cells generally have lower Emc and higher Da (eg yellow arrowheads)(Bhattacharya and Baker, 2011). In addition, Emc protein levels are higher in particular domains (white arrowheads). High-Emc domains lack SOP cells. (C) Homozygous scB57 clones lack GFP. SOP cells with lower Emc(red) and higher Da(blue) were never observed in scB57 clones, although the regions of high Emc were unchanged (white arrowheads). (D) The whole sc10-1 notum lacks Sens positive SOP cells (green). SOP cells with lower Emc(red) and higher Da(blue) were never observed in sc10-1notum, although the regions of high Emc were unchanged (white arrowheads). (A, D) Df(1)sc10-1; (B) w1118; (C) Df(1)scB57FRT101/Ubi GFP FRT101; hsFLP/+.
Figure 6 with 1 supplement
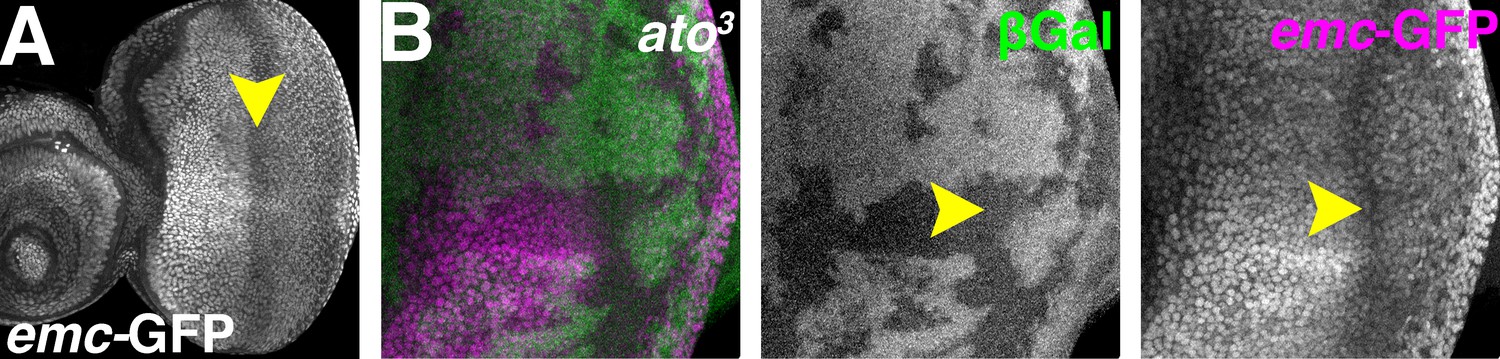
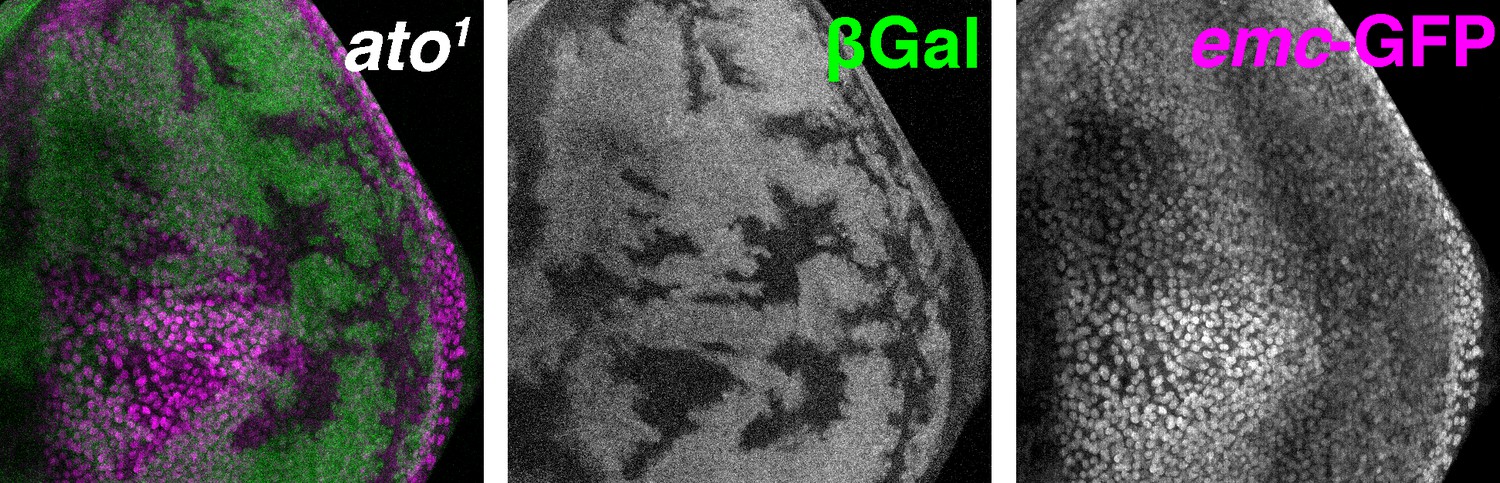
Atonal regulates Emc expression post-transcriptionally.
(A) emc enhancer trap expression in the eye disc in the emc-GFPYB0067 line. Downregulation in the morphogenetic furrow (arrow) is broader and less complete than seen fpr the Emc protein (compare Figure 1A). (B) ato3 mutant clones are marked by the absence of βGal (green). emc enhancer trap (magenta) is lower in the furrow both inside and outside ato3 mutant clones. Genotypes: (A) emc-GFPYB0067; (B) eyFLP; emc-GFPYB0067, FRT82 arm-lacZ/FRT82 ato3.
Figure 6—figure supplement 1
ato1 mutant clones are marked by the absence of βGal (green) and emc enhancer trap is detected by GFP (magenta).
emc enhancer trap shows similar downregulation in the furrow in ato1 clones. Genotype: eyFLP; emc-GFPYB0067, FRT82 arm-lacZ/FRT82 ato1.
Figure 7 with 2 supplements
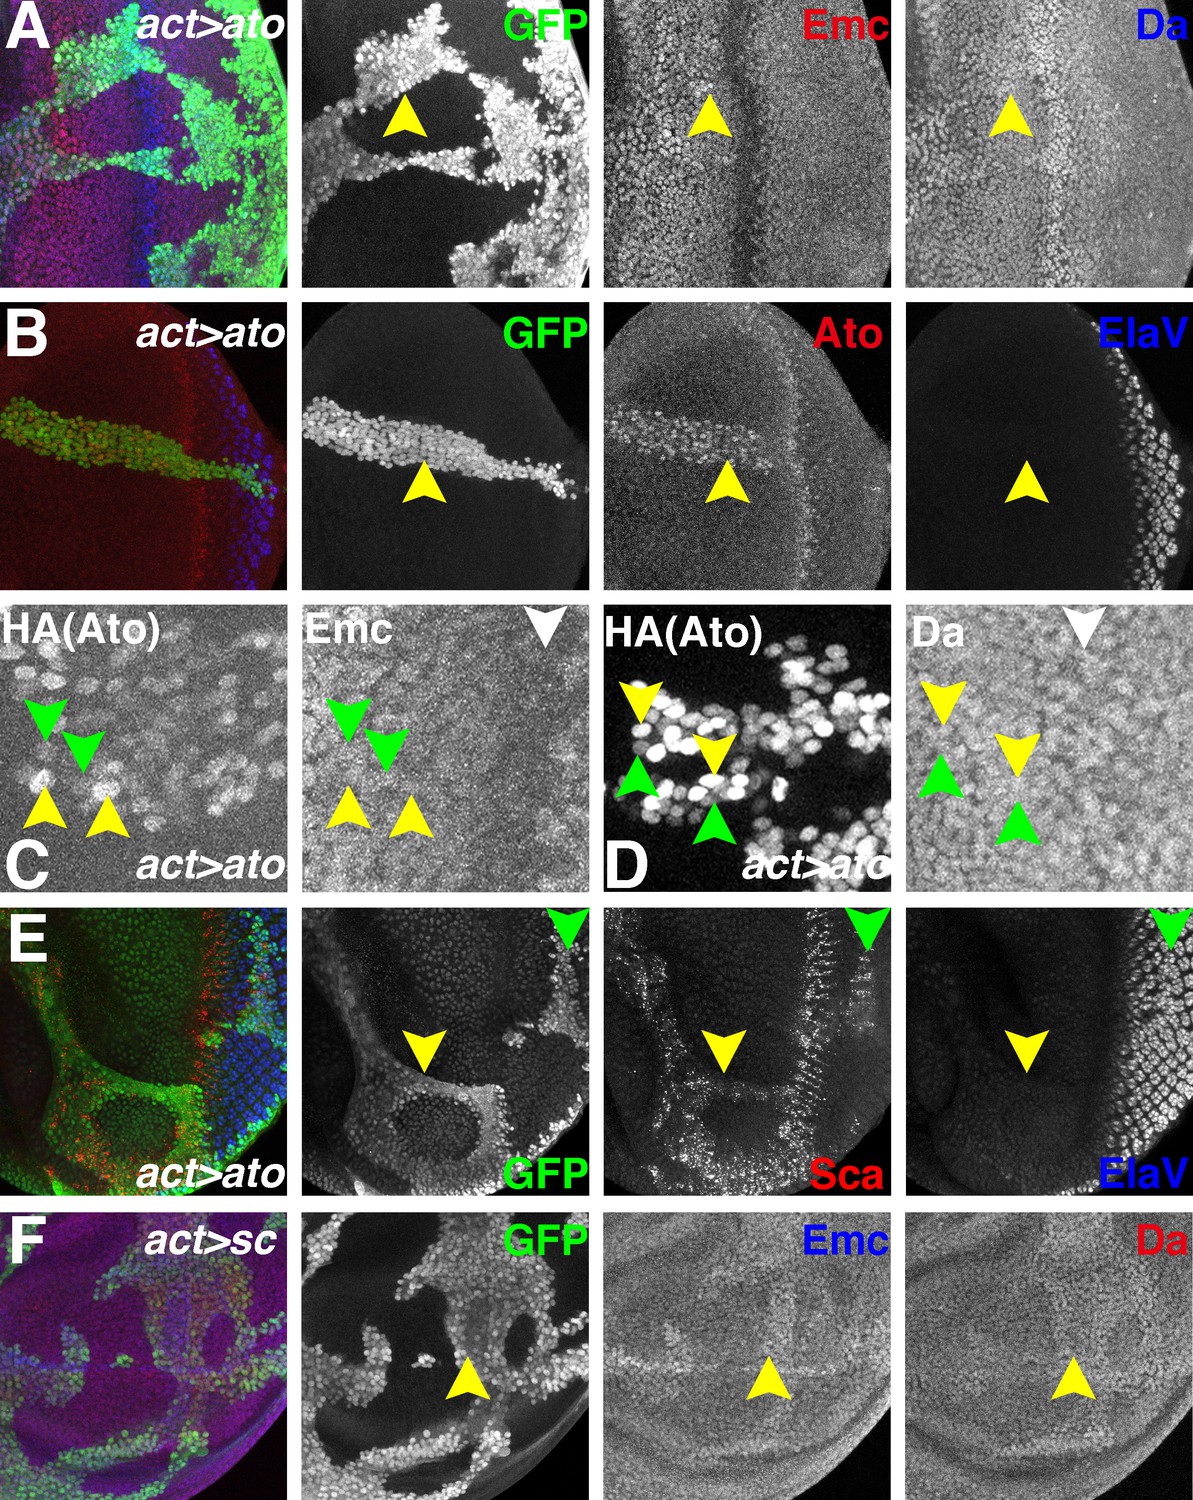
Ectopic Ato or Sc does not reduce Emc levels.
Flip-on clones expressing ato or sc using act-Gal4 and UAS-ato or UAS-sc lines are marked by GFP (green). (A) Ectopic Ato expression from UAS-ato.ORF-3HA had little effect on Emc levels (red) but slightly elevated Da (blue). (B) Ectopic Ato (red) levels ahead of the furrow were comparable to normal physiological levels in the furrow but failed to induce ectopic neuronal differentiation (Elav: blue). Notably, ectopic Ato levels declined close to the furrow, both anteriorly and posteriorly. (C) Cells with higher (yellow arrowheads) and lower (green arrowheads) levels of ectopic Ato had similar levels of Emc protein. White arrowhead indicates the morphogenetic furrow. (D) Cells with higher (yellow arrowheads) and lower (green arrowheads) levels of ectopic Ato had similar levels of Da protein. White arrowhead indicates the morphogenetic furrow. (E) Ectopic Ato expression activates its downstream target Sca (red) in the eye disc (arrows) but only affected neuronal differentiation (blue) posterior to the furrow (green arrow). (F) Ectopic Sc expression from UAS-sc in wing discs sightly elevated Da (red) in clones and perhaps also Emc (blue) expression. Genotypes: (A–E) hsFLP; act > CD2>Gal4, UAS-GFP/UAS-ato.ORF-3HA; (F) hsFLP; UAS-sc.39/+; act > CD2>Gal4, UAS-GFP/+.
Figure 7—figure supplement 1
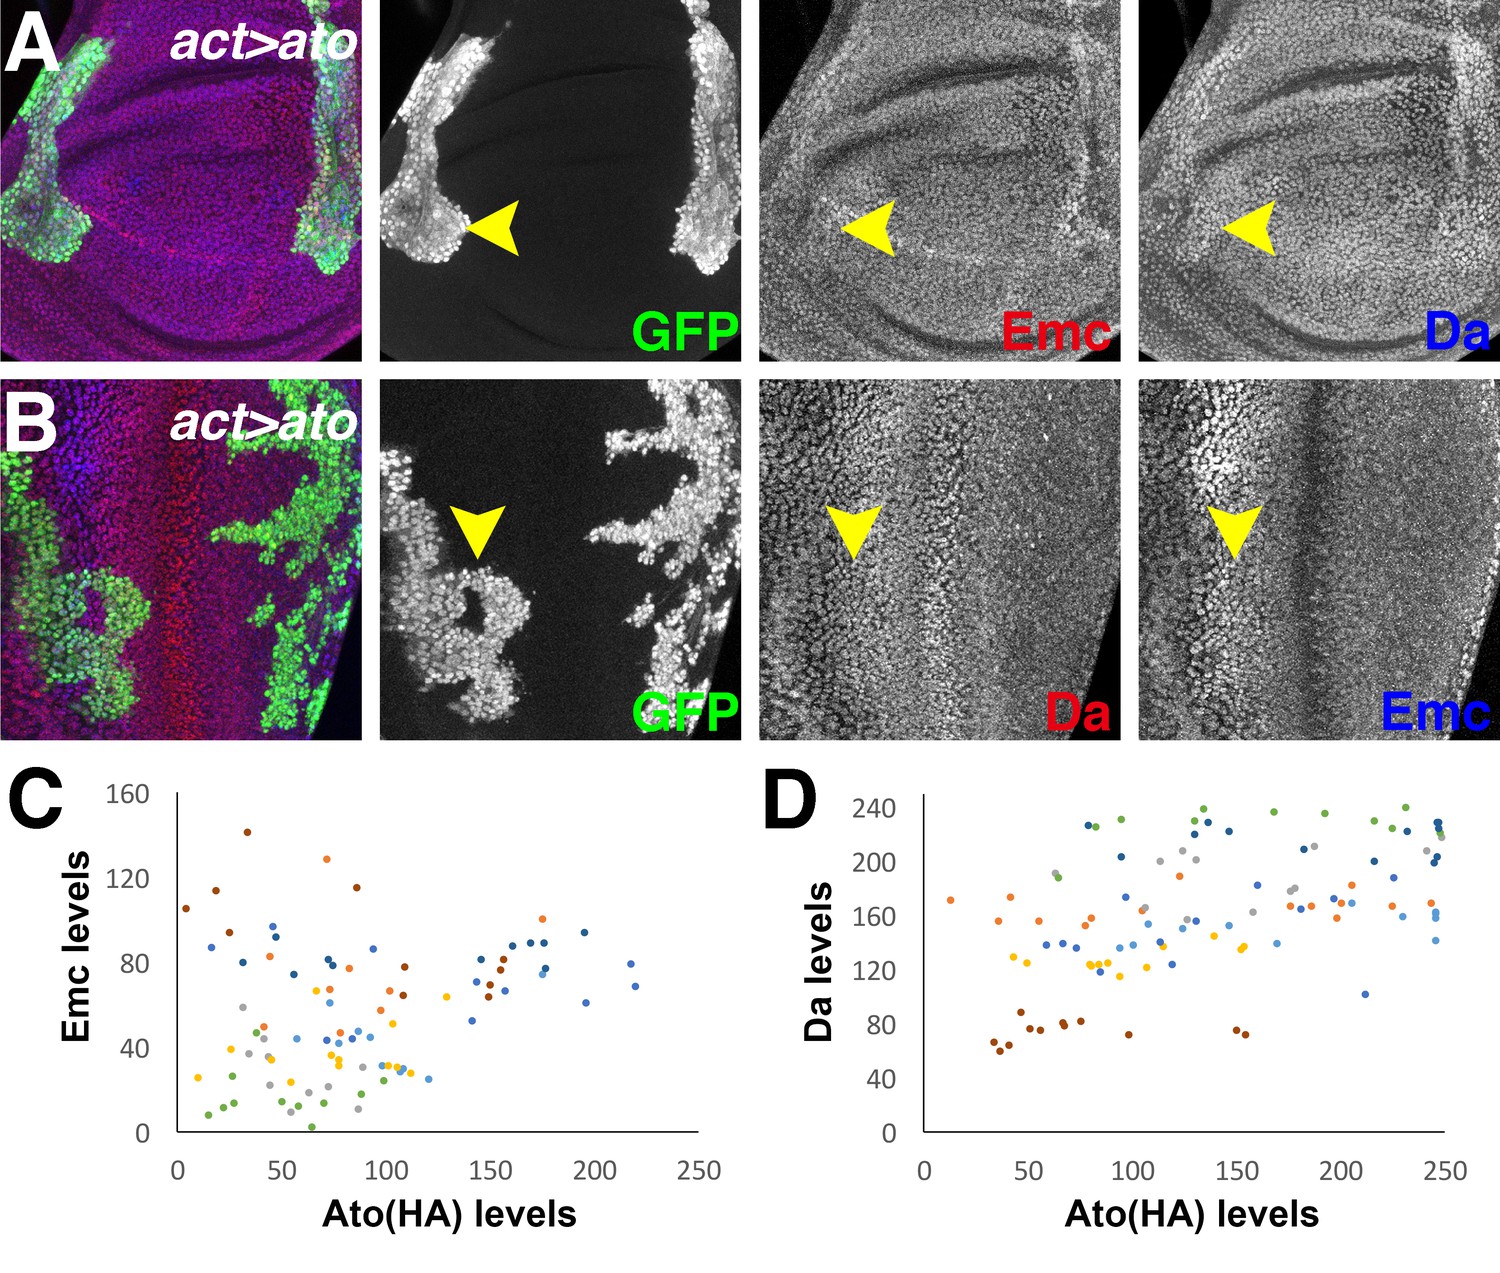
Flip-on clones expressing ato using act-Gal4 and various UAS-ato lines marked by GFP (green).
(A) Ectopic Ato induced from the UAS-ato.ORF-3HA allele slightly upregulates Da (blue) in wing disc but has little effect on Emc (red). Ato-expressing nuclei often localize more basally than their normal counterparts. (B) Ectopic Ato induced from a second transgene UAS-ato-4 has little effect on Da (red) or Emc (blue) expression in eye disc. (C) Quantification of Emc levels with Ato (HA) levels in individual cells expressing ectopic Ato. Emc levels are estimated by measuring the anti-Emc antibody fluorescence intensities and subtracting that in the morphogenetic furrow. Each dot represents measurement from one individual cell and each color represents one individual imaginal disc (N = 8). Overall labeling is somewhat variable between imaginal discs. (Da) Quantification of Da levels with Ato (HA) levels in individual cells expressing ectopic Ato (N = 8). Genotypes: (A) hsFLP; act > CD2>Gal4, UAS-GFP/UAS-ato.ORF-3HA; (B) hsFLP; UAS-ato-4/+; act > CD2>Gal4, UAS-GFP/+.
Figure 7—figure supplement 2

Flip-on clones expressing sc in eye discs using act-Gal4 and a UAS-sc line are marked by GFP (green).
Ectopic Sc induced from UAS-sc.39 slightly upregulated Da (red), especially posterior to the furrow, but had little effect on Emc (blue) expression. Genotypes: (A) hsFLP; UAS-sc.39/+; act > CD2>Gal4, UAS-GFP/+.
Figure 8 with 1 supplement
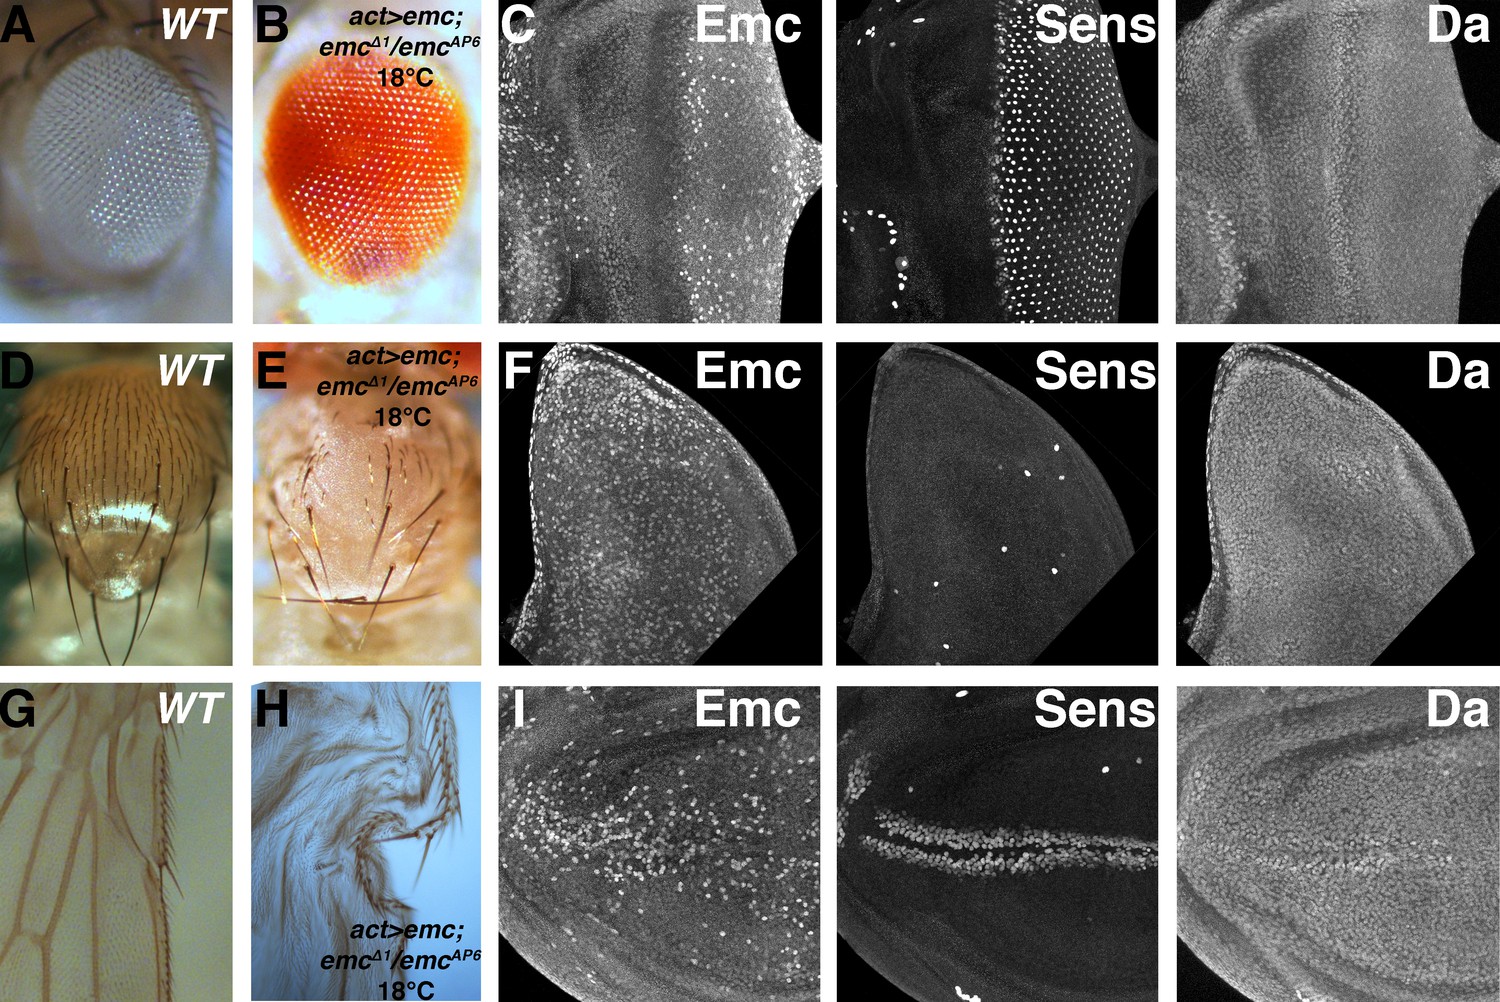
Ubiquitous emc transcription confers normal expression pattern and neurogenesis.
(A) Wild type adult eye showing ommatidia and interommatidial bristles. (B) Actin-Gal4-mediated ubiquitous transcription of emc at 18C in the absence of the endogenous locus gives rise to normal adult eye. (C) Eye imaginal discs from the rescued larvae show almost normal protein patterns, including the downregulation of Emc and upregulation of Da in the morphogenetic furrow, and normal neurogenesis shown by Sens staining. Unlike wild type discs, however, Emc protein levels are not discernibly elevated near the equatorial anterior margin (contrast with Figure 1A). Scattered cells show higher Emc levels. (D) Wild type thorax displays 11 pairs macrochaetae (at least seven pairs are shown here) and evenly-spaced microchaetae. (E) Ubiquitous emc expression gives rise to nearly all macrochaetae. Spaced microchatae are present over some regions. (F) Wing imaginal discs with ubiquitous emc expression elevated Emc in many cells. The number and position of Sens positive SOP cells resemble the wild type notum, and they also also showed higher Da expression (compare Figure 5B). (G) Anterior wing margin from wild type adult flies display mechanosensory and chemosensory bristles. (H). Uniform emc expression gives rise to normal bristles on the anterior and posterior wing margin (wings from this genotype do not inflate properly). (I) Wing imaginal discs from (H) show broad Emc expression with higher levels in scattered cells, more frequently in central portions of the wing pouch. Sens and Da shows normal upregulation in the presumptive anterior wing margin. Genotypes: (A, D, G) w1118; (B–C, E–F and H–I) act > Gal4/UAS-emc 5.3; emcΔ1 FRT80/emcAP6 FRT80.
Figure 8—figure supplement 1

(A–F) Gal4-driven ubiquitous emc transcription at 25C in emc mutant.
(A) Rescued pharate adults have essentially normal eye with interommatidial bristles. (B) Eye imaginal discs from (A) display broad Emc expression and numerous cells with higher levels, but always reduced around the morphogenetic furrow. Sens expression is almost normal. Da is ubiquitously expressed but not elevated in the furrow. (C) Pharate adult thorax has many normal macrochaetae but lacks most microchaetae. (D) Emc is uniformly expressed at high level in the notum. The number of SOP cells labeled by Sens was reduced, although at normal locations, and they did not elevate Da expression. (E) Sensory bristles along the wing margin were reduced. (F) Emc was expressed at high level in the wing pouch. Sens expression was normal at the wing margin but Da was not elevated.
Figure 9

Model for HLH protein regulation inside and outside proneural regions.
The top part compares gene transcription in most imaginal disc cells (non-proneural) with that in cells in proneural regions. The bottom part compares the protein species active in these cells. In non-proneural regions (left), only da and emc are transcribed. Emc is short-lived unless dimerized with Da, so that Da levels determine Emc levels. In proneural regions, one or more proneural bHLH genes are activated, and in the morphogenetic furrow emc transcription is repressed. Proneural Ato or AS-C proteins bind to Da and are responsible for Emc degradation. Emc may be degraded after displacement from heterodimers. It is possible that Ato (or AS-C) heterodimerizes with Emc, or Da homodimers are also present, and that these species also have distinct stabilities. Our findings show how the changes in Emc and Da levels that are a feature of in all proneural regions depend on post-translational regulation of HLH protein stability.
Tables
Key resources table
| Reagent type (species) or resource | Designation | Source or reference | Identifiers | Additional information |
|---|---|---|---|---|
| gene (Drosophila melanogaster) | emc | FlyBase: FBgn0000575 | ||
| gene (D. melanogaster) | da | FlyBase: FBgn0267821 | ||
| gene (D. melanogaster) | ato | FlyBase: FBgn0010433 | ||
| gene (D. melanogaster) | sc | FlyBase: FBgn0004170 | ||
| genetic reagent (D. melanogaster) | da[3] | PMID: 3802198 | ||
| genetic reagent (D. melanogaster) | emc[AP6] | PMID: 7947322 | ||
| genetic reagent (D. melanogaster) | emc[Δ1] | this study | ||
| genetic reagent (D. melanogaster) | act > CD2>Gal4, UAS-GFP | PMID: 9053304 | ||
| genetic reagent (D. melanogaster) | ato[1] | PMID: 8196767 | ||
| genetic reagent (D. melanogaster) | ato[3] | PMID: 7635049 | ||
| genetic reagent (D. melanogaster) | emc-GFP[YB0040] | PMID: 17179094 | ||
| genetic reagent (D. melanogaster) | emc-GFP[YB0067] | PMID: 17179094 | ||
| genetic reagent (D. melanogaster) | P{PZ}emc[04322] | PMID: 9529525 | ||
| genetic reagent (D. melanogaster) | Df(1)sc[B57] | PMID: 2510998 | ||
| genetic reagent (D. melanogaster) | Df(1)sc[10-1] | PMID: 3111716 | ||
| genetic reagent (D. melanogaster) | UAS-HA-da | PMID: 25579975 | ||
| genetic reagent (D. melanogaster) | UAS-ato.ORF-3HA | PMID: 23637332 | ||
| genetic reagent (D. melanogaster) | UAS-sc | PMID: 8978666 | ||
| genetic reagent (D. melanogaster) | UAS-ato-4 | PMID: 8324823 | ||
| genetic reagent (D. melanogaster) | UAS-emc5.3 | PMID: 10804180 | ||
| cell line (D. melanogaster) | S2 | DGRC | Stock Number: 6 | |
| antibody | anti-βGal (mouse) | DSHB | 40-1a | (1:100) |
| antibody | anti-ElaV (rabbit) | DSHB | 7E8A10 | (1:50) |
| antibody | anti-Da (mouse) | PMID: 3802198 | (1:200) | |
| antibody | anti-Emc (rabbit) | Y.N. Jan | (1:8000) | |
| antibody | anti-Ato (rabbit) | PMID: 8196767 | (1: 50000) | |
| antibody | anti-Sca (mouse) | PMID: 8622662 | (1:200) | |
| antibody | anti-GFP (rat) | Nacalai Tesque | GF090R | (1:1000) |
| antibody | anti-Sens (guinea pig) | PMID: 10975525 | (1:50) | |
| antibody | anti-V5 (mouse) | Invitrogen | 46–0706 | (1:5000) |
| antibody | anti-Flag (mouse) | Sigma | F3165 | (1:8000) |
| antibody | anti-Tubulin (mouse) | Abcam | ab18251 | (1:5000) |
| antibody | anti-Tubulin (rabbit) | Abcam | ab7291 | (1:5000) |
| antibody | anti-HA (rabbit) | Cell Signaling Tech | C29F4 | (1:1000) |
| antibody | anti-HA (mouse) | Roche | 12CA5 | (1:1000) |
| recombinant DNA reagent | Emc-V5 (plasmid) | this study | ||
| recombinant DNA reagent | Da-Flag (plasmid) | PMID: 25694512 | ||
| recombinant DNA reagent | GFP (plasmid) | PMID: 25694512 |
Additional files
-
Transparent reporting form
- https://doi.org/10.7554/eLife.33967.017
Download links
A two-part list of links to download the article, or parts of the article, in various formats.
Downloads (link to download the article as PDF)
Open citations (links to open the citations from this article in various online reference manager services)
Cite this article (links to download the citations from this article in formats compatible with various reference manager tools)
Regulation of the Drosophila ID protein Extra macrochaetae by proneural dimerization partners
eLife 7:e33967.
https://doi.org/10.7554/eLife.33967


