Tri-methylation of histone H3 lysine 4 facilitates gene expression in ageing cells
- The Babraham Institute, United Kingdom
Figures
Figure 1 with 2 supplements
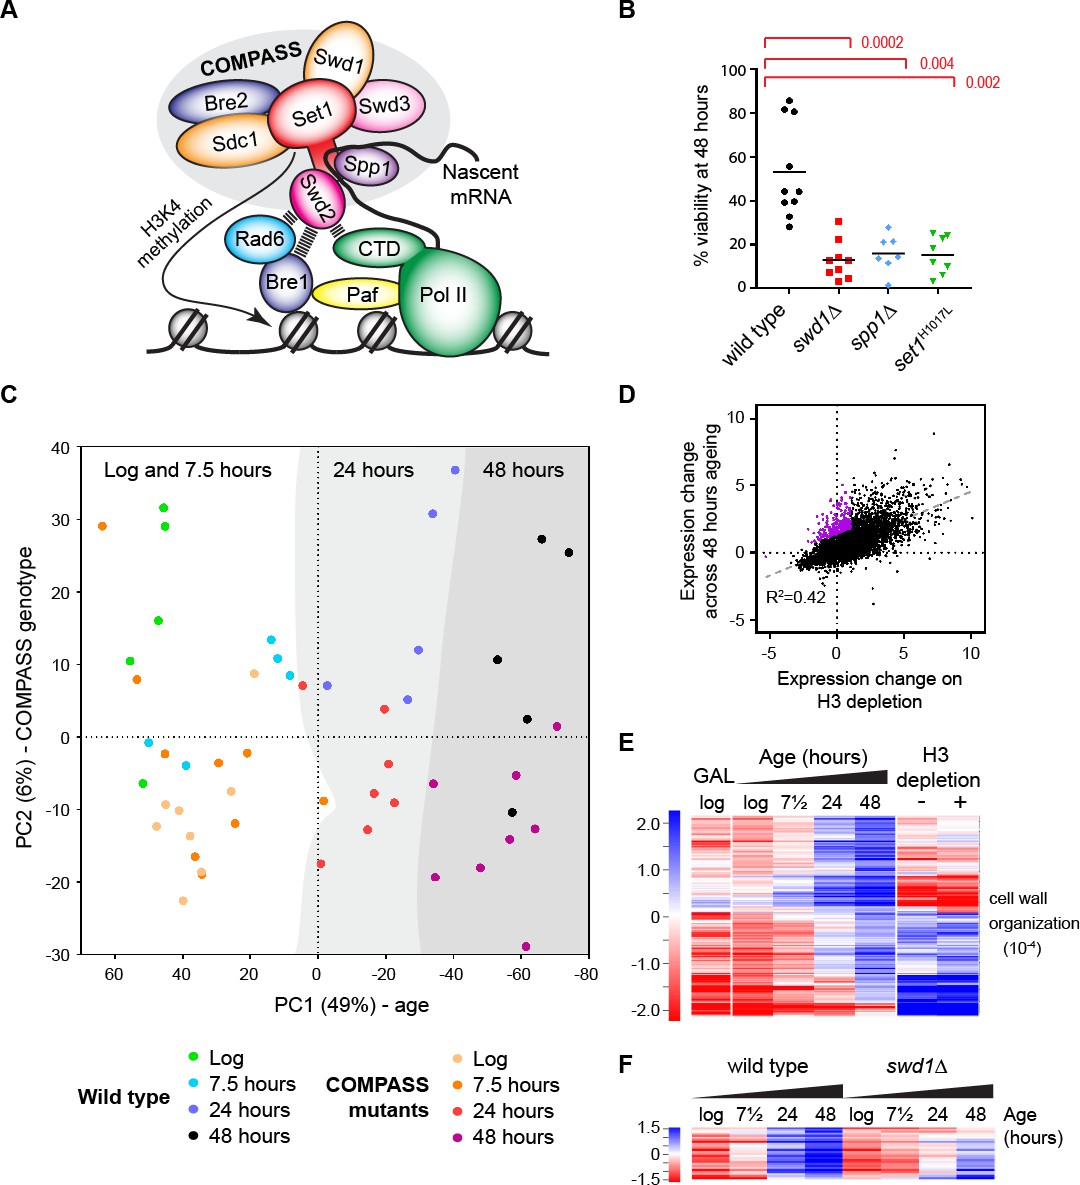
The ageing transcriptome in wild type and COMPASS mutants.
(A) Schematic of COMPASS recruitment for deposition of H3K4me3. (B) Viability of mother cells after 48 hr in liquid YPD culture determined using the MEP system. p-values calculated by Kruskal-Wallis test, n = 10 (wild type), n = 9 (swd1Δ), n = 7 (spp1Δ), n = 8 (set1H1017L). (C) PCA plot of protein-coding gene expression for the 52 mRNAseq libraries generated from wild type and COMPASS mutants across 48 hr ageing. COMPASS mutants have been shown in the same colours for simplicity and to reflect their pooling in the initial DESeq2 analyses (Figure 2A,B). Grey stripes define clusters of samples of different ages, showing that wild type and COMPASS mutants are similarly distributed on PC1, which primarily reflects age. (D) Plot of log2-transformed gene expression change from log phase to 48 hr ageing versus before to after H3 depletion. Genes that increase >2 fold more than average during ageing but increase <2 fold on H3 depletion are highlighted in purple. (E) Hierarchical clustering analysis of log2-transformed protein-coding mRNA change for genes differentially expressed between log phase and 48 hr ageing in wild type but not on H3 depletion or between glucose and galactose media. GO enrichment assigned using GOrilla as in Figure 1—figure supplement 2A, the order of magnitude of the FDR-corrected p-value is quoted in brackets. (F) Hierarchical clustering analysis across ageing for wild type and swd1Δ of the subset of genes from E that are significantly differentially expressed between wild-type and swd1Δ cells at 48 hr (DESeq2 p<0.01 n = 5 wild type, n = 4 swd1Δ).
Figure 1—figure supplement 1
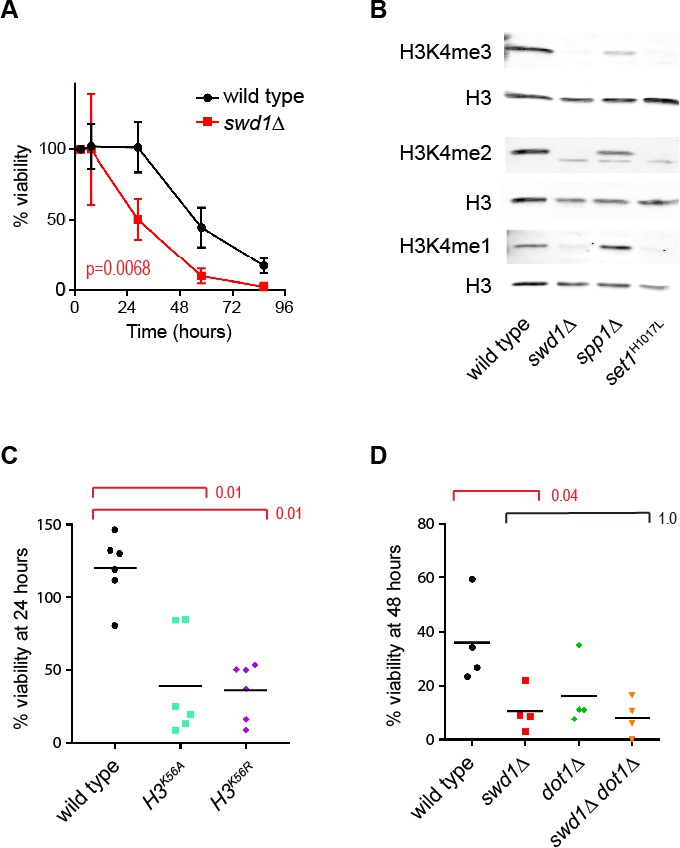
Supplement to the ageing transcriptome in wild type and COMPASS mutants.
(A) Viability of mother cells across 72 hr in liquid YPD culture using the MEP system for wild type and swd1Δ mutants. p-value calculated based on area under curve n = 5 for wild type, n = 3 for swd1Δ. (B) Western blot analysis of H3K4me3, H3K4me2 and H3K4me1 in log phase MEP cells. Three replicate membranes were probed with mouse anti-H3 and rabbit anti-H3K4me1/2/3 using a 2-colour detection system, such that each methyl-H3K4 antibody has a matched H3 control. (C) Viability of haploid mother cells after 24 hr in liquid YPD culture using the MEP system. p-values calculated by Kruskal-Wallis test, n = 6. (D) Viability of mother cells after 48 hr in liquid YPD culture using the MEP system. p-values calculated by Kruskal–Wallis test, n = 4.
Figure 1—figure supplement 2
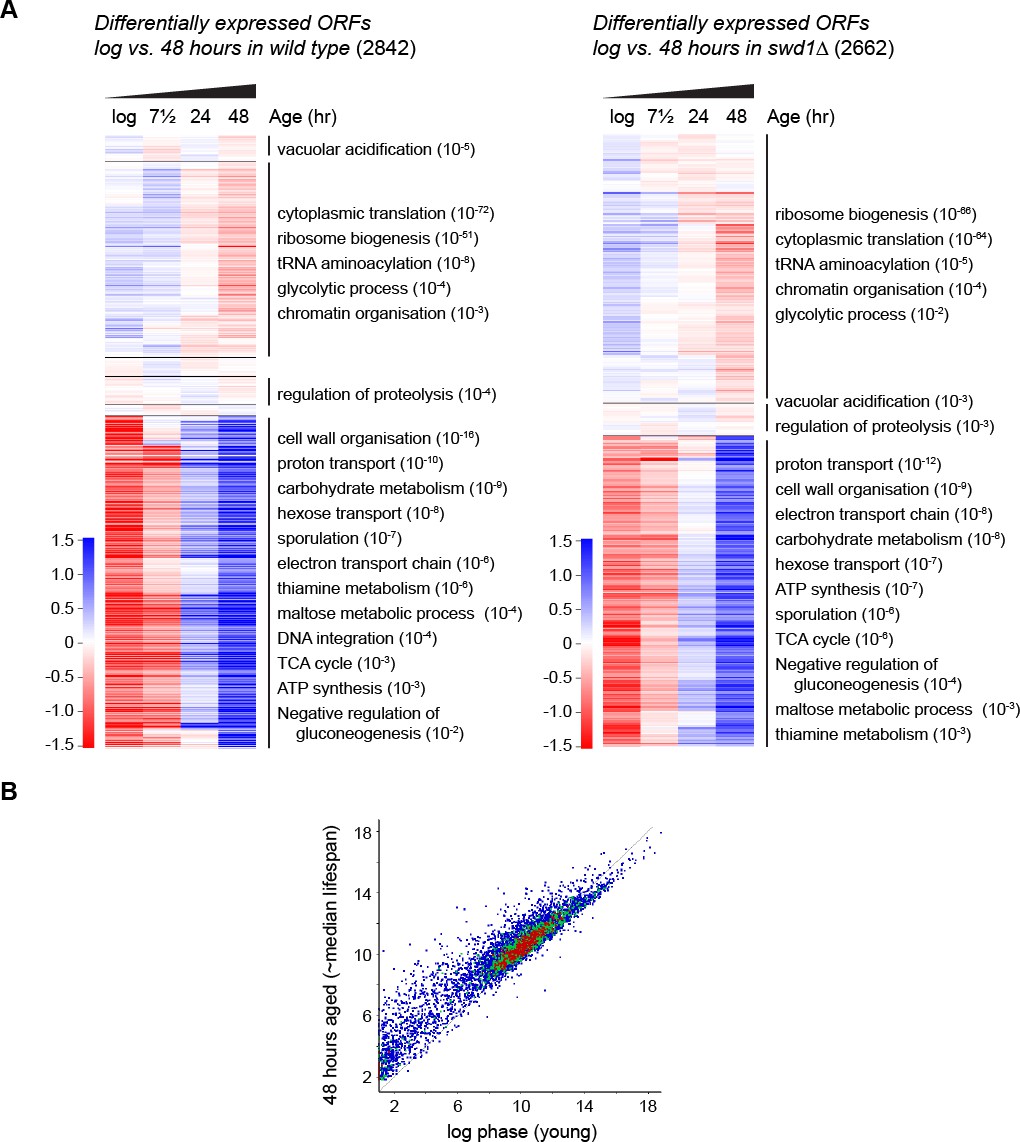
Age-linked changes in gene expression profile.
(A) Hierarchical clustering analysis of log2-transformed protein-coding mRNA levels across ageing for the genes significantly differentially expressed between log phase and 48 hr in wild-type (left, 2842 genes) and in swd1Δ (right, 2662 genes), assessed using DESeq2 p<0.01 n = 5 per time point (wild type) or n = 4 per time point (swd1Δ). Each annotated cluster shows significant GO enrichments assigned by GOrilla, FDR-corrected p-value<0.05, for brevity only the order of magnitude rather than the full FDR-corrected p-value is given. GO terms representing similar functions have been collapsed; full GO analyses are presented in Supplementary Material. (B) Scatter plot of log2-transformed mRNAseq read counts from protein-coding genes normalised for ORF length comparing log phase cells to 48 hr-aged cells. Data averaged across five replicates per condition.
Figure 2 with 1 supplement

COMPASS is required for normal gene expression in ageing cells.
(A) Plot of log2-transformed read-count differences for significantly differentially expressed genes between wild type and COMPASS mutants at each ageing time point. Assessed using DEseq2 p<0.01, wild-type n = 5 at each time point, COMPASS mutants n = 8 at log, n = 9 at 7.5 hr, n = 7 at 24 hr and n = 8 at 48 hr. Horizontal bars show median, dotted line indicates 1.5-fold change. (B) Hierarchical clustering analysis of log2-transformed protein-coding mRNA levels across age for the 488 genes significantly differentially expressed between wild-type and pooled COMPASS mutants at 48 hr, based on DEseq2 analysis in A. Separate time-courses are given for wild-type and each COMPASS mutant to show similar behaviour, GO analysis as for Figure 1—figure supplement 2A. (C) Hierarchical clustering analysis of log2-transformed protein-coding mRNA levels across age for the 104 genes significantly down-regulated in spp1Δ cells compared to wild-type at 48 hr, assessed using DESeq2 p<0.05 n = 5 per strain. GO analysis as Figure 1—figure supplement 2A. (D) Distribution of significantly differentially expressed genes between wild type and spp1Δ at log and 48 hr, analysis as in A, n = 5 for each set.
Figure 2—figure supplement 1
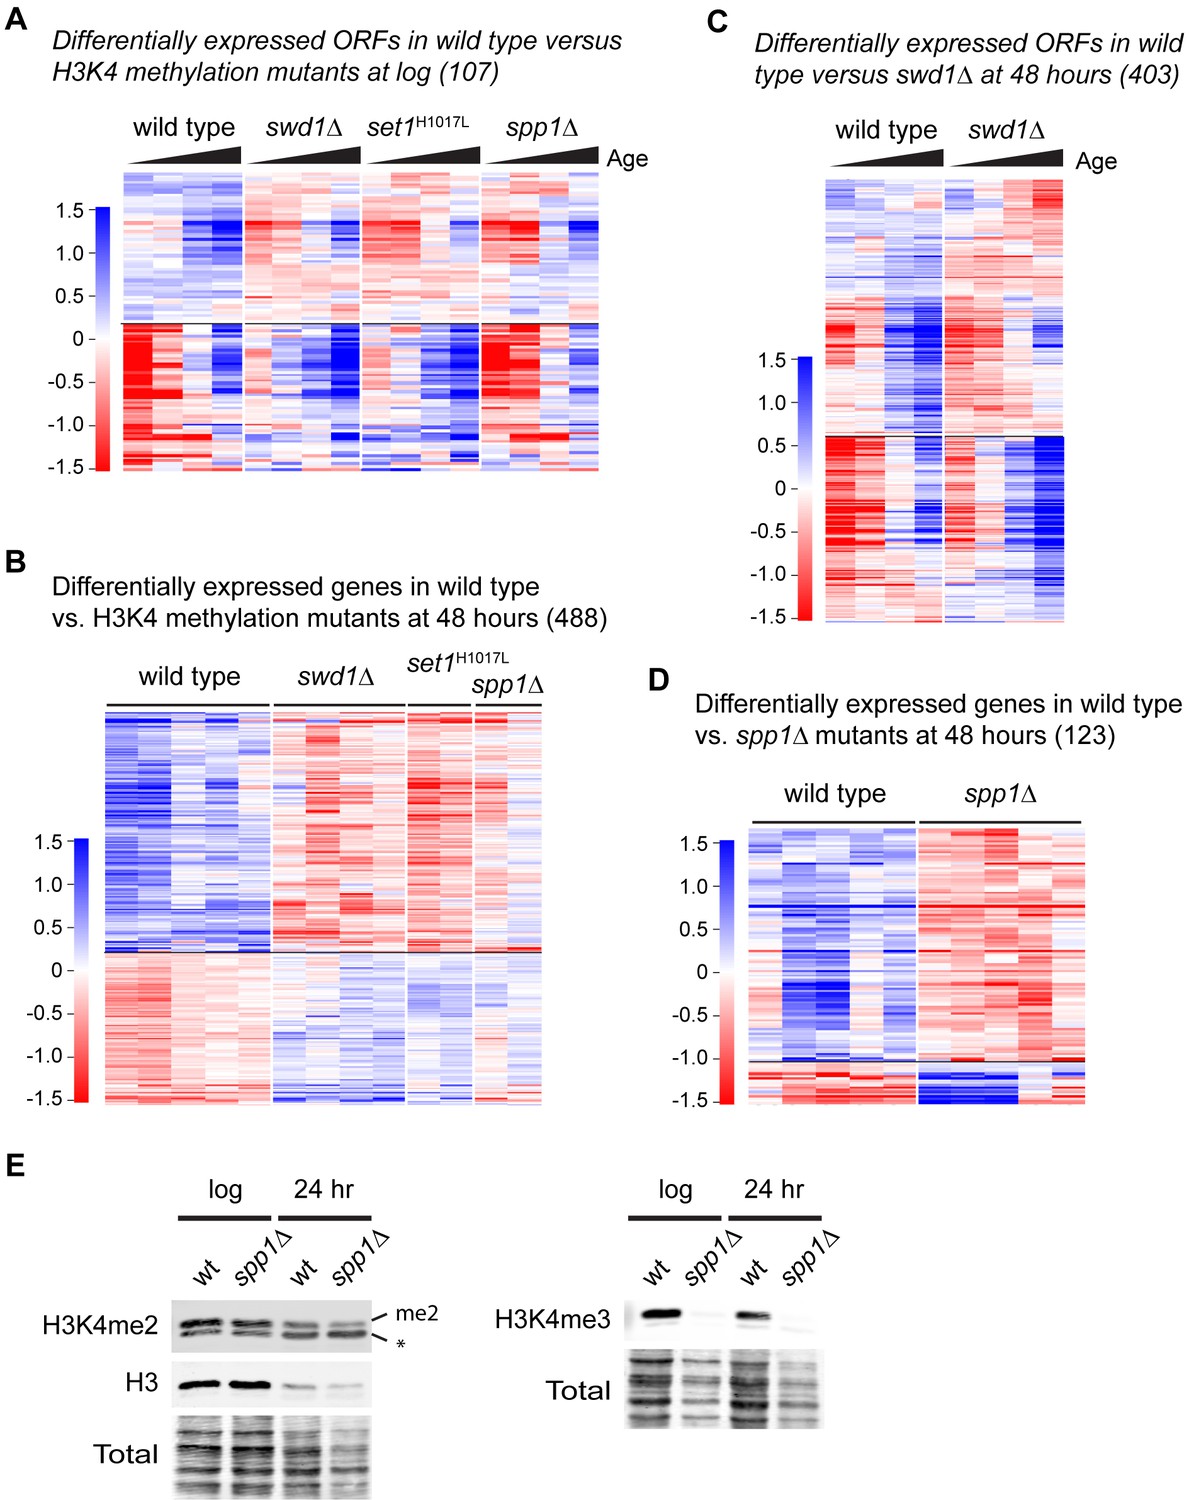
Supplement to COMPASS is required for gene expression in ageing cells.
(A) Hierarchical clustering analysis of log2-transformed protein-coding mRNA levels across age for the 107 genes significantly differentially expressed between wild-type and COMPASS mutants at log phase. (B) Hierarchical clustering analysis of log2-transformed protein-coding mRNA levels for the 488 genes significantly differentially expressed between wild type and COMPASS mutants at 48 hr (same set of genes as Figure 2B). All 48 hr replicates are shown to demonstrate the reproducibility of gene expression differences between mutants. (C) Hierarchical clustering analysis of log2-transformed protein-coding mRNA levels across age for the 403 genes significantly differentially expressed between wild-type and swd1Δ at 48 hr, for comparison with Figure 2B. (D) Hierarchical clustering analysis of log2-transformed protein-coding mRNA levels for the 123 genes significantly differentially expressed between wild type and spp1Δ at 48 hr (upregulated genes, 107, are the same set of genes as Figure 2B). All 48 hr replicates are shown to demonstrate the reproducibility of gene expression differences. (E) Western blot analysis of H3K4me2 and H3K4me3 in wild type and spp1Δ at log and 24 hr, with total protein as a loading control. The H3K4me2 antibody cross reacts with a slightly smaller band marked *, but the upper band labelled H3K4me2 was unambiguously assigned as the blot was probed using a 2-colour protocol; this allowed simultaneous detection of H3K4me2 and H3 as co-migrating bands.
Figure 3 with 2 supplements
Validation of gene expression differences in COMPASS mutants.
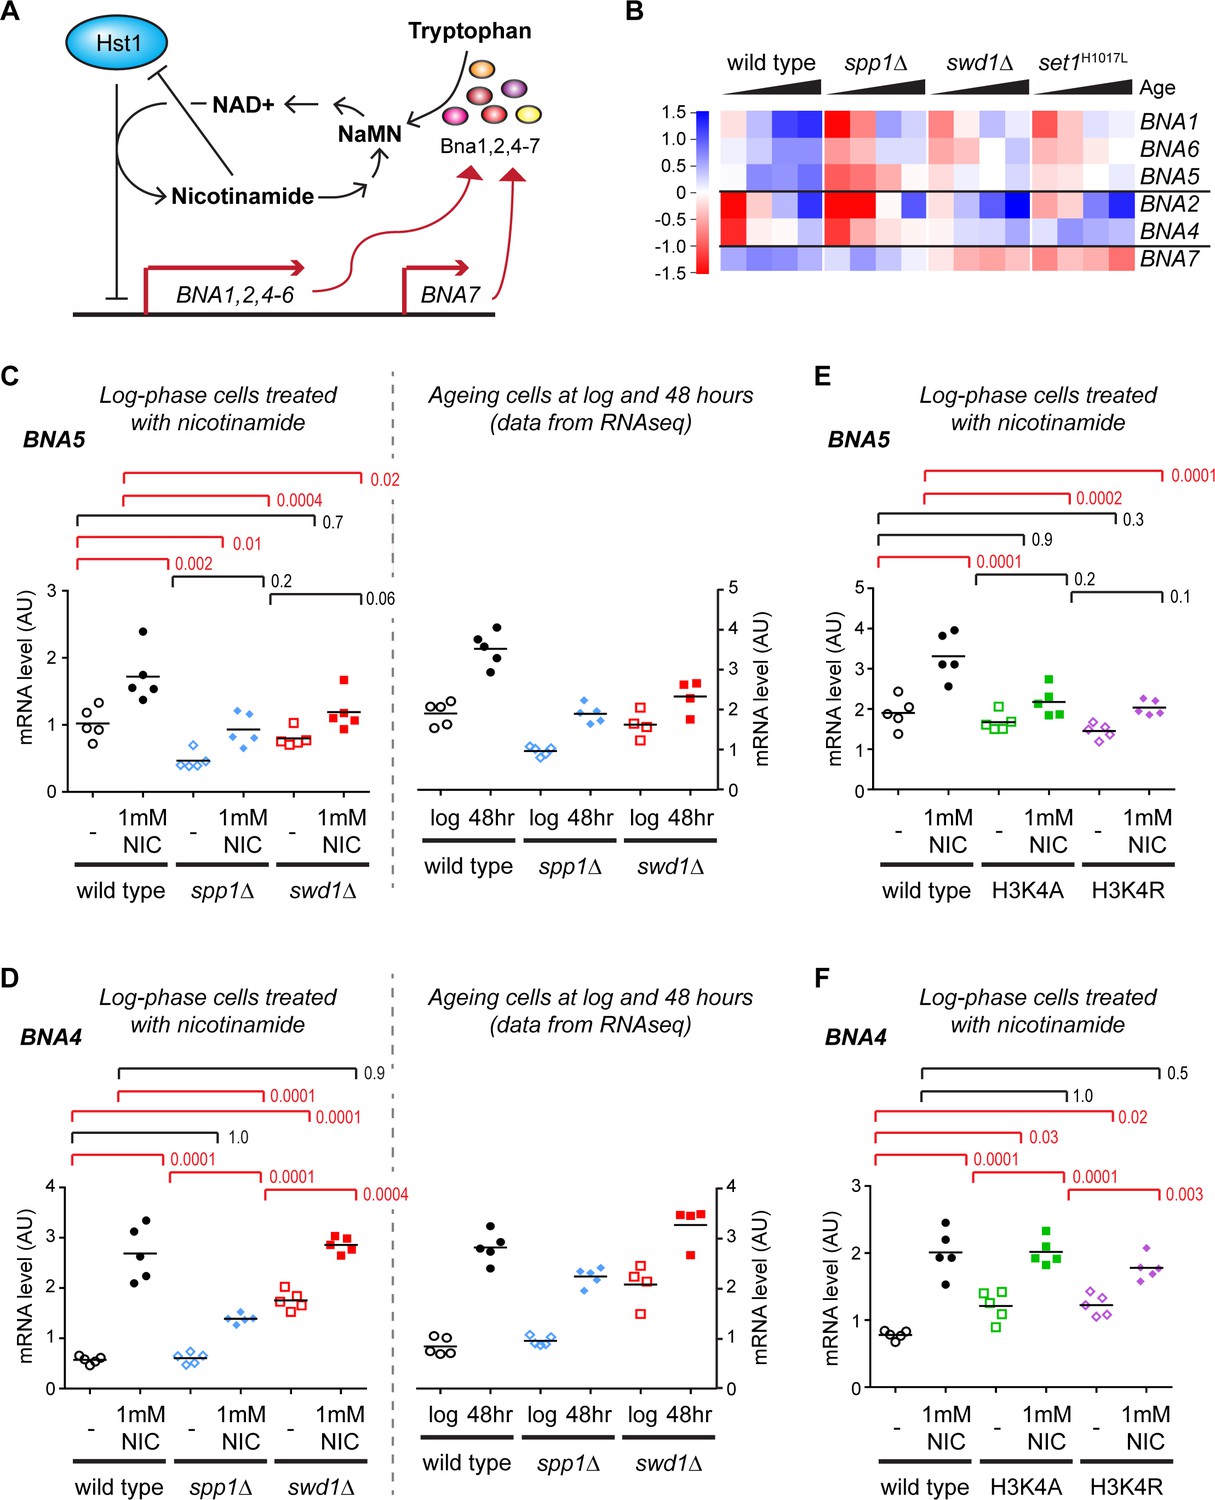
(A) Schematic representation of the regulatory feedback system controlling expression of the BNA genes which encode enzymes in the pathway for NAD+ biosynthesis from tryptophan via nicotinic acid mononucleotide (NaMN). Essentially, Hst1 uses NAD+ as a cofactor to repress the BNA genes, so that when NAD+ is low the expression of the BNA genes rises to increase NAD+ biosynthesis. NAD+ is converted to nicotinamide by Hst1, which is a product inhibitor and limits the repressive activity. Exogenous nicotinamide is efficiently taken up by cells, allowing Hst1 inhibition in culture. NAD+ can also be synthesised from nicotinamide riboside, but this does not involve the BNA genes. (B) Hierarchical clustering analysis of log2-transformed protein-coding mRNA change for genes in the tryptophan to NaMN biosynthesis pathway in wild type and COMPASS mutants across ageing. (C) Northern blot quantification of BNA5 mRNA level relative to ribosomal RNA in log phase BY4741 haploid cells grown in YPD and treated for 6 hr ± 1 mM nicotinamide (left panel) compared to mRNA abundance measurements for BNA5 derived from sequencing data for log and 48 hr aged cells (right panel). p-values were calculated by one-way ANOVA, significant differences are highlighted in red, n = 5 for each category. (D) Analysis of BNA4 expression as in C. (E) Analysis of BNA5 expression in histone point mutants ± nicotinamide, performed as in C. (F) Analysis of BNA4 expression in histone point mutants ± nicotinamide, performed as in C.
Figure 3—figure supplement 1
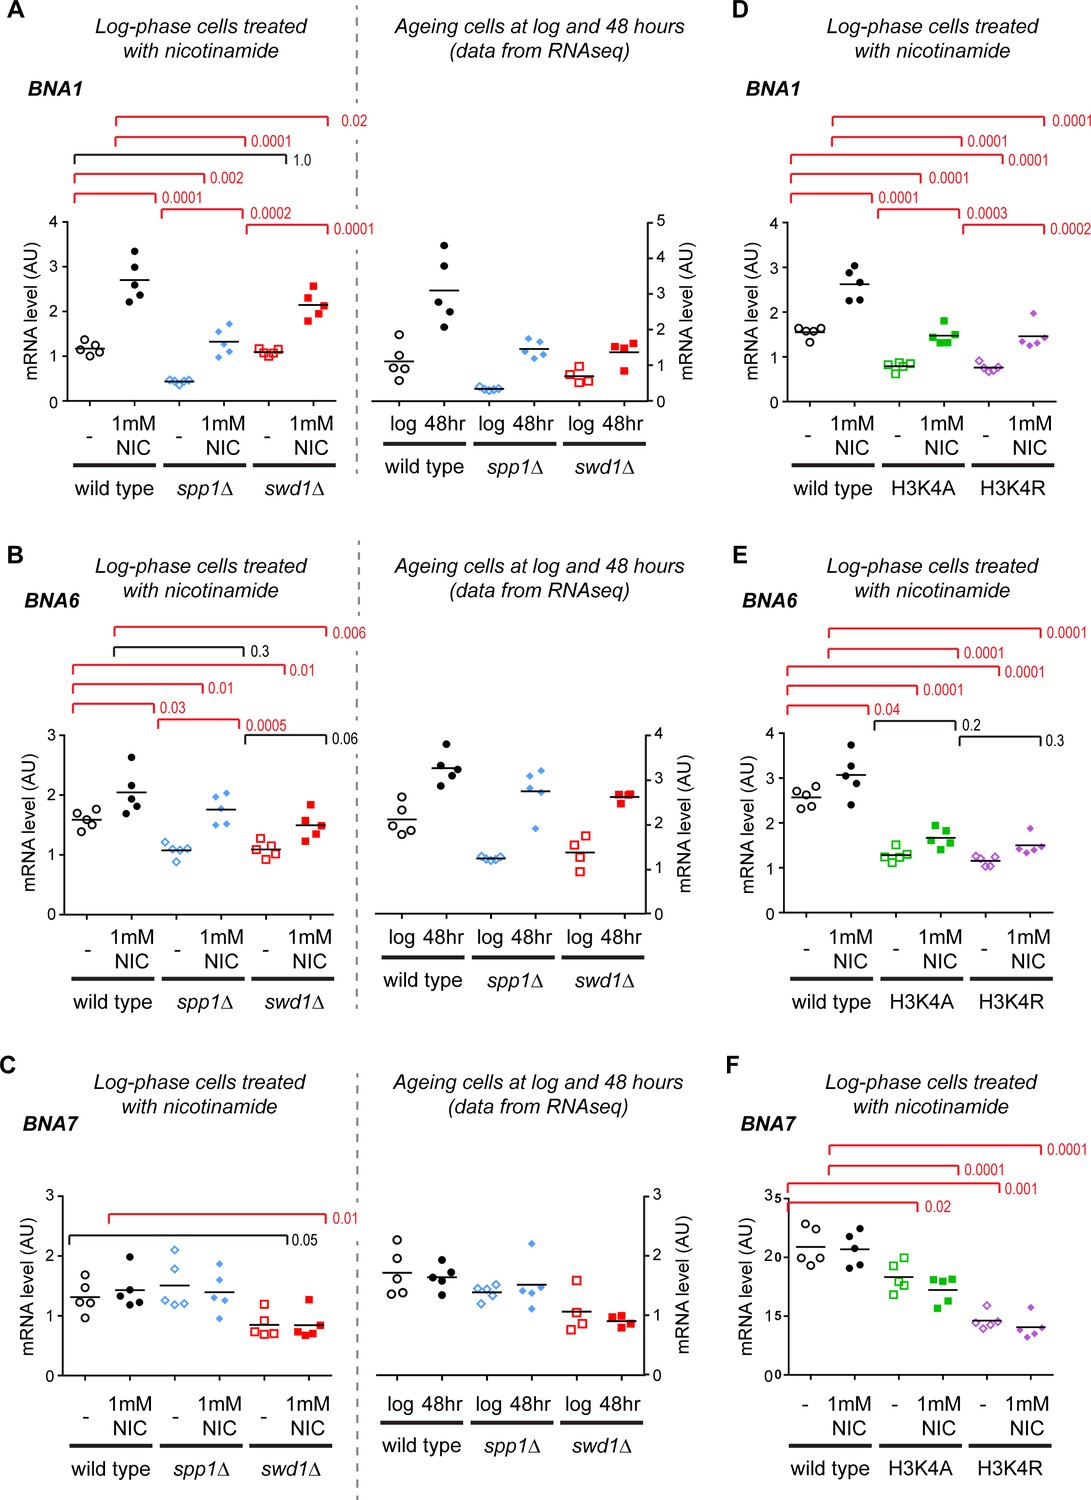
Supplement to validation of gene expression differences in COMPASS mutants.
(A–F) Quantification of BNA gene induction by northern blot for BNA1, BNA6 and BNA7, performed as in Figure 3C.
Figure 3—figure supplement 2
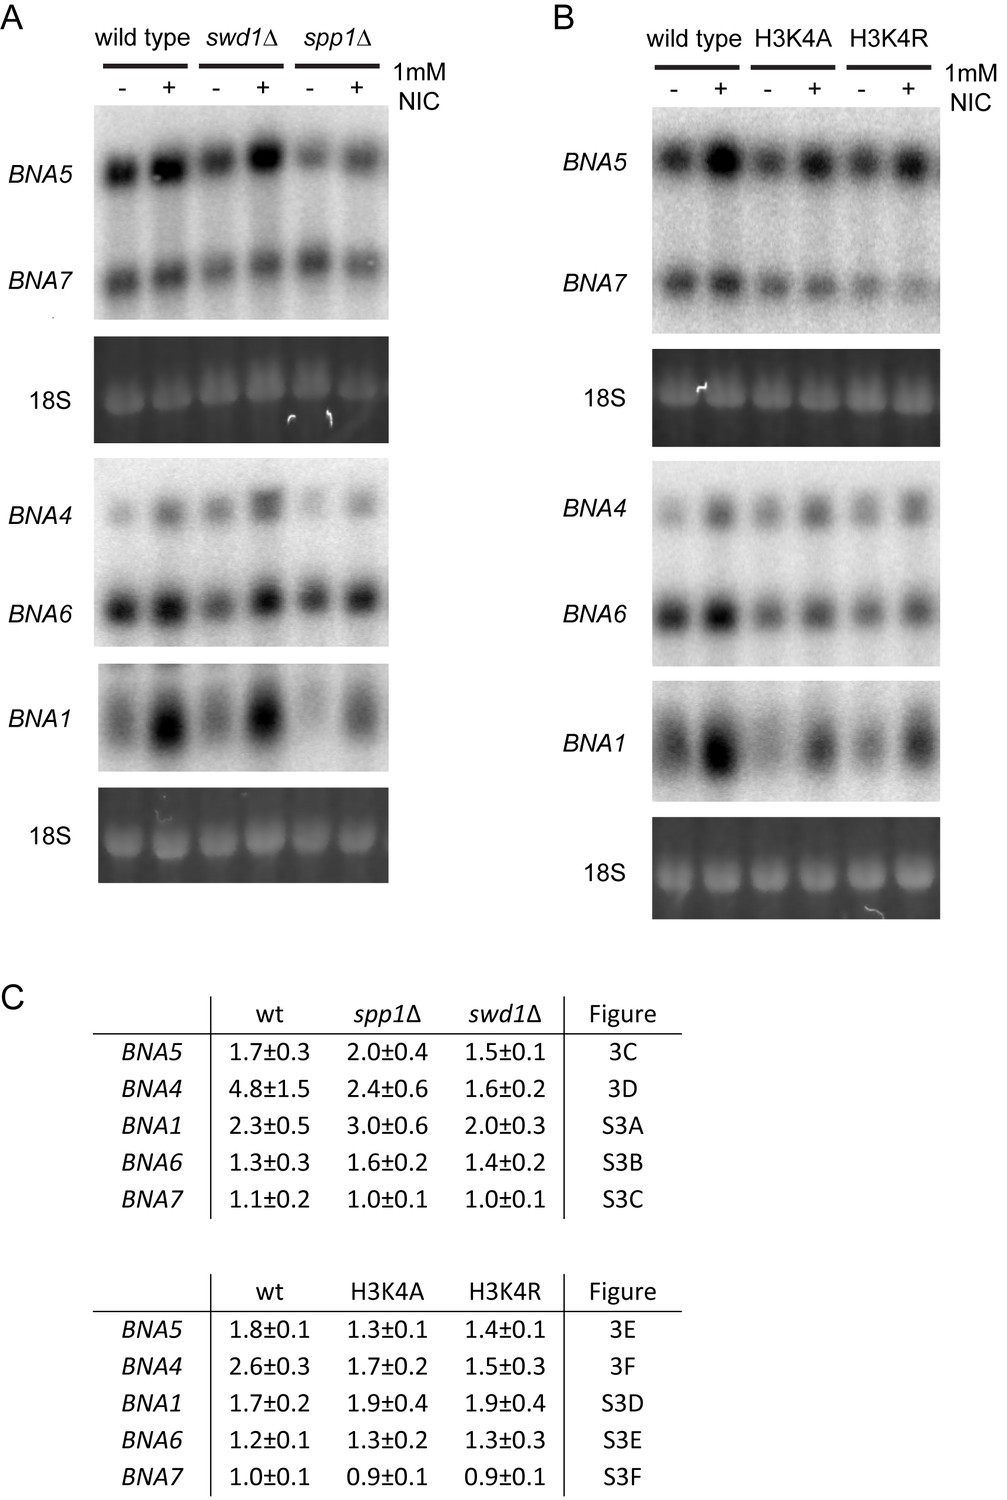
Example northern blotting data.
(A,B) Example northern blots for BNA1 and BNA4-7 induction along with 18S signal visualised by ethidium staining. (C) Quantification of fold induction of BNA1 and BNA4-7 in the presence of 1 mM NIC for the given mutants, based on the data shown in the given figure panels.
Figure 4 with 2 supplements
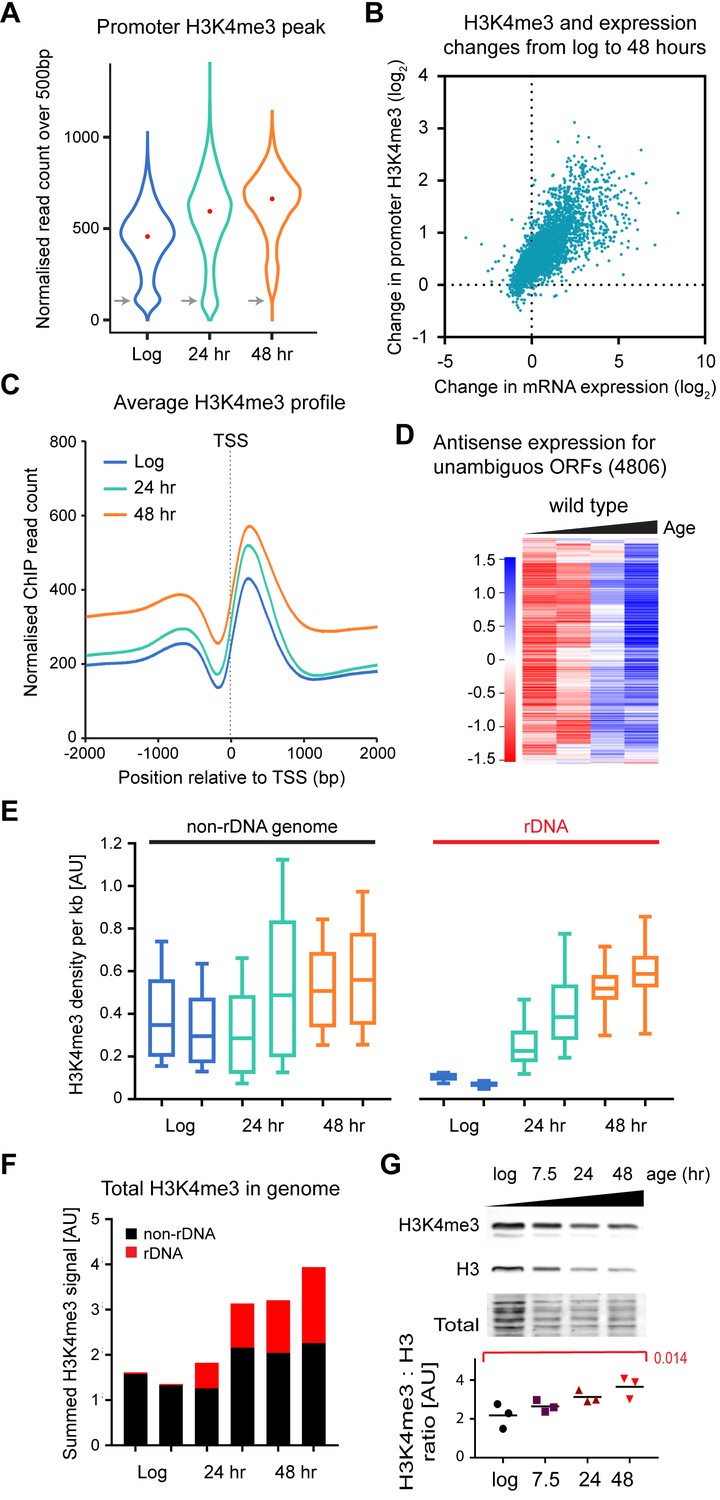
Age-linked dynamics of H3K4me3.
(A) Violin plot of read counts for region from transcriptional start site (TSS) to TSS+ 500 bp for all genes lying outside excluded regions defined in Figure 4—figure supplement 1A and with unambiguous promoter regions (4806 genes). Read counts were normalised using Drosophila chromatin spike-ins, data are an average of two biological replicates at each time point. Grey arrows highlight category of genes with very low H3K4me3 that disappears with age. (B) Plot of the change in H3K4me3 (TSS to TSS + 500 bp) from log to 48 hr for each gene in (A) versus change in mRNA level from log to 48 hr. Data are an average of two biological replicates for H3K4me3 and five biological replicates for mRNA. (C) Average H3K4me3 signal across region of TSS ± 2 kb for all genes in (A), profiles are normalised to Drosophila chromatin spike-ins. (D) Hierarchical clustering analysis of log2-transformed antisense poly(A)+RNA levels across age for the 4806 unambiguous genes defined in (A). (E) Average H3K4me3 density in 1 kb windows across rDNA and non-rDNA regions of the genome. Within each window, spike-in normalised ChIP read count was divided by spike-in normalised input read count to account for differences in copy number. Both replicates are shown for each time-point. (F) Summed normalised read counts across the genome for H3K4me3, sub-divided into rDNA and non-rDNA sequences. (G) Western blot analysis of histone H3 and H3K4me3 in wild-type cells aged for 0, 7.5, 24 or 48 hr, performed using a 2-colour system to simultaneously detect both antigens. Ratios of H3K4me3 to H3 were compared by one-way ANOVA, n = 3, specific comparison and p-value is shown in red.
Figure 4—figure supplement 1
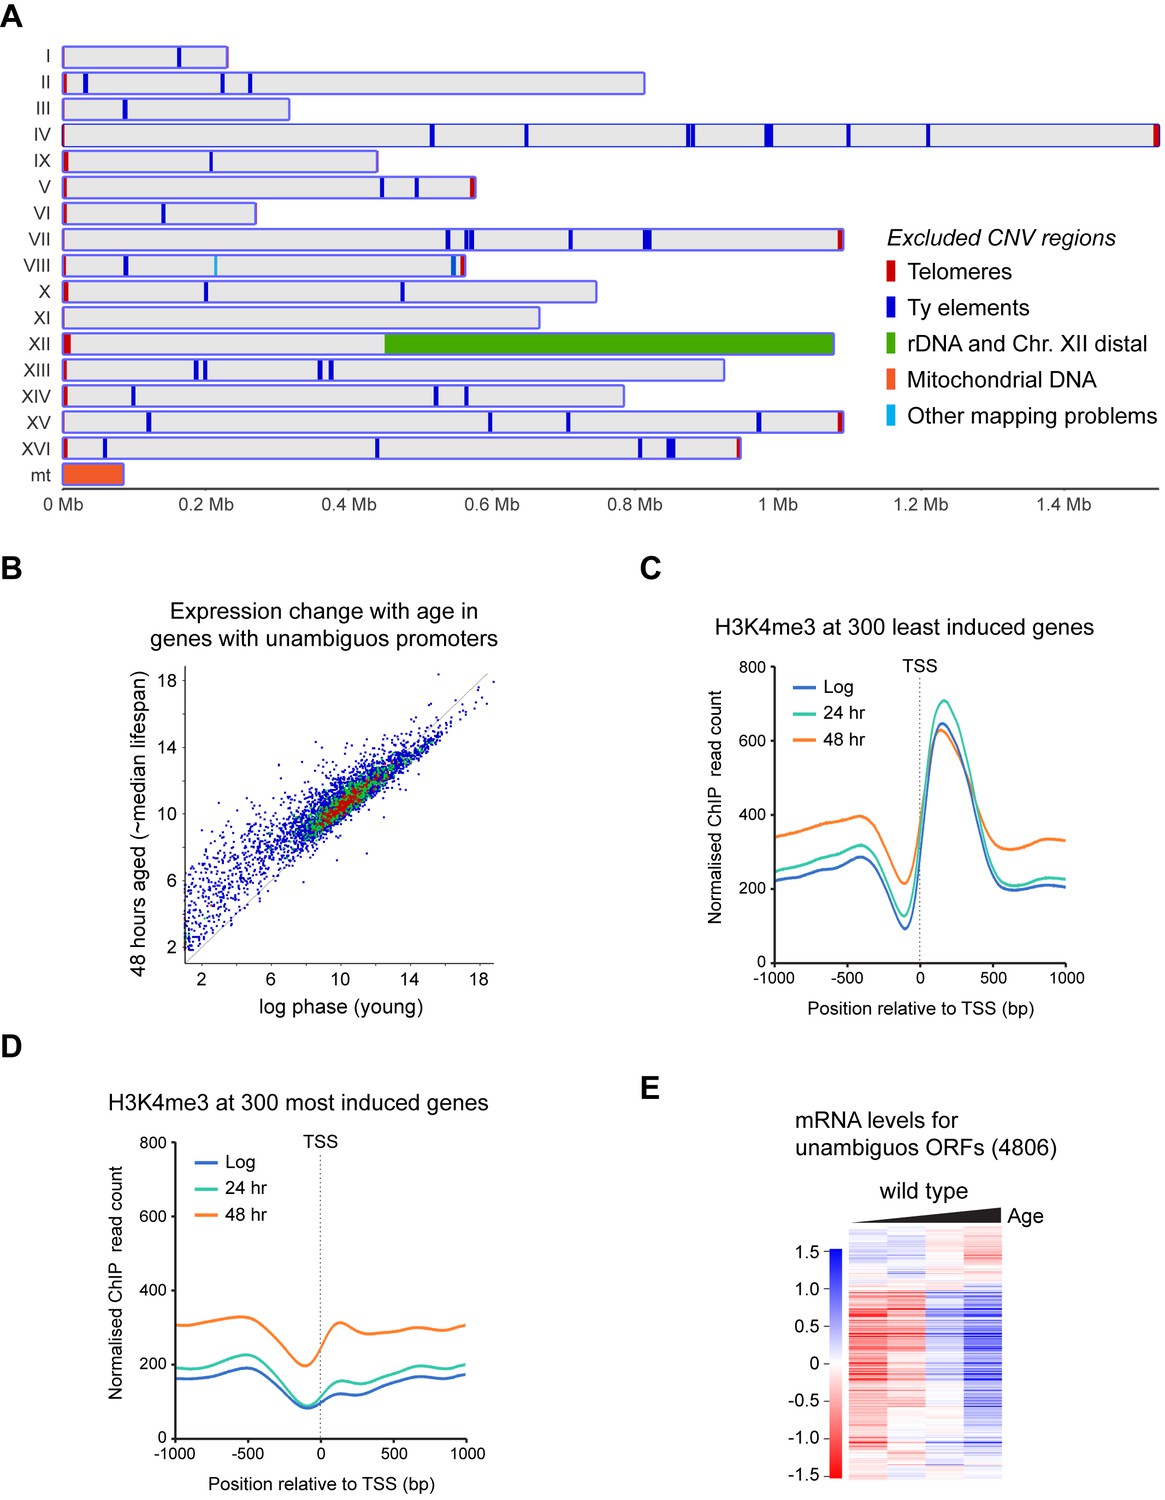
Dynamics of H3K4me3 and expression in subsets of genes.
(A) Genomic regions subject to age-linked CNV detected by comparison between input samples; these were excluded from ChIP analysis. (B) Scatter plot of log2-transformed mRNAseq read counts from protein coding genes defined in Figure 4A normalised for ORF length comparing log phase cells to 48-hr-aged cells. Data averaged across five replicates per condition. (C) Average profile of H3K4me3 ChIP signal for 1 kb either side of the TSS performed as in Figure 4C, for 300 genes least induced with age. (D) As (C) for 300 most induced genes. (E) Hierarchical clustering analysis of log2-transformed mRNA levels across age for the 4806 unambiguous genes defined in Figure 4A.
Figure 4—figure supplement 2
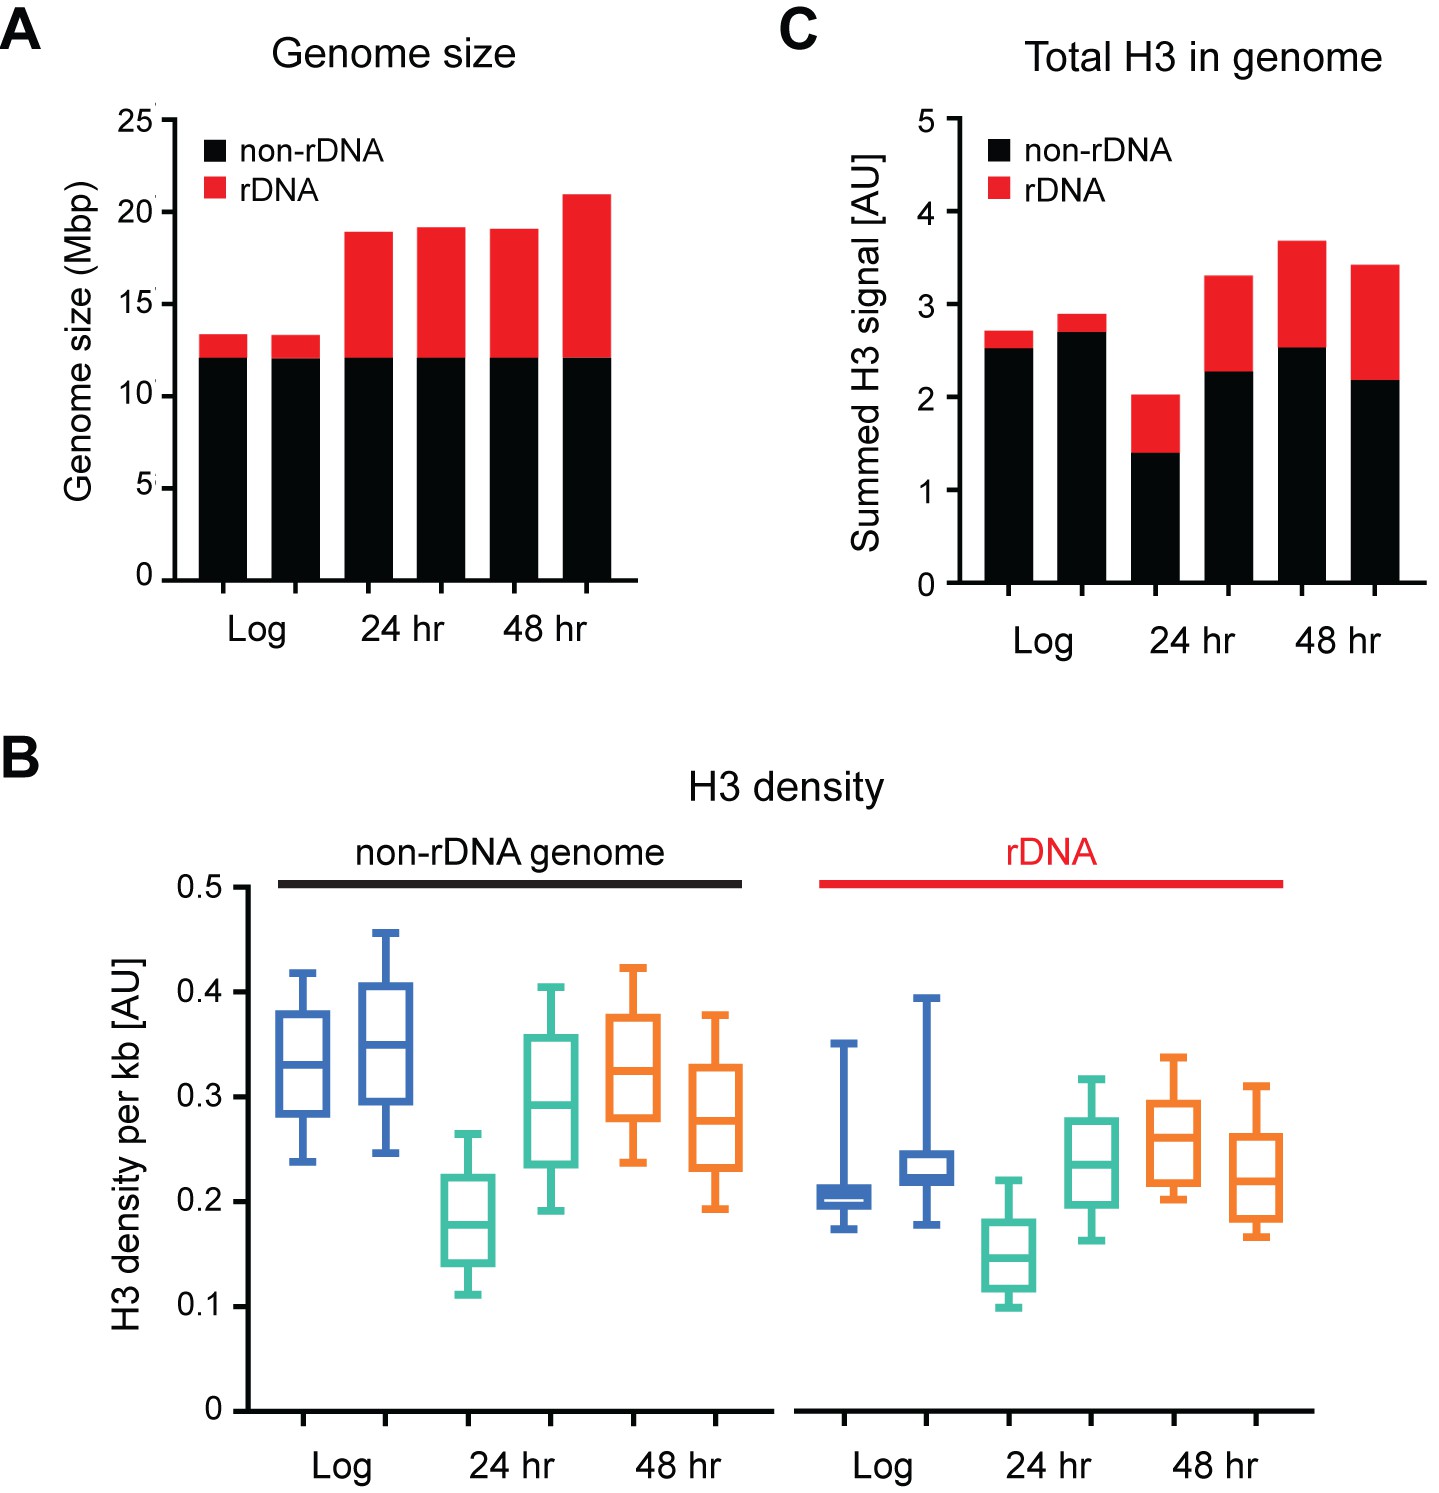
Age linked changes in genome size and H3 distribution
(A) Genome sizes in cells of different ages calculated using read counts of ChIP input samples, separated into rDNA and non-rDNA regions. (B) Average H3 density in 1 kb windows across rDNA and non-rDNA regions of the genome. Within each window, spike-in normalised ChIP read count was divided by spike-in normalised input read count to account for differences in copy number. Both replicates are shown for each time-point. (C) Summed normalised read counts across the genome for H3, sub-divided into rDNA and non-rDNA sequences.
Figure 5
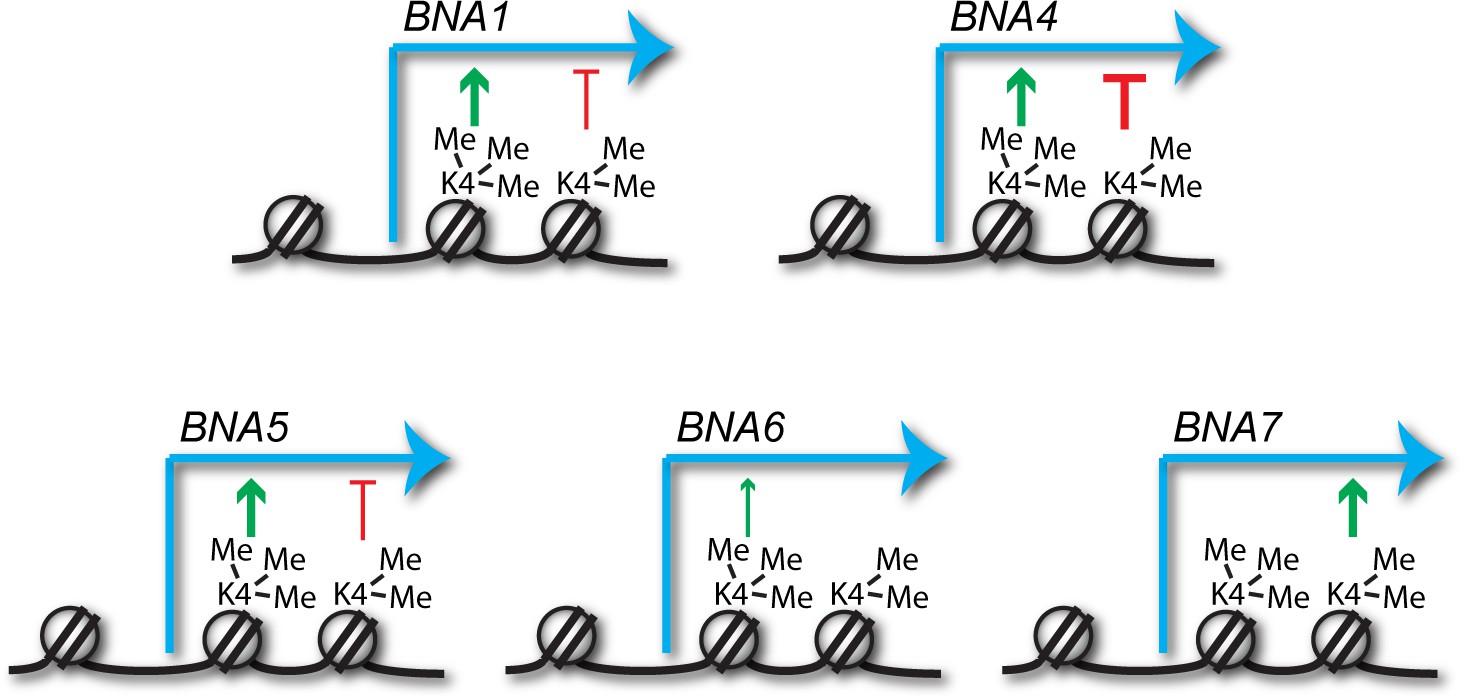
Predicted impacts of H3K4me2 and H3K4me3 on BNA gene expression.
Schematic of the different impacts of H3K4me2 and H3K4me3 on expression of the BNA genes analysed in Figure 3 and Figure 3—figure supplement 1. Depiction of these modifications on the +2 and+1 nucleosomes respectively is for illustrative purposes only and simply indicates that H3K4me2 normally spreads further into the gene body than H3K4me3.
Author response image 1

Ratio of rRNA to ACT1 mRNA levels in wild-type cells across age.
https://doi.org/10.7554/eLife.34081.020Tables
Table 1
mRNAseq libraries analysed in this work.
https://doi.org/10.7554/eLife.34081.005Additional files
-
Supplementary file 1
Supplementary Tables S1-S7.
S1: Summary of differentially expressed genes determined using DESeq2 S2: Regions of variable copy number excluded from ChIPseq analysis S3: Yeast strains used in this research S4: Oligonucleotides used in this research S5: Plasmids used in this research S6: Probes used in this research S7: Antibodies used in this research.
- https://doi.org/10.7554/eLife.34081.015
-
Supplementary file 2
Full results of GO analyses Full output of GO analyses presented in Figure 1, Figure 1—figure supplement 1, Figure 2, Figure 2—figure supplement 1.
Only the Process Ontology is presented (as in the figures), the data here is the full output from GOrilla (cbl-gorilla.cs.technion.ac.il) with a P-value threshold of 0.001. However, only GO hits with an FDR-corrected q-value of <0.05 were considered significant in the final analysis.
- https://doi.org/10.7554/eLife.34081.016
-
Supplementary file 3
Data underlying figures Numerical data used to produce all figures shown.
For hierarchical clustering diagrams, this includes the expression data and identifier for each gene.
- https://doi.org/10.7554/eLife.34081.017
-
Transparent reporting form
- https://doi.org/10.7554/eLife.34081.018
Download links
A two-part list of links to download the article, or parts of the article, in various formats.
Downloads (link to download the article as PDF)
Open citations (links to open the citations from this article in various online reference manager services)
Cite this article (links to download the citations from this article in formats compatible with various reference manager tools)
Tri-methylation of histone H3 lysine 4 facilitates gene expression in ageing cells
eLife 7:e34081.
https://doi.org/10.7554/eLife.34081


