A novel source of arterial valve cells linked to bicuspid aortic valve without raphe in mice
- Newcastle University, United Kingdom
- Centro Nacional de Investigaciones Cardiovasculares Carlos III, Spain
- Instituto de Salud Carlos III, Spain
Figures
Figure 1 with 1 supplement
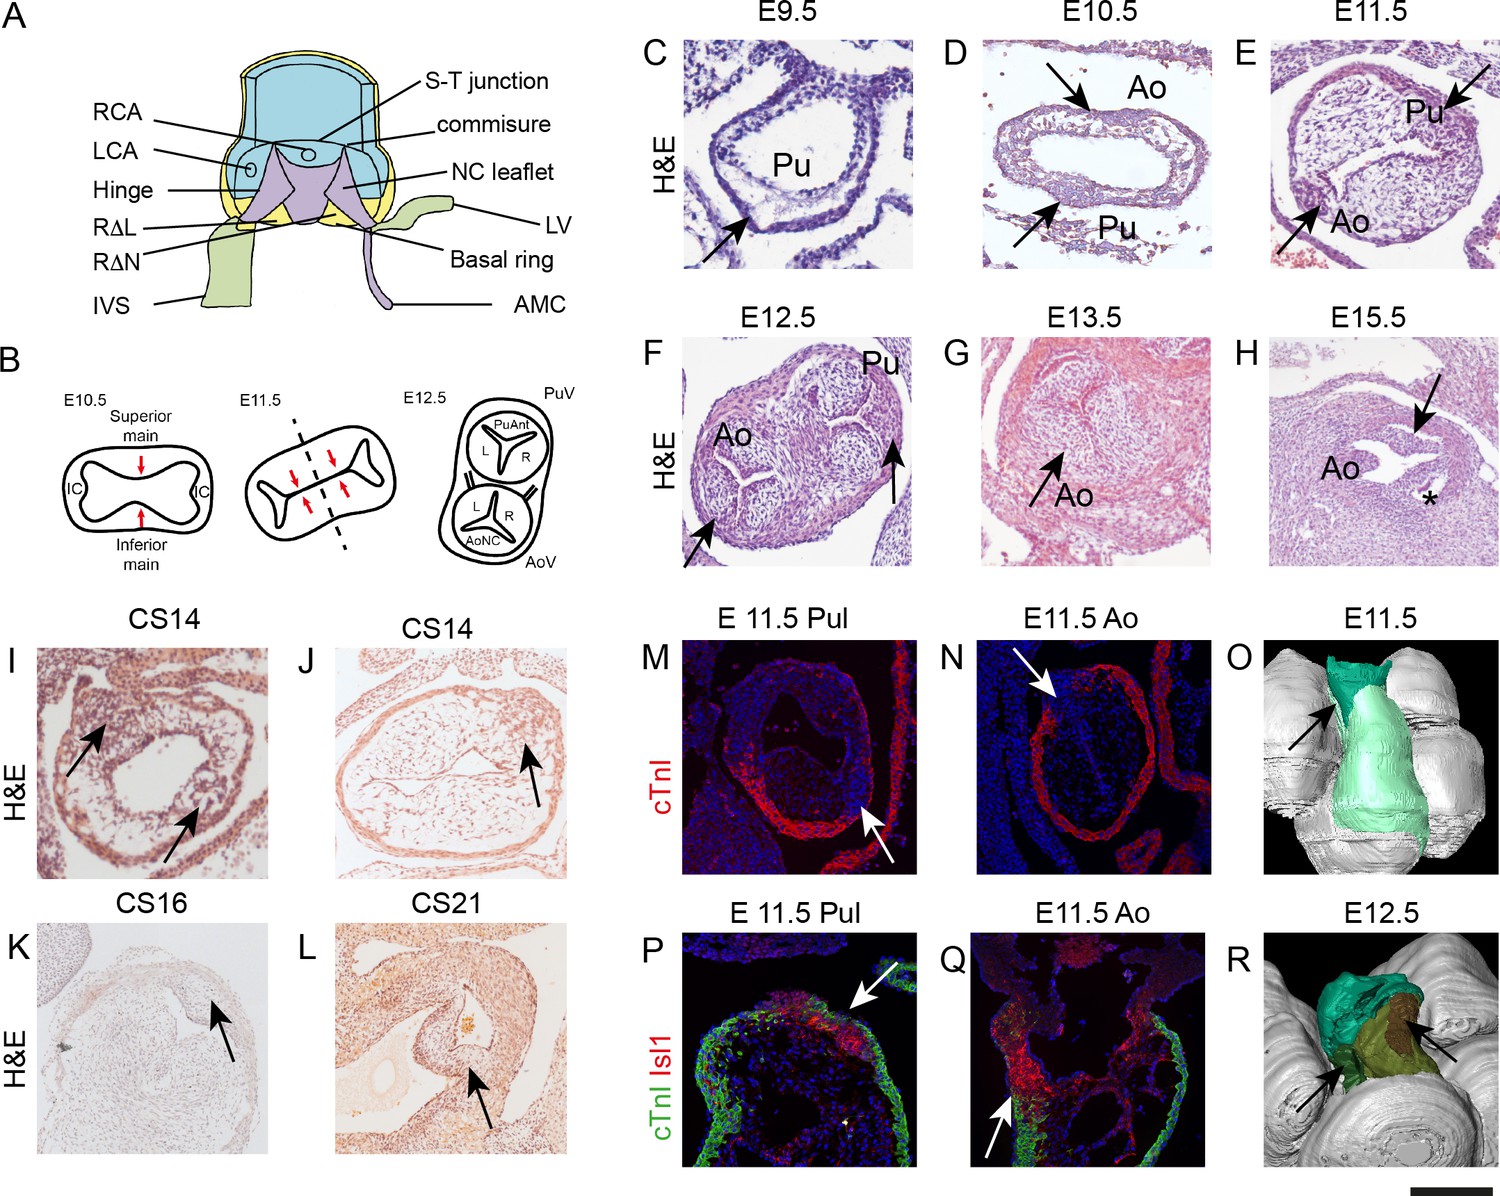
IC have a different morphology to the main outflow cushions during development.
All sections, except P,Q are taken in a frontal orientation. Arrows point to the IC or the IC-derived leaflet primordia, depending on stage. Images are typical examples from a minimum of n = 3 at each stage. (A) Diagram of the aortic root showing the semilunar attachment pattern of the arterial valve leaflets. The colours reflect the tissue composition of the root (green = myocardium, blue = smooth muscle cells, yellow = mural fibrous tissue, purple = valvular fibrous tissue). (B) Cartoon (based on [Kramer, 1942]) illustrating how fusion of the main outflow cushions together with growth of the IC produces the three arterial valve primordia. (C–H) At E9.5 (C), the outflow tract is a simple tube with an outer myocardium and inner endocardium, but with few cells in between. The arrow points to the region where the IC will appear, but there is no evidence of wall thickening at this stage. By E10.5 (D), cells are seen in the cardiac jelly and IC appear as bulges in the outflow wall (arrows). At E11.5 (E), the IC (arrows) have expanded but are significantly smaller than the main outflow cushions. The posterior valve primordia (arrows) are well developed and appear similar to the right and left valve primordia at E12.5-E13.5 (F,G), although the cells appear more densely packed. By E15.5 (H), the valve sinuses have formed and the leaflets are apparent. (I–L) IC are also apparent in stage matched (CS14-16) human embryos and have a similar morphology to those seen in mouse at CS21. (M–Q) The pulmonary IC (labelled red by Isl1 in P) is encased by a thin layer of cTnI-expressing (green) myocardium (arrows in M,P), whereas the aortic IC is not (N,Q). At E11.5, the IC are in continuity with Isl1-expressing cells in the pharyngeal region (red in P,Q). (O,R) At E11.5 (O), 3D reconstruction (modified from those first presented in [Anderson et al., 2012]) shows the non-myocardial component of the outflow (dark green) extends into the myocardial component (light green). The IC form within these extensions (arrows). At E12.5, the pulmonary IC (brown, see arrow) is found more distally than the aortic IC (green, see arrow). AMC – aortic mitral continuity; Ao – aorta; AV – aortic valve; IC – intercalated cushion; IVS – interventricular triangle; LCA – left coronary artery; LV – left ventricular myocardium; NC – non coronary; P or Pul – pulmonary trunk; PV – pulmonary valve; RCA – right coronary artery; RΔL – right-left interleaflet triangle; RΔN – right - non-coronary interleaflet triangle; S-T – sino-tubular. Scale bar: C-E,I-K,P,Q = 100 μm, F,G = 150 μm, H,L = 200 μm.
Figure 1—figure supplement 1
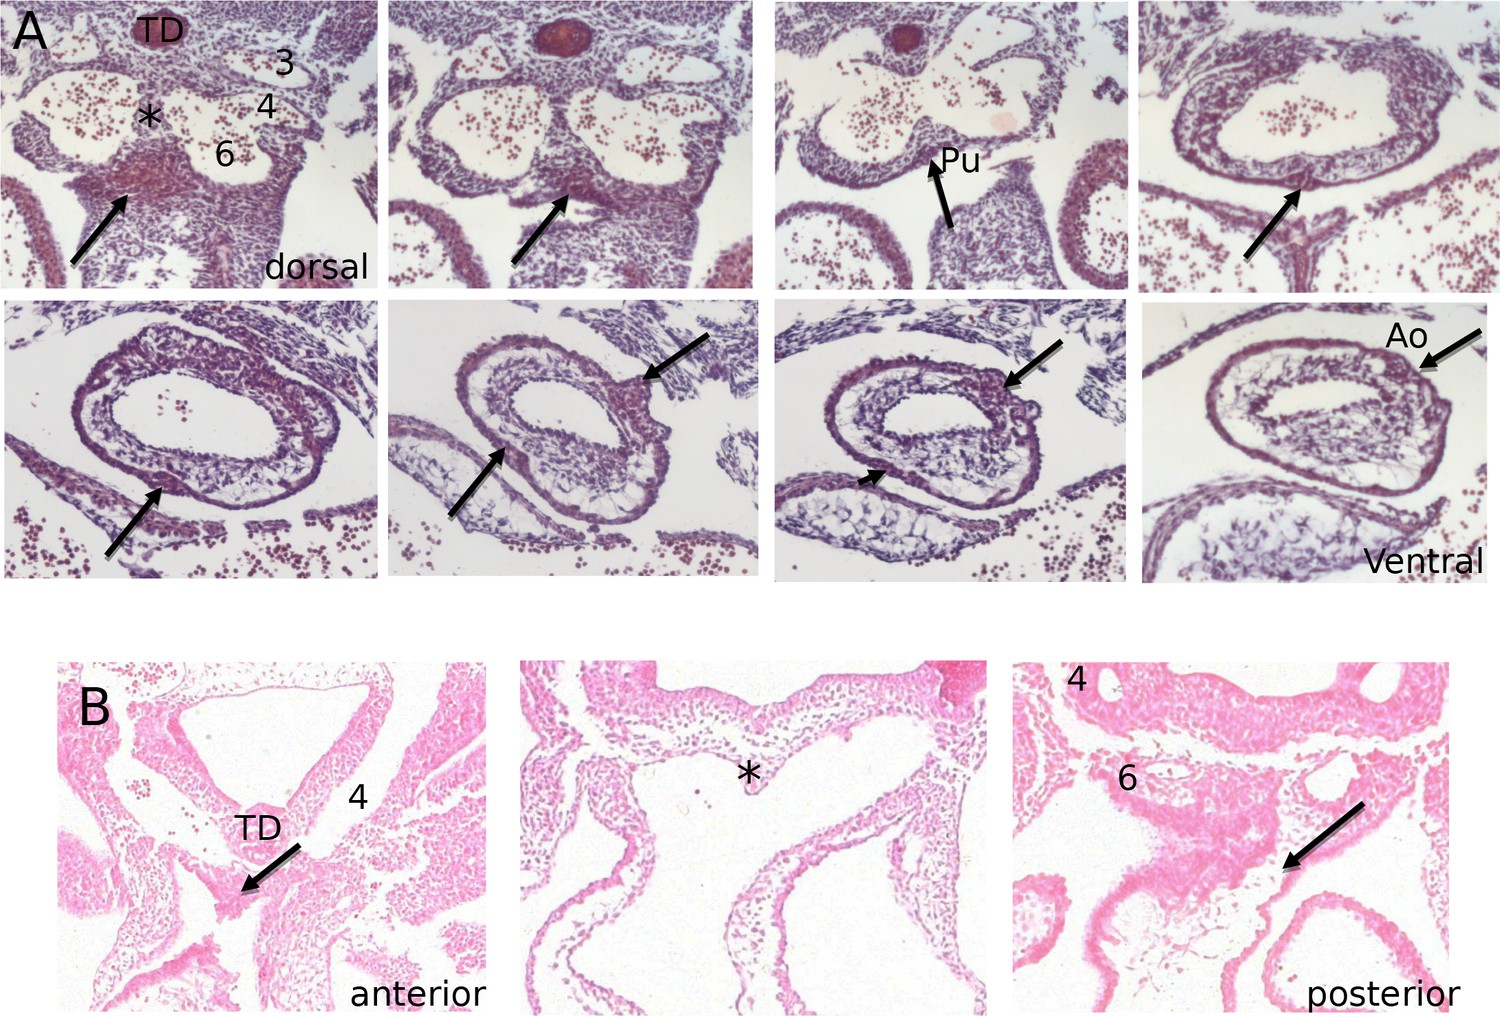
Histological appearance of the IC as they first form.
(A) Frontal serial sections through the pharyngeal arch arteries show the first appearances of the cellular condensations that form the aortic and pulmonary ICVS (arrows). The most dorsal and ventral images are indicated. (B) Transverse sections through the pharyngeal arches and distal outflow tract also show the first appearances of the ICVS (arrows). In this case the most anterior and posterior sections are labeled. For reference, in both sectional planes the thymus diverticulum (TD) and the wall that separates the left from right arch arteries (*) are indicated. 4/6 = 4th/6th pharyngeal arch artery, Ao = aortic ICVS, Pu = pulmonary ICVS.
Figure 2
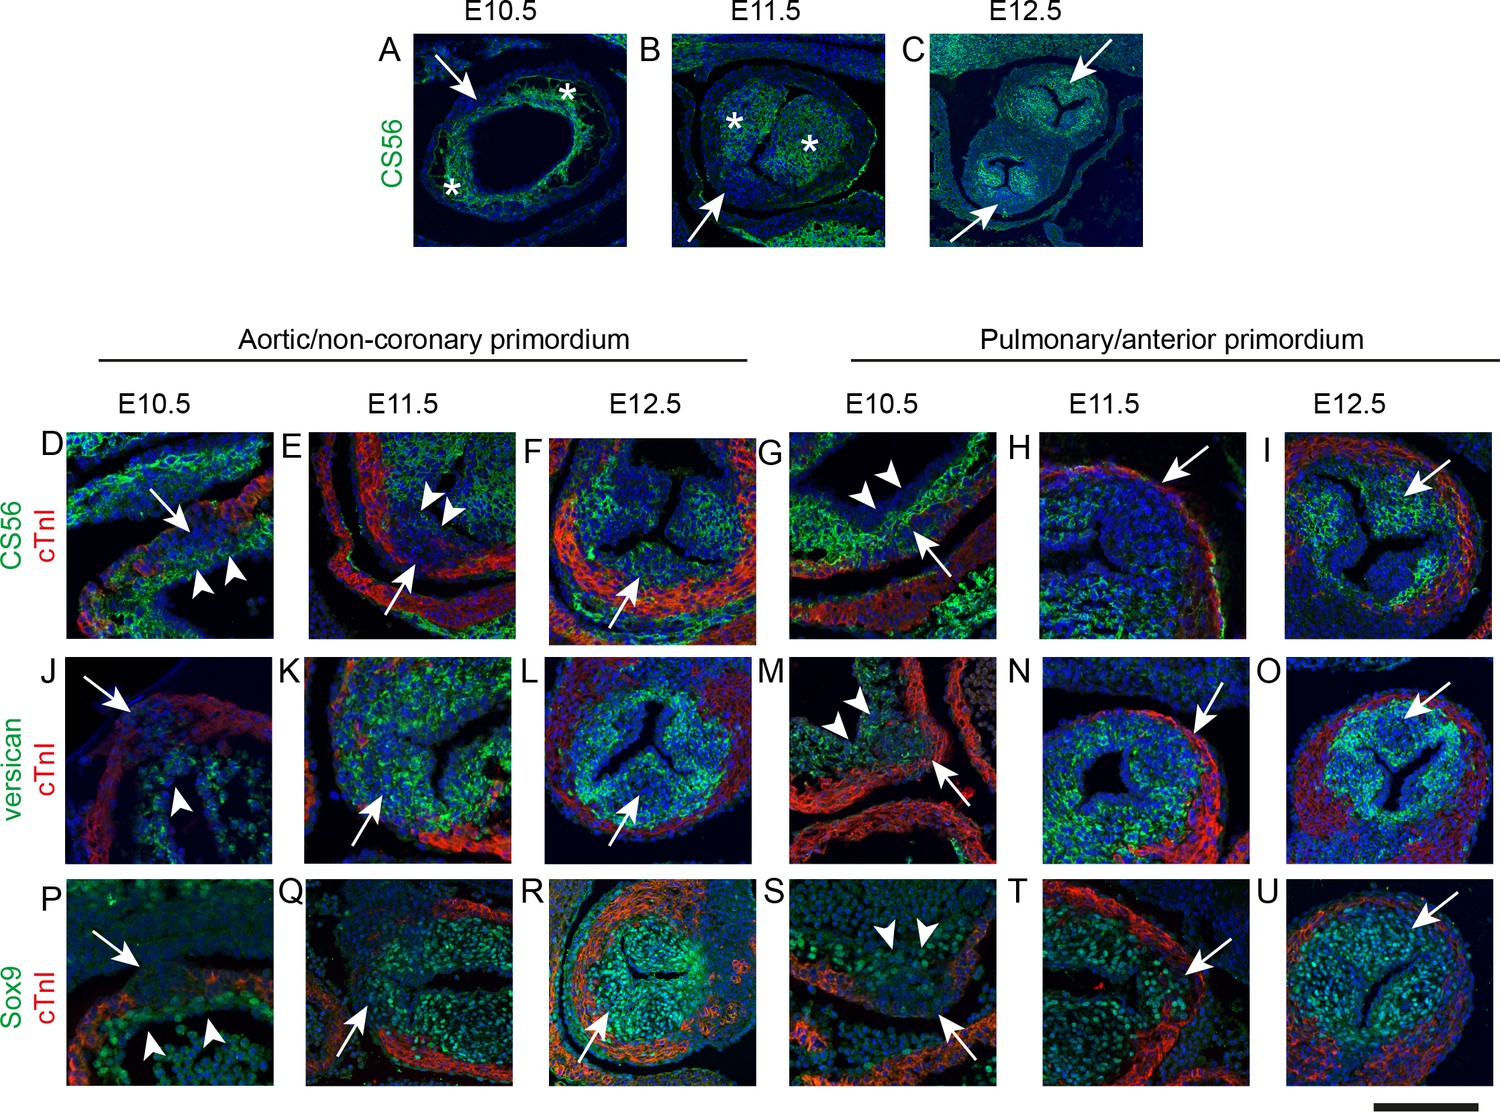
IC are molecularly distinct from the main outflow cushions.
In each case, arrows mark the IC. * mark the main outflow cushions. In D-U the myocardium is labelled with cTnI (green). Images are typical examples from a minimum of n = 3 at each stage. (A–C) The cardiac jelly of the main outflow cushions contain chondroitin sulphate molecules, recognised by the antibody CS56, from E10.5 to E12.5, whereas these are only abundant in the IC at E12.5. (D–I) Higher power of CS56 immunoreactivity shows that although the bulk of the IC stain with neither cTnI nor CS56 at E10.5-E11.5 (arrows), they are overlaid by a layer of CS56-expressing material (arrowheads in D,E,G) that is continuity with the main outflow cushions. By E12.5, the majority of the leaflet primordium is labelled by CS56. (J–O) Versican is expressed in the cardiac jelly of the main cushions at E10.5 and the adluminal region overlying the IC (arrowhead in J,M). Versican is not found in the bulk of the IC at E10.5, (J,M) but is expressed more broadly in the IC at E11.5 and E12.5. Notably, versican is missing from the centre part of both the aortic and pulmonary IC at E12.5 (arrows in L,O). (P–U) Sox9 labels only the layer overlying the IC at E10.5 (arrowheads in P,S) but is expressed throughout the ICVS by E11.5 and at E12.5. Scale bar: A = 90 μm, B,F,I,L,O,R,U = 120 μm, C = 250 μm, D,G,J,M,P,S = 50 μm, E,H,K,N,Q,T = 70 μm.
Figure 3 with 4 supplements
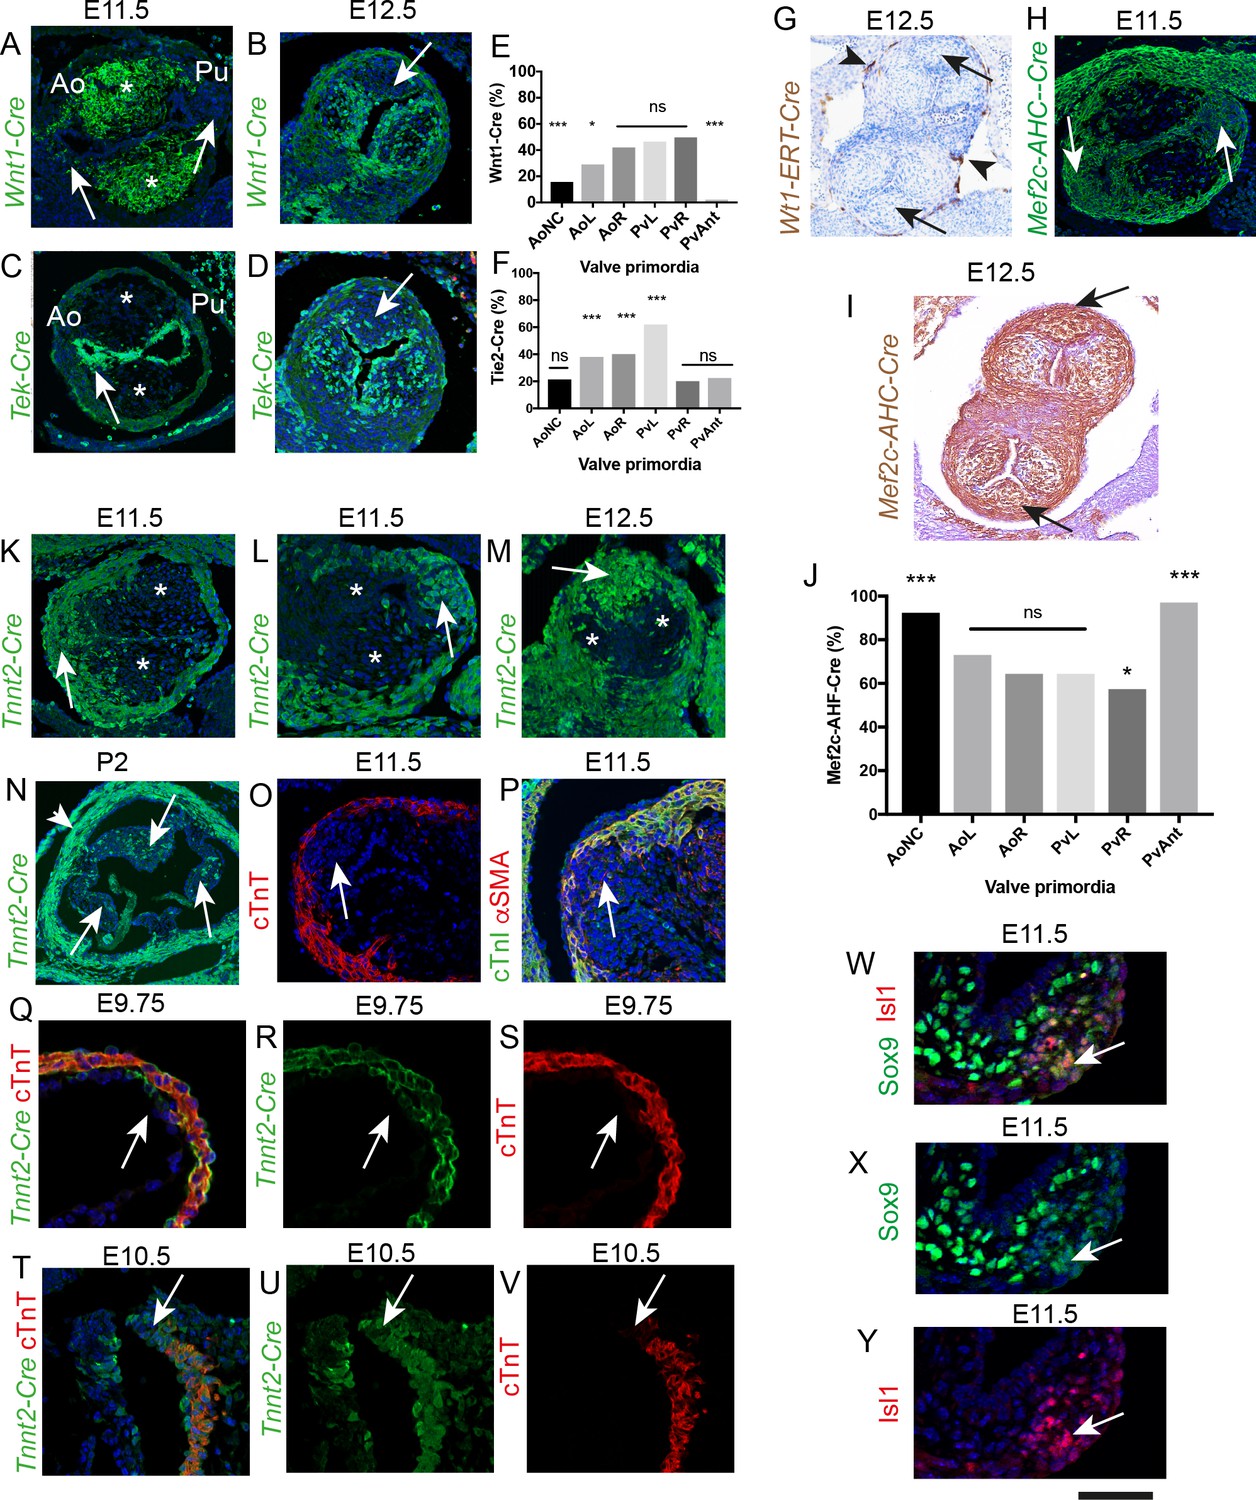
The ICVS are formed from undifferentiated SHF-derived cells that are labelled by TnnT2-Cre.
All sections are frontal unless otherwise stated. Arrows mark the ICVS. * mark the main outflow cushions. Images are typical examples from a minimum of n = 3 at each stage. (A–F) NCC labelled by Wnt1-Cre (A,B) make a significant contribution to the main outflow cushions and right and left valve primordia at E11.5 and E12.5, but make only a minor contribution to the ICVS and anterior leaflets (arrows). Tek-Cre labels cells in the endocardium (arrow in C), but few cells in either the main cushions or ICVS at E11.5 (C), although they are abundant in the left and right leaflets by E12.5 (D). Quantification of cells at E12.5 (E,F) confirms these observations and reveals that there are a number of cells in the leaflets, particularly the anterior and posterior derived from the ICVS, that are not labelled by NCC or EDC (data reanalysed from [Phillips et al., 2013]). (G–J) Wt1-ERT-Cre labels the epicardium (arrowheads in G) but not cells in the ICVS (arrows in G). The ICVS are labelled by Mef2c-AHF-Cre at E11.5 and E12.5 (H,I), as are the main cushions and the left and right leaflet primordia. Quantification of these cells (J) shows that the Mef2c-AHF-Cre-expressing population is the major contributor to the leaflet primordia. (K–N) Cells expressing Tnnt2-Cre label the cells in the ICVS at E11.5 (arrows in K,L) and the posterior valve leaflet primordia at E12.5 (M). A few labelled cells are also seen in the left and right primordia. (N) Tnnt2-Cre labels cells in all leaflets (arrows) of the aortic valve at P2, although it is more abundant in the posterior leaflet. Tnnt2-Cre also labels the walls of the aortic sinuses that are composed of SMC (arrowhead). (O,P) Antibodies specific for cardiac troponin-T (O), cTnI (green in P) and αSMA (red in P) label the outflow wall but not the ICVS at E11.5. (Q–V) At E9.5, a Tnnt2-Cre-positive, but cTnT-negative region (arrows in Q-S) is apparent in the distal outflow wall. A similar region can be seen in transverse sections at E10.5 (arrows in T-V). N.B. mTmG was used as the reporter line in Q-S so the GFP staining appears membrane associated in these sections. (W–Y) Some of the cells in the ICVS label co-express (yellow; arrows) Isl1 and Sox9 antibody at E11.5. Scale bar: A-D,H,K,L,M = 100 μm, G,I = 150 μm, N = 400 μm, O,p=60 μm, Q-V = 50 μm, W-Y = 40 μm.
-
Figure 3—source data 1
Raw data from lineage tracing for Wnt1-Cre+, Tek2-Cre+ and Mef2c-AHF-Cre+ cells in E12.5 valve leaflets.
- https://doi.org/10.7554/eLife.34110.010
Figure 3—figure supplement 1
Lineage of cells in the main outflow cushions.
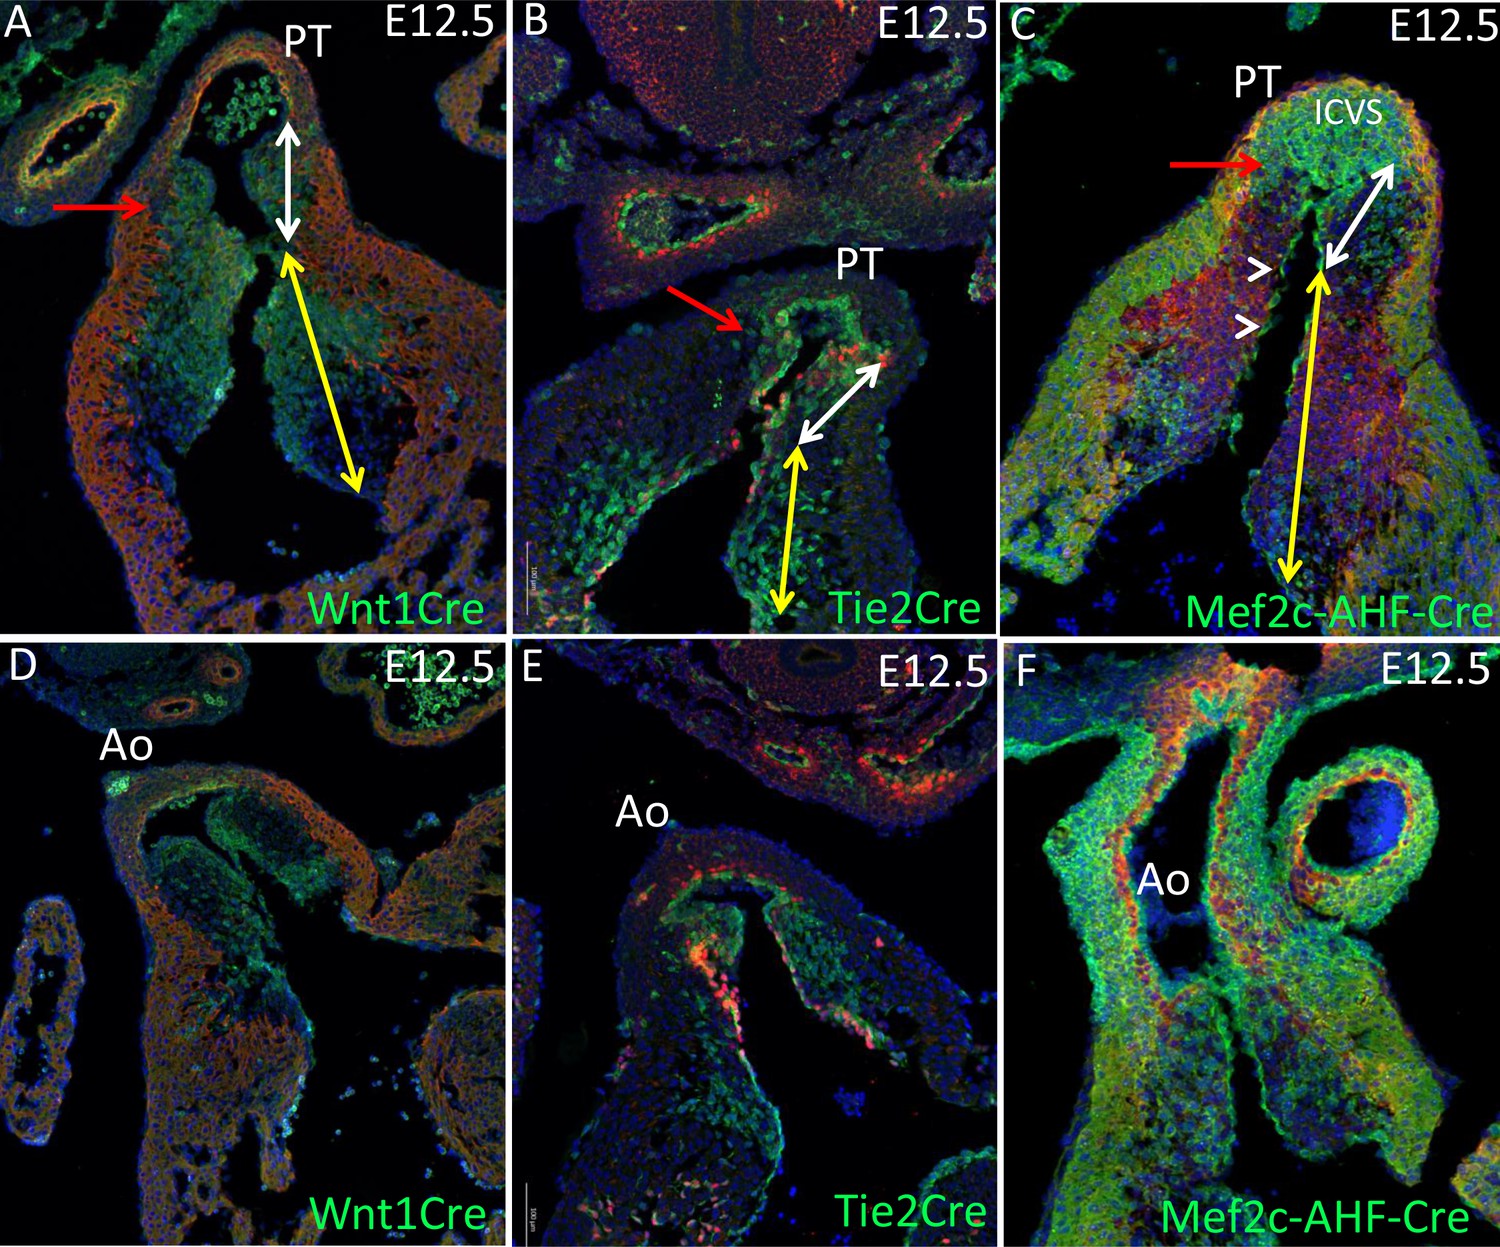
Transverse sectioning confirms the reciprocal distribution of Wnt1-Cre labelled NCC and Mef2c-AHF-Cre-expressing SHF-derived cells in the main outflow cushions at E12.5. The Tek-Cre labeling of the EDC is contained within the pattern of the Mef2c-AHF-Cre. Cre-driven expression is green in each case. The white double-headed arrows denote the part of the main cushions will form valve leaflets, whereas the yellow arrow denotes the part that will be muscularised to form septal structures. The red arrows denote a region of the main cushions that are not invested by either Wnt1-Cre-expressing NCC or Tek-Cre (Tie2-Cre) expressing EDC, but are filled with Mef2c-AHF-Cre expressing cells. The ICVS is also filled with Mef2c-AHF-Cre expressing cells. Arrowheads in C show Mef2c-AHF-Cre-labelled endocardium. In A,D,C,F the red staining is aSMA, whereas in B,E it is Notch1ICD. Ao – aorta; ICVS – intercalated valve swelling; PT – pulmonary trunk.
Figure 3—figure supplement 2
Confirmation of timing of Cre expression.
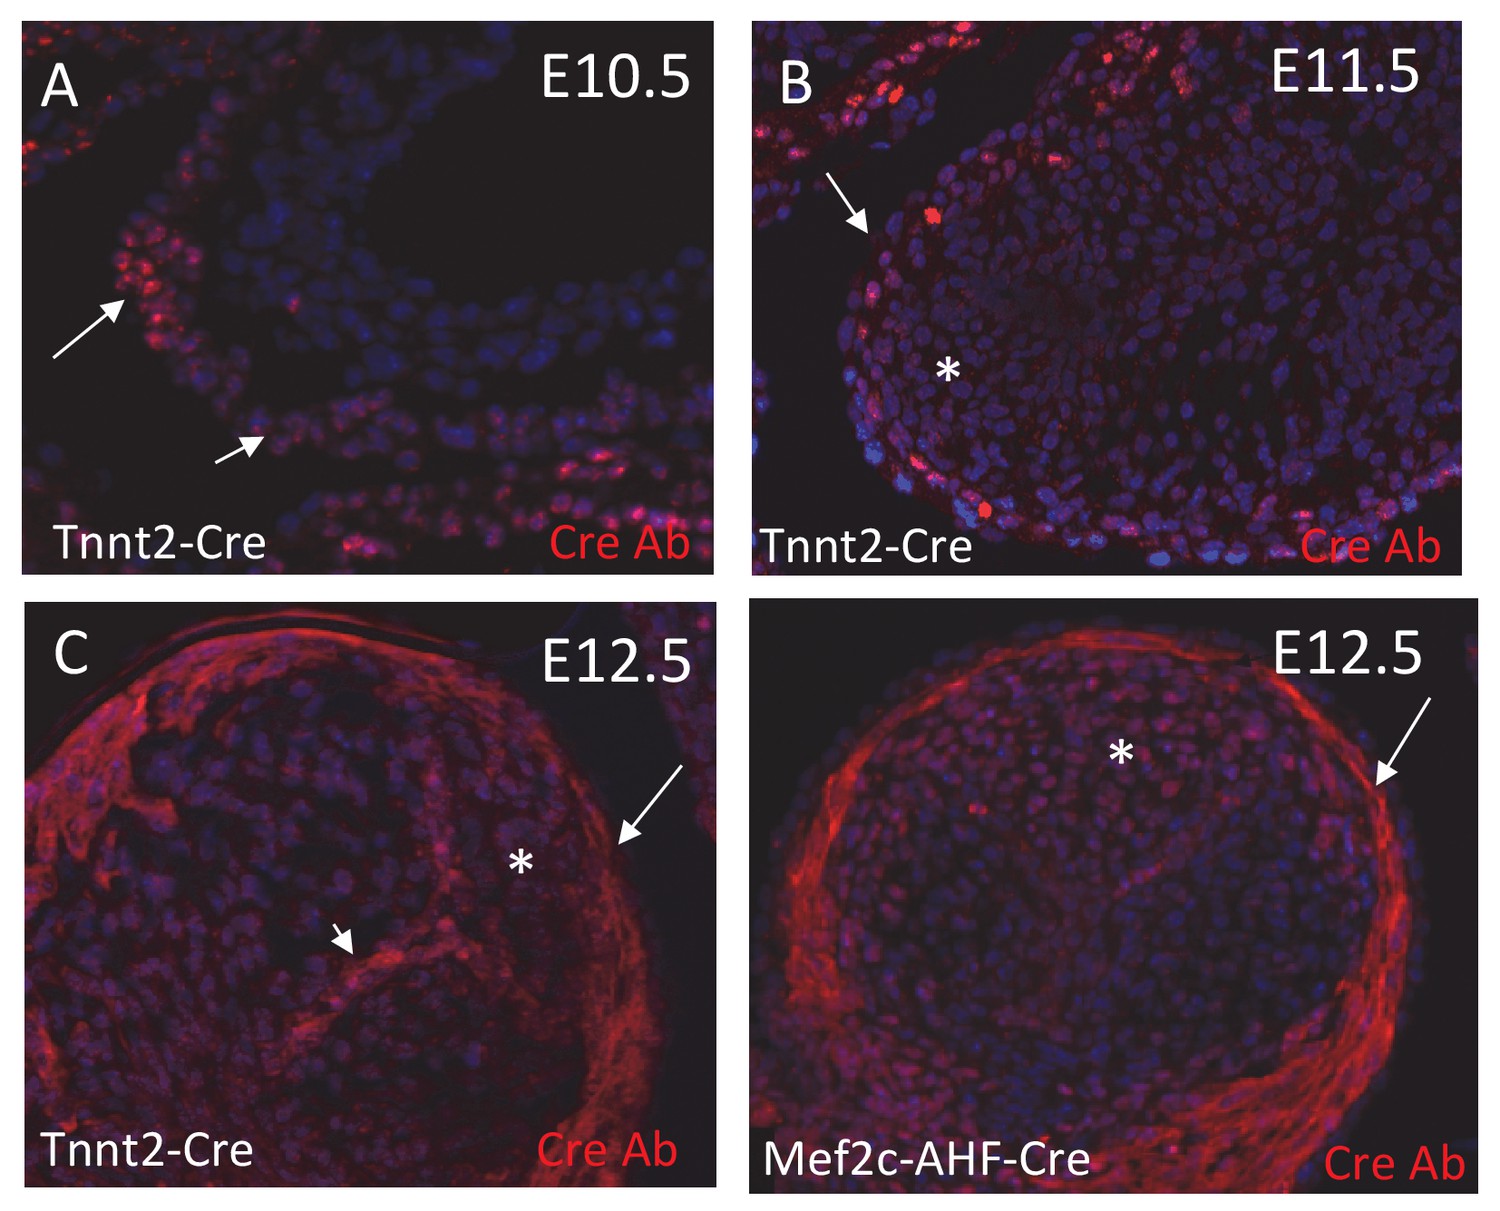
(A-D) Anti-Cre antibody shows that ICVS cells (arrowheads) in Tnnt2-Cre+ embryos no longer express Cre protein by E11.5, showing that the Tnnt2 promoter was down-regulated prior to this stage. Cre protein expression is maintained in the myocardium (arrow) throughout the time points examined. (L) Cre protein is expressed in the myocardium and in ICVS cells in Mef2c-AHF-Cre+ embryos at E12.5 showing that the Mef2c-AHF enhancer remains active up to at least E12.5.
Figure 3—figure supplement 3
Tnnt2-Creexpression in SMC.
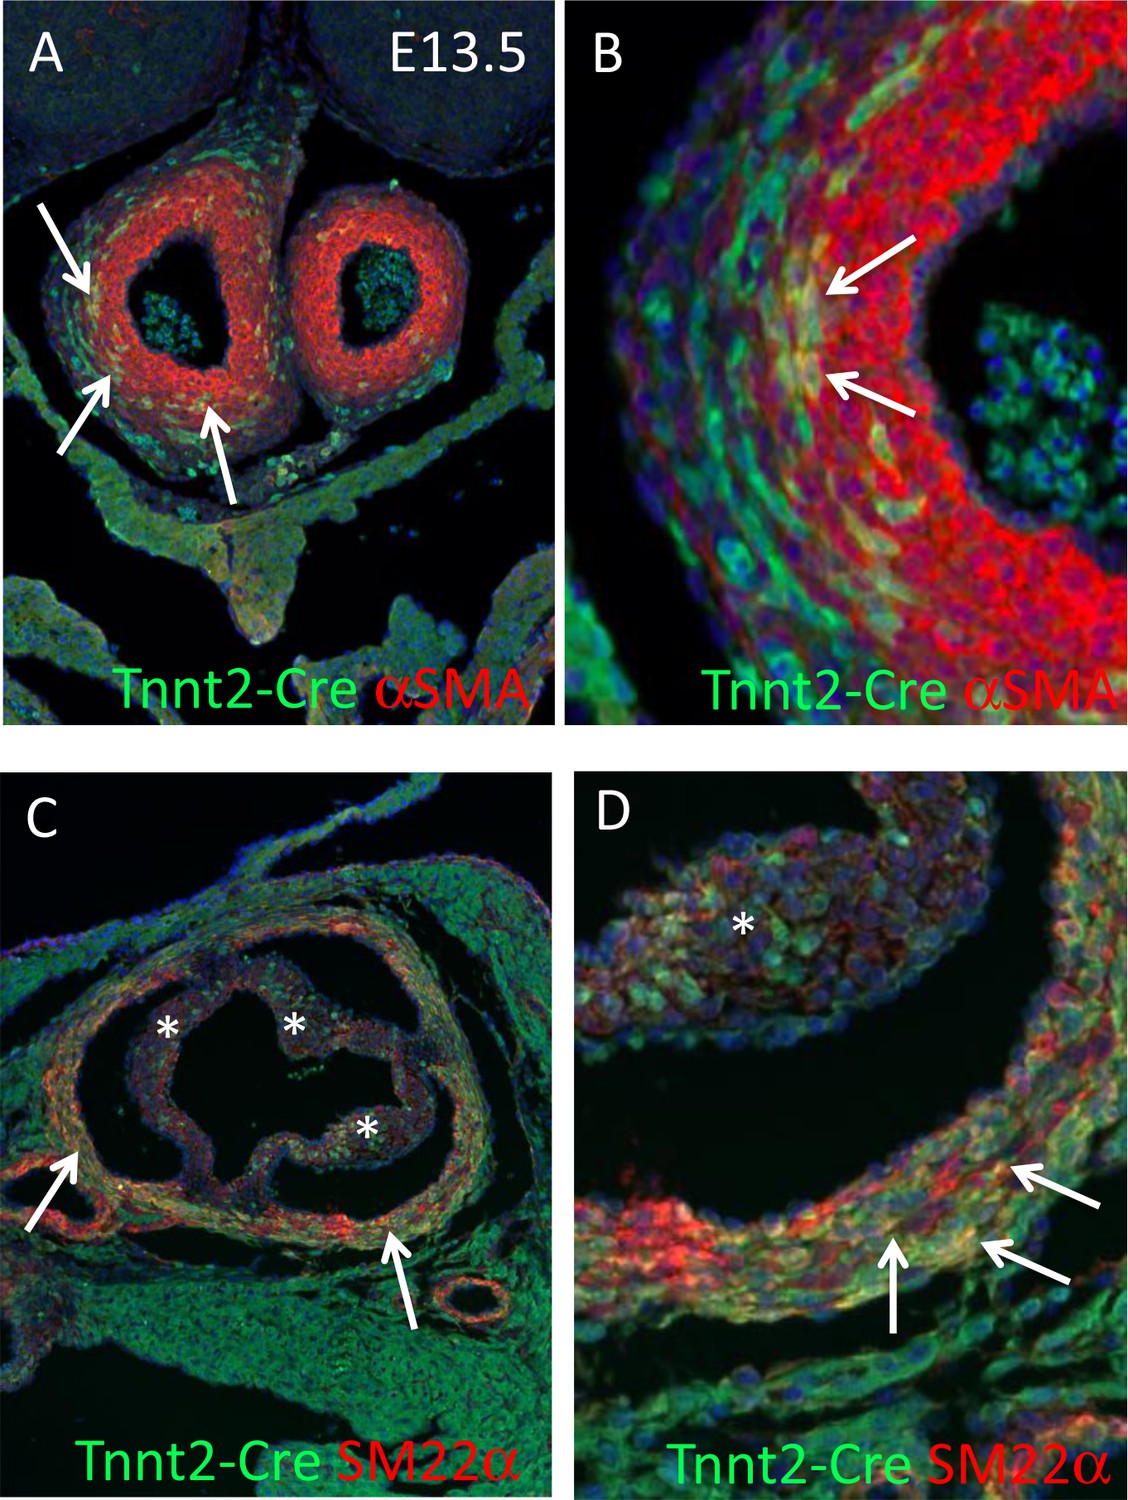
(A, B) Tnnt2-Cre is expressed by differentiating SMC in the developing arterial trunks at E13.5 (arrows in A). High power images confirm the presence of yellow co-expressing cells (arrows). (C,D) Tnnt2-Cre is found in SMC of the aortic media at P2 (arrows in C). High power images confirm the presence of yellow co-expressing cells (arrows). Tnnt2-Cre+ cells are also found in all three valve leaflets (*) at P2 but these do not-co-express αSMA.
Figure 3—figure supplement 4
Persistance of Isl1 expression in ICVS.
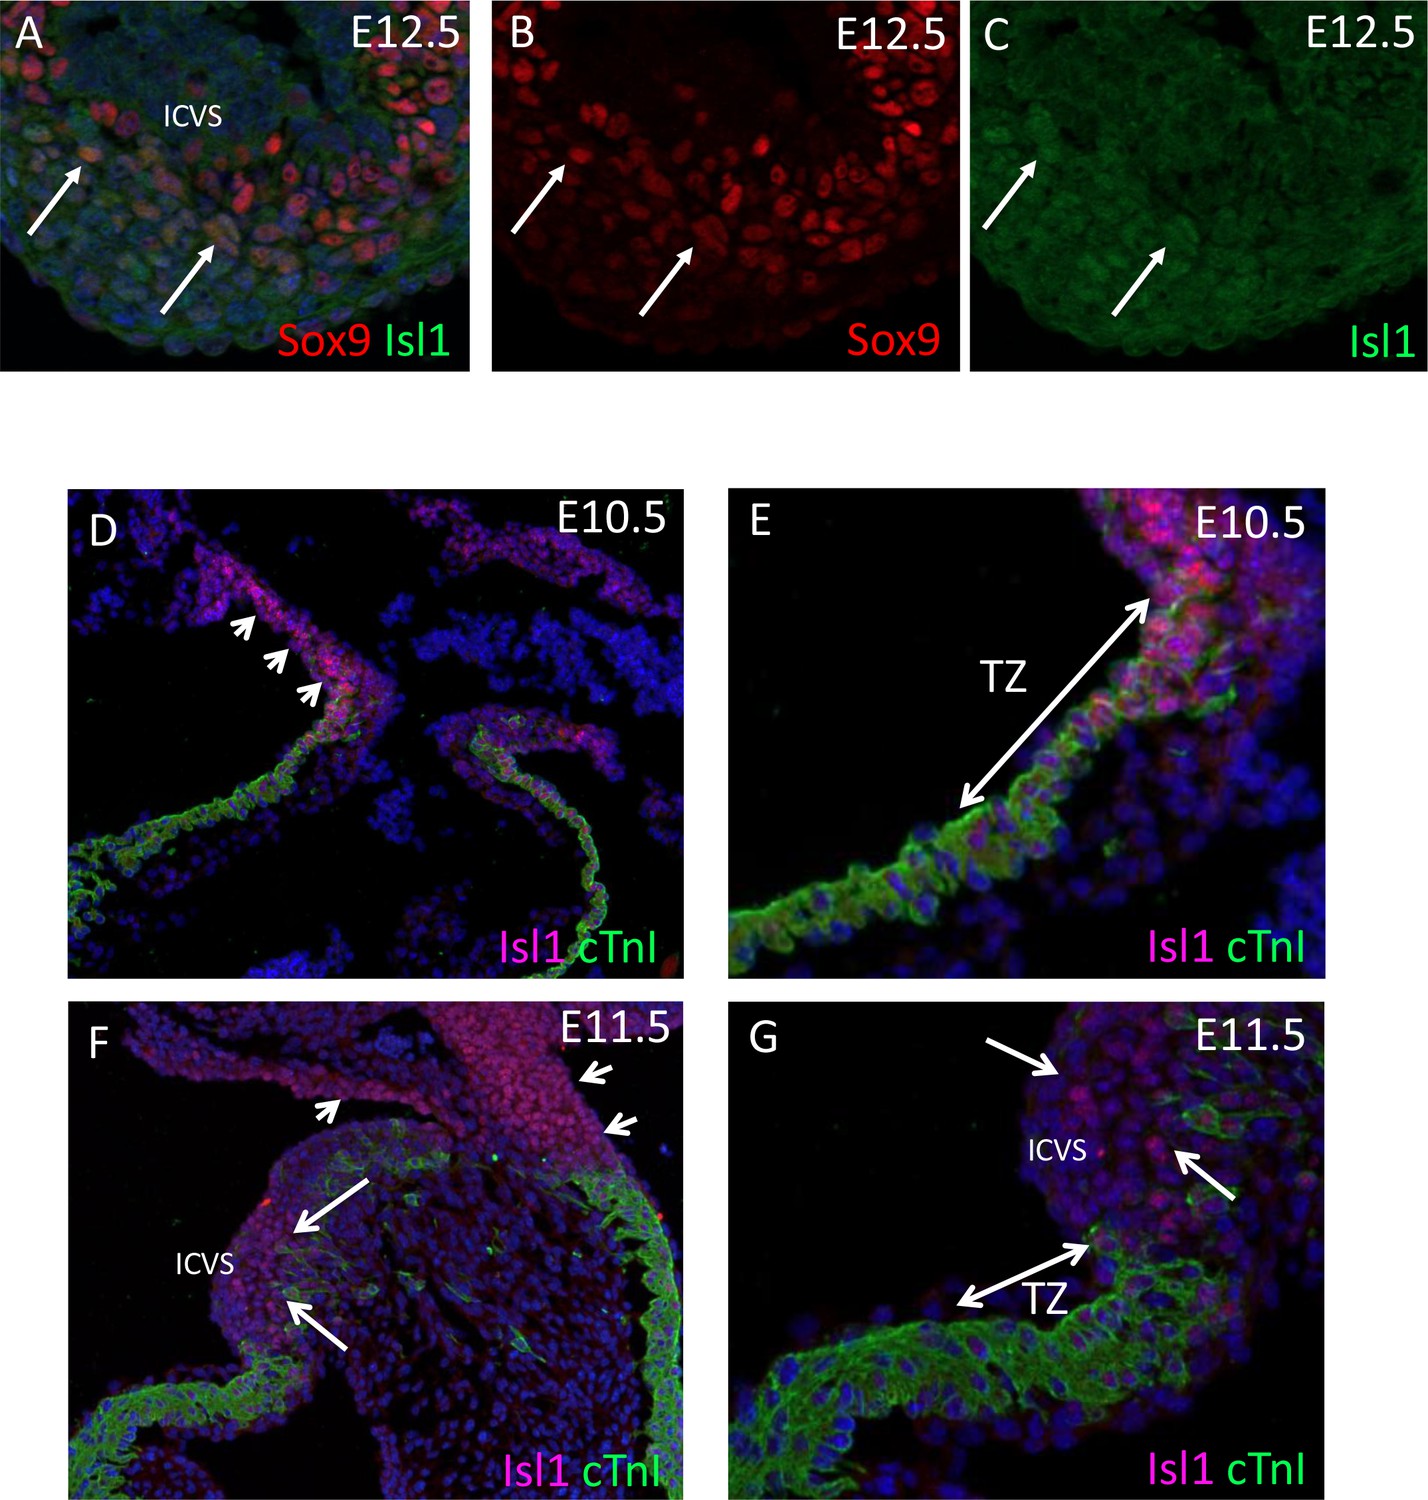
(A-C) There is only low-level expression of Isl1 in the ICVS at E12.5, although Sox9 is more widespread. A few cells (arrows) co-express both markers. (D–G) The transition zone (TZ) where cells co-express SHF progenitor (Isl1) and differentiated cardiomyocyte (cTnI) markers is seen at E10.5. By E11.5, a few cells still co-express these markers and the ICVS can be seen immediately distal to the TZ. At both stages, the myocardial outflow tract is in continuity with Isl1 expressing cells found more distally. ICVS = intercalated valve swelling.
Figure 4 with 1 supplement

The ICVS transition from epithelium to mesenchyme, but not by a typical process of EMT.
Unless otherwise stated, the aortic IC is shown. Arrows point to the ICVS or posterior valve primordium in each case. * mark the main outflow cushions. Images are typical examples from a minimum of n = 3 at each stage. (A–C) The ICVS express E-cadherin (green) at E10.5 (A,B), as does the surrounding myocardial outflow wall (labelled red by cTnI), although the main cushions do not. (D–I) E-cadherin is downregulated in the ICVS at E11.5 (D,E), and is no-longer expressed by E12.5 (G,H). (J–L) β-catenin is expressed in the ICVS and the surrounding wall at E11.5 (J), but neither N-cadherin nor Fsp1 (K,L) are found in the ICVS at this stage. (M–O) Collagen-I is transiently up-regulated specifically in the ICVS but not the main cushions at E11.5, but resembles the main leaflet primordia with little if any expression at E10.5 and E12.5. (P–R) Laminin is also transiently expressed in the ICVS at E10.5, but is downregulated and lost from the valve primordia by E12.5. (S–V) Neither Slug nor Snail are expressed in the ICVS (arrows in S,U,V) at E10.5–11.5, although they are both abundant in the main cushions (* in T,U,V). Scale bar: A-I,M,N,p=60 μm, J-L,O,Q-V = 100 μm.
Figure 4—figure supplement 1

ICVS do not express classical mesenchymal markers as they form.
(A-C) Elastin is specifically localised to the developing ICVS but not to the main septal outflow cushions at E10.5-E12.5. (D–F) transverse sections show that Slug and Snail transcripts (purple) are found in the main outflow cushions at E10.5 and E11.5.
Figure 5 with 2 supplements
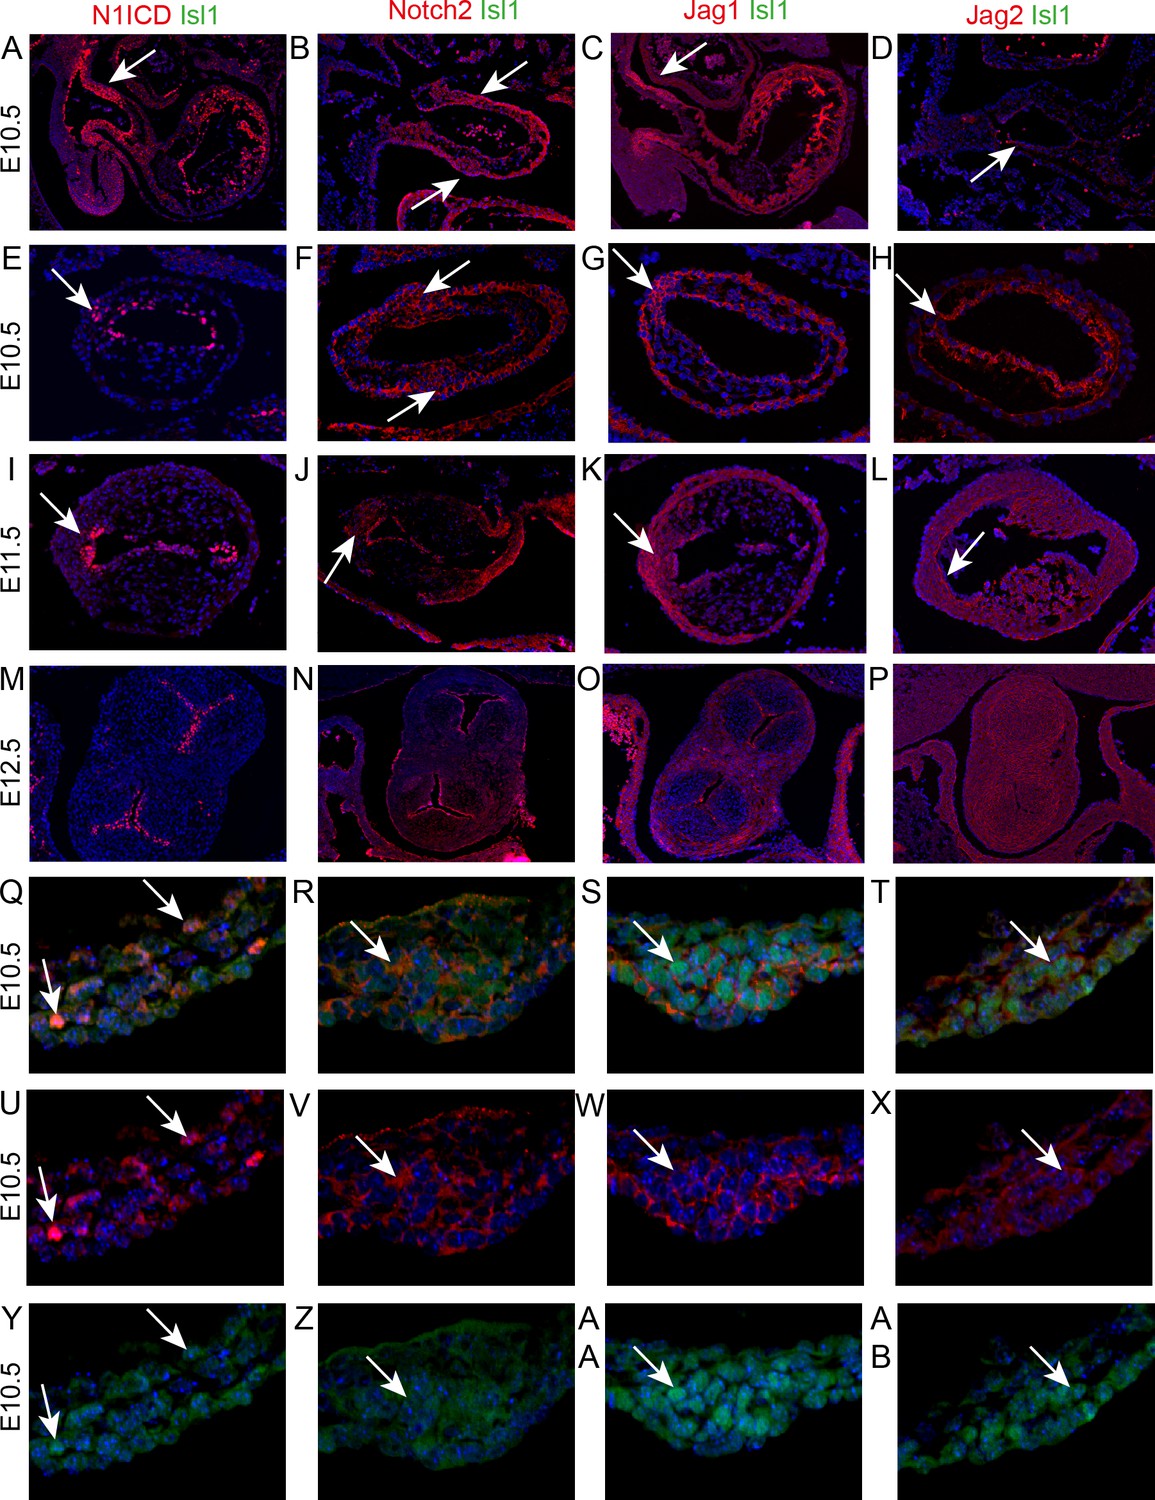
Notch signalling is found in the developing ICVS.
All sections are frontal unless otherwise stated. Images are typical examples from a minimum of n = 3 at each stage. In E-AB, arrows point to the ICVS. (A–D) Sagittal sections show that Notch1ICD, Notch2 and Jag1 are abundant in the distal outflow wall (arrows) at E10.5. Jag2 is only found in the endothelium (arrow in D). (E–L) Notch1ICD, Notch2, Jag1 and Jag2 are found in the endocardium overlying the main cushions, but not within the cushions themselves at E10.5–11.5. All four localise to the ICVS at E10.5, with Notch1ICD, Notch2 and Jag1 maintained at E11.5. (M–P) Notch1ICD, Notch2 and Jag1 are found in the valve endothelium at E12.5, but none of these, nor Jag2, is found in the valve interstitial cells G-AB) Isl1 and Notch1ICD co-localise in the nuclei of only a few cells within the ICVS at E10.5, although Notch2, Jag1 and Jag2 are found in the membrane of Isl1 +nuclei containing cells in the core of the ICVS at this stage. Scale bar: A-D = 360 μm, E-H = 120 μm, I-L = 150 μm, M-P = 225 μm, Q-AB = 75 μm.
Figure 5—figure supplement 1
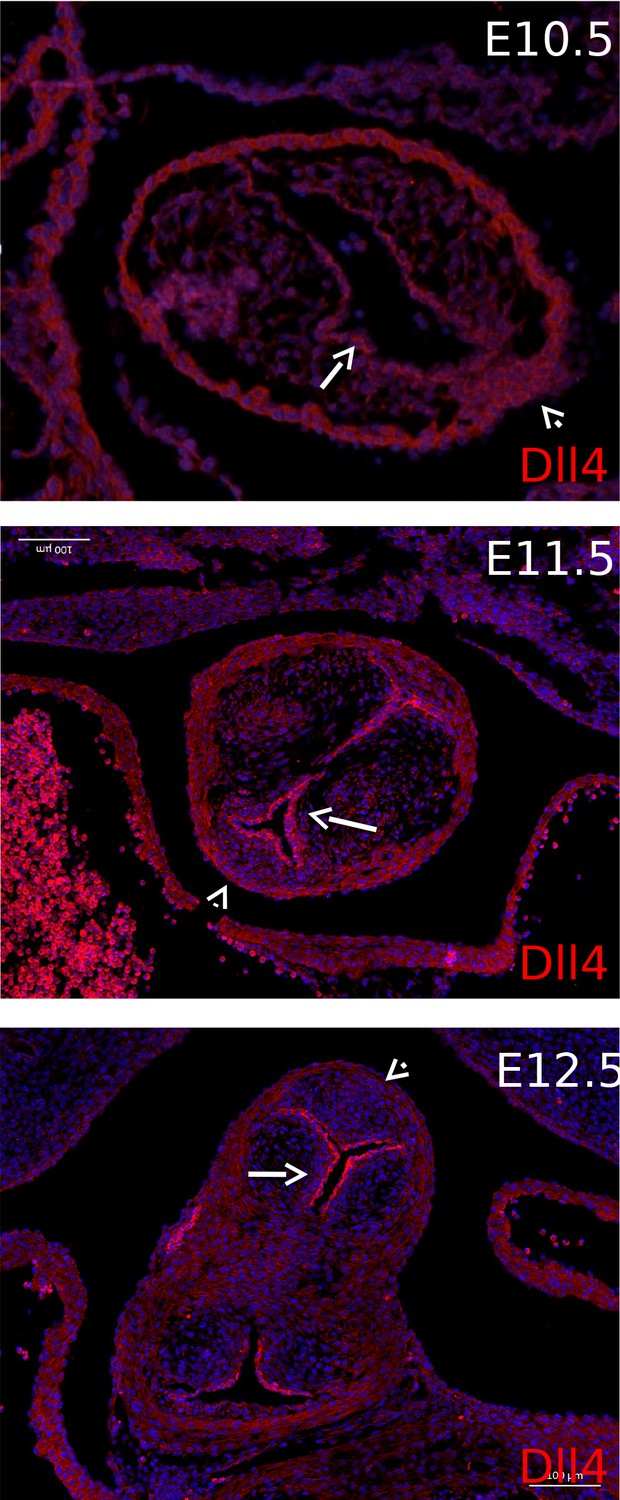
Dll4 immuno-reactivity is found in the endocardium from E10.5-E12.5 (arrows).
There is no positive staining in the developing ICVS (arrowheads). N.B. Due to the high levels of autofluorescence seen in the myocardium, there was background staining in this tissue at all stages that was not possible to remove. However, at all stages, staining in the ICVS was the same or less than that seen in the myocardium.
Figure 5—figure supplement 2
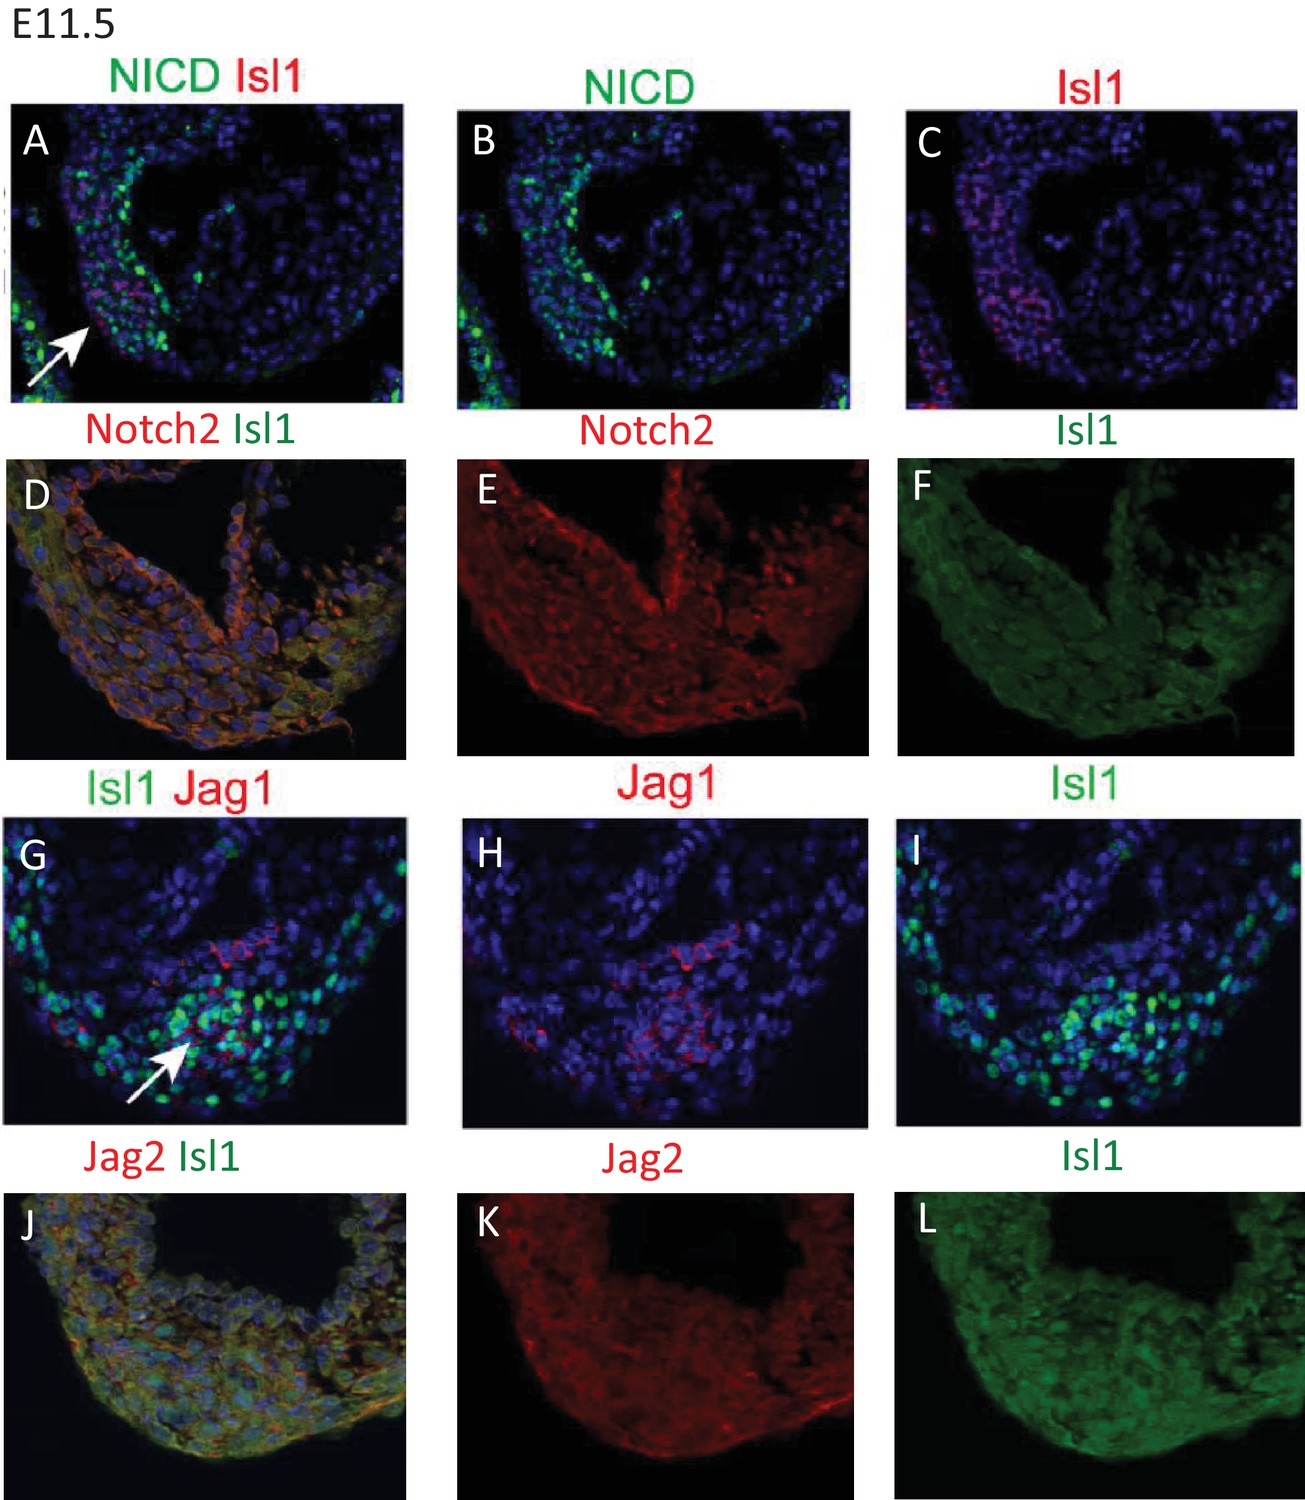
Notch1ICD (A–C) is expressed in the nucleus of cells in the ICVS, but is not generally co-expressed with Isl1 at E11.5.
Notch2 (D–F), and Jag2 (J–L) are found at the cell membrane in the ICVS but only at low level. In contrast, Jag1, although also in the cell membrane, is found in the cells that also express Isl1 at E11.5.
Figure 6
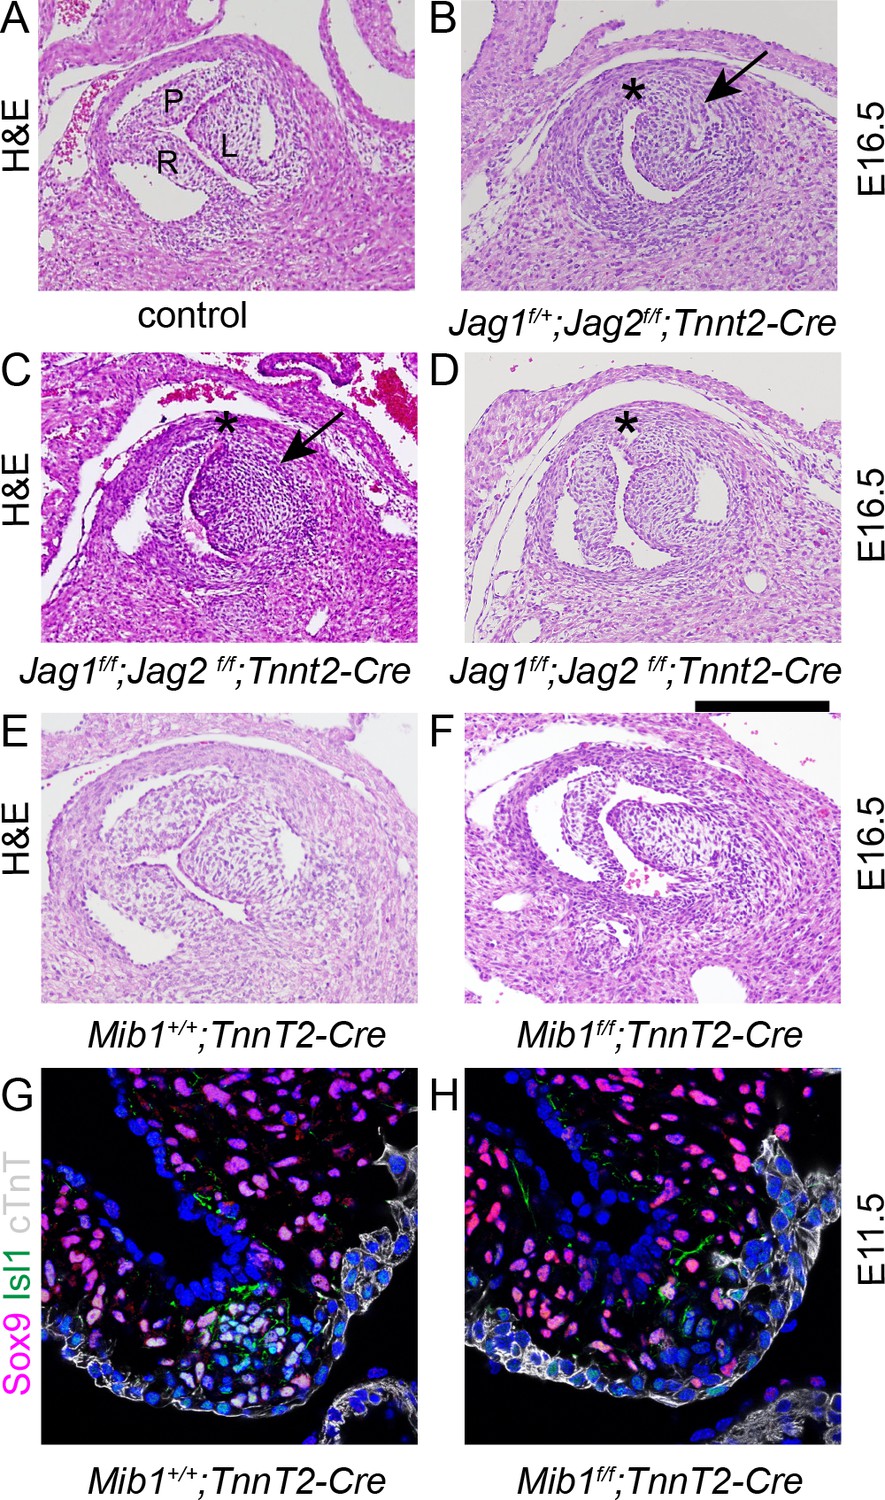
Disruption of Notch signalling results in abnormalities of the posterior (non-coronary) leaflet.
Transverse H and E-stained sections of E16.5 embryos from Jag1f;Jag2f;Tnnt2-Cre litters. Images are typical examples. (A–D) Whereas the control embryo has three thinned leaflets in its aortic valve (A), the Jag1f/+;Jag2f/f;Tnnt2-Cre and Jag1f/f;Jag2f/f;Tnnt2-Cre embryo (B,C) have only two thickened leaflets with no leaflet in the posterior position (*). In the Jag1f/f;Jag2f/f;Tnnt2-Cre embryo (D) a rudimentary posterior leaflet can be seen. The arrows point to the thickened left leaflet. (E,F) The Mib1f/f;Tnnt2-Cre embryo also has a hypoplastic posterior leaflet and dysplasia of the other valve leaflets. (G,H) Examination of the forming ICVS at E11.5 shows a reduction in the number of Sox9+/Isl1 +cells in the Mib1f/f;Tnnt2-Cre embryo compared to its control littermate. Images are typical examples from a minimum of n = 3 at each stage. A - anterior, L – left, R – right. Scale bar: A-F = 200 μm, G,H = 60 μm.
Figure 7 with 2 supplements
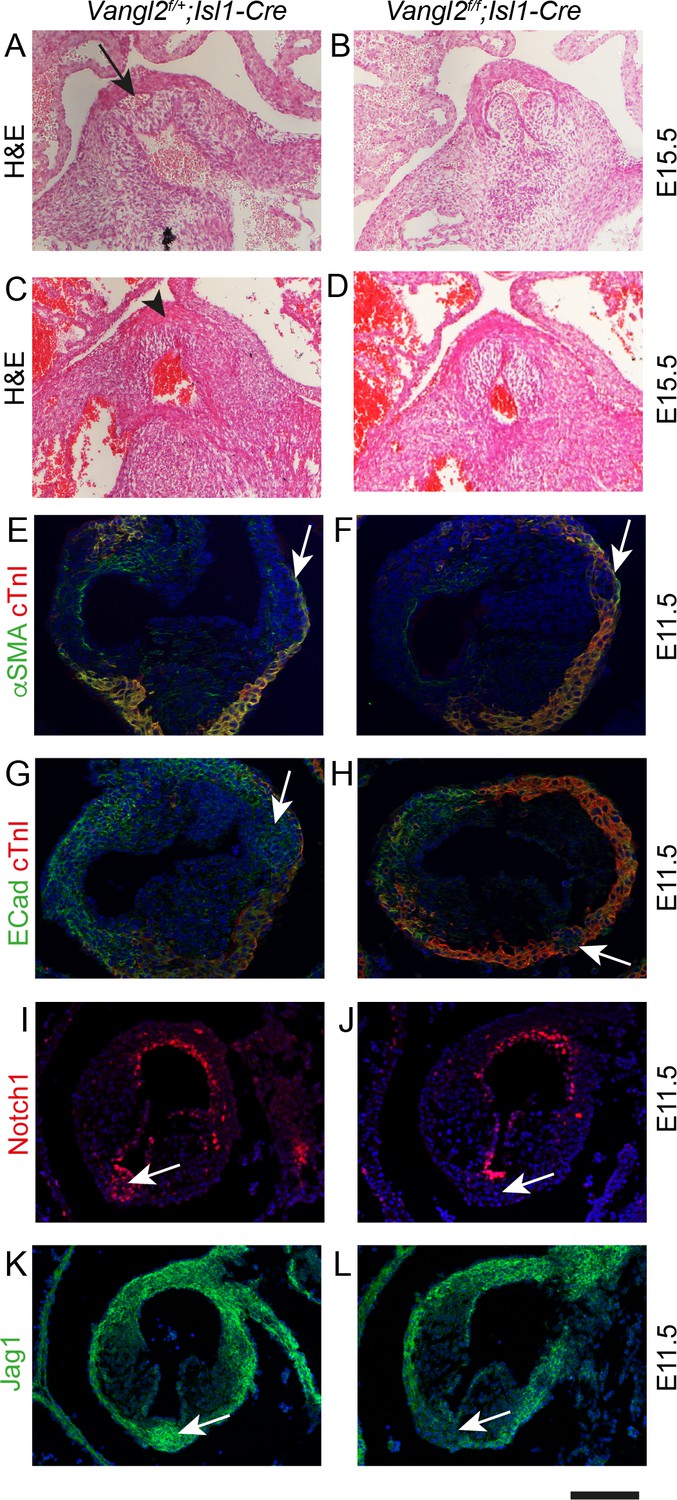
Failure to form the aortic posterior (non-coronary) leaflet in Vangl2f/f;Isl1Cre embryos.
Images are typical examples of a minimum of n = 3. (A–D) Whereas the posterior leaflet (arrow in A) can clearly be seen in the control embryo at E15.5, this is missing in the Vangl2f/f;Isl1-Cre embryos (arrowhead in C). (E–H) Hypoplastic and malpositioned ICVS (arrows) can be seen in Vangl2f/f;Isl1-Cre embryos at E11.5. Expression of outflow markers appears otherwise normal. (I–L) Notch1ICD and Jag1 expression levels are reduced in the ICVS of some Vangl2f/f;Isl1-Cre embryos compared to control littermates at E11.5 (arrows), although there is normal expression elsewhere in the outflow walls. Scale bar: A-D = 120 μm, E-H = 100 μm, I-L = 120 μm.
Figure 7—figure supplement 1

ICVS formation in Vangl2;Isl1-Cre mutants.
(A–D) Three sinuses can be seen in control aortic roots at E15.5, reflecting three valve leaflets. In contrast, only two sinuses and leaflets are seen in the Vangl2f/f;Isl1-Cre. (D–I) although there are some differences in overall morphology, Versican, N1ICD and E-cadherin are all expressed normally in the Vangl2f/f;Isl1-Cre ICVS (arrows) at E11.5, when compared with control littermates. However, cTnI is found in the mutant ICVS in F (arrow).
Figure 7—figure supplement 2
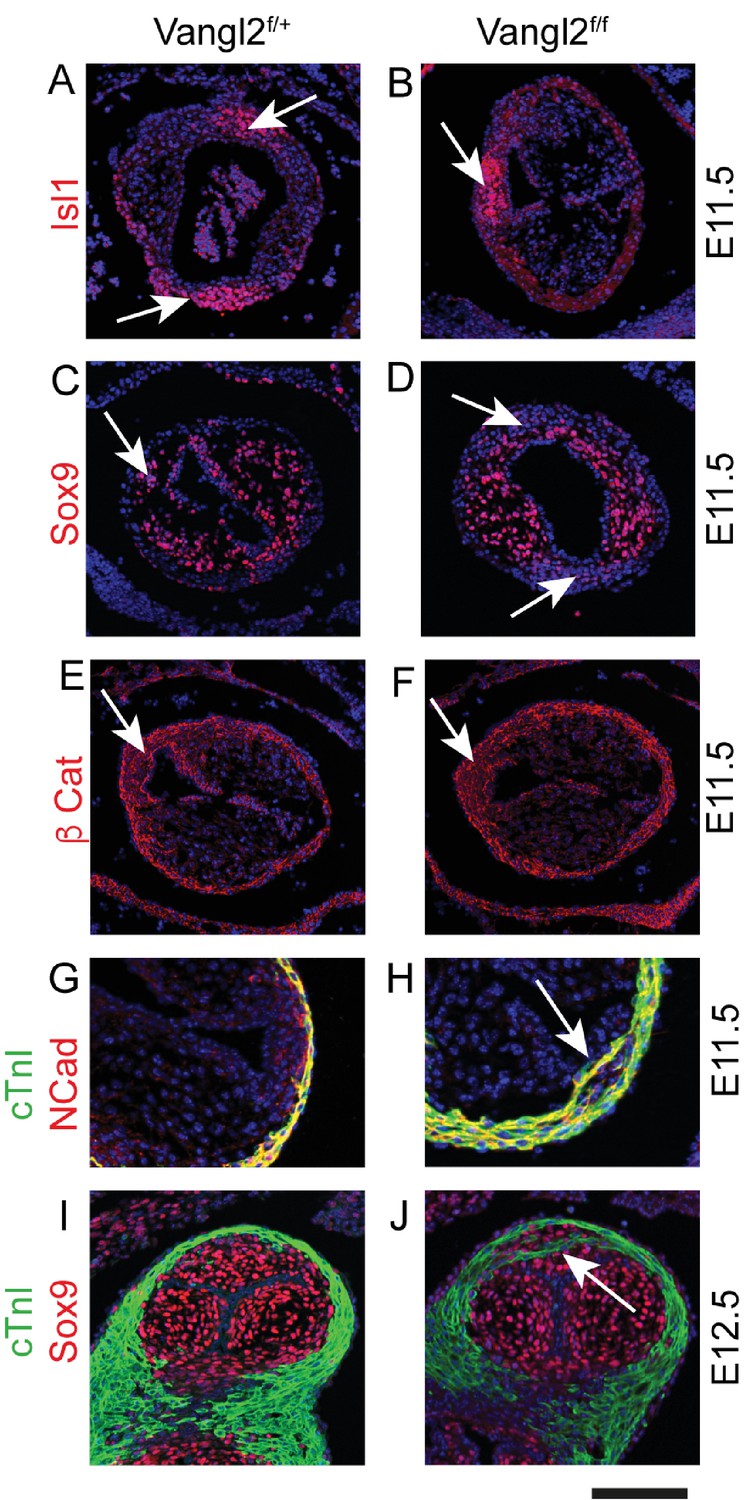
Marker expression in Vangl2;Isl1-Cre mutant ICVS.
(A-F) Isl1, Sox9 and β-cat are all expressed apparently normally in ICVS (arrows) of Vangl2f/f;Isl1-Cre embryos at E11.5, although they are misplaced. (G–J) The ICVS is distinct from the cTnI-labelled myocardium in control embryos at E11.5 and E12.5, whereas cardiomyocytes are found within the ICVS (arrows) in the Vangl2f/f;Isl1-Cre embryos.
Figure 8
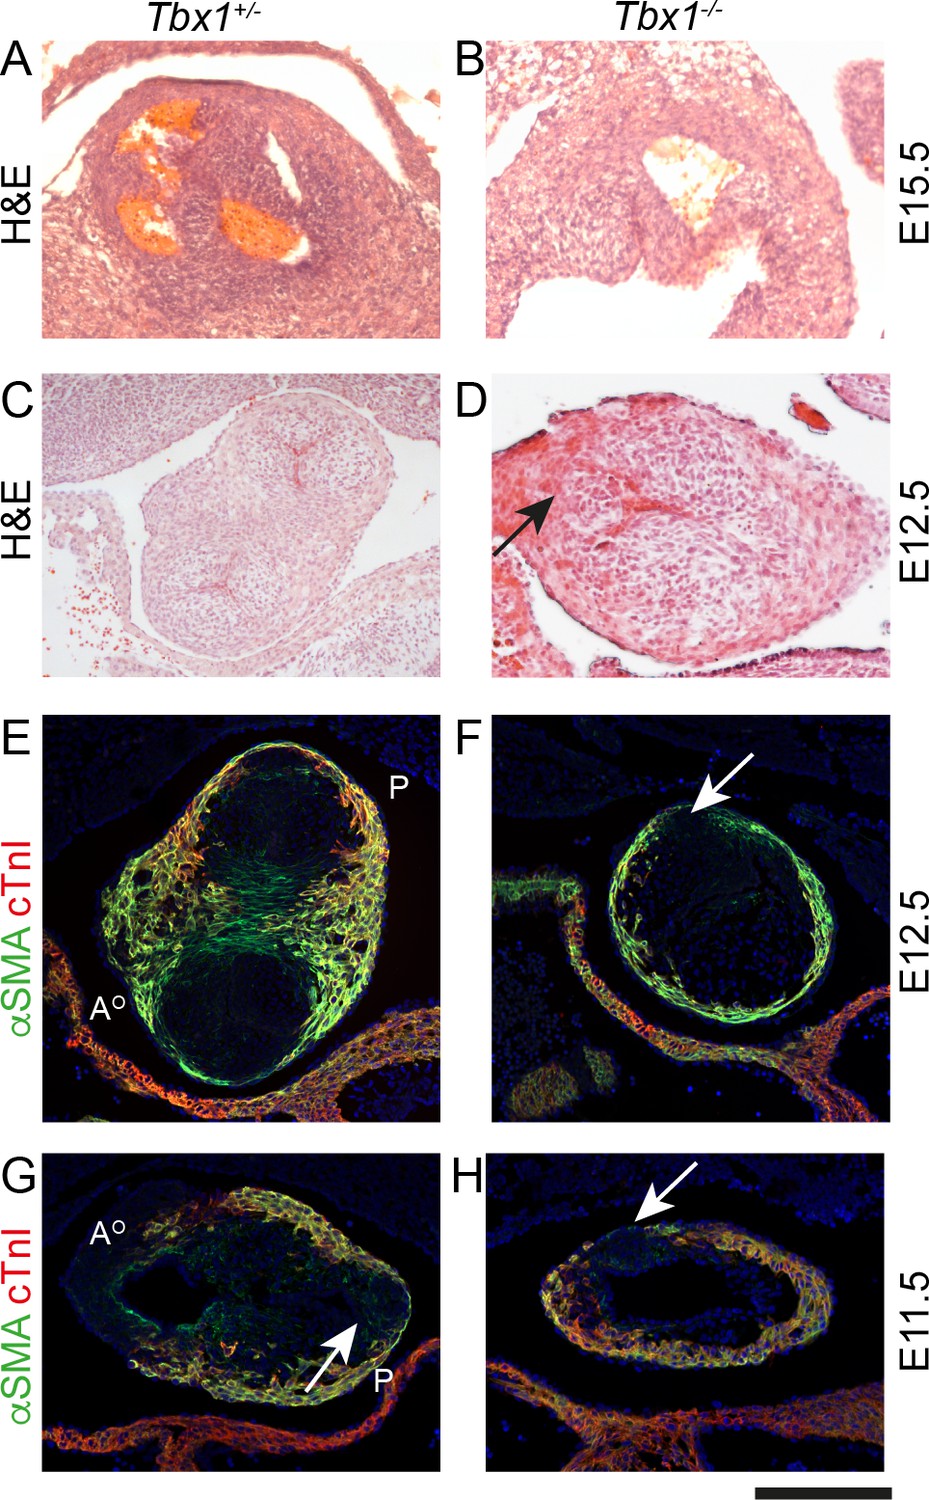
Failure to form the pulmonary anterior leaflet in Tbx1 null embryos.
Images are typical examples of a minimum of n = 3. (A,B) The outflow tract remains unseptated and the valve leaflets are markedly abnormal in the Tbx1-/- at E15.5. It is not possible at this stage to establish the identity of the leaflets. (C–F) At E12.5, Tbx1+/- embryos have septated their outflow tract and have three leaflet primordia in both the aorta and pulmonary trunk. In contrast, the Tbx1-/- littermate has not septated its outflow tract and there is a single ICVS (arrows in D and F). (G,H) At E11.5, the aortic and pulmonary ICVS are obvious and are distinct from the myocardial wall (labelled yellow by αSMA/cTnI dual staining) in the Tbx1+/- embryo. In contrast, only a single ICVS (arrow) is seen in the Tbx1-/- embryo. Scale bar: A = 150 μm, B-F = 100 μm.
Figure 9

Summary of lineage contributions to the aortic and pulmonary valve leaflets.
(A–C) Cartoon showing the development of the ICVS and A/P valve leaflets in frontal (A–C) and transverse (A’–C’) orientation from E10.5-E12.5, superimposed with the contributions from each lineage of cells. Arrows point to the ICVS except in A’ where these cannot be seen (as they are found in the inferior and superior walls) and the arrows point to the distal additions of SHF cells to the lateral walls. Dotted lines in A’-C’ illustrate the plane of section shown in A-C. The ICVS appear as swellings within the outer wall of the distal outflow tract at E10.5, expand by E11.5 and discrete from the wall by E12.5, resembling the other valve leaflet primordia. (G) Cartoon summary of the contributions of NCC, EDC and the population derived directly from the SHF to the valve leaflet primordia in the normal embryo at E12.5. A – anterior leaflet, Ao – aorta, AoNC – aortic non-coronary (posterior) leaflet, EC – endocardial cushion, ICVS – intercalated valve swelling, L- left leaflet, Pu – pulmonary, R – right leaflet.
Tables
Key resources table
| Reagent type (species) or resource | Designation | Source or reference | Identifiers | Additional information |
|---|---|---|---|---|
| Genetic reagent (Mus musculus) | Mef2c-AHF-Cre | PMID: 16188249 | ||
| Genetic reagent (Mus musculus) | Wnt1-Cre | PMID: 9843687 | ||
| Genetic reagent (Mus musculus) | Tek-Cre | PMID: 11161575 | ||
| Genetic reagent (Mus musculus) | Wt1-ERT-Cre | PMID: 18568026 | ||
| Genetic reagent (Mus musculus) | Tnnt2-Cre | PMID: 12975322 | ||
| Genetic reagent (Mus musculus) | ROSA-Stop-eYFP | PMID: 11299042 | ||
| Genetic reagent (Mus musculus) | Isl1-Cre | PMID: 14667410 | ||
| Genetic reagent (Mus musculus) | Vangl2 flox | PMID: 25521757 | ||
| Genetic reagent (Mus musculus) | mTmG | PMID: 17868096 | ||
| Genetic reagent (Mus musculus) | Tbx1 null | PMID: 11242110 | ||
| Genetic reagent (Mus musculus) | Jag1 flox | PMID: 15550486 | ||
| Genetic reagent (Mus musculus) | Jag2 flox | PMID: 20533406 | ||
| Genetic reagent (Mus musculus) | Mib1 flox | PMID: 18043734 | ||
| Biological sample(Homo sapien) | Embryo sections CS14, 16, 21 | HDBR; PMID: 26395135 | ||
| Antibody | Anti-GFP | Abcam | ab13970 | 1/150 |
| Antibody | Sox9 | Abcam | ab185230 | 1/150 |
| Antibody | Versican | Abcam | ab1032 | 1/150 |
| Antibody | Collagen I | Abcam | ab21286 | 1/150 |
| Antibody | Alpha smooth muscle actin | Abcam | ab5228 and ab5694 | 1/150 |
| Antibody | SM22 alpha | Abcam | ab14106 | 1/150 |
| Antibody | Cardiac troponin T | Abcam | ab8295 | 1/150 |
| Antibody | E-cadherin | Abcam | ab15148 | 1/150 |
| Antibody | Notch2 | Abcam | ab8926 | 1/150 |
| Antibody | Cre recombinase | NEB | 15036 | 1/150 |
| Antibody | Cardiac troponin I | HyTest | 4T21/2 | 1/150 |
| Antibody | Laminin | Sigma | L9393 | 1/150 |
| Antibody | CS56 | Sigma | C8035 | 1/150 |
| Antibody | Isl1 | Developmental Studies Hybridoma Bank | 39.4D5 and 40.2D6 | 1/150 |
| Antibody | N-cadherin | BD Transduction Laboratories | 610920 | 1/150 |
| Antibody | Notch1ICD | Cell Signalling | 4147 | 1/150 |
| Antibody | Jagged 1 | Cell Signalling | 2620 | 1/150 |
| Antibody | Jagged 2 | BioRad | MCA5708GA | 1/150 |
| Sequence -based reagent | Snail cDNA probe for in situ hybridisation | PMID: 9671584 | ||
| Sequence -based reagent | Slug cDNA probe for in situ hybridisation | this paper | sequences provided in text |
Additional files
-
Transparent reporting form
- https://doi.org/10.7554/eLife.34110.022
Download links
A two-part list of links to download the article, or parts of the article, in various formats.
Downloads (link to download the article as PDF)
Open citations (links to open the citations from this article in various online reference manager services)
Cite this article (links to download the citations from this article in formats compatible with various reference manager tools)
A novel source of arterial valve cells linked to bicuspid aortic valve without raphe in mice
eLife 7:e34110.
https://doi.org/10.7554/eLife.34110


