Transcriptomic analyses reveal rhythmic and CLOCK-driven pathways in human skeletal muscle
- University Hospital of Geneva, Switzerland
- University of Geneva, Switzerland
- Institute of Genetics and Genomics of Geneva, Switzerland
- CarMeN Laboratory, INSERM U1060, France
- Nestlé Institute of Health Sciences, Switzerland
- Ecole Polytechnique Fédérale de Lausanne, Switzerland
- University of Bath, United Kingdom
- University of Nottingham, United Kingdom
- Edouard Herriot University Hospital, France
- NCCR Chemical Biology, University of Geneva, Switzerland
- University of St Mark and St John, United Kingdom
- Nestlé Research Centre, Switzerland
- University of Surrey, United Kingdom
Figures
Figure 1 with 1 supplement

Rhythmic gene expression in human skeletal muscle.
(A) Heat map showing genes rhythmic at the pre-mRNA and mRNA level (R-I.R-E: upper panel), at the pre-mRNA level only (R-I: middle panel), and at the mRNA level only (R-E: lower panel). Standardized relative gene expression is indicated in green (low) and red (high) and ordered by their respective phase. (B) mRNA half-life proxy by exon/intron ratio showing lower stability for genes with rhythmic mRNA (R–E) profiles. (C) Amplitude distribution of genes that are rhythmic only at the mRNA level (R-E, blue), the pre-mRNA level (R-I, red), or rhythmic for both (R-I.R-E). Genes with higher amplitude of transcription at the pre-mRNA level have a higher probability to be rhythmic at the mRNA level (R-I.R-E). (D) Number of genes in each group in relation to the -log10 BH corrected p-value; dashed line indicates threshold of 0.05. (E) Phase distribution at the pre-mRNA and mRNA level for the three groups described in (A). (F) Phase distribution for genes activated by acute muscle exercise (red), inflammation (blue), or both (green). (G) Temporal expression of core clock components, and (H) key muscle transcription factors. N = 10 human muscle biopsy donors. (I) Phase distribution of predicted rhythmic DNA motif activity.
-
Figure 1—source data 1
List of 9211 genes identified by RNA-seq analysis in human skeletal muscle.
Rhythmic transcripts (5748) were grouped into genes rhythmic at the pre-mRNA and mRNA level (R-I, R-E), at the pre-mRNA level only (R-I), and at the mRNA level only (R-E).
- https://doi.org/10.7554/eLife.34114.004
-
Figure 1—source data 2
GO term enrichment analysis for transcripts identified as rhythmic in human skeletal muscle.
- https://doi.org/10.7554/eLife.34114.005
Figure 1—figure supplement 1

Temporal gene expression in human skeletal muscle.
(A) Temporal expression of genes involved in vesicular trafficking; (B) Temporal expression of genes involved in glucose uptake; (C) Temporal expression of genes involved in lipid metabolism analyzed by RNA-seq. N = 10 human muscle biopsy donors.
Figure 2 with 2 supplements
Disruption of the circadian oscillator impacts on functional gene expression hSKM.
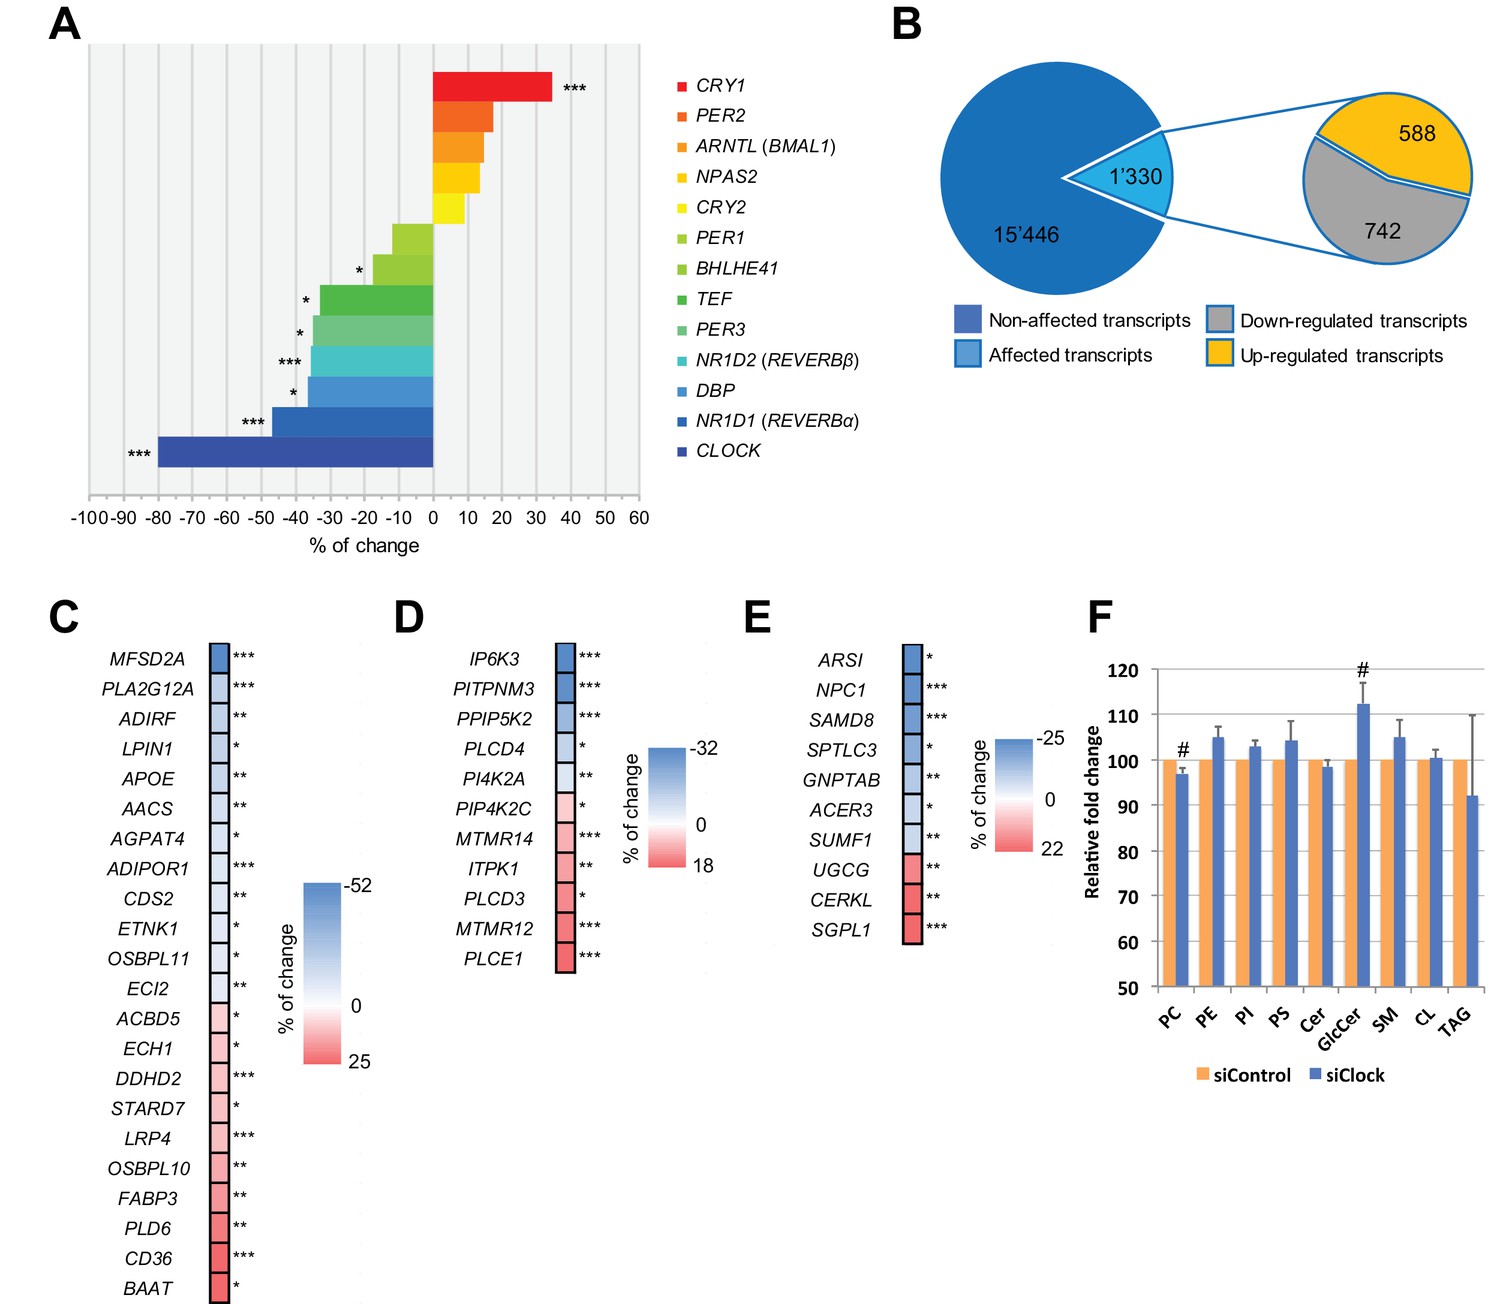
Differential gene expression analysis between hSKM bearing a disrupted (siCLOCK) or intact (siControl) circadian clock. Comparison of the median gene expression at all analyzed circadian time points between the two groups. A total of 16,776 genes were detected by RNA-seq as expressed above the threshold of counts per million (CPM) >3. (A) Core clock genes; (B) 15,446 genes remained unchanged (dark blue), and 1330 genes exhibited a significantly different expression level upon siCLOCK-mediated clock disruption (light blue), with 588 being up-regulated (orange) and 742 down-regulated (grey) (FDR <0.05 and p-value <0.05). Altered genes comprised those related to glycerophospholipid and triglyceride metabolism, storage and transport (C) inositol phosphate metabolism (D) and sphingolipid metabolism and storage (E). (F) Relative levels of PC, PE, PI, PS, Cer GlcCer, SM, CL and TAG, analyzed by mass spectrometry based lipidomics in hSKM cells transfected with either siControl (orange bar) or siCLOCK (blue bar). Total phosphatidylcholine (PC) and glycosylceramide (GlcCer) levels are significantly decreased or increased, respectively, upon siCLOCK transfection. Data are mean ± SEM, N = 4 (# p-value <0.05). (*) for FDR <0.05, (**) for FDR <0.01, (***) for FDR <0.001.
-
Figure 2—source data 1
List of 16,776 genes identified in hSKM by RNA-seq and used for the differential analysis.
Related to Supplementary file 1-tables S2-8.
- https://doi.org/10.7554/eLife.34114.009
-
Figure 2—source data 2
GO term enrichment analysis, using the Panther classification system, for transcripts that were down- and/or upregulated upon clock disruption.
Related to Supplementary file 1-table S4.
- https://doi.org/10.7554/eLife.34114.010
-
Figure 2—source data 3
Reactome pathway analysis, using the Panther classification system for transcripts that were down- and/or upregulated upon clock disruption.
Related to Supplementary file 1-table S5.
- https://doi.org/10.7554/eLife.34114.011
Figure 2—figure supplement 1
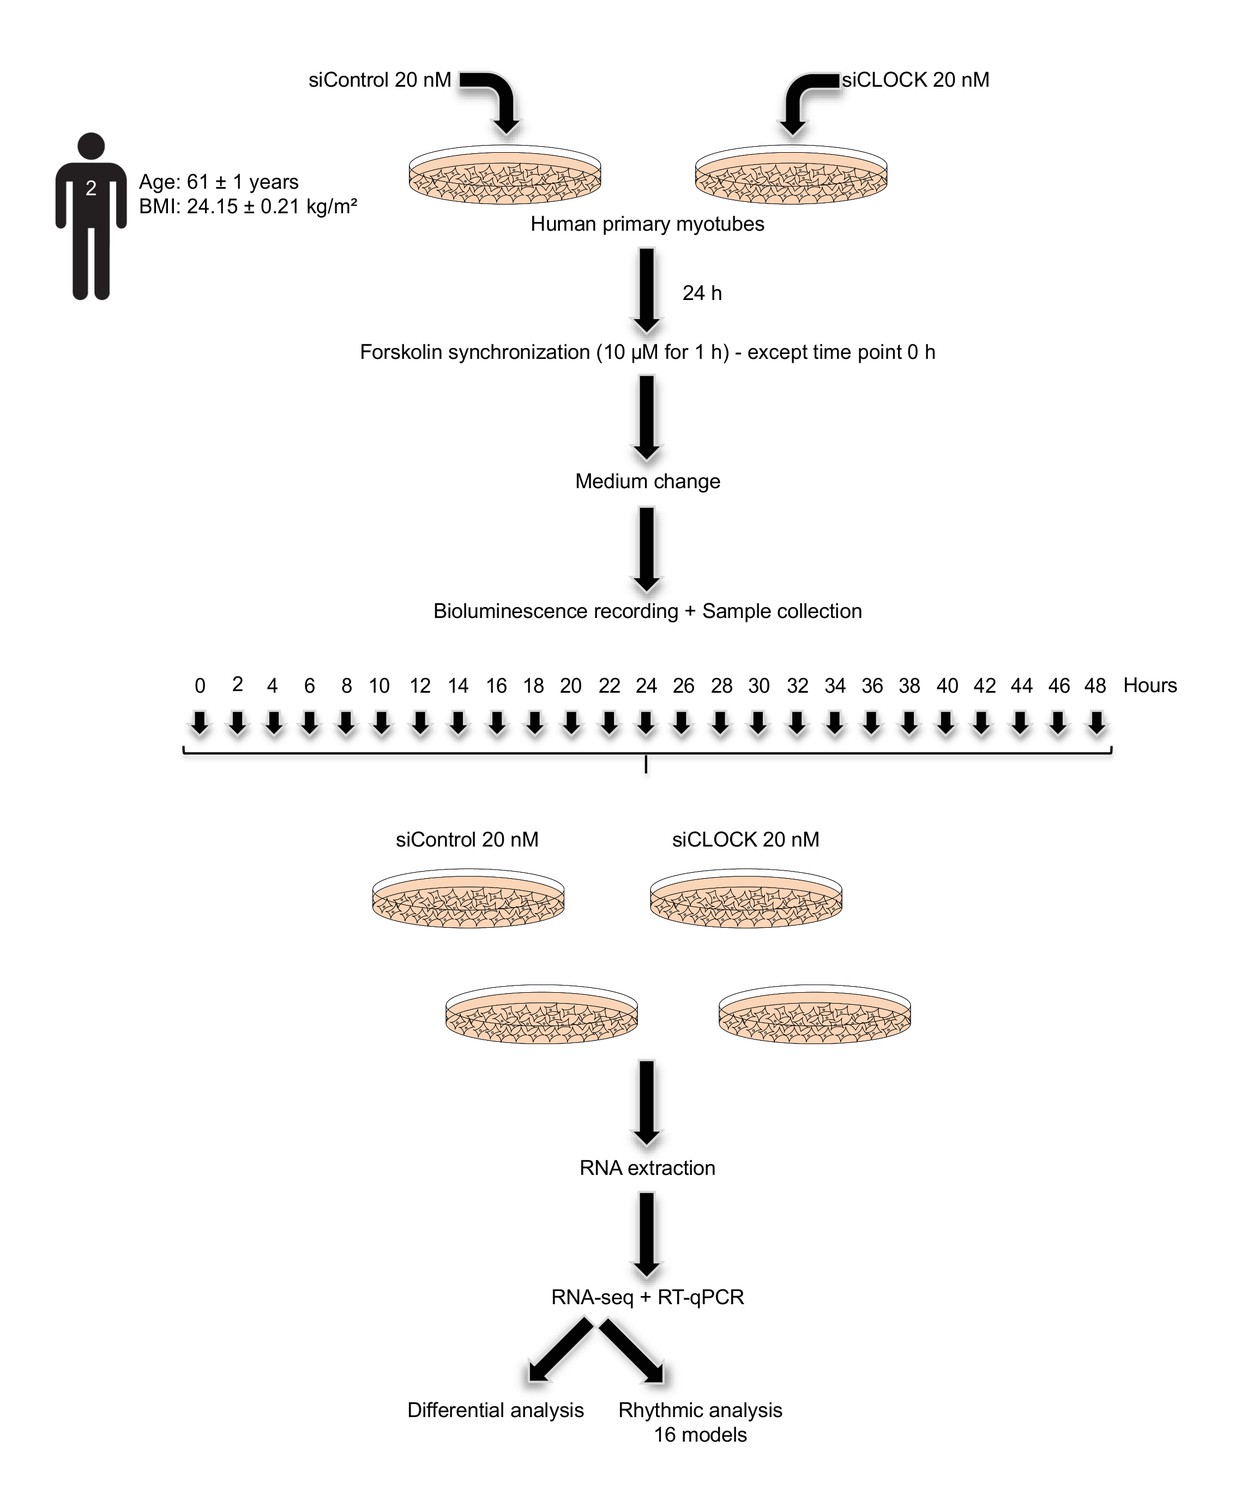
Study design.
Primary human myotubes were transfected with 20 nM of non-targeting siRNA (siControl) or with same amount of siCLOCK at day 6 of differentiation. 24 hr following siRNA transfection, in vitro synchronization by 10 µM forskolin pulse during 1 hr was conducted for all the dishes, except for those collected at time point 0 hr. Cells were harvested in duplicate dishes for each time point and for each donor, every 2 hr during 48 hr. Extracted RNA samples were subjected to RNA sequencing analysis or to real-time quantitative PCR (RT-qPCR).
Figure 2—figure supplement 2
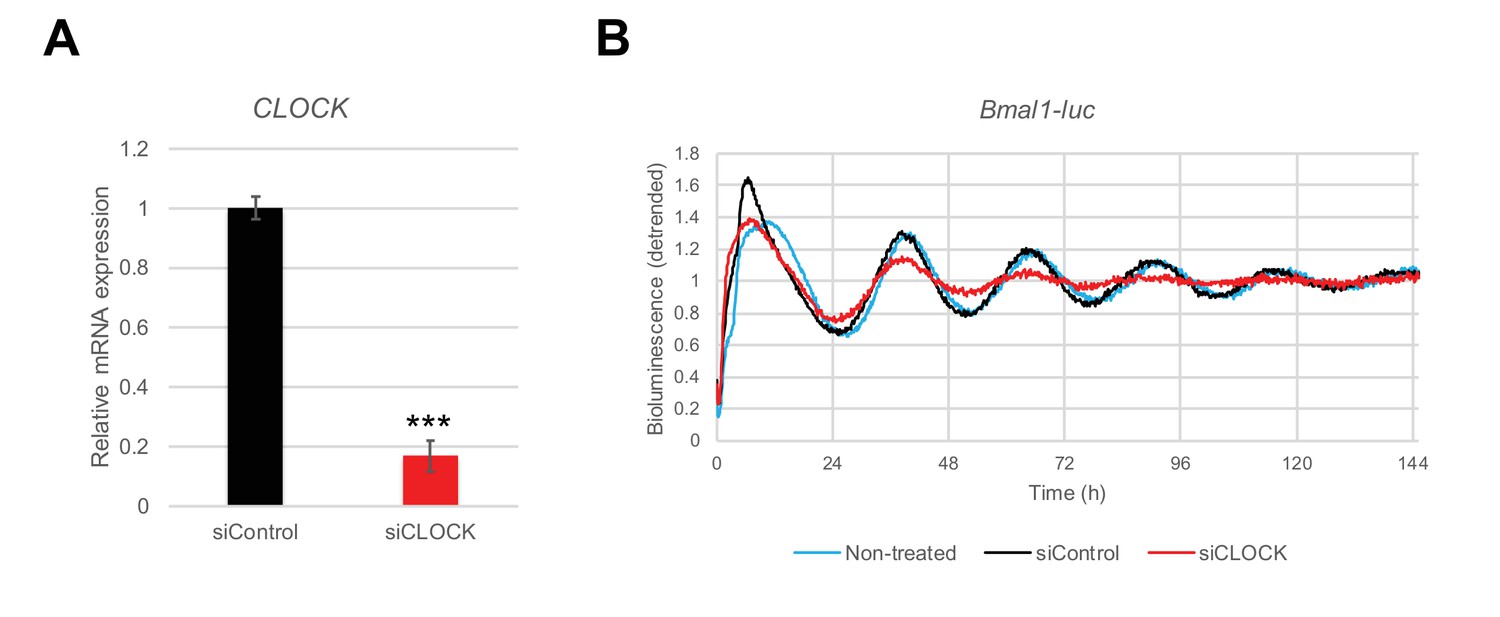
siRNA-mediated CLOCK knockdown leads to a flattening of the Bmal1-luc circadian oscillation amplitude in hSKM.
Human primary myoblasts were transduced with lentiviral particles expressing Bmal1-luc and differentiated into myotubes. siControl or siCLOCK transfection was performed 24 hr prior synchronization with forskolin. (A) CLOCK mRNA was measured by RT-qPCR in samples used for RNA-seq and collected at time points 0 hr (before synchronization), 24 hr and 48 hr. Data were normalized to the mean of 9S and HPRT. CLOCK expression was reduced by 82 ± 4% (mean of the three time ± SEM, N = 2, done in duplicates; (***) p-value <0.001) in siCLOCK-transfected cells. (B) Bmal1-luc bioluminescence profile shows an important reduction of amplitude in siCLOCK-transfected myotubes compared to controls. Representative Bmal1-luc oscillation profiles are shown for non-transfected (light blue line), siControl (black line), and siCLOCK (red line) transfected myotubes. Bmal1-luc oscillation profiles were recorded in duplicates (two experiments, one donor per experiment).
Figure 3 with 1 supplement

Basal and insulin-induced glucose uptake by hSKM is downregulated in the absence of a functional circadian clock.
(A) CLOCK mRNA was measured in hSKM cells transfected with siControl or siCLOCK by RT-qPCR and normalized to the mean of 9S and HPRT. CLOCK expression was reduced by 91 ± 2% (mean ± SEM, N = 4; (***) p-value <0.001) in siCLOCK-transfected cells. Protein levels of CLOCK (B) and 14-3-3θ (C) were assessed by western blot. Left panel: representative western blot; right panel protein quantification over all monoplicates (mean ± SEM, N = 5). CLOCK and 14-3-3θ protein levels were reduced by 75 ± 2%, and 28 ± 8%, respectively. (D) Glucose uptake rates (in pmol/mg.min) measured in the absence (basal) or presence (insulin) of insulin (1 hr, 100 nM) in siControl or siCLOCK-transfected cells. Note significant reduction of basal (31 ± 3%) and insulin-stimulated glucose uptake (28 ± 3%). Data are mean ± SEM of four independent experiments using myotubes from four different donors (same as for A-C). (*) p-value <0.05, (**) p-value <0.01, (***) p-value <0.001.
Figure 3—figure supplement 1

TBC1D4/AS160 protein levels are not affected by siCLOCK.
Representative western blot for TBC1D4/AS160 in hSKM cells transfected with either siControl or siCLOCK for 72 hr. Quantification of TBC1D4/AS160 protein levels shows no statistically significant difference of upon CLOCK disruption. Data are mean ± SEM (N = 5, monoplicates).
Figure 4 with 3 supplements
Temporal gene expression analysis in human skeletal myotubes bearing a disrupted or functional circadian clock.
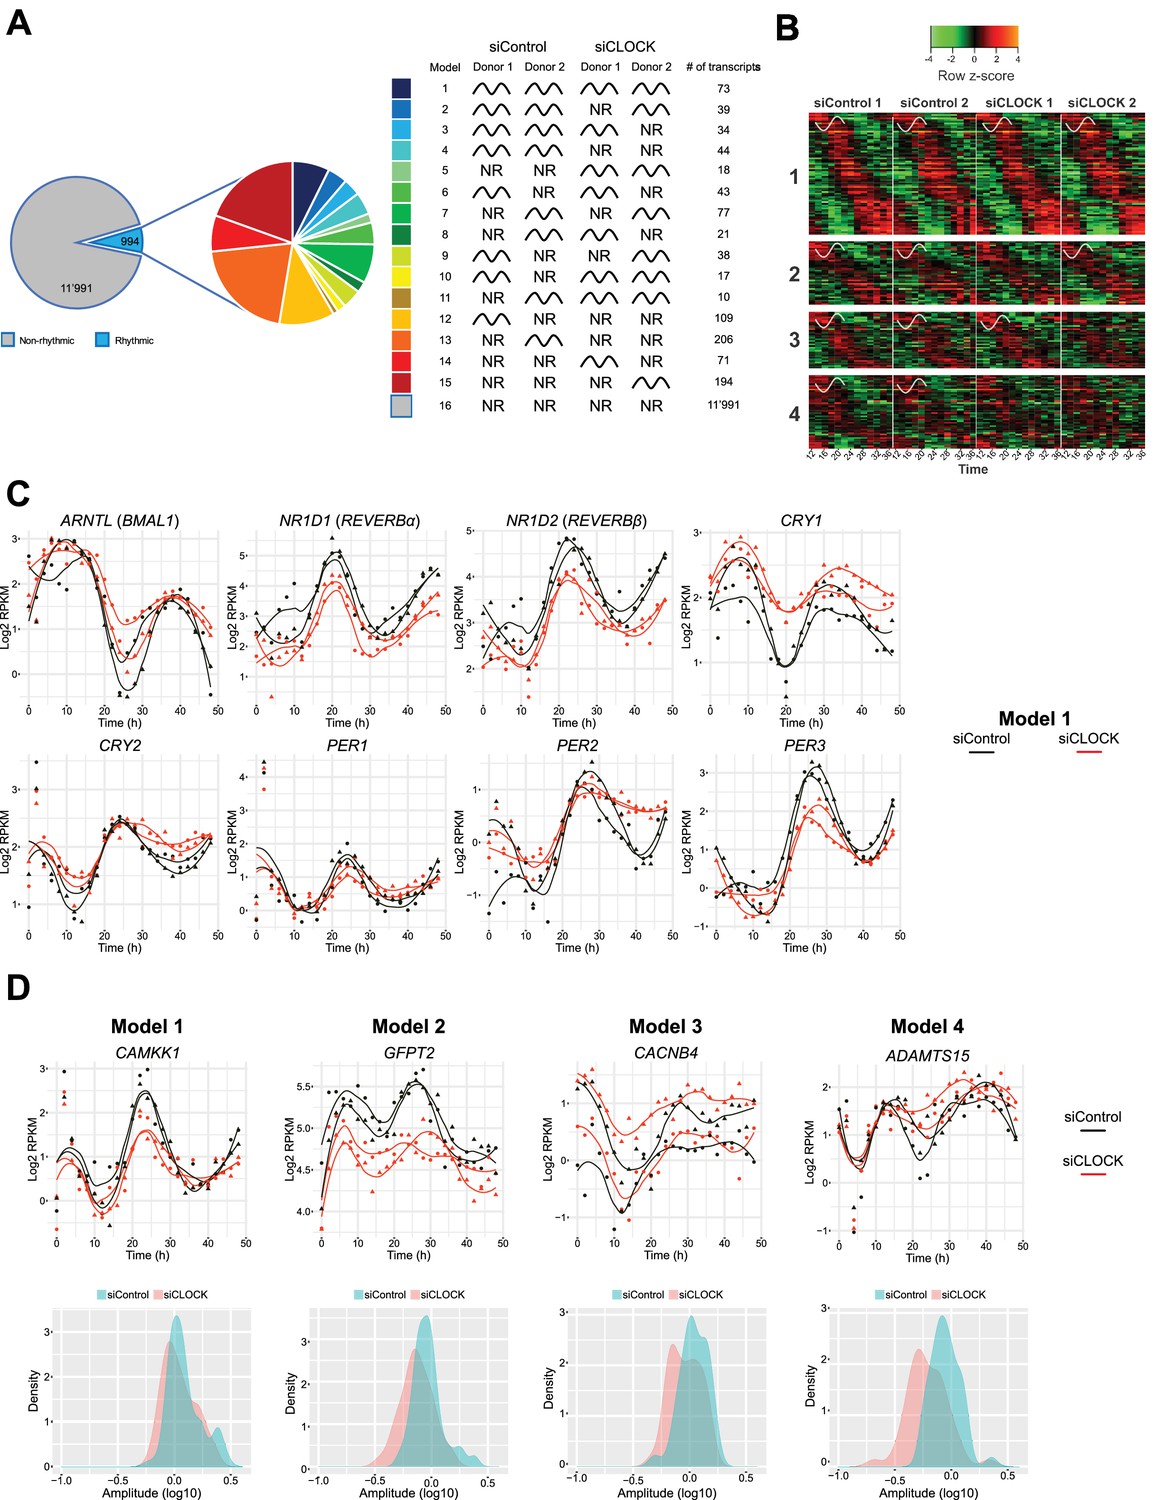
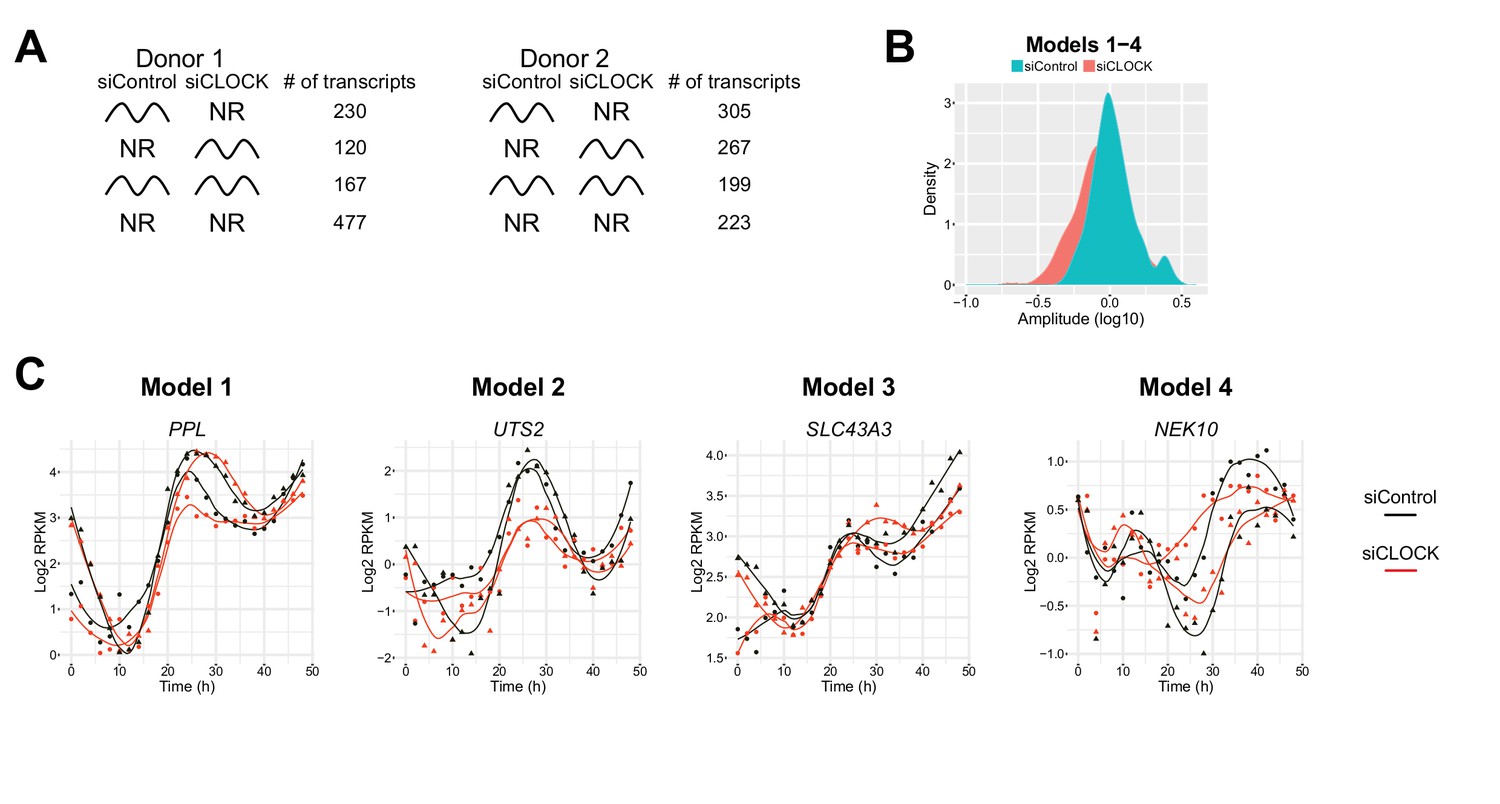
(A) Total of 12,985 genes were identified by RNA-seq as expressed above log2 RPKM >0. Genes were subjected to the circadian analysis, adapted for high-resolution datasets over 48 hr. Genes were categorized as rhythmic or non-rhythmic (NR) (left diagram) and rhythmic genes (994) were grouped into 15 models (right panel). Genes that were non-rhythmic in either one of the 15 models (11,991 genes) are represented in model 16. (B) Heat maps for genes assigned to models 1 to 4. Relative expression is indicated in green (low) and red (high). (C) Individual temporal expression profiles of core clock genes ARNTL, NR1D1, NR1D2, CRY1, CRY2, PER1, PER2 and PER3 in siControl or siCLOCK-transfected cells. (D) Upper panel: Representative examples for genes assigned to models 1–4. Lower panel: Circadian amplitude quantification of siControl and siCLOCK in models 1–4.
-
Figure 4—source data 1
List of genes found in each of the 16 models identified by rhythmic analysis of the RNA-seq data.
A gene was classified into one category if the probability was >0.5. If the probability was <0.5, transcripts were grouped into model 16 (non-rhythmic). Related to Figure 4—figure supplement 1, Supplementary file 1-tables S4-S6.
- https://doi.org/10.7554/eLife.34114.018
-
Figure 4—source data 2
This dataset contains the log2 RPKM values for all 25 time points (0 to 48 hr) and the mean of all time points per donor and per condition (siControl/siCLOCK) as well as the model where each gene is grouped.
- https://doi.org/10.7554/eLife.34114.019
-
Figure 4—source data 3
GO term enrichment analysis, using the Panther classification system, for transcripts that were grouped into model 1.
Related to Figure 4—figure supplements 1–3 and Supplementary file 1-table S4.
- https://doi.org/10.7554/eLife.34114.020
-
Figure 4—source data 4
Reactome enrichment analysis, using the Panther classification system, for genes that were grouped into model 1.
Related to Figure 4—figure supplements 1–3 and Supplementary file 1-table S5.
- https://doi.org/10.7554/eLife.34114.021
Figure 4—figure supplement 1
Comparison of rhythmic transcript profiles between the two donors.
(A) More rhythmic transcripts are found in donor two compared to donor one in both siControl and siCLOCK condition either due to the genetic differences between both donors or due to a better response to the forskolin pulse used for synchronization. (B) Circadian amplitude quantification for the summary of models 1–4 in siControl and siCLOCK. (C) Examples of genes qualified as rhythmic in model 1–4.
Figure 4—figure supplement 2

Temporal profiles of core clock transcript expression.
(A) Expression profile of NPAS2, TEF and BHLHE41 assessed by RNA-seq. (B) ARNTL (BMAL1), NR1D1 (REVERBα) and PER3 measured by RT-qPCR. mRNA levels were analyzed every 4 hr over 48 hr for each donor to confirm the RNA-seq results. Data were normalized to the mean of 9S and HPRT. For donor one data represent monoplicates, whereas for donor two data were done in duplicates. Donor 1: circle; donor 2: triangle; siControl: black line; siCLOCK: red line.
Figure 4—figure supplement 3
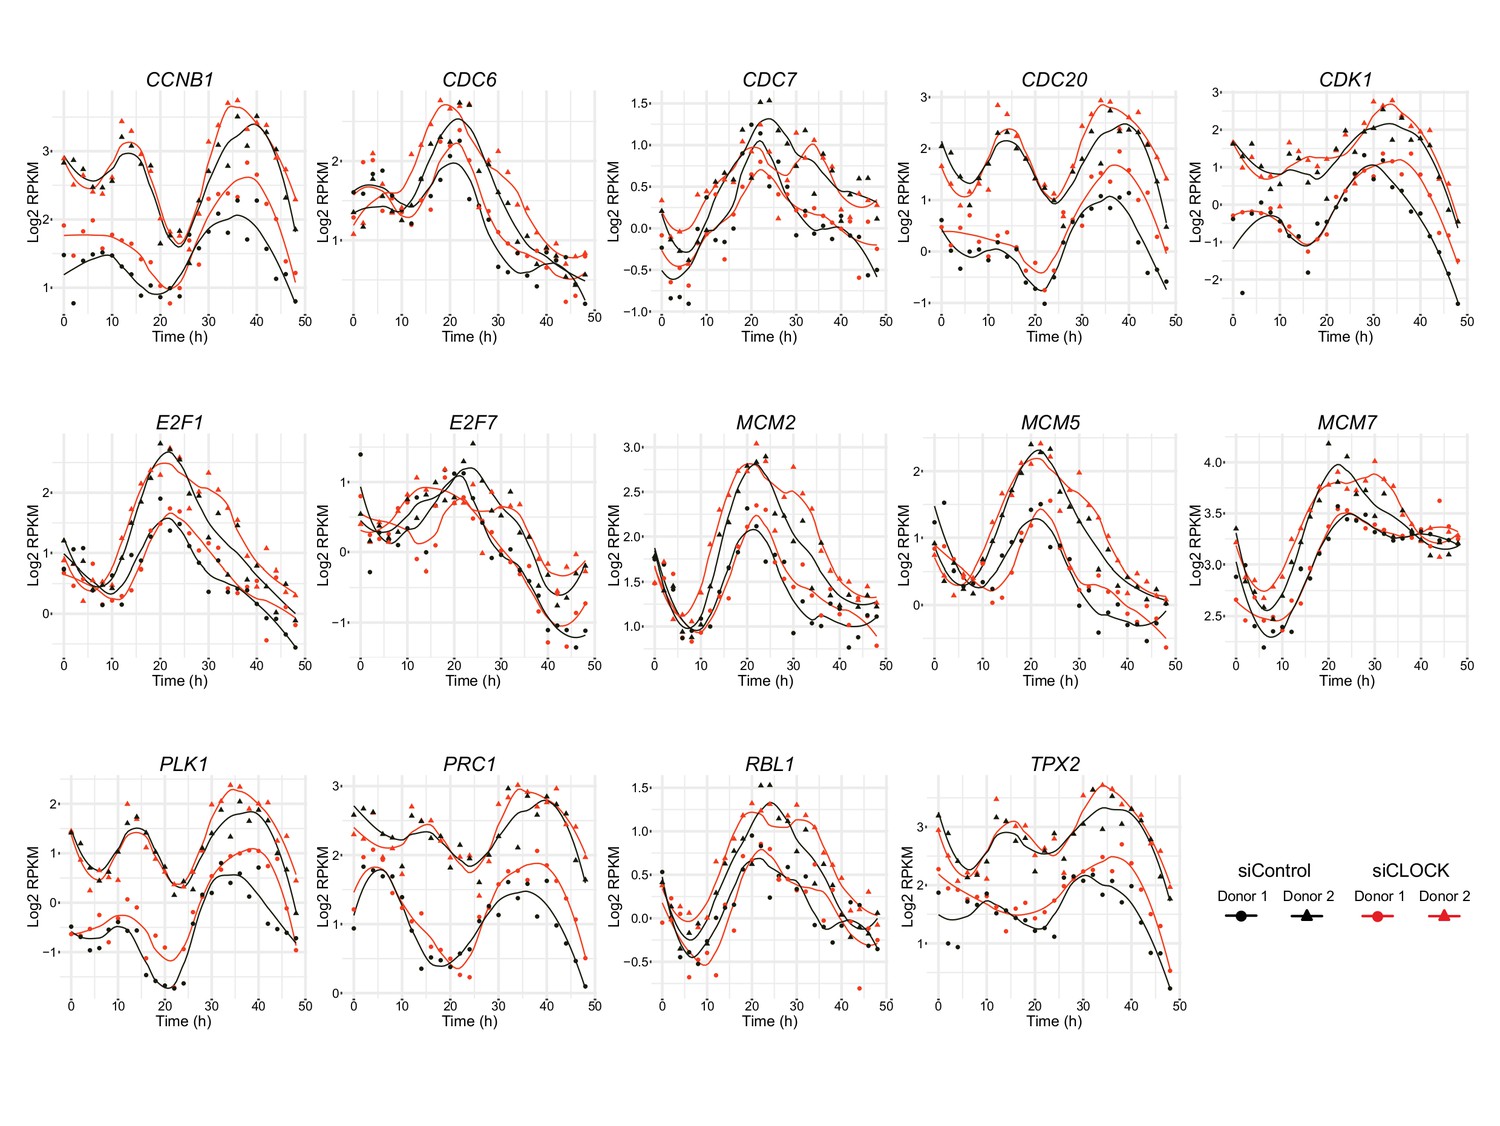
Genes involved in cell cycle regulation exhibit circadian expression profile in hSKM.
CCNB1, CDC6, CDC7, CDC20, CDK1, E2F1, E2F7, MCM2, MCM5, MCM7, PLK1, PRC1, RBL1/p107 and TPX2 expression profiles obtained by RNA-seq. All genes shown were classified in model 1 except for E2F1 and MCM5 (model 3).
Figure 5
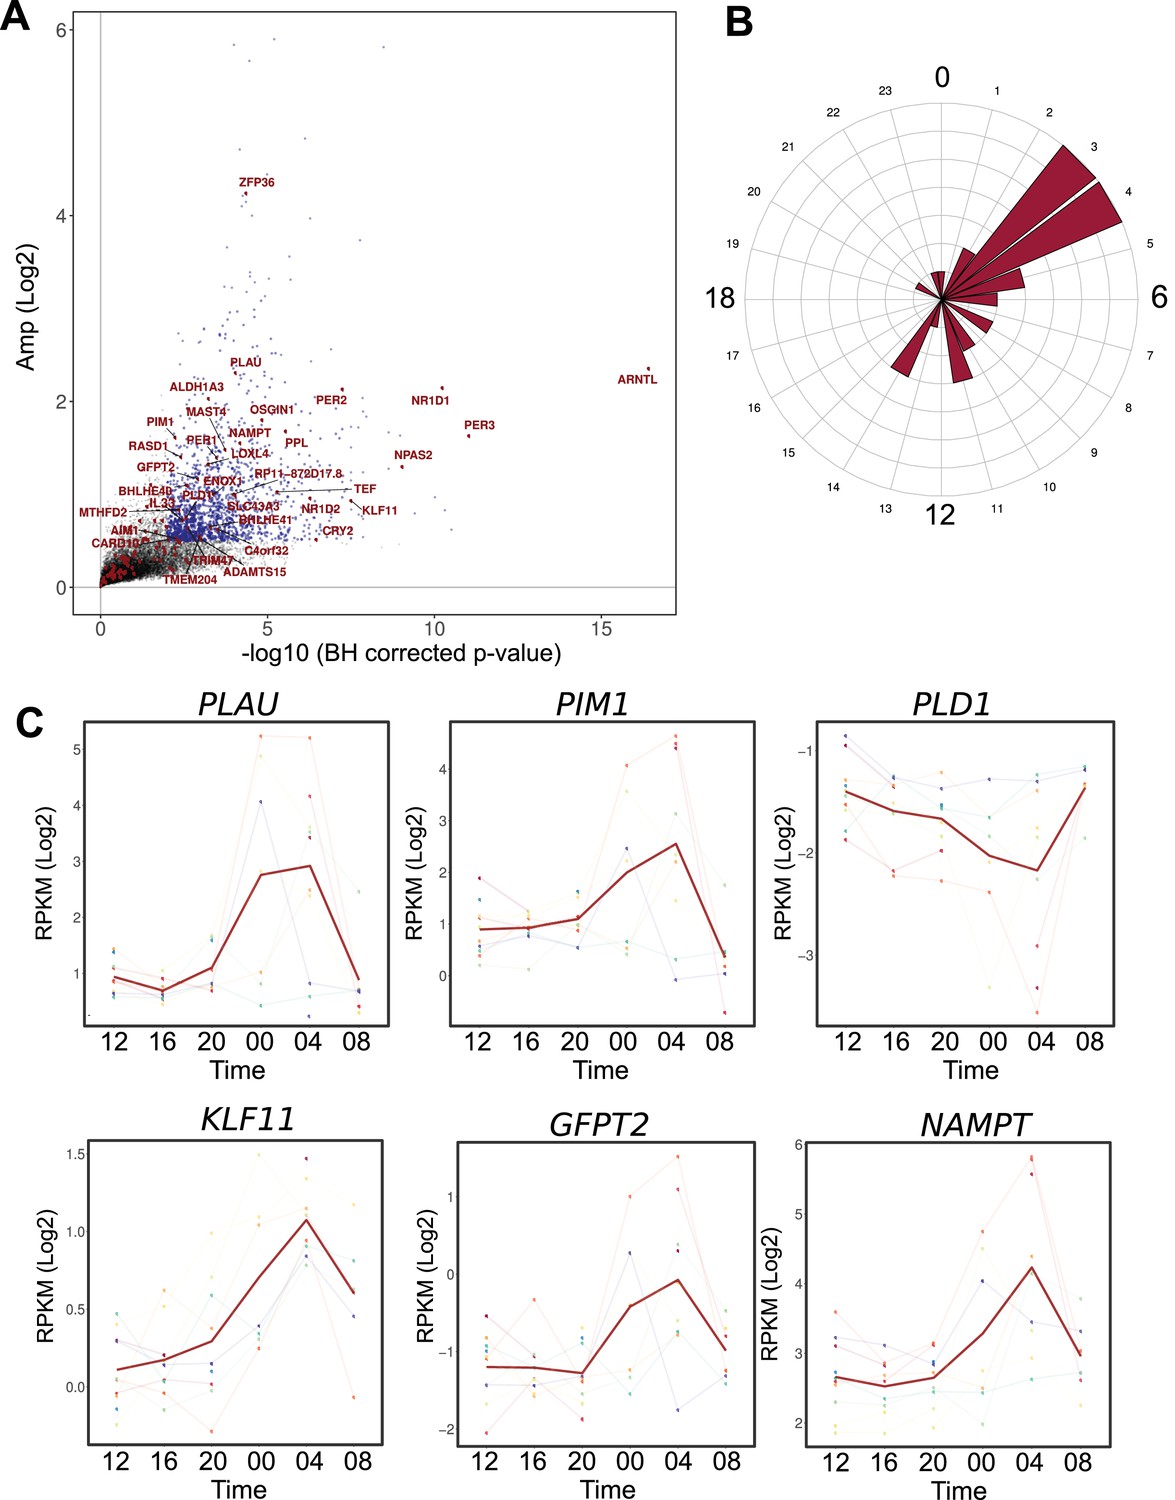
Comparison between the circadian transcriptome of human skeletal muscle and human primary myotubes.
(A) Scatter plot, representing the amplitude of expression in relation to the corrected p-value for genes that were rhythmic in vivo (human muscle biopsies). Genes that were also rhythmic in vitro (hSKM, models 1–4) are colored in red. Blue dots represent genes with a p-value <0.01 and log2 amp >0.5. (B) Phase distribution plot of genes rhythmic in muscle biopsies and primary myotubes shows enrichment at the 04:00 time point. (C) Examples of genes, involved in glucose homeostasis and muscle regeneration, that are rhythmic in vivo and in vitro (RNA-seq data, N = 10).
-
Figure 5—source data 1
List of 190 genes, rhythmic in hSKMs.
Transcripts representing non-protein coding sequences, pseudogenes or retired loci are colored in red, transcripts associated with cell cycle are colored in blue, transcripts related to cell differentiation, adhesion and proliferation are colored in green.
- https://doi.org/10.7554/eLife.34114.023
Figure 6
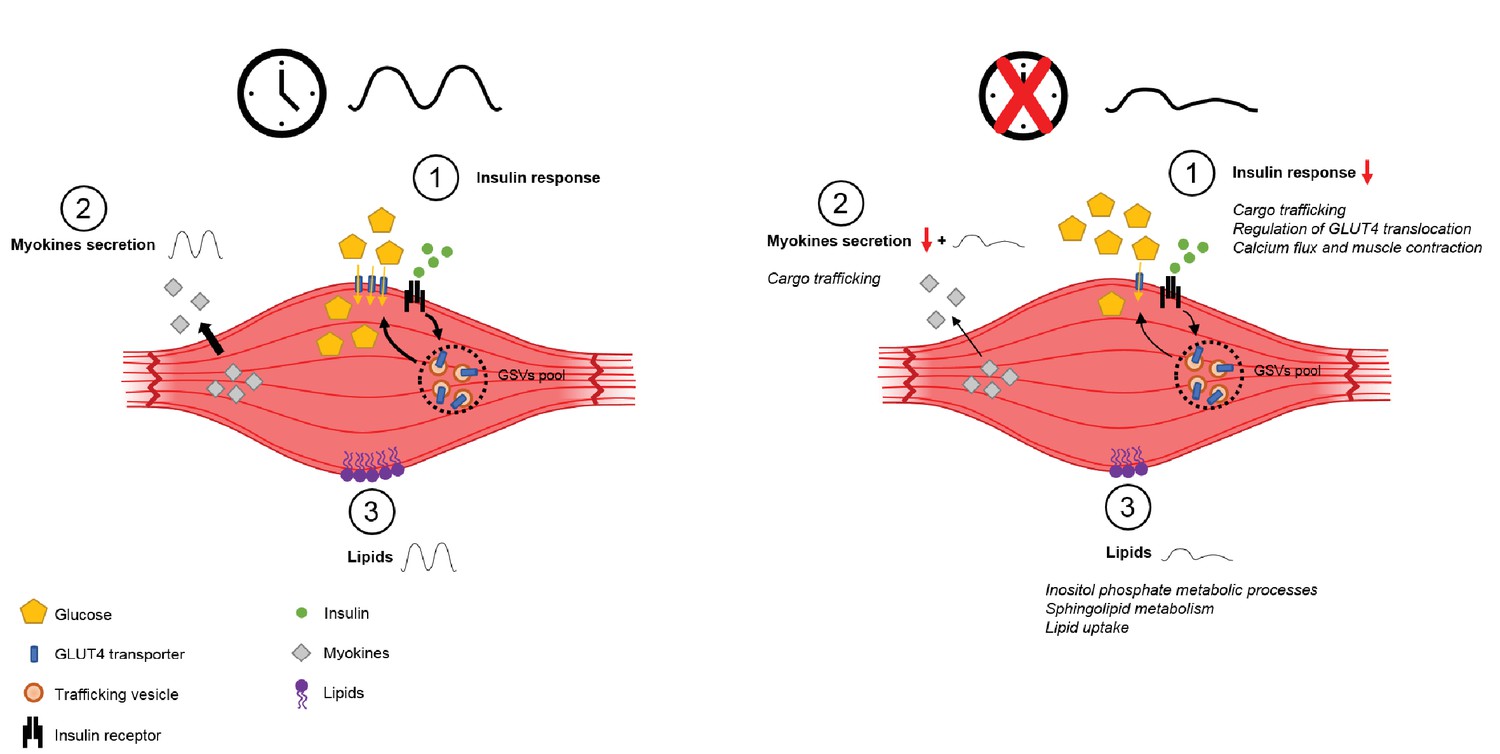
Schema summarizing impact of clock disruption on muscle metabolic function.
Clock disruption leads to impaired insulin sensitivity and decrease in glucose uptake (1), causes a dysregulation of genes involved in vesicle trafficking (2) and impacts lipid metabolism and lipid metabolite oscillations (3) as reported in Loizides-Mangold et al. (2017).
Author response image 1
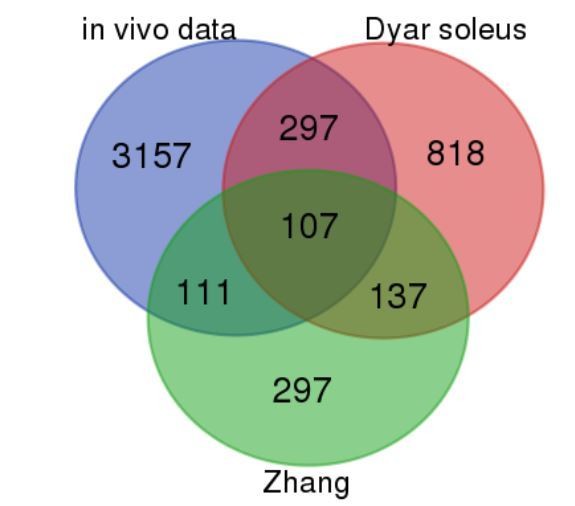
Comparison of our in vivo vastus lateralis rhythmic dataset with mouse skeletal muscle rhythmic data (Dyar et al., 2014; Zhang et al., 2014).
Blue = our in vivo RNAseq data; red = (Dyar et al., 2014) soleus; green = (Zhang et al., 2014). The numbers presented in the Venn diagram correspond to the total number of rhythmically expressed genes for each segment (exons only). For the human in vivo dataset (our work), this corresponds to R–E + R–I.R–E, with the cutoff described in the manuscript (Figure 1). For (Dyar et al., 2014) (microarray) and (Zhang et al., 2014) (microarray) rhythmic genes were identified using a Benjamini–Hochberg q–value <0.2 in the JTK_Cycle algorithm.
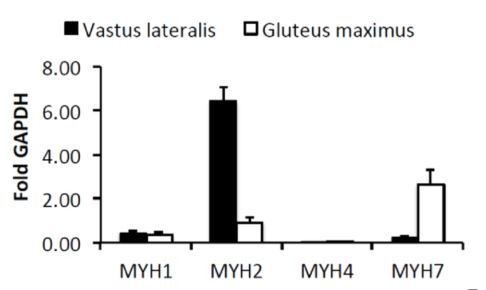
Author response image 2
Author response image 3
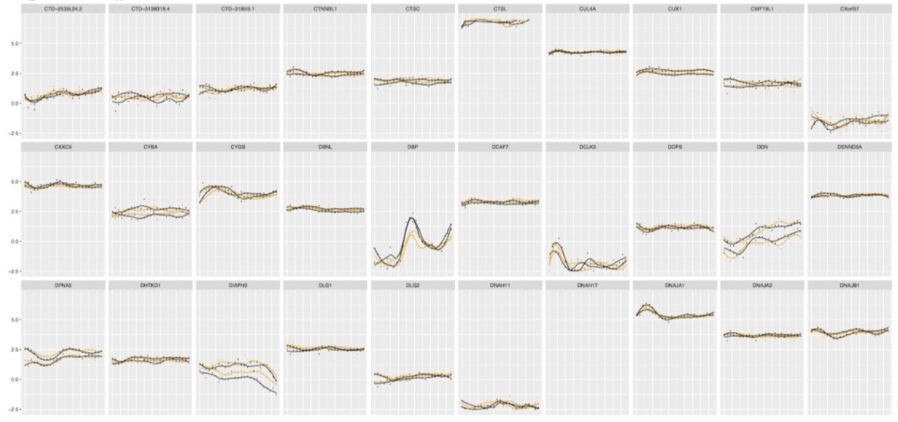
Examples of the gene expression profiles from our database qualified as circadian by JTK_CYCLE.
https://doi.org/10.7554/eLife.34114.031Tables
Key resources table
| Reagent type (species) or resource | Designation | Source or reference | Identifiers | Additional information |
|---|---|---|---|---|
| Antibody | anti-AS160 (C69A7) Rabbit mAb | Cell Signaling | Cat. #2670 RRID:AB_2199375 | 1:1000; for western blot; primary Ab |
| Antibody | anti-14-3-3 θ Rabbit polyclonal | Cell Signaling | Cat. #9638 RRID:AB_2218251 | 1:200; for western blot; primary Ab |
| Antibody | anti-CLOCK(H276) Rabit polyclonal | Santa Cruz Biotechnology | Cat. sc-25361 RRID:AB_2260802 | 1:200; for western blot; primary Ab |
| Antibody | anti-actin Rabbit polyclonal | Sigma-Aldrich | Cat. A2066 RRID:AB_476693 | 1:1000; for western blot; primary Ab |
| Antibody | goat anti-rabbit-IgG HRP | Sigma-Aldrich | Cat. A8275 RRID:AB_258382 | 1:3000; for western blot; secondary Ab |
| Recombinant DNA reagent | Bmal1-luciferase (luc) reporter | Liu et al., 2008; PMID:18454201 | ||
| Sequence-based reagent | ON-TARGETplus Non-targeting Pool | Dharmacon | D-001810-10-20 | |
| Sequence-based reagent | ON-TARGETplus human CLOCK siRNA SMARTpool | Dharmacon | L-008212-00-0020 | Target Sequences: CAACUUGCACCUAUAAAUA CGACAGGACUGGAAACCUA GAACAACGGACACGCAUGA CUAGAAAGAUGGACAAAUC |
| Peptide, recombinant protein | NA | NA | NA | NA |
| Commercial assay or kit | SuperSignal West Pico Chemiluminescent Substrate | Thermo Fisher Scientific | Prod. #34080 | |
| Commercial assay or kit | Quant-iTª RiboGreenª RNA Assay Kit | Thermo Fisher Scientific | R11491 | |
| Commercial assay or kit | RNeasy Mini kit | Qiagen | Ref # 74104 | |
| Commercial assay or kit | TruSeq Stranded Total RNA Library Prep Kit with Ribo-Zero Gold Set A (48 samples, 12 indexes) | Illumina | RS-122–2301 | |
| Commercial assay or kit | TruSeq Stranded Total RNA Library Prep Kit with Ribo-Zero Gold Set B (48 samples, 12 indexes) Indexes only | Illumina | RS-122–2302 | |
| Commercial assay or kit | TruSeq RNA Library Prep Kit v2 | Illumina | RS-122–2001/RS-122–2002 | |
| Commercial assay or kit | HiSeq PE Cluster Kit V4 - cBot | Illumina | PE-401–4001 | |
| Commercial assay or kit | HiSeq SBS Kit V4 250 cycle kit | Illumina | FC-401–4003 | |
| Commercial assay or kit | KAPA HiFi HotStart ReadyMixPCR Kit | Kapa BioSystems (Roche) | KK2602 | |
| Commercial assay or kit | Quant-iT PicoGreen dsDNA Assay Kit | Thermo Fisher Scientific | P7589 | |
| Commercial assay or kit | LabChip DNA High Sensitivity Reagent Kit | Perkin Elmer | CLS760672 | |
| Chemical compound, drug | Forskolin | Sigma-Aldrich | F6886 | |
| Chemical compound, drug | Luciferin | Prolume LTD | #260150 | |
| Chemical compound, drug | 2-deoxy-[3H]-D-glucose | PerkinElmer | NET328A001MC | Specific Activity: 5–10 Ci (185-370GBq)/mmol, 1mCi (37MBq) |
| Insulin | Sigma-Aldrich | I9278 | ||
| Chemical compound, drug | Potassium phosphate monobasic | Sigma-Aldrich | P5655 | |
| Chemical compound, drug | HiPerFect transfection reagent | Qiagen | Cat No./ID: 301705 | |
| Chemical compound, drug | Tert-butyl methyl ether | Sigma-Aldrich | #20256 | |
| Chemical compound, drug | Methylamine solution | Sigma-Aldrich | #534102 | |
| Chemical compound, drug | Methanol LC-MS CHROMASOLV | Fluka (Thermo Fisher Scientific) | #34966 | |
| Chemical compound, drug | Water LC-MS CHROMASOLV | Fluka (Thermo Fisher Scientific) | #39253 | |
| Chemical compound, drug | Chloroform, stabilized with ethanol, for HPLC | ACROS Organics (Thermo Fisher Scientific) | #390760010 | |
| Chemical compound, drug | 12:0 PC (DLPC) | Avanti Polar Lipids | #850335 | |
| Chemical compound, drug | 17:0-14:1 PE | Avanti Polar Lipids | LM1104 | |
| Chemical compound, drug | 17:0-14:1 PI | Avanti Polar Lipids | LM1504 | |
| Chemical compound, drug | 17:0-14:1 PS | Avanti Polar Lipids | LM1304 | |
| Chemical compound, drug | 12:0 SM (d18:1/12:0) | Avanti Polar Lipids | #860583 | |
| Chemical compound, drug | C17 Ceramide (d18:1/17:0) | Avanti Polar Lipids | #860517 | |
| Chemical compound, drug | C8 Glucosyl(ß) Ceramide (d18:1/8:0) | Avanti Polar Lipids | #860540 | |
| Software, algorithm | Rstudio | Rstudio | R version 3.3.1 | |
| Software, algorithm | Prism 5 | GraphPad | NA | |
| Software, algorithm | Excel 2016 | Microsoft | NA | |
| Software, algorithm | LumiCycle | Actimetrics | NA | |
| Software, algorithm | STAR: ultrafast universal RNA-seq aligner | Dobin et al., 2013 PMID: 23104886 | ||
| Software, algorithm | edgeR package | Robinson et al., 2010 PMID: 19910308 | edgeR version 3.16.5 | |
| Software, algorithm | lme4 R package | Bates et al., 2015 DOI:10.18637/jss.v067.i01 | ||
| Software, algorithm | lmtest R package | Zeileis et al., 2002 DOI:10.18637/jss.v007.i02 | ||
| Software, algorithm | TopGO R package | https://bioconductor.riken.jp/packages/3.3/bioc/vignettes/topGO/inst/doc/topGO.pdf | ||
| Software, algorithm | GEMTools | http://gemtools.github.io/ | GEMTools v1.7.1 | |
| Lipid data analyzer II | IGB-TUG Graz University; PMID:21169379 | LDA v.2.5.1 | ||
| Software, algorithm | Image Lab | Bio-Rad | ||
| Other | RIPA buffer | Sigma-Aldrich | Cat# R0278 |
Additional files
-
Supplementary file 1
Supplementary tables S1-S9.
- https://doi.org/10.7554/eLife.34114.025
-
Supplementary file 2
Detailed list of exact p-values and raw data related to Figures 2 and 3.
- https://doi.org/10.7554/eLife.34114.026
-
Transparent reporting form
- https://doi.org/10.7554/eLife.34114.027
Download links
A two-part list of links to download the article, or parts of the article, in various formats.
Downloads (link to download the article as PDF)
Open citations (links to open the citations from this article in various online reference manager services)
Cite this article (links to download the citations from this article in formats compatible with various reference manager tools)
Transcriptomic analyses reveal rhythmic and CLOCK-driven pathways in human skeletal muscle
eLife 7:e34114.
https://doi.org/10.7554/eLife.34114


