Group II intron inhibits conjugative relaxase expression in bacteria by mRNA targeting
- University at Albany, United States
Figures
Figure 1 with 4 supplements
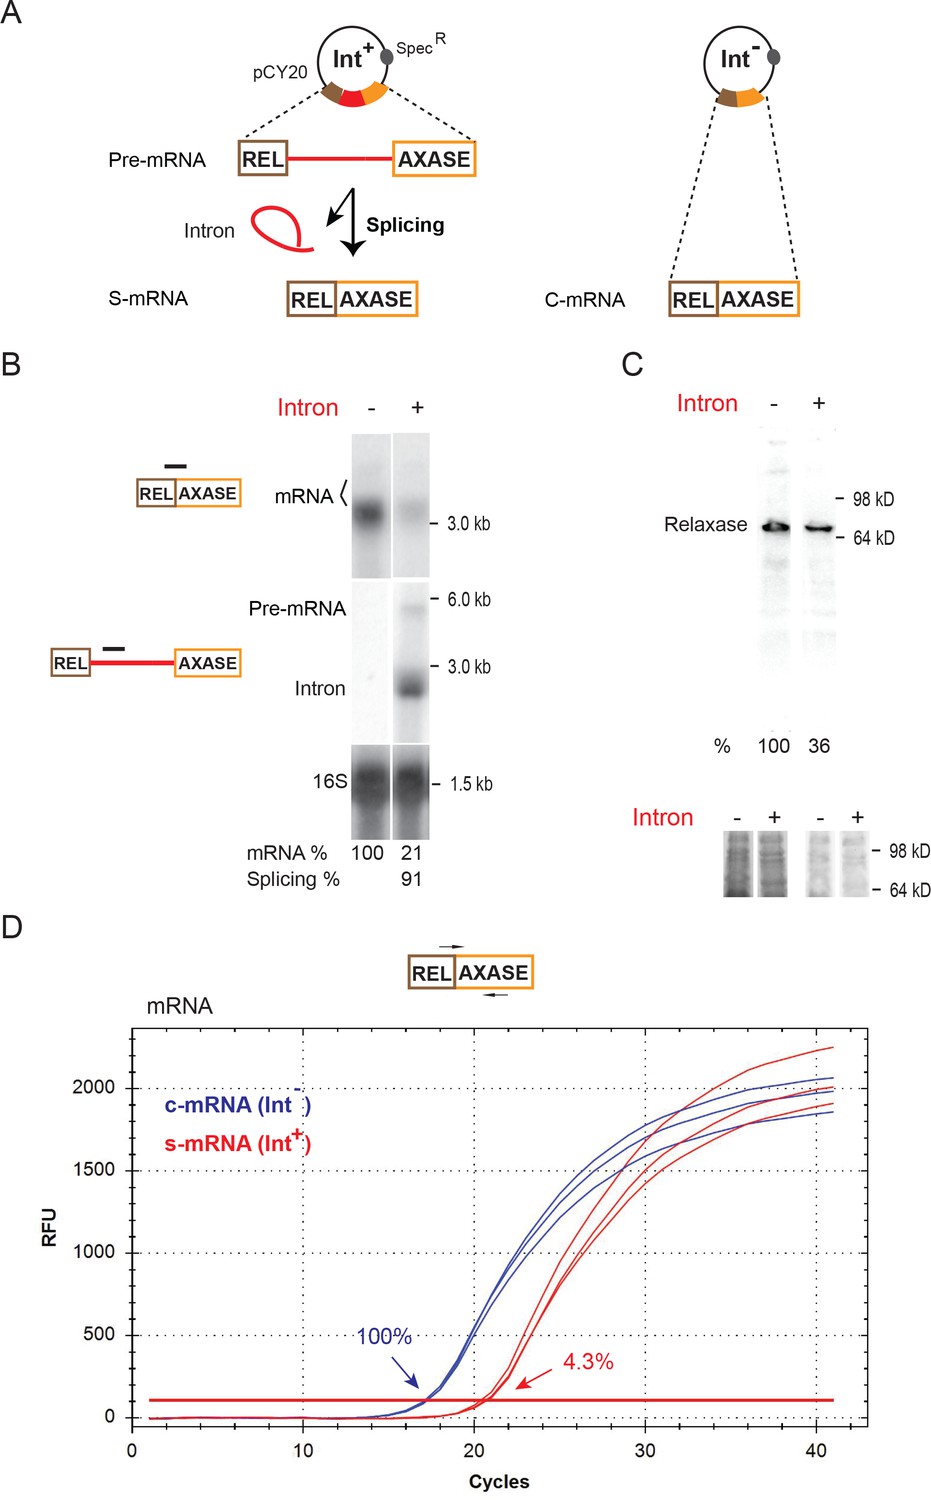
Inhibition of host gene expression by Ll.LtrB group II intron.
(A) Diagram of the ltrB relaxase mRNA produced from full-length intron-containing pre-mRNA and intron-less constructs on the pCY20 plasmids (specR). The mRNA generated from splicing of the intron (red) (S-mRNA, left) is compared to mRNA expressed from the intron-less construct (C-mRNA, right). (B) RNA analysis by Northern blotting using the mRNA splice-junction and intron-specific probes. Representative data of three biological replicates is shown. Quantitation of mRNA (two bands, bracketed) and splicing, normalized to 16S rRNA from the same blot after stripping and reprobing, is denoted at the bottom of the blot. The faint upper mRNA band may result from an alternate transcription start site. Splicing efficiency is defined as the percentage of the spliced intron relative to the sum of pre-mRNA and spliced intron. (C) LtrB relaxase protein levels determined by Western blotting. Representative data of three biological replicates is shown. Quantitation of protein level, normalized to respective total protein levels, is denoted at the bottom of the blot. Portions of the coomassie stained gels before (left) and after transfer (right) are shown below. (D) Representative qRT-PCR profile of expressed mRNAs in the Int- (blue) and Int+ (red) cells. PCR target and primer pair are shown (top) and average relative mRNA levels in Int-/Int+(100% vs 4.3%) derived from mean Ct values of three biological replicates are indicated.
-
Figure 1—source data 1
RT-qPCR data for mRNA.
mRNA quantitation cycle (Cq) values for Intron- and Intron+ samples. Contents are the experimental or unknown sample (Unkn), no RT enzyme control (NRT) and no template control (water, NTC).
- https://doi.org/10.7554/eLife.34268.008
Figure 1—figure supplement 1
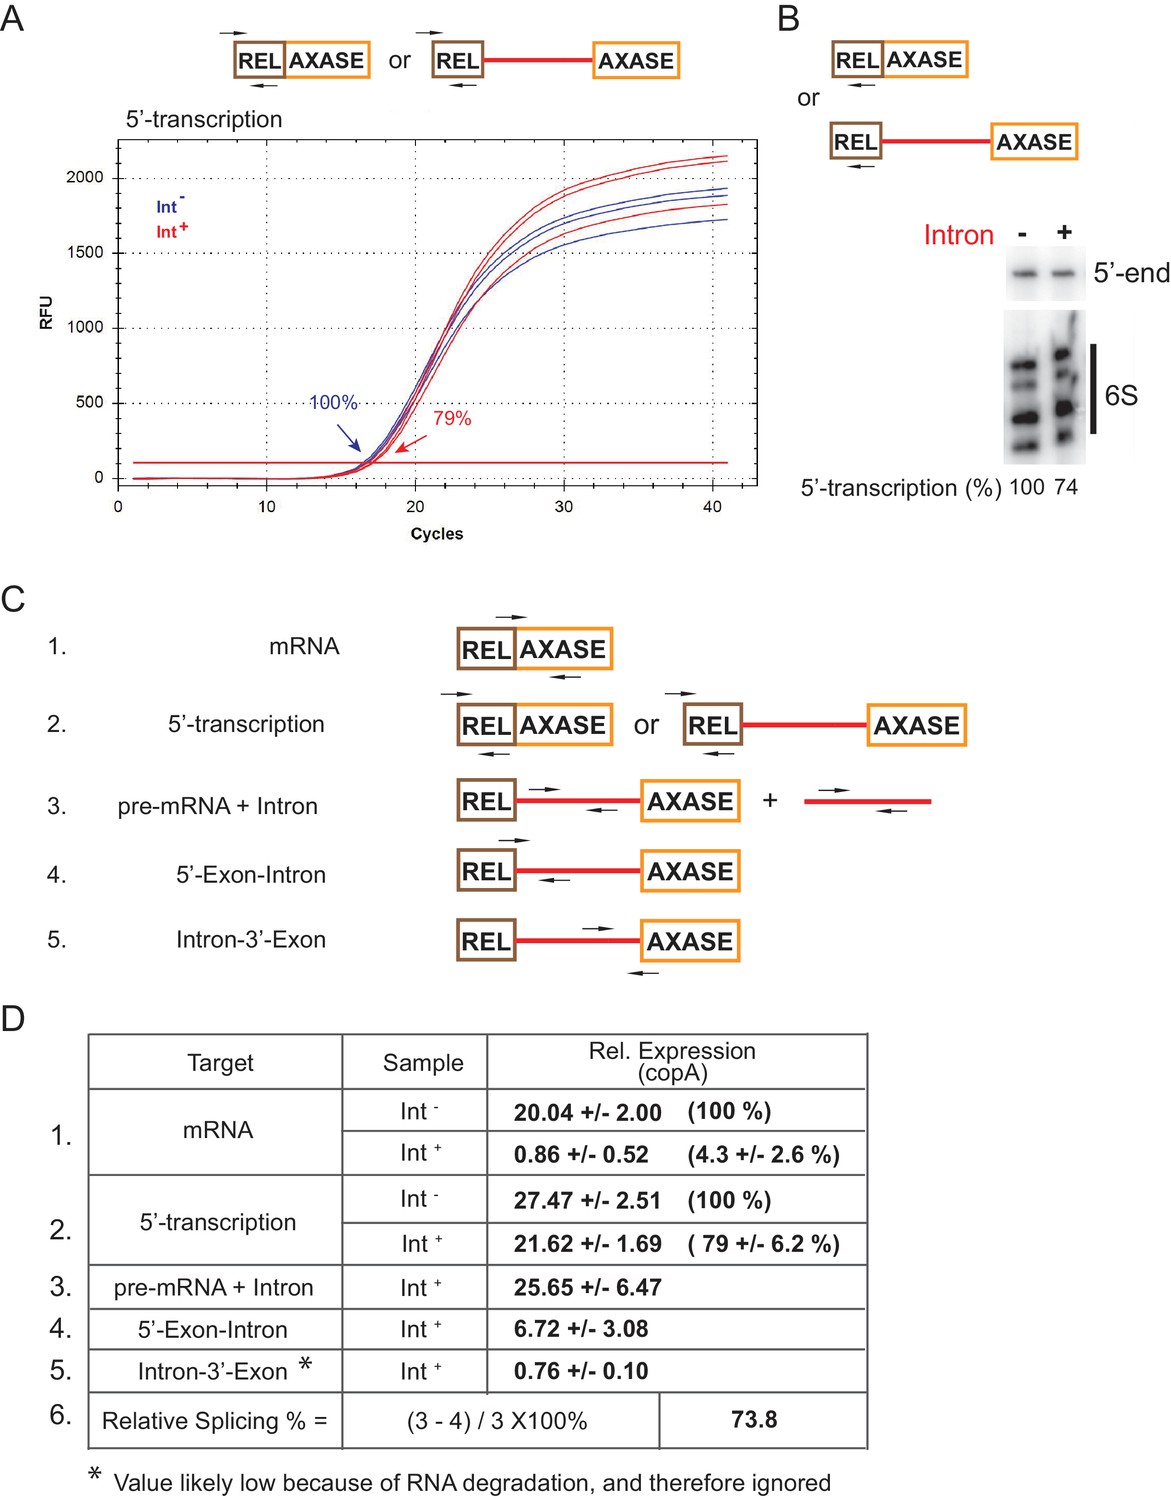
RNA analysis by qRT-PCR and reverse transcription.
(A) Representative qRT-PCR profile (three biological replicates) of 5′-transcription levels in the Int- (blue) and Int+ (red) cells. PCR targets and primer pairs are shown (top), and relative transcription levels (percentages of the Int-) are indicated. (B) The 5′-transcription level of the ltrB relaxase gene in the Int-/Int+ cells determined by primer extension. RNA targets and primer are shown above. cDNA synthesis was analyzed on a 10% urea-denaturing polyacrylamide gel. Cellular non-coding 6S RNA was used for loading normalization. Relative 5′-transcription levels (percentages) (mean value derived from three biological replicates) are indicated below the gel image. (C) Diagrams of RNA targets and primer pairs (arrows) used in PCR reactions. Numbers 1–5 denote the target mRNA, 5′-transcription, pre-mRNA + Intron, 5′-Exon-Intron, and Intron-3′-Exon, respectively. (D) qRT-PCR data. Expression of each RNA target relative to the internal reference copA is derived as decribed in Materials and methods. Mean values and standard deviations from three biological replicates, as well as the relative RNA levels (percentages in parentheses, if applicable) in the Int- and Int+ cells are shown. The relative level of the spliced intron (% splicing) is derived by subtracting pre-mRNA, represented by line 4 (probes 4) from total intron RNA (line 3, pre-mRNA + Intron). The relative splicing efficiency is determined as the percentage of spliced intron (lines 3–4) out of the total intron RNAs (line 3). Based on this analysis, splicing efficiency of the Ll.LtrB intron is in the 73.8% range.
Figure 1—figure supplement 2
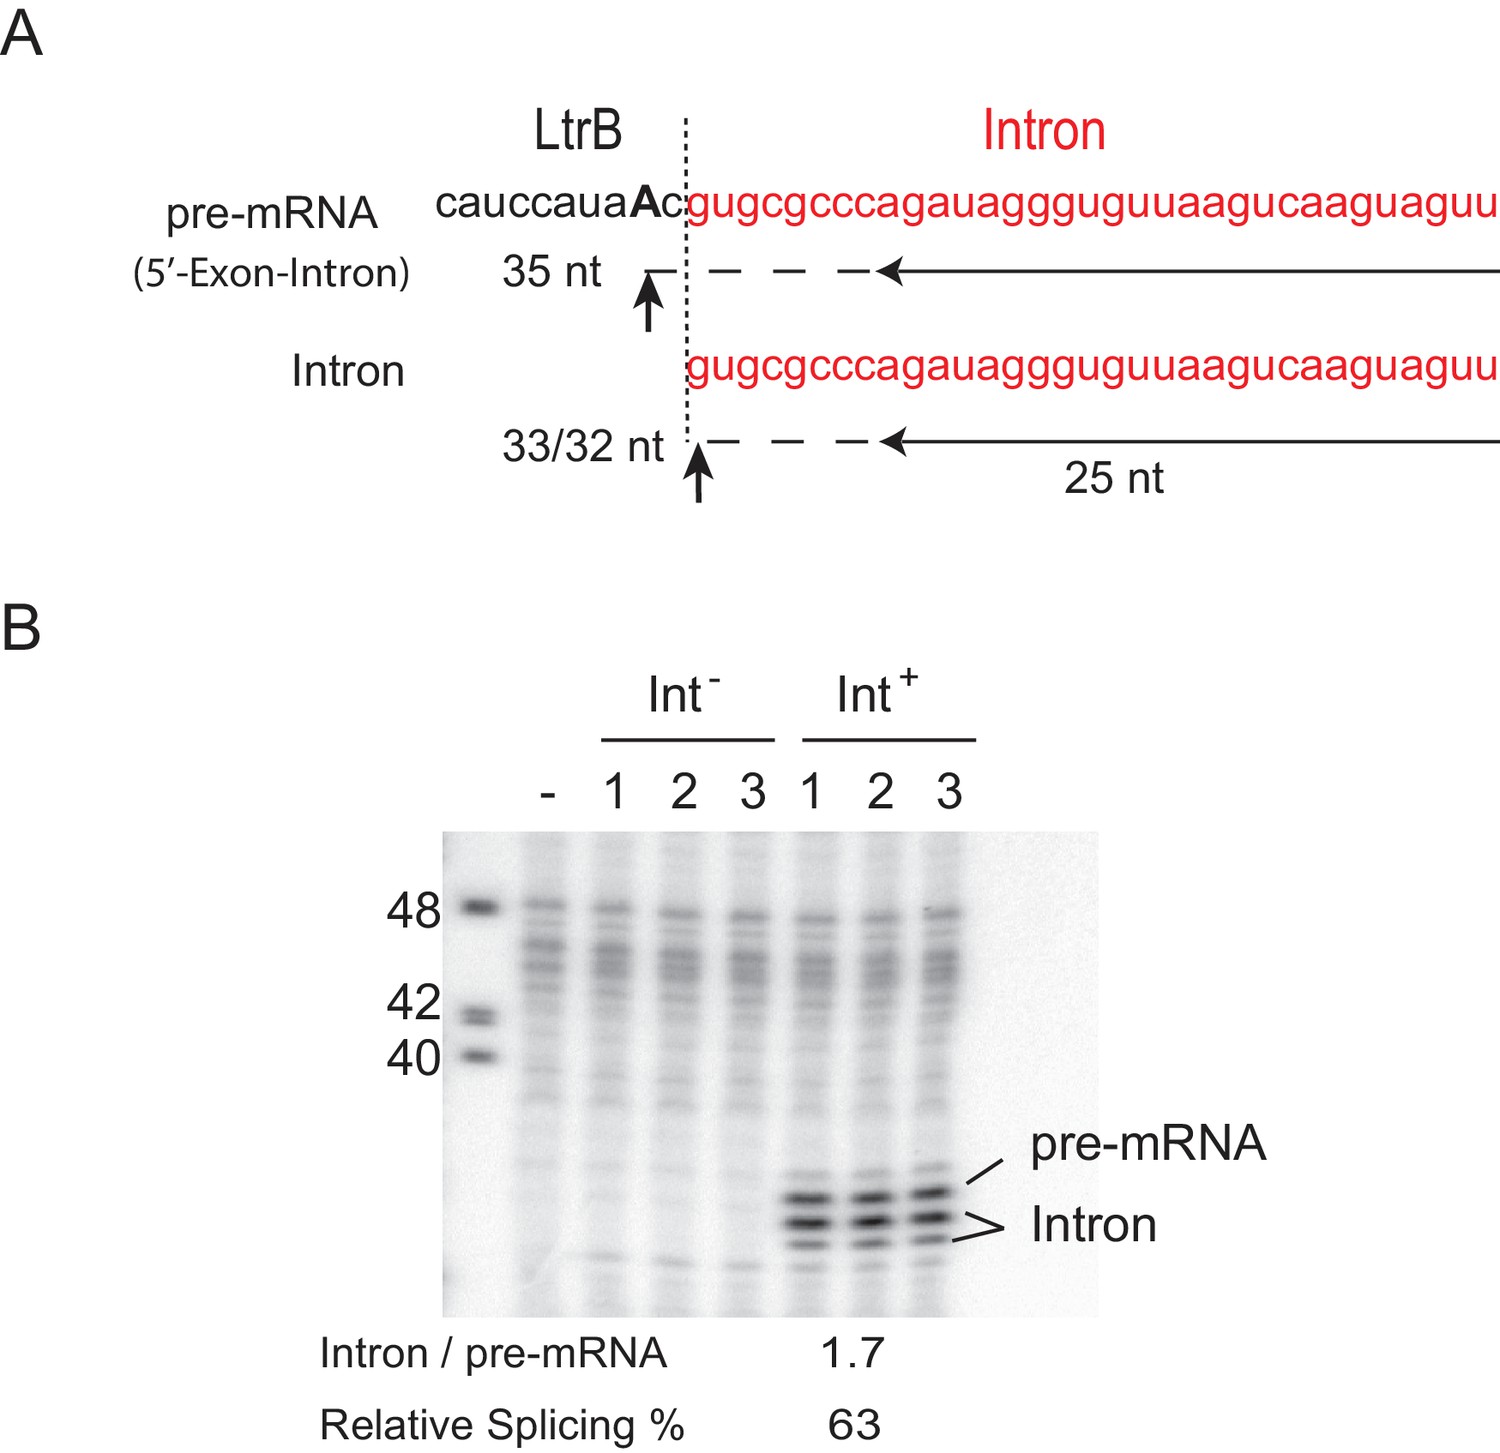
Determination of splicing efficiency by reverse transcription analyses.
(A) Diagram of a termination assay designed to determine the level of spliced intron relative to the Int+ pre-mRNA (represented by 5′-Exon-Intron). Intron and exon sequence are in red and black respectively. Boundary between intron and 5′-exon is denoted as a dashed vertical line. Primer used (horizonatal arrow) and predicted sizes of cDNA products are shown. Reverse transcription terminates at the nearest upstream adenosine (bold and uppercase) for the pre-mRNA because the deoxythymidine 5′-triphosphate (dTTP) in the reaction is replaced with 2′,3′ dideoxythymidine 5′-triphosphate (ddTTP), and at the 5′ end for the spliced intron. Termination sites of the RNAs are indicated with up-ward arrows. (B) Primer extension to determine the relative level of spliced intron (Intron) was resolved on an 8% urea-polyacrylamide gel (n = 3). Three biological replicates for each strain are shown. cDNA to the spliced intron forms a doublet, maybe because of exonucleolytic nibbling back of a single nucleotide. Average amount of spliced intron (Intron) relative to pre-mRNA is shown below. Splicing efficiency is defined as the percentage of spliced intron (Intron) relative to the sum of pre-mRNA + Intron.
Figure 1—figure supplement 3
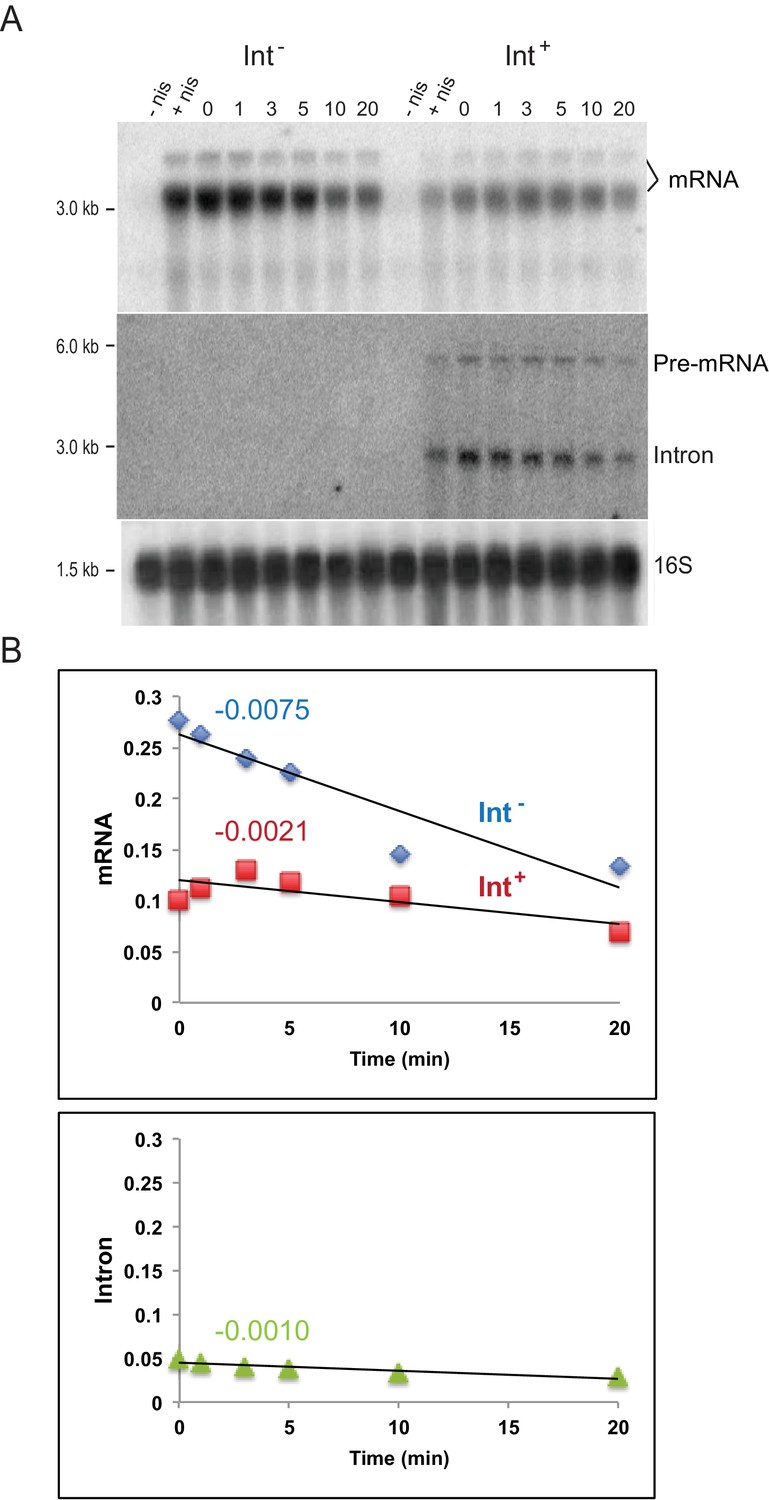
Intron may slow down interacting mRNA turnover.
(A) Northern blot analysis of RNAs expressed in cis after rifampicin treatment. Int-/Int+ plasmids were induced by nisin for gene expression for 30 min and then treated with rifampicin. Aliquots were taken at 0, 1, 3, 5, 10, and 20 min and RNA was probed for ltrB relaxase mRNA (bracket) and intron RNAs. The uninduced (-nis) and rifampicin untreated (+nis) were used as controls. Probing of the 16S rRNA was used for loading normalization. (B) Representative result of three biological replicates. Top: plot of mRNA abundance versus time of treatment in the Int+ (red square) (y = −0.0021x + 0.12, R2 = 0.62) and Int- (blue diamond) (y = −0.0075x + 0.2625, R2 = 0.87) cells; Bottom: plot of spliced intron (light green triangle) abundance versus time in the Int+ cells (y = −0.0009x + 0.0448, R2 = 0.85). Slope values are indicated above respective plots.
Figure 1—figure supplement 4

Polysomal profiling.
The mRNAs isolated from sucrose gradient fractions (odd-numbered, representative, ‘top’ and ‘bottom’ fractions of the gradient denoted) were visualized by Northern blotting (top panel). A vertical dashed red line denotes the boundary between polysomal (right of the line) and non-polysomal (left of the line) fractions, which were defined based on RNA gel electrophoresis (middle panel) and UV absorption spectrum (bottom panel). The non-polysomal portion is marked by the predominant occurrence of 30S (16S rRNA, Fraction 5) and 50S (23S rRNA, Fraction 7) ribosomal subunits, and ribosome monomer and dimers (Fraction 9, 11). The polysomal enrichment of mRNA (bracket in Northern blot) is defined as the fraction of total mRNA in the polysomal fractions (13-29) out of the total mRNA in all fractions (5-29). The average mRNA polysomal enrichment (biological replicates, n = 2) relative to Int- cells is shown at the bottom of gels. Control lanes ‘+” / ‘-”=total RNA from Int+/- cells.
Figure 2
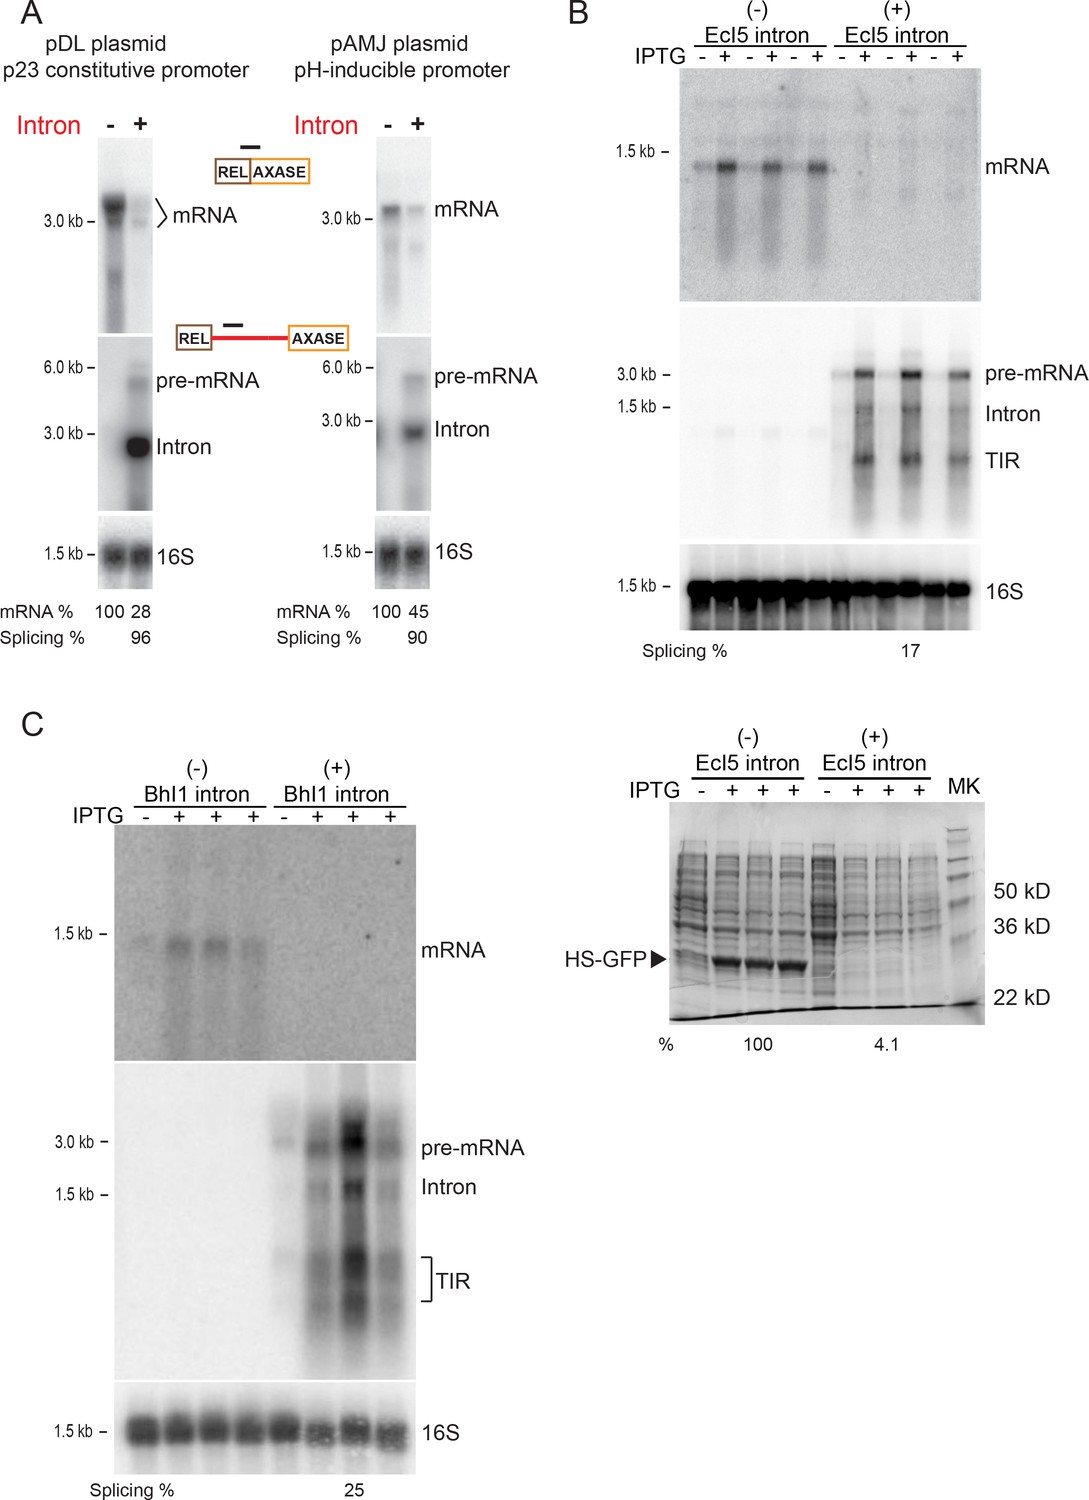
Reduction in gene expression persists with distinct plasmids, promoters, and group II introns.
(A) RNA expression in Int-/Int+ cells under p23 promoter on the pDL278 plasmid (left) and under pH-inducible promoter on the pAMJ328 plasmid (right). RNAs in the Int-/Int+ cells were analyzed by Northern blotting using probes specific for mRNA (top), intron RNA (middle) and 16S rRNA (bottom, loading control). Quantitation of mRNA and splicing, normalized to 16S rRNA, is denoted at the bottom of image. Splicing efficiency is defined as the percentage of the spliced intron relative to the sum of pre-mRNA and spliced intron. (B) EcI5 and (C) BhI1 group II introns cause reduced expression of mRNA. Group II intron-containing (EcI5+/BhI1+) or the ligated exons (EcI5-/BhI1-) were fused to the coding sequence of GFP reporter. RNAs were analyzed by Northern blotting using probes specific for mRNA (top), intron (middle), and 16S (bottom, loading control). Splicing efficiency is defined as the percentage of the spliced intron relative to the sum of pre-mRNA and spliced intron. Splicing of both introns was at relatively low efficiency (EcI5: 17%; BhI1: 25%), which could be attributed to an inherent property of these introns in E. coli, or to improper IEP protein folding. For EcI5, analysis of the HS-GFP protein on a coomassie stained 12% SDS-polyacrylamide gel and relative protein levels are shown (B, bottom panel). TIR = Truncated Intron RNA. Biological replicates, n = 3. IPTG induced (+) and uninduced (-) Int-/Int+ strains are shown.
Figure 3
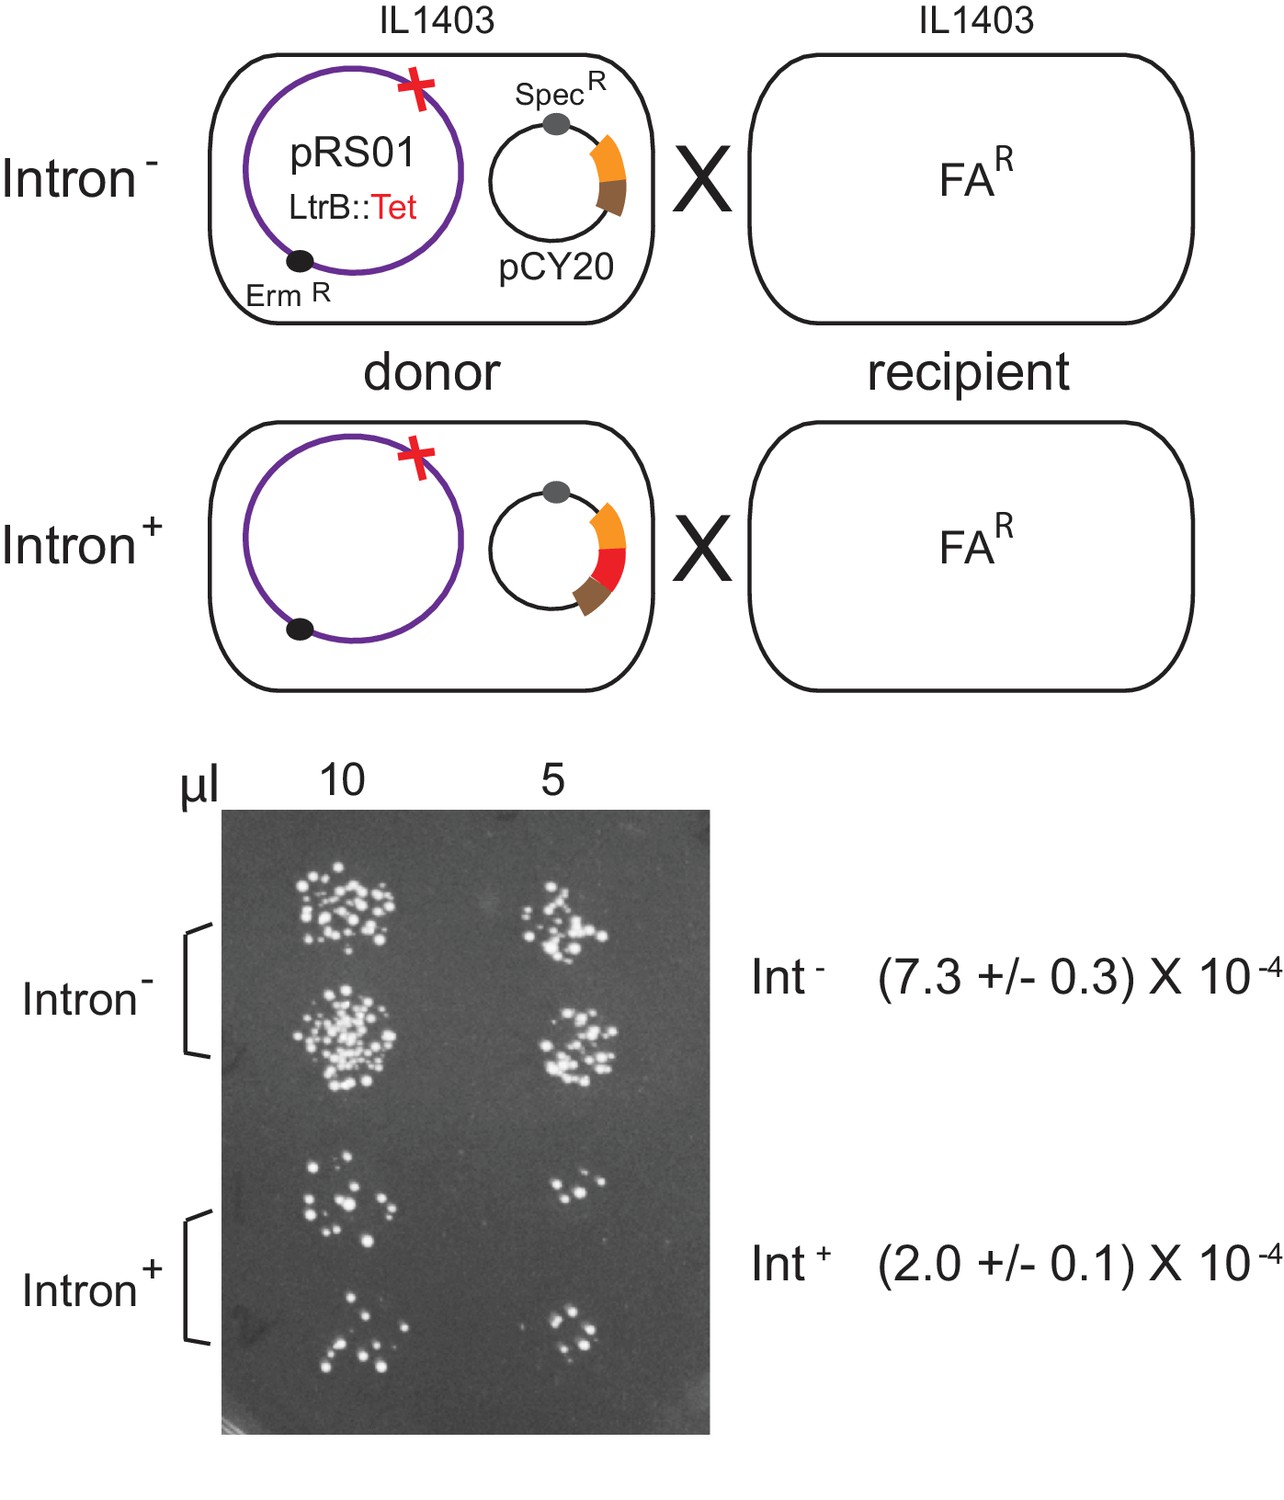
Inhibition of pRS01 conjugation by Ll.LtrB group II intron.
Top, mating diagrams of IL1403 donor with IL1403-FAR recipient. Donor cells contain pRS01 (ermR), with ltrB interrupted by a tet gene (red cross), co-expressed with Int- or Int+ (red bar) relaxase (brown and orange bars) from plasmid pCY20. Bottom, representative conjugation result. Spotting of 10 and 5 μl of donor plus recipient conjugation mix (two replicates per donor) on plates containing FA and Erm to select for transconjugants. Conjugation frequencies are shown (n = 2, p<0.05 based on two-tailed t-test with two-sample unequal variance).
Figure 4
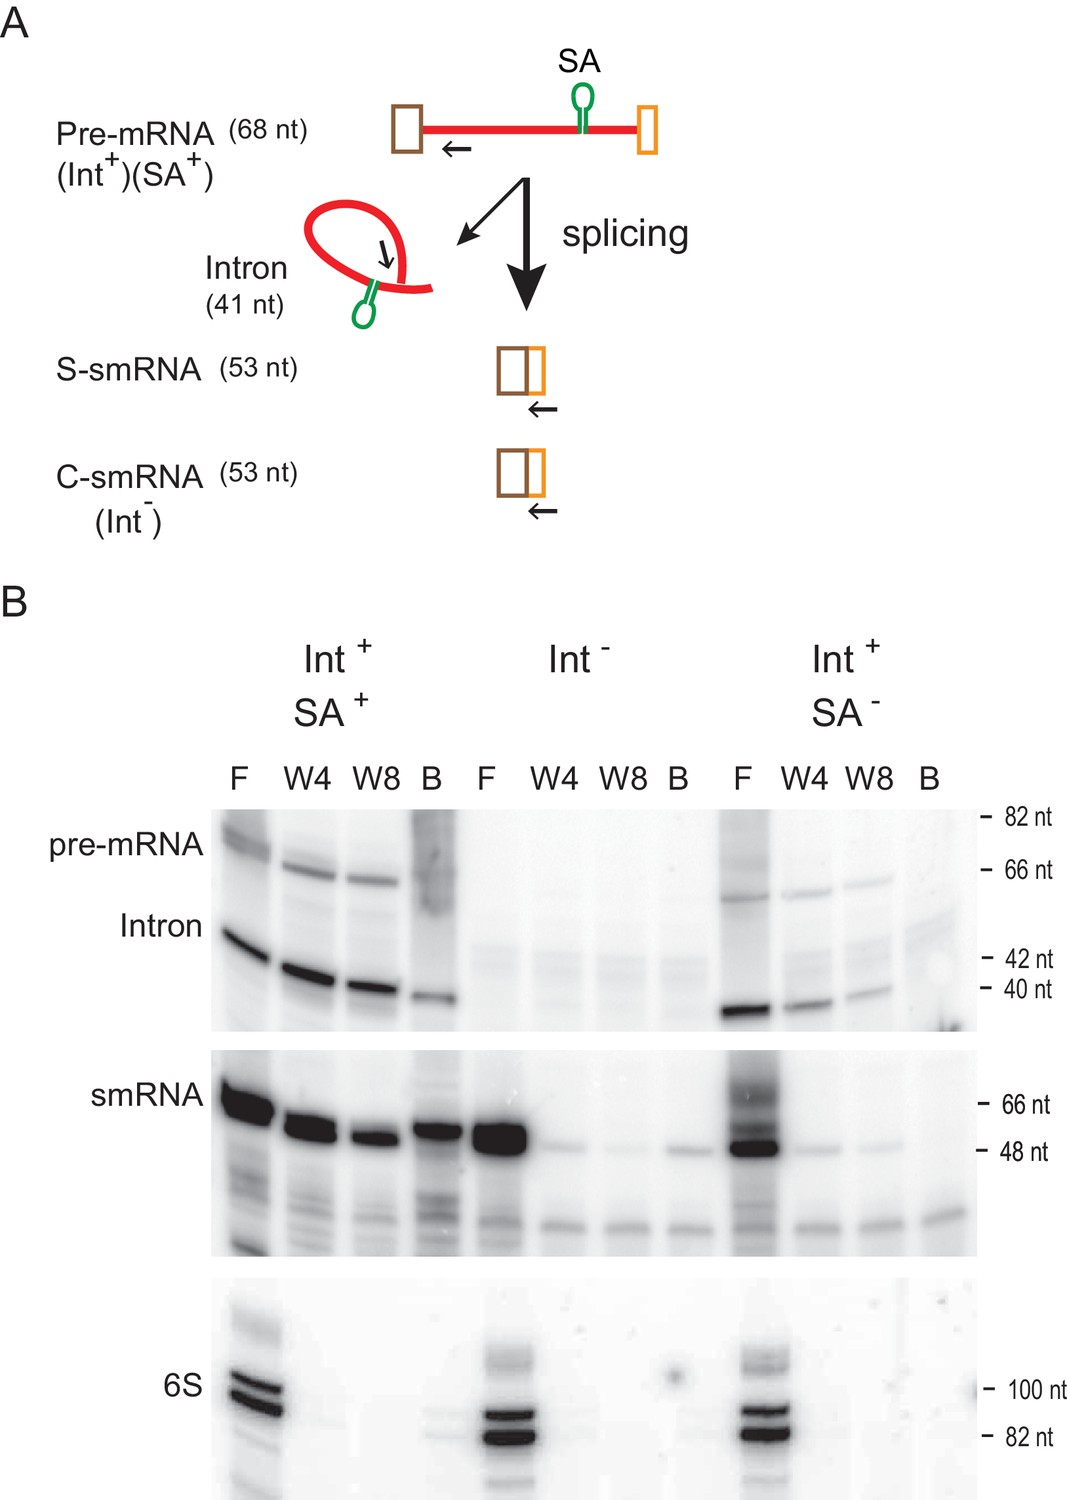
RNA-RNA interaction between intron and mRNA.
(A) Schematic of construct harboring RNA aptamer. Pre-mRNA bears the Ll.LtrB intron (red line), which is flanked by small exons (brown and orange boxes). The RNA streptavidin aptamer (SA) is shown as a green stem-loop. Splicing of the aptamer-containing (Int+SA+) or aptamer-less (Int+SA-) pre-mRNA produces small ligated exons (S-smRNA) that have the same sequence as the control small mRNA (C-smRNA) generated from the intron-less construct (Int-). Primers IDT5078 and IDT1073 were used for analysis of smRNAs and intron RNAs (pre-mRNA and spliced intron), respectively, in panel below and are indicated as arrows. (B) mRNA binds to the intron (representative result of three biological replicates). RNAs with the SA aptamer were purified using streptavidin resin and were detected by reverse transcription using 5′- 32P-labeled primers specific for smRNAs and intron RNAs (pre-mRNA and Intron). The cDNA products were resolved on an 8% urea-polyacrylamide gel. Cellular 6S non-coding RNA was used as a loading control. F, flow-through; W4, the fourth wash; W8, the eighth wash, B, resin-bound.
Figure 5 with 2 supplements
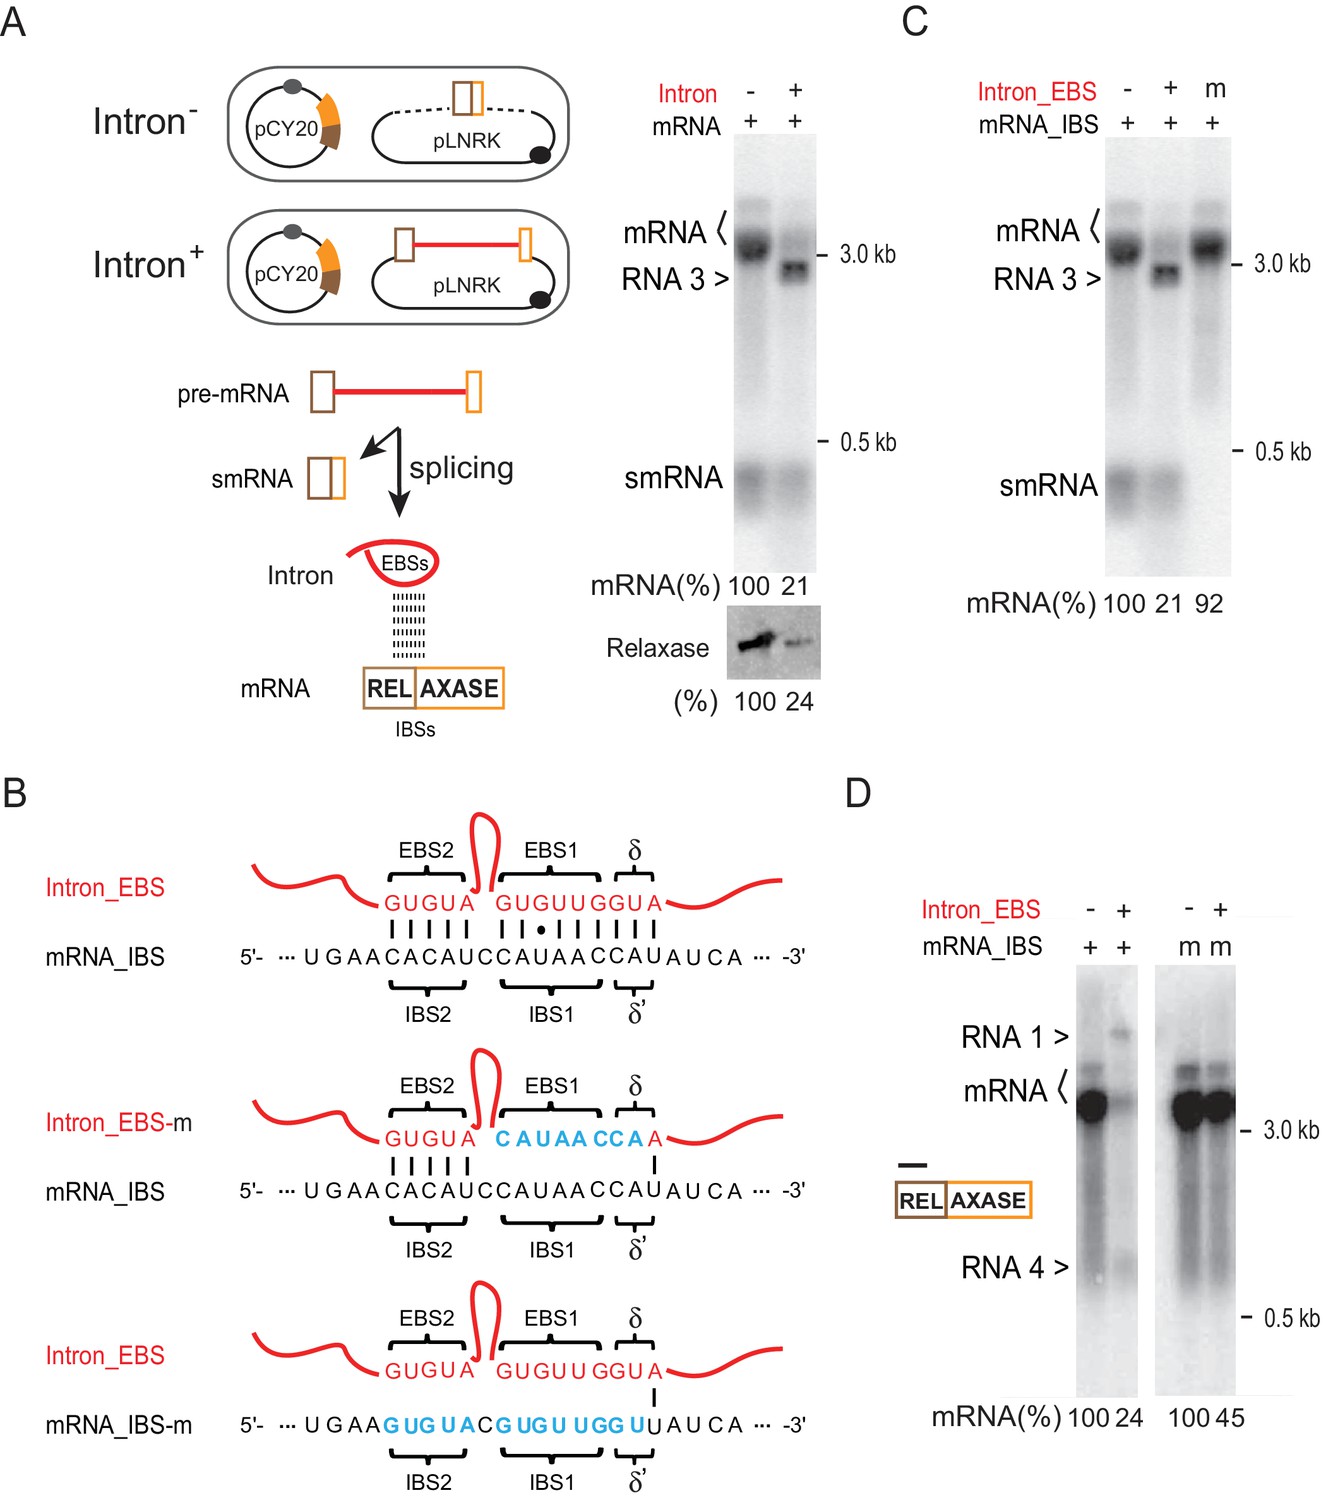
Intron-mRNA interaction causes mRNA inhibition.
(A) Intron in trans expression system. In the schematic, ltrB relaxase mRNA (brown and orange bars), from plasmid pCY20, was co-expressed with the Ll.LtrB group II intron (red line) flanked with small exons (brown and orange boxes) from plasmid pLNRK (camR) (Intron+). Co-expression of the mRNA with an intron-less allele was used as the control (Intron-). This system was used in assays shown in panels C-D. Splicing of the intron-containing pre-mRNA generates small mRNA (smRNA) and Intron, and the latter is proposed to interact with the mRNA via EBS and IBS base pairing. To the right, mRNAs were analyzed by Northern blotting (top) as in Figure 1B, and LtrB relaxase protein was analyzed by Western blotting as in Figure 1C (bottom). Representative data of three biological replicates is shown. Quantitation of mRNA (two bands, bracketed) and protein levels are denoted at the bottom of the images. Dagger (>), unexpected product (identified in Figures 5 and 6 as RNA 3). (B) EBS–IBS interaction sequences. WT (wt) and mutated (m) Intron_EBS (red) and mRNA_ IBS (black) sequences are shown with Watson–Crick pairs between them indicated as vertical bars and the wobble U:G pairs shown as a dot. Nucleotide substitutions in mutated EBS-IBS sequences are shown in blue. (C) Effect of EBS mutation on mRNA levels. mRNAs (two bands, bracketed) were analyzed by Northern blotting (top) as in Figure 1B. Quantitation of mRNA levels (derived from three biological replicates) is denoted at the bottom. Dagger (>), unexpected product (identified in Figures 5 and 6 as RNA 3). (D) Effect of IBS mutation on mRNA levels. RNAs were analyzed by Northern blotting with a 5′-exon specific probe (black bar). Quantitation of mRNA (two bands, bracketed) levels (derived from three biological replicates) is denoted at the bottom. Daggers (>), unexpected products (identified in Figures 5 and 6 as RNA 1 and RNA 4).
Figure 5—figure supplement 1
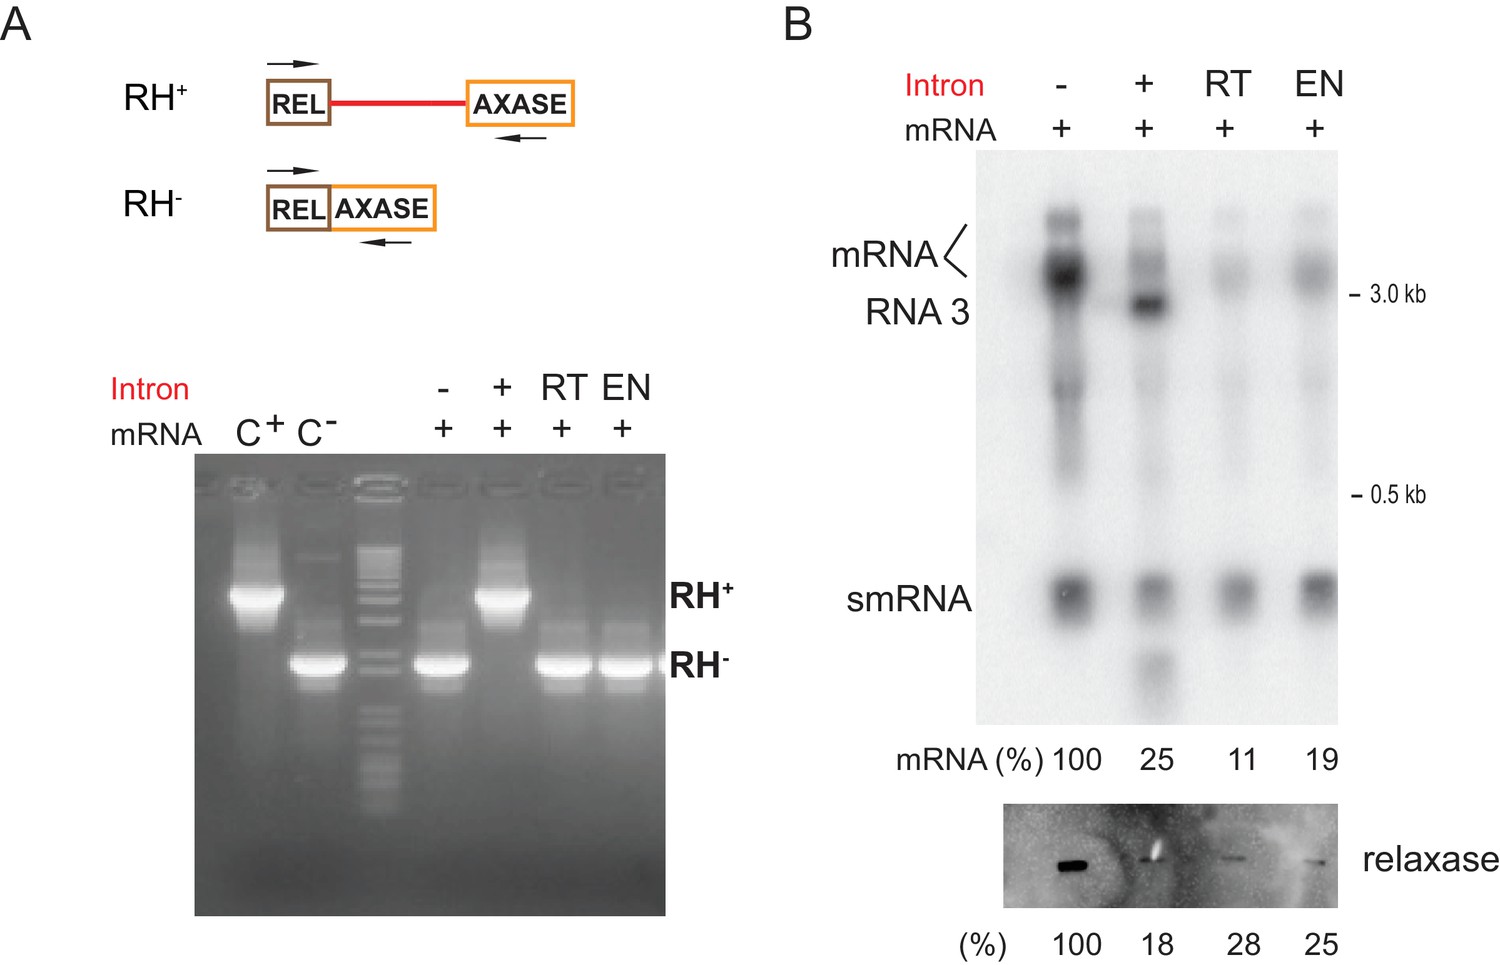
Reduction of gene expression is independent of retrohoming.
(A) Retrohoming loss in LtrA reverse transcriptase (RT) and DNA endonuclease (EN) mutants. PCR scheme is diagramed on the top. Amplification of Int-/Int+ ltrB relaxase gene, using the designated primer pair (arrows), generate amplicons of different sizes, depending on retrohoming (RH+/-). PCR products were analyzed by agarose gel electrophoresis and a representative image (three biological replicates) is shown at the bottom. C+ and C-: PCR positive and negative controls using pCY20 plasmids expressing intron-containing and intron-less ltrB relaxases, respectively. (B) Gene expression inhibition persists in RT and EN mutants. RNAs were analyzed by Northern blotting (top) as in Figure 1B. Intron splicing, which was indicated by the production of the smRNA, was not substantially affected in these mutants although mRNA levels were reduced, indicating no major splicing defects in these mutants. Representative result of three biological replicates is shown. Unexpected product (identified in Figures 5 and 6 as RNA 3) is shown, but appears to be absent in RT and EN mutants. LtrB relaxase protein levels were analyzed by Western blotting (bottom) as in Figure 1C.
Figure 5—figure supplement 2
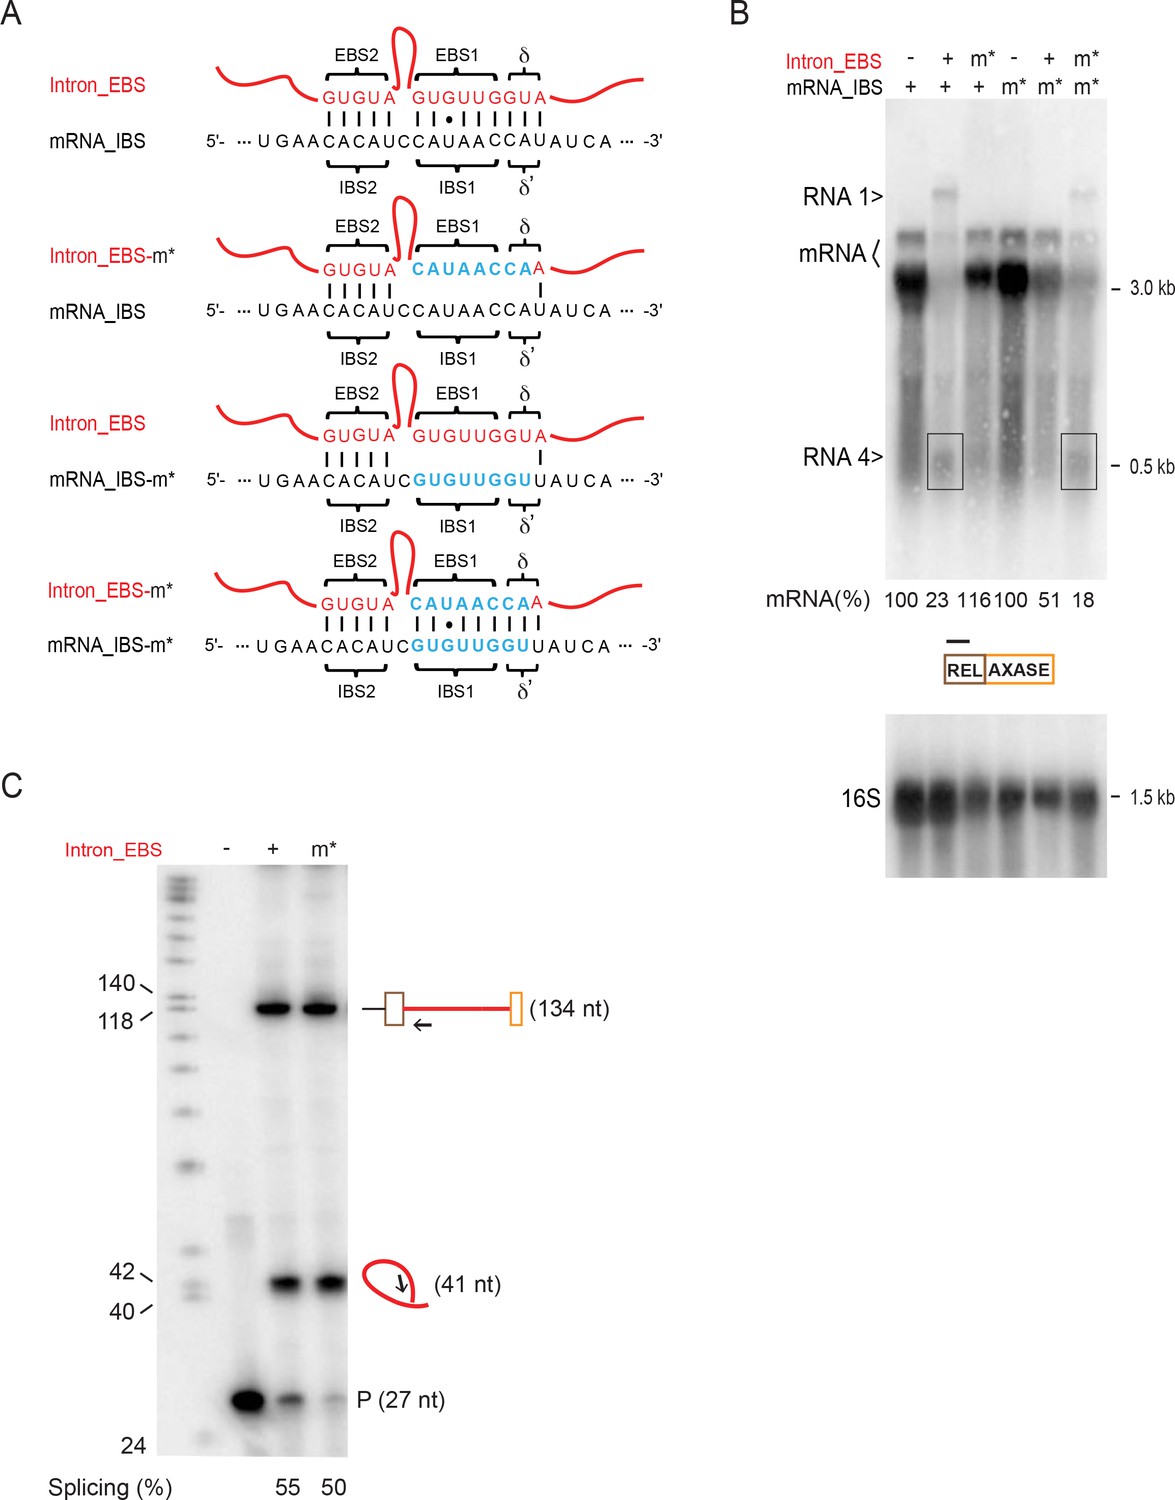
Complementation with EBS-IBS mutants shows mRNA targeting.
(A) EBS–IBS interaction sequences. WT (wt) and mutated (m*) Intron_EBS (red) and mRNA_ IBS (black) sequences are shown with Watson–Crick pairs between them indicated as vertical bars and the wobble U:G pairs shown as a dot. Nucleotide substitutions in mutated EBS and IBS sequences are shown in blue. (B) Effect of EBS and IBS mutations on mRNA levels. mRNAs (two bands, bracketed) were analyzed by Northern blotting (top) as in Figure 5D. Quantitation of mRNA levels (top), normalized to 16S (bottom) and relative to the appropriate wild type conditions (derived from three biological replicates), is denoted in the middle. Daggers (>), unexpected products (identified in Figures 5 and 6 as RNA 1 and 4, boxed). (C) Determination of intron splicing competence in the intron_EBSm* mutant by reverse transcription primer extension. Primer IDT1073 (black arrow, 27 nt) was used to extend to the transcription start site to identify the pre-mRNA (134 nt) or to the branch-point of the spliced intron lariat (41 nt). Splicing efficiency (%) is defined as the amount of spliced intron relative to total intron (pre-mRNA +spliced intron); P=Primer.
Figure 6 with 2 supplements
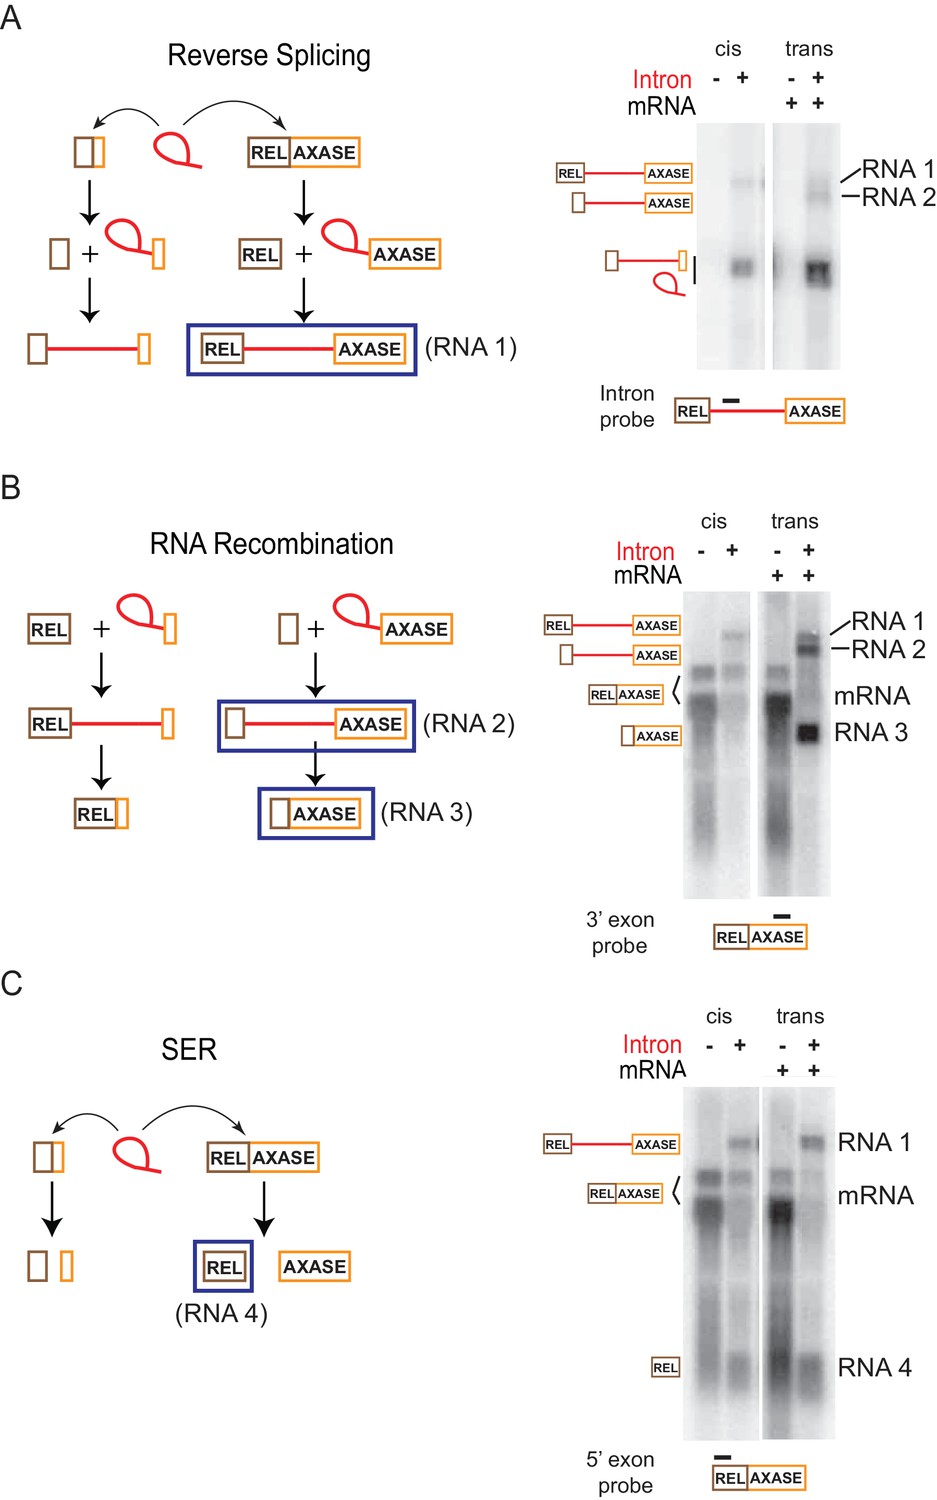
Retargeting mRNA by spliced intron.
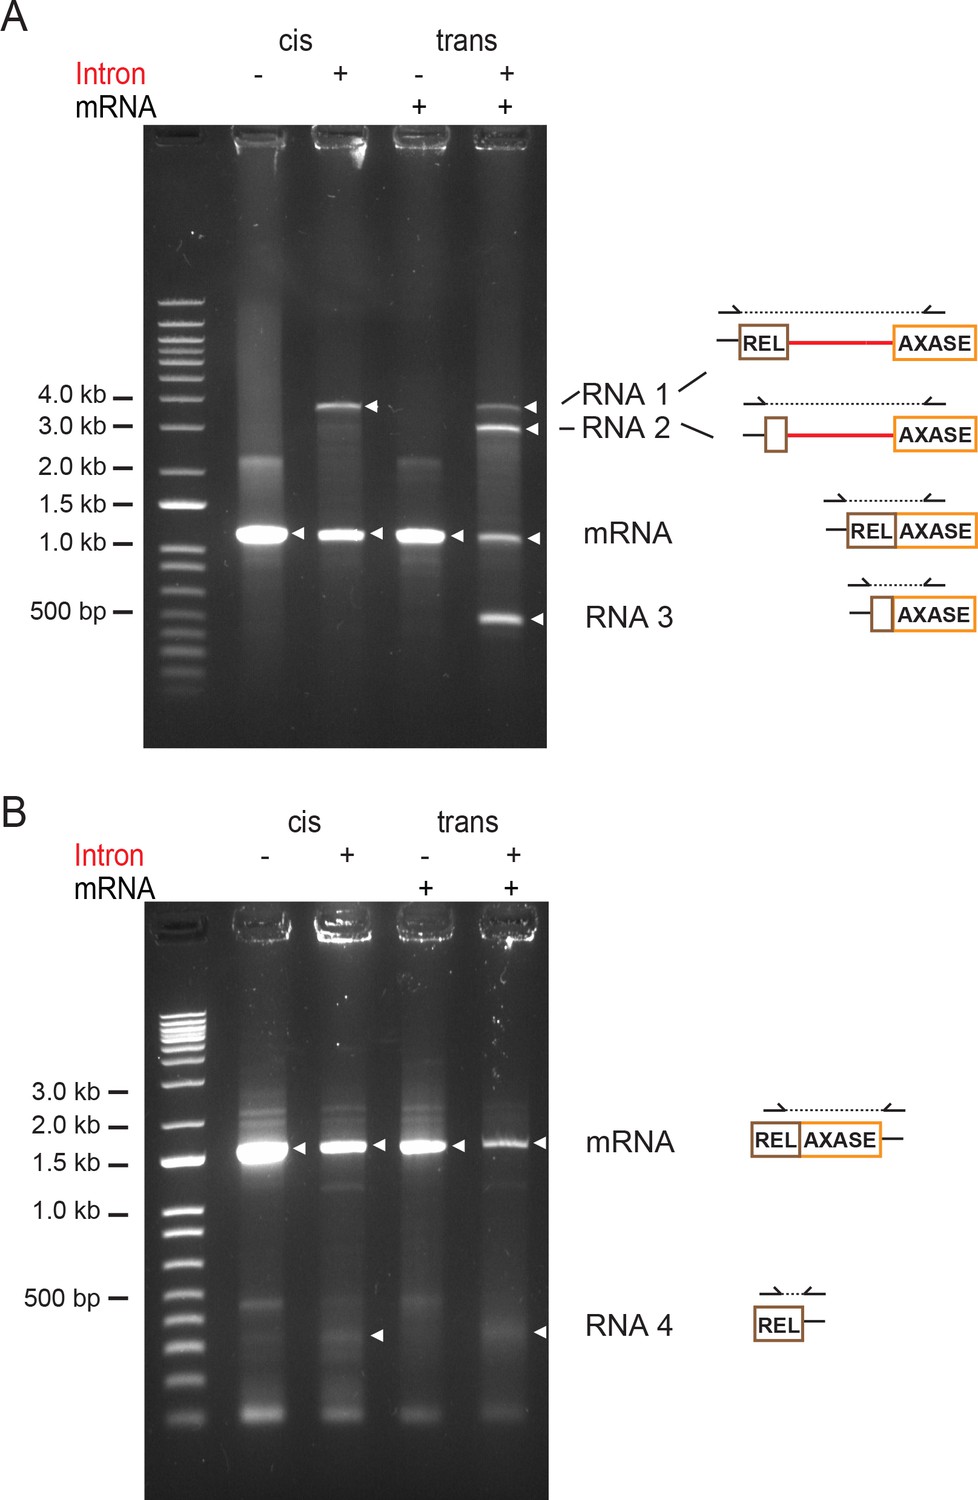
Proposed reactions in the in trans system as described in Figure 5A, are diagramed on the left and validated by Northern blotting (representative results of three biological replicates) on the right. (A) Reverse splicing into the mRNA. Left: The co-expressed full length ltrB relaxase mRNA or the smRNA (brown and orange boxes) are substrates of the intron ribozyme. Reverse splicing consists of two steps and generates two precursor forms. Right: RNAs expressed with the in trans system (right two lanes) were detected using an intron-specific probe (black bar), and compared to RNAs expressed in cis (left two lanes). This assay revealed both the predicted reverse splicing product (RNA 1), and an additional RNA product (RNA 2) resulting from the reaction shown in (B). (B) RNA recombination. Left: At the second step of reverse splicing, 5′-exons from the ltrB relaxase mRNA or the smRNA exchange with each other, thus producing chimeric intron precursors. These products could undergo forward splicing, thereby producing chimeric mRNAs. Right: RNAs expressed with the in trans system (right two lanes) were detected using a probe specific for the 3′-exon (black bar), and compared to RNAs expressed in cis (left two lanes). The mRNA was revealed as two bands (bracketed). This assay revealed both of the two predicted products resulting from RNA recombination (RNA 2, RNA 3), and also the RNA 1 product described in (A). (C) Spliced exons reopening (SER). Left: Either the relaxase mRNA or smRNA could be split by the intron at the exon-exon junction, thus freeing the 5′- and 3′-exons. Right: RNAs expressed with the in trans system (right two lanes) were detected using the probe specific for the 5′-exon (black bar), and compared to RNAs expressed in cis (left two lanes). The mRNA was revealed as two bands (bracketed). This assay revealed the predicted free 5′-exon of the relaxase mRNA (RNA 4) resulting from SER in both the in trans and in cis systems, and also the RNA 1 product described in (A).
Figure 6—figure supplement 1
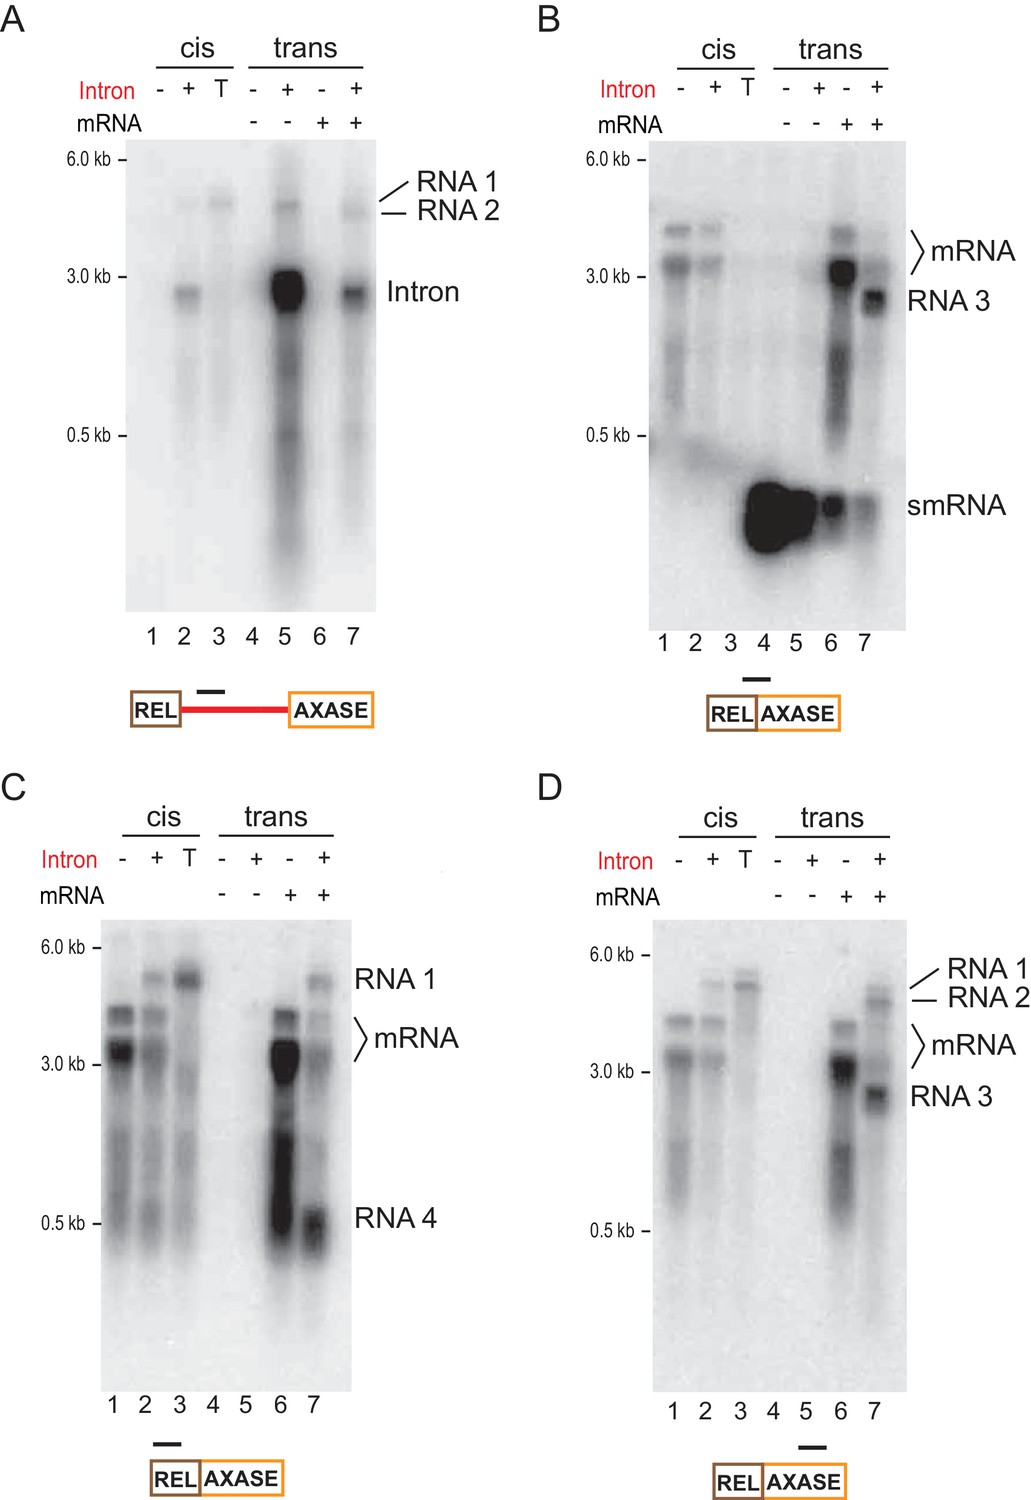
Characterization of mRNA retargeting reactions.
Northern blot analysis where RNAs were expressed in the Int-/Int+ cells with the intron in cis (left lanes) or in trans (right lanes). Representative results (three biological repliactes) are shown. RNA targets and the probes (black bar) are shown below. (A) The intron-specific probe reveals RNA 1 and RNA 2 (B) The mRNA splice junction specific probe reveals RNA 3. (C) The mRNA 5′-exon-specific probe reveals RNA 1 and RNA 4. (D) The mRNA 3′-exon-specific probe reveals RNA 1, RNA 2 and RNA 3.
Figure 6—figure supplement 2
Identification of mRNA targeting products 1–4 by 5' and 3' RACE.
5′ and 3′ RACE was performed on Int+ and Int- RNAs expressed from the cis and trans systems, followed by cDNA sequencing. PCR reactions resolved on 1.2% agarose gels are shown and the revealed RNAs are indicated with white triangles. Schematic to the right of gels shows the products, with half arrowheads indicating GSP (gene specific primer) and kit universal primers. Dotted line represents the PCR product. PCR products were excised and their identity was validated by DNA sequencing. (A) 5′ RACE. PCR reveals RNA 1, 2 and 3, as well as mRNA. (B) 3′ RACE. PCR reveals RNA 4, as well as mRNA. Notably, the PCR product marked as RNA 4 was faint and heterogeneous, and random sequencing of resulting DNA clones revealed a mixture of free 5′ exon sequences with diverse 3′ ends.
Figure 7
mRNA retargeting requires EBS-IBS interaction.
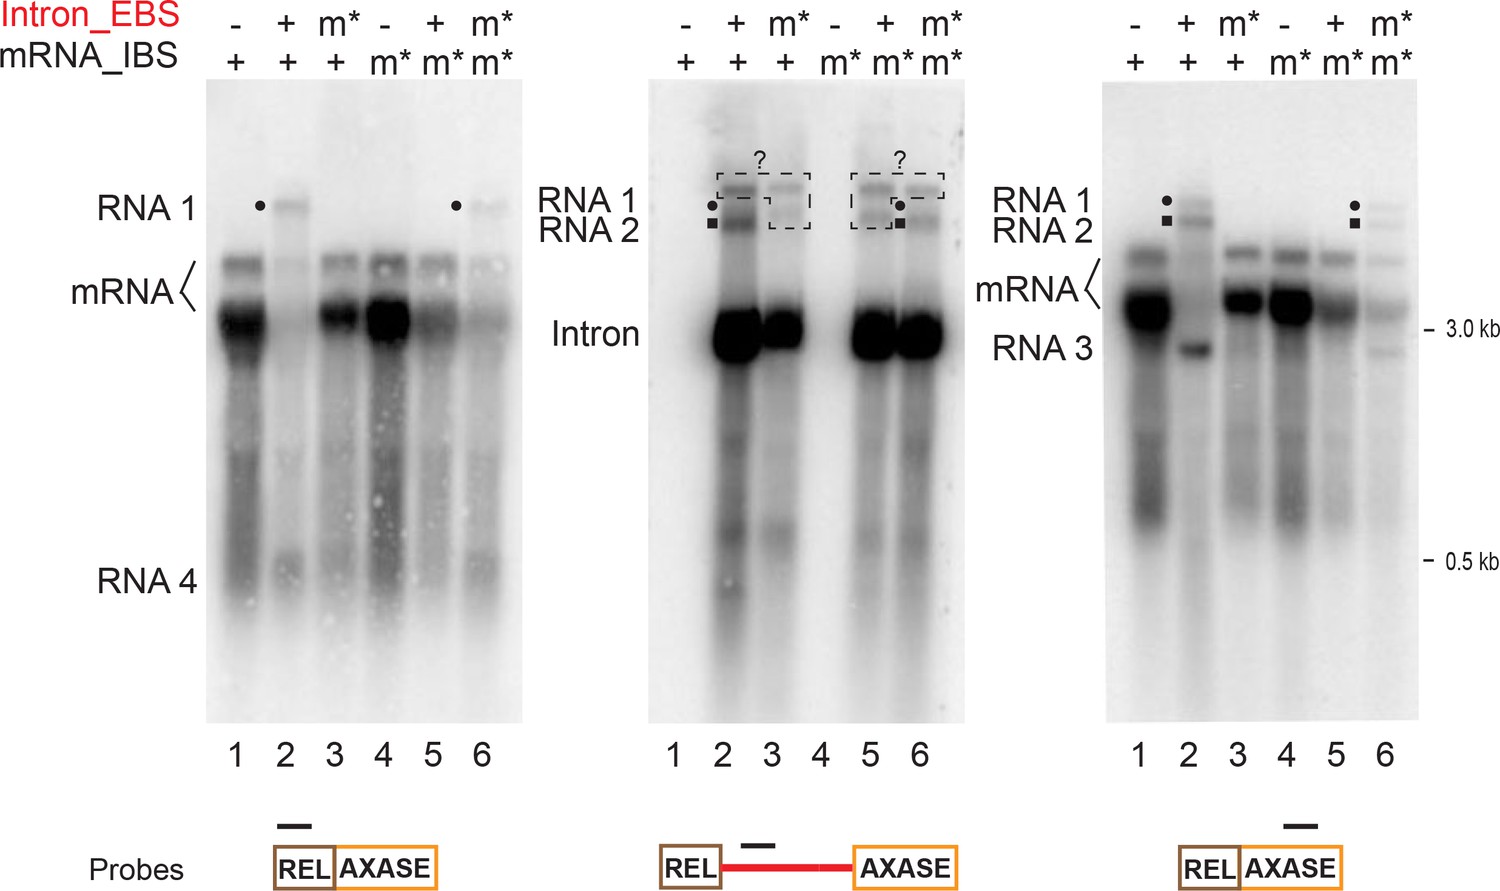
RNAs expressed using the in trans system (Figure 5A), with both wild-type mRNA (lanes 1–3) or the mRNA_IBS mutants (m*, lanes 4–6), in the presence or absence of the wild-type intron (+/-) or the intron_EBS mutant (m*), were analyzed by Northern blotting as in Figure 6 and Figure 6—figure supplement 1 and representative results of three biological replicates are shown. The mRNA retargeting products (RNAs 1–4, and RNAs 1 and 2 denoted with a black circle or square, respectively) indicated on the left, appear with the wild-type mRNA (two bands, bracketed) in the presence of the wild-type intron. RNA signals revealed by intron-specific probing (middle panel) are boxed and denoted with ‘?’ as their identities are unknown, because they were absent in the 5′- and 3′-exon specific probing (left and right panels). RNAs 1–4 are absent in the mutants Intron_EBSm* (lanes 3) and mRNA_IBSm* (lanes 5) where EBS-IBS pairing cannot form. Notably, these bands appear when the two mutants can complement each other by EBS-IBS pairing (lanes 6).
Figure 8
Model for group II intron regulation of gene expression and pRS01 conjugation.
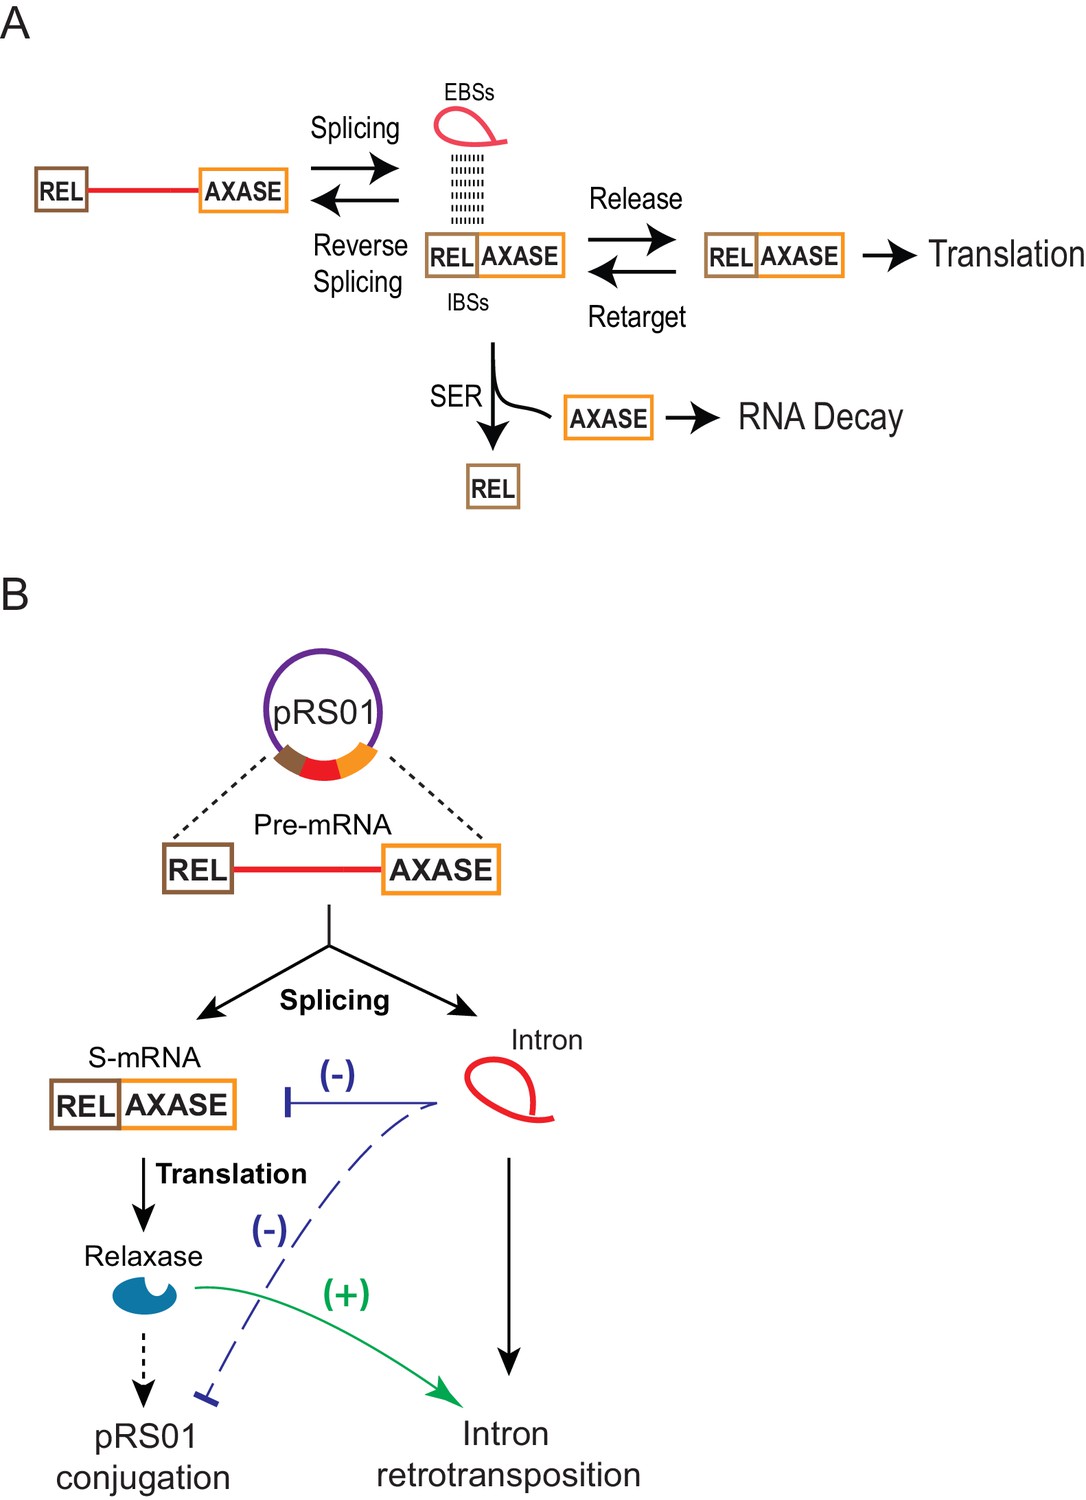
(A) How the group II intron controls the mRNA. Intron-mRNA interaction via EBS-IBS base pairing is the basis of three biochemical processes: splicing, reverse splicing, and spliced exons reopening (SER). While all these reactions could affect mRNA levels, SER is a major driver of the mRNA loss. It splits the mRNA into free 5′- and 3′-exons, the latter of which is susceptible to cellular RNA decay. Meanwhile, the intron could function as a ‘shelter’ that protects the mRNA that survives SER and is being retained within the intron from RNA decay. Because of these contradictory effects and equilibrium between pairs of reversible processes, a fraction of mRNA can be maintained for translation. (B) Functional interactions of the Ll.LtrB group II intron with the conjugative plasmid pRS01 through the intron host gene ltrB relaxase. Stimulation of retrotransposition by relaxase (green line), has been previously reported (Novikova et al., 2014). Reduced expression of ltrB relaxase by the intron (blue line) and its resulting reduction in pRS01conjugtaion (dashed blue line) as revealed in this study are shown.
Tables
Key resources table
| Reagent type (species) or resource | Designation | Source or reference | Identifiers | Additional information |
|---|---|---|---|---|
| Strain, strain background (Lactococcus lactis) | IL1403 | PMID: 11337471 | ||
| Strain, strain background (Lactococcus lactis) | IL1403 (FA-R) | Belfort Lab | Fusidic Acid Resistant | |
| Strain, strain background (Escherichia coli) | MC1061 | PMID:6997493 | ||
| Antibody | LtrB antibody | Gary Dunny, personal communication | ||
| Commercial assay or kit | QuikChange Lightning Site-Directed Mutagenesis Kit | Agilent, Santa Clara, CA | 210519 | |
| Commercial assay or kit | iScript cDNA Synthesis Kit | Bio-Rad, Hercules, CA | 1708890 | |
| Commercial assay or kit | iTaq Universal SYBR Green Supermix | Bio-Rad | 172–5120 | |
| Commercial assay or kit | 5' RACE System | Invitrogen, Carlsbad, CA | 18374058 | |
| Commercial assay or kit | 3' RACE System | Invitrogen | 18373019 | |
| Commercial assay or kit | SMARTer RACE 5'/3' kit | Takara, Mountain View, CA | 634860 |
Additional files
-
Supplementary file 1
Supplementary Table 1: Plasmids. Describes plasmids used in this study. Supplementary Table 2: DNA oligonucleotides. Describes DNA oligonucleotides used in this study. Supplementary Table 3: Primers used in qRT-PCR. Describes the primers used for qRT-PCR.
- https://doi.org/10.7554/eLife.34268.020
-
Transparent reporting form
- https://doi.org/10.7554/eLife.34268.021
Download links
A two-part list of links to download the article, or parts of the article, in various formats.
Downloads (link to download the article as PDF)
Open citations (links to open the citations from this article in various online reference manager services)
Cite this article (links to download the citations from this article in formats compatible with various reference manager tools)
Group II intron inhibits conjugative relaxase expression in bacteria by mRNA targeting
eLife 7:e34268.
https://doi.org/10.7554/eLife.34268


