Plasmacytoid dendritic cells control dengue and Chikungunya virus infections via IRF7-regulated interferon responses
- École Normale Supérieure de Lyon, Univ Lyon, France
- Institut Pasteur, France
- Genentech, United States
Figures
Figure 1 with 1 supplement

Lack of NF-κB response by pDCs in ex vivo coculture with DENV infected cells.
(A) Quantification of IFNα and TNFα in supernatants of human pDCs cocultured with DENV-infected (DENV cells) or uninfected BHK-21 cells (Mock), in presence of synthetic TLR7 agonist: Imiquimod; IMQ; 1 µg/mL or influenza infectious supernatant; Flu; 3 × 10³ FFU. (B) pDCs were pretreated for 3 hr with low-dose IFNβ (50 U/mL) and then cocultured or treated as in (A). Median, n = 3 independent experiments. (C–D) qRT-PCR analysis of gene expression (using mouse-specific primers) by WT murine splenic pDCs cocultured for 22 hr with uninfected- (mock cells) or DENV-infected Huh7.5.1 cells (DENV cells) or treated with TLR7/8 agonist (R848). Expression levels are normalized to housekeeping genes (β-actin) and shown as Z scores (red-blue gradient from maximum to minimum expression).
Figure 1—figure supplement 1
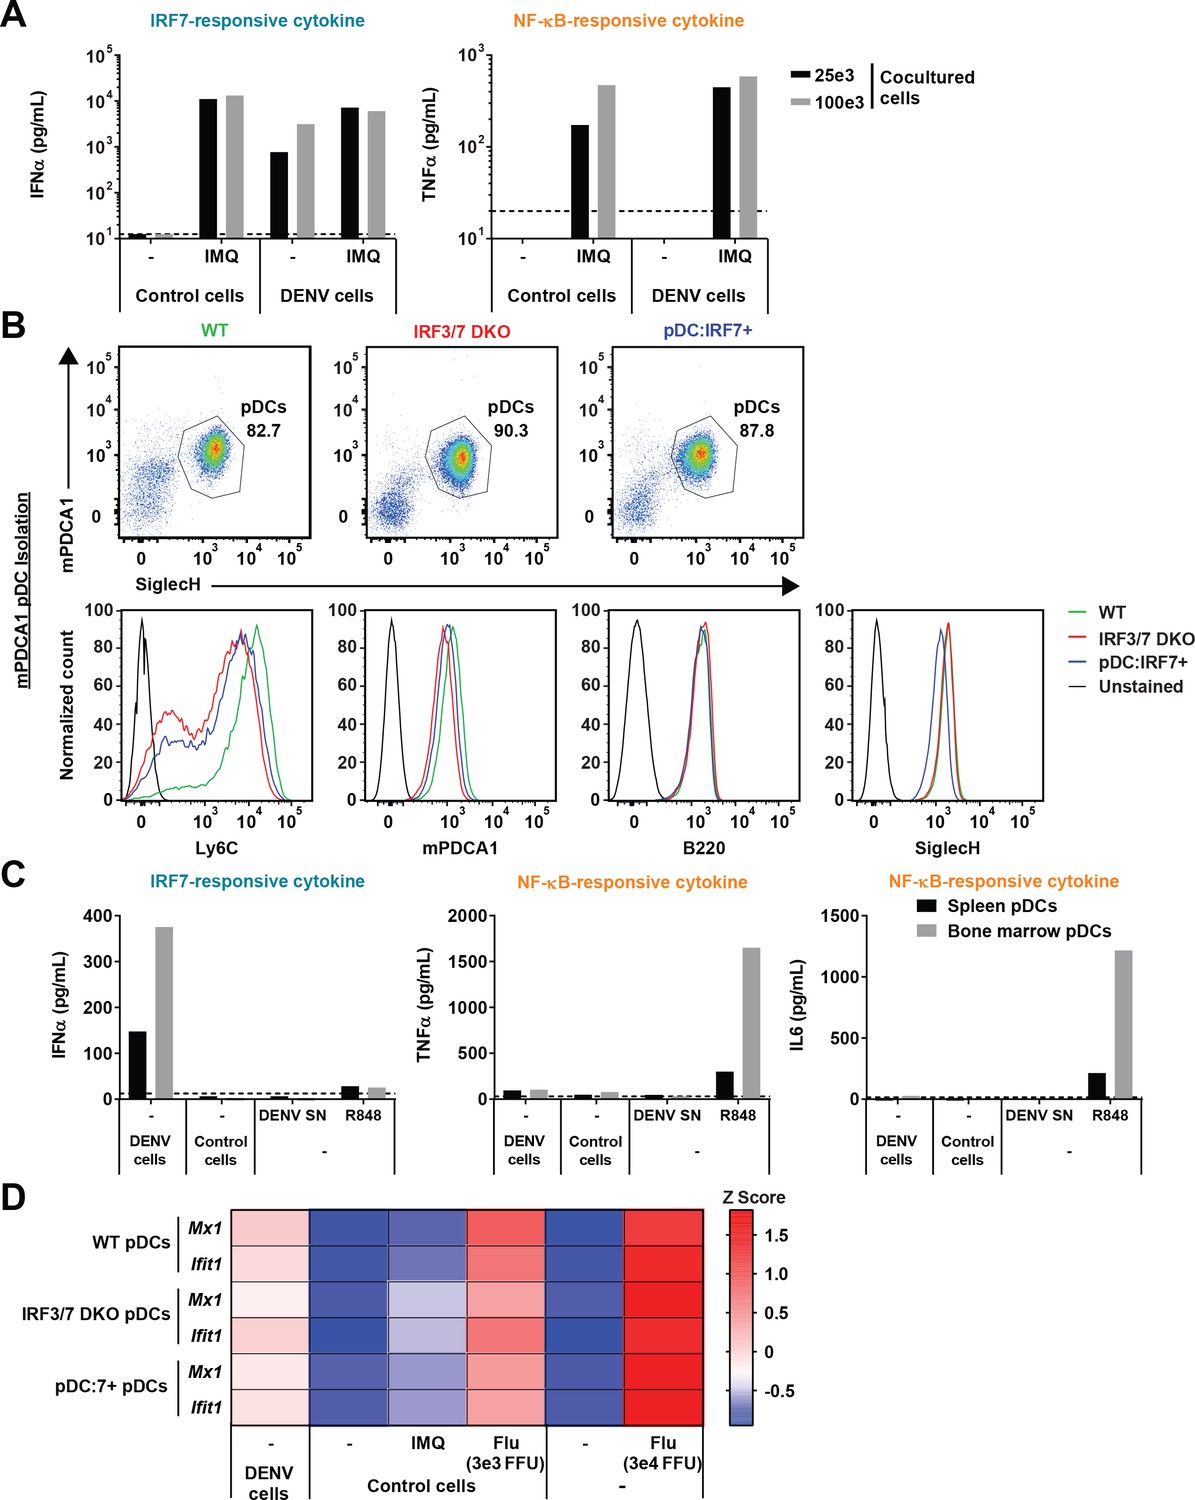
Lack of NF-κB responses to DENV in murine bone marrow and splenic pDCs, and retention of pDC ISG responses in the absence of Irf3/Irf7.
(A) DENV-infected cells do not inhibit NF-kB responses. pDCs isolated from human PBMCs were cocultured with the indicated number of DENV-infected BHK21 cells in the presence or not of the TLR7 agonist (IMQ; Imiquimod; 1 µg/mL). Quantification of IFNα and TNFα levels in supernatants after 22 hr of treatment/coculture; n = 1 independent experiment. (B) Purity of pDC isolated from mouse bone marrow (BM) of uninfected WT, Irf3/7 DKO, and pDC:Irf7+ mice by anti-mPDCA1 immuno-isolation. Purity was assessed by Siglec-H/mPDCA1 FACS staining. Note the reduced expression of activation/differentiation markers (Ly6C, mPDCA1) on pDCs from Irf3/7 DKO and pDC:Irf7+ genotypes relative to WT. (C) Robust IRF7 (IFNα) but not NF-κB (TNFα) responses to DENV in WT mouse pDCs. pDCs isolated from bone marrow or spleen of uninfected WT mouse were cocultured with DENV-infected (DENV cells) or uninfected (control cells) Huh7.5.1 cells, or were treated with DENV infectious supernatant (DENV SN) or TLR7 agonists (R848). Quantification of IFNα, TNFα, and IL6 levels in supernatants after 22 hr of treatment/coculture; representative of n = 3 independent experiments. (D) Functional pDC-intrinsic ISG response ex vivo in Irf3/7 DKO genotype. pDCs isolated from BM of WT, Irf3/7 DKO and pDC:Irf7+ mice were ex vivo cocultured with DENV-infected Huh7.5.1 cells (DENV cells) or were treated with TLR7 agonists (IMQ; 1 µg/mL), influenza infectious supernatant (Flu). The level of Mx1 and Ifit1 mRNA expression was quantified by qRT-PCR and normalized to a housekeeping gene (hprt1). Expression levels shown as Z-scores and presented as heat map with expression gradient from maximum (red) to minimum (blue); geometric mean of n = 2 replicates from one independent experiment.
Figure 2
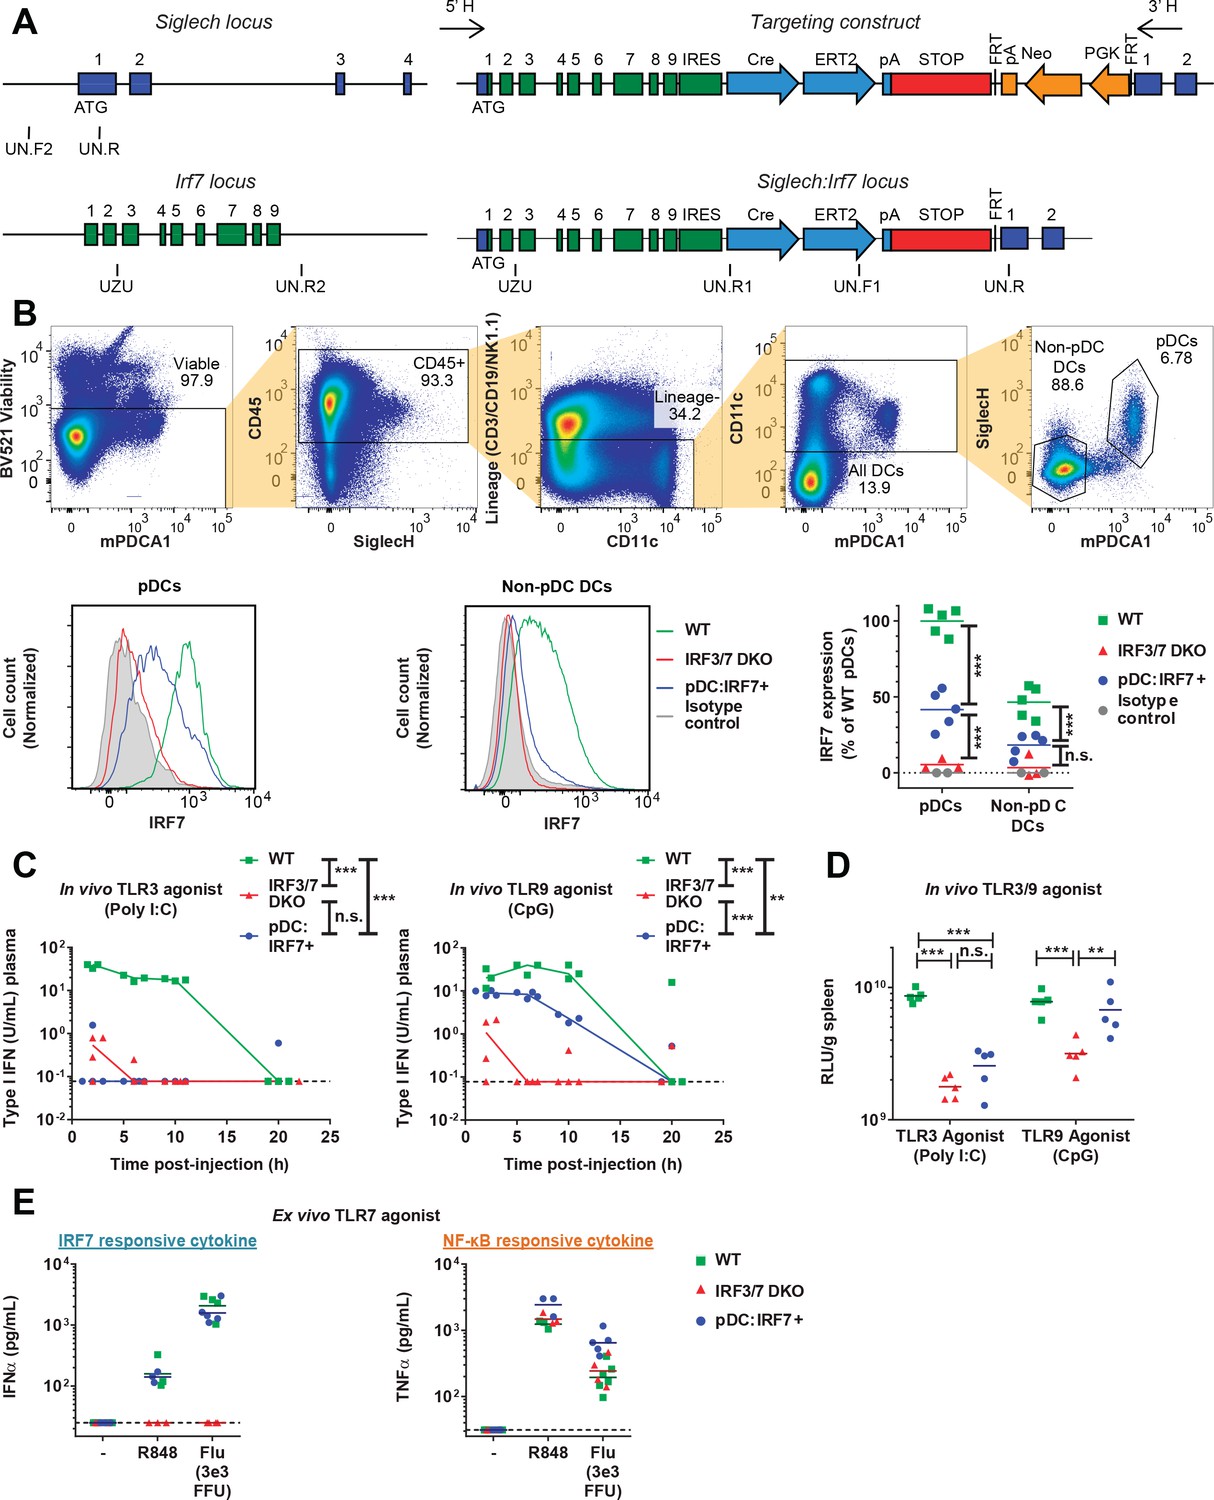
Functional validation of the pDC:Irf7+mouse model.
(A) Targeting construct for the knock-in of irf7 under the control of the siglech promoter. (B) Expression levels of IRF7 analyzed by FACS in pDCs and non-pDC DCs isolated from spleens of uninfected WT, Irf3/7 DKO and pDC:Irf7+ mice. Gating strategy for DCs and pDCs from splenocyte populations (upper panels), IRF7 expression (lower panels); 3–5 mice per condition. (C–D) Quantification of IFN activity by bioassay in plasma (C) and spleen homogenates (D) at various time-points post-injection of mice with agonists of TLR3 and TLR9, polyinosinic:polycytidylic acid (poly I:C) and CpG-type A oligodeoxynucleotides (CpG), respectively; median, n = 3–5 mice per condition. (E) Quantification of IFNα and TNFα in ex vivo cultures of pDCs (mPDCA1+ cells) isolated from BM of WT, Irf3/7 DKO and pDC:Irf7+ mice and treated for 22 hr with TLR7/8 agonist (R848) or influenza virus infectious supernatant (Flu); median, n = 3–5 mice per condition.
Figure 3 with 1 supplement
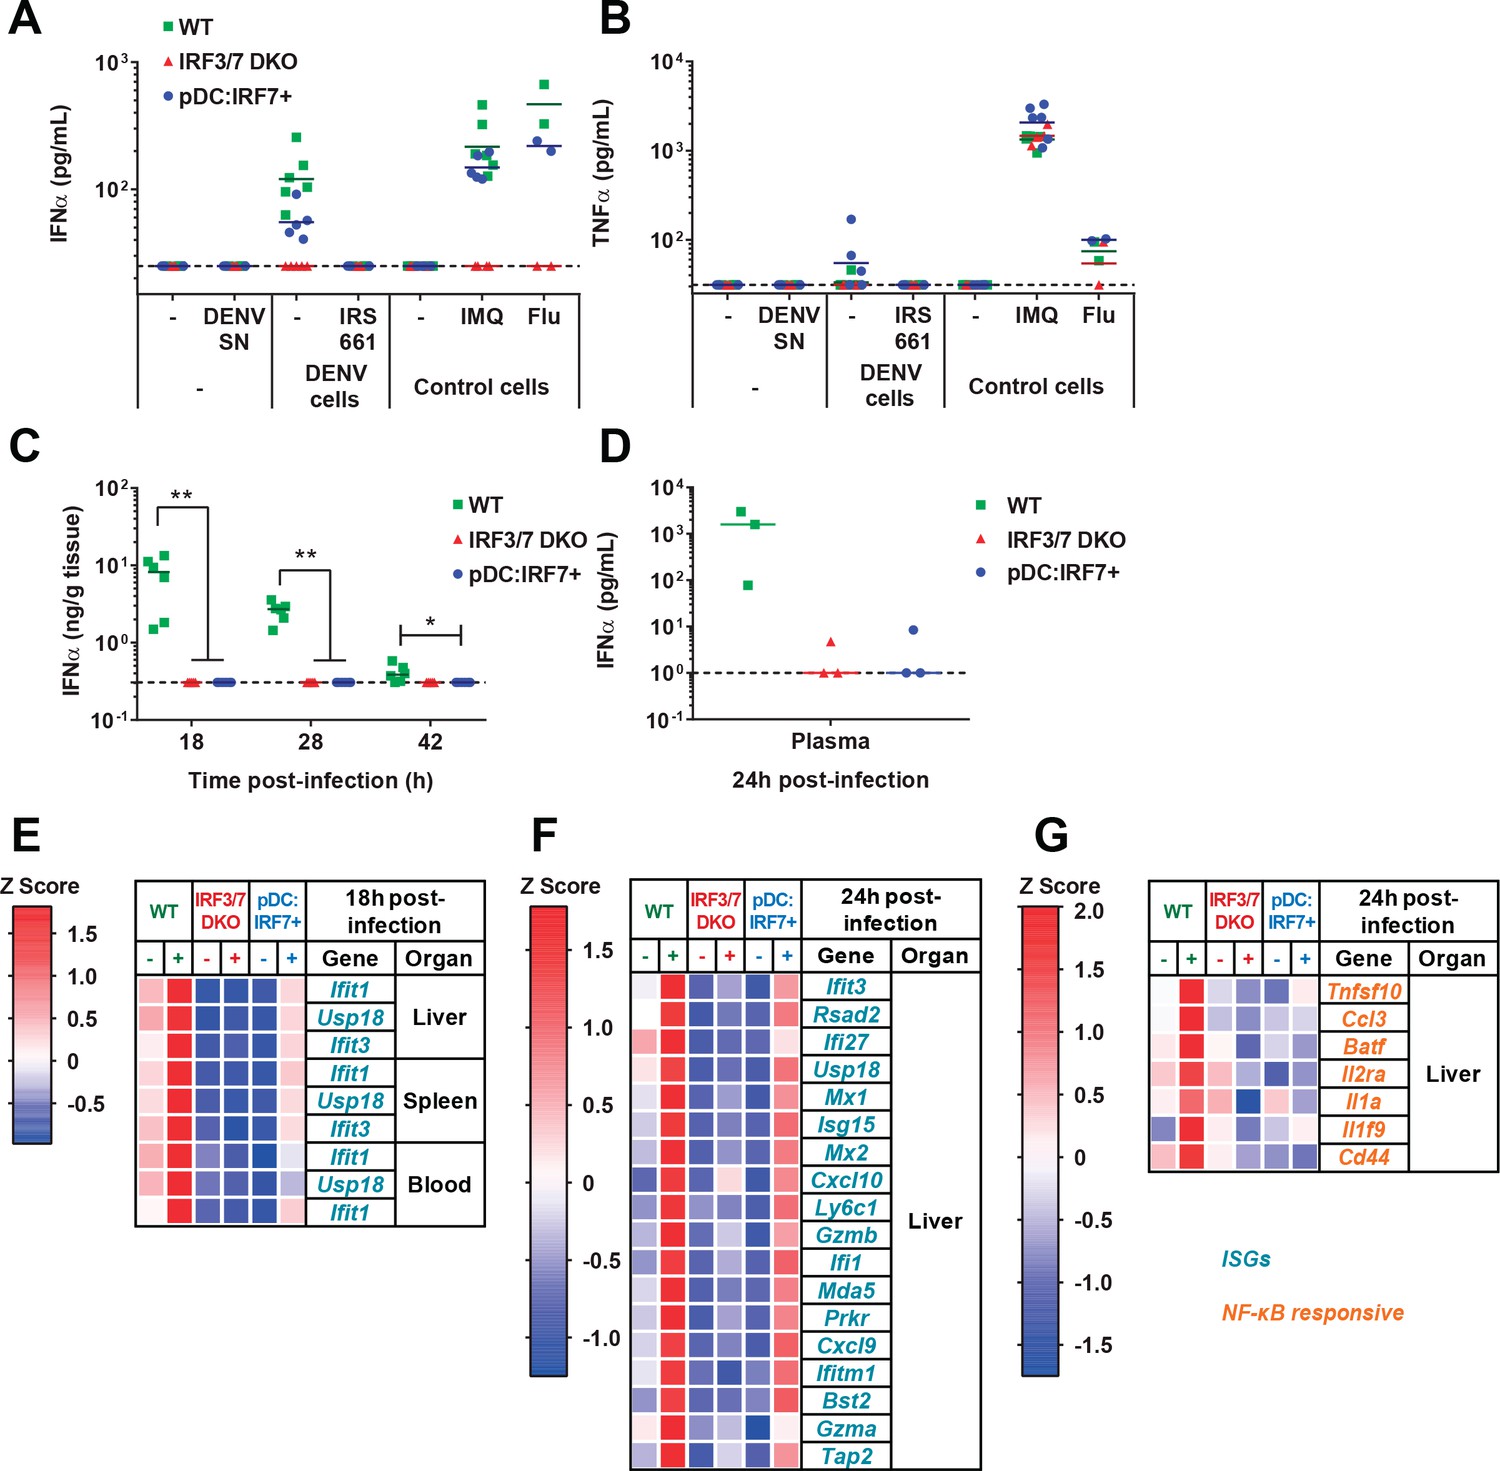
pDCs respond in vivo to DENV in a TLR7/IRF7 but not an NF-κB-dependent manner.
(A–B) Quantification of IFNα (A) and TNFα (B) by ELISA in ex vivo culture supernatants of pDCs isolated from BM of WT, Irf3/7 DKO and pDC:Irf7+ mice and treated for 22 hr with DENV infectious supernatant (DENV SN), TLR7 agonist (IMQ and flu, 3 × 10² ffu), or cocultured with DENV-infected Huh7.5.1 cells ± TLR7 inhibitor IRS661; median, n = 3–5 independent experiments. (C–G) Intravenous (i.v.) DENV infection followed by the analysis of IFNα and gene expression in organs collected at the indicated time points p.i. (C–D) Quantification of IFNα in spleen homogenates and plasma by ELISA; median; each data point corresponds to an individual mouse: n = 5–6 and n = 3 mice per condition, for spleen and plasma samples, respectively. IFNα was undetectable in uninfected control mice. (E–G) qRT-PCR analysis of gene expression in the indicated tissues at 18 hr (E) and 24 hr (F–G) p.i., and normalized to housekeeping panel (hprt1, β-actin, 18S). Expression levels shown as Z scores, n = 2 (E) or 3 (F–G) infected and n = 1 (E) or 2 (F–G) uninfected mice per genotype.
Figure 3—figure supplement 1
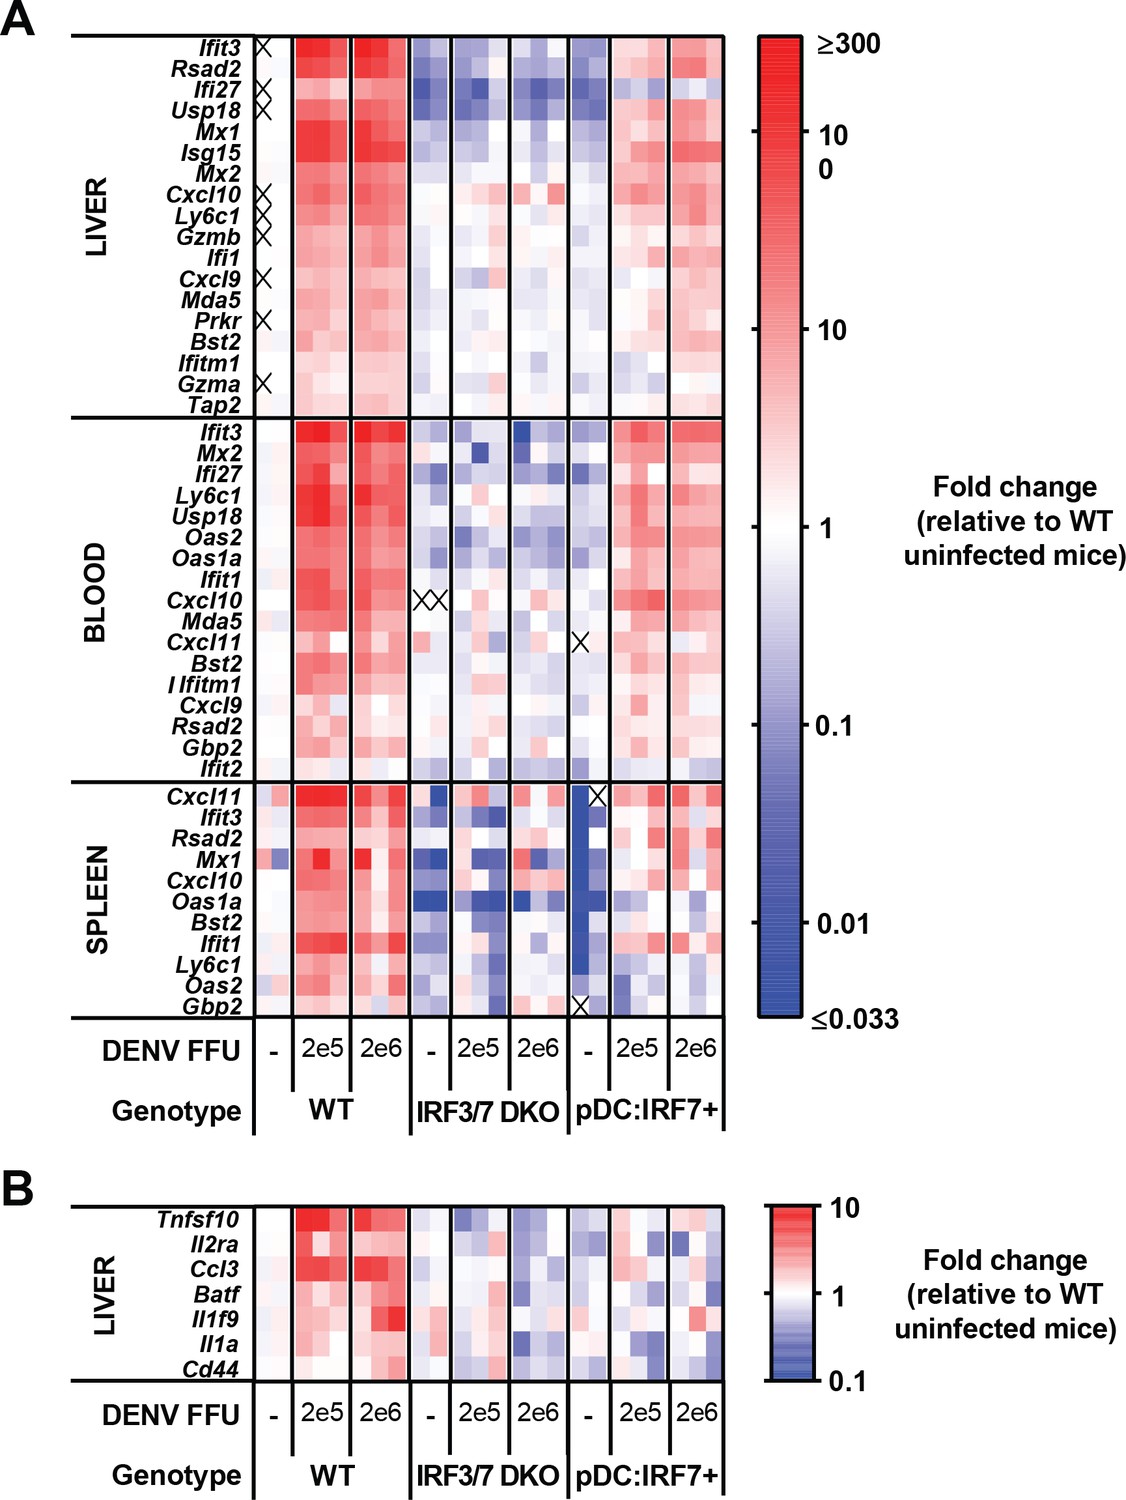
Strong early ISG but not NF-κB response to DENV occurs in organs of pDC:Irf7+mice.
WT, Irf3/7 DKO, and pDC:Irf7+ mice were infected i.v. with 2 × 10⁵ and 2 × 10⁶ FFU of DENV, and blood and spleens were collected at 24 h p.i.. The mRNA expression levels for each gene were assessed by qRT-PCR, ISGs (A) and NF-κB response (B). Results are presented as heat map with expression gradient demonstrating maximum- (red) and minimum- (blue) fold change relative to WT uninfected mice. Each column represents gene levels from one individual mouse. Gene transcript values were normalized to housekeeping genes (β-actin and 18S rRNA).
Figure 4 with 1 supplement
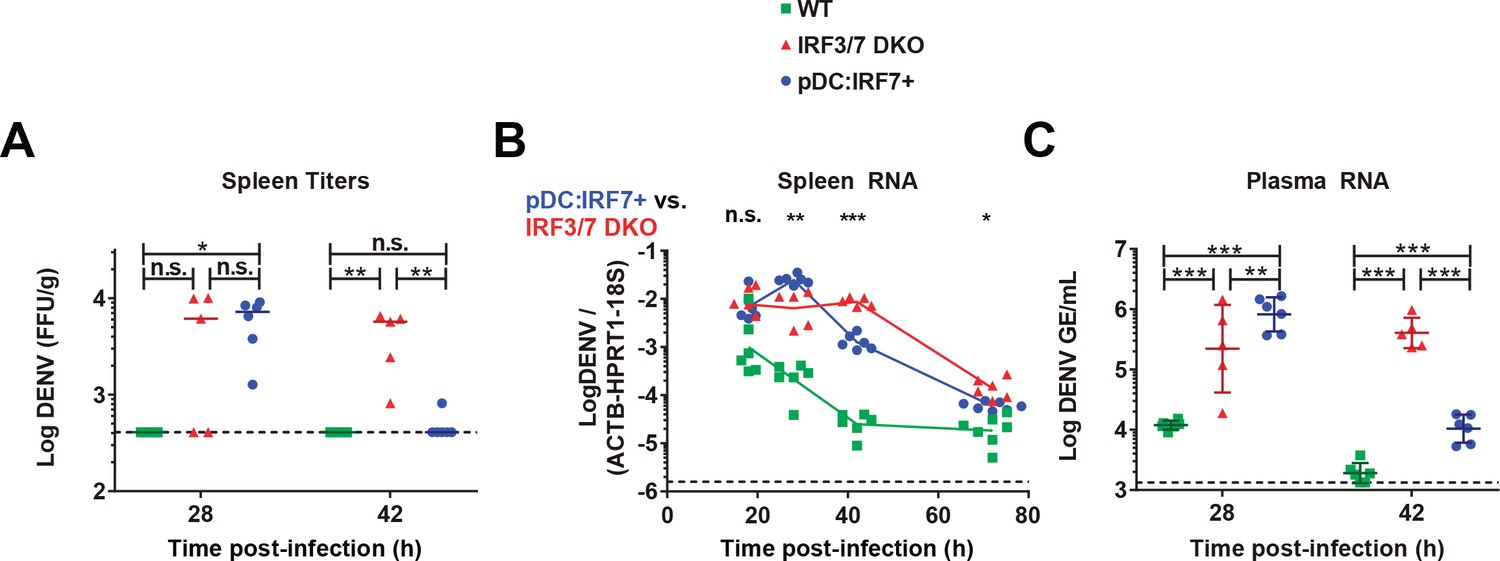
pDC:Irf7+mice control DENV viremia.
DENV infection (i.v.) of mice with the indicated genotypes followed by the analysis of DENV titers/RNA in spleens (A–B) and plasma (C) collected at the indicated time points p.i. DENV RNA levels are normalized to a panel of housekeeping genes (hprt1, β-actin, and 18S rRNA) and to exogenous RNA (xef1A) for spleen and plasma samples, respectively. Results are expressed as normalized Log10 DENV genome equivalents (GE) or Log10 foci forming unit (ffu)/g tissue; RNA: mean ±SD, titers: median, n = 5–7 mice (spleen), n = 5–6 mice (plasma).
Figure 4—figure supplement 1
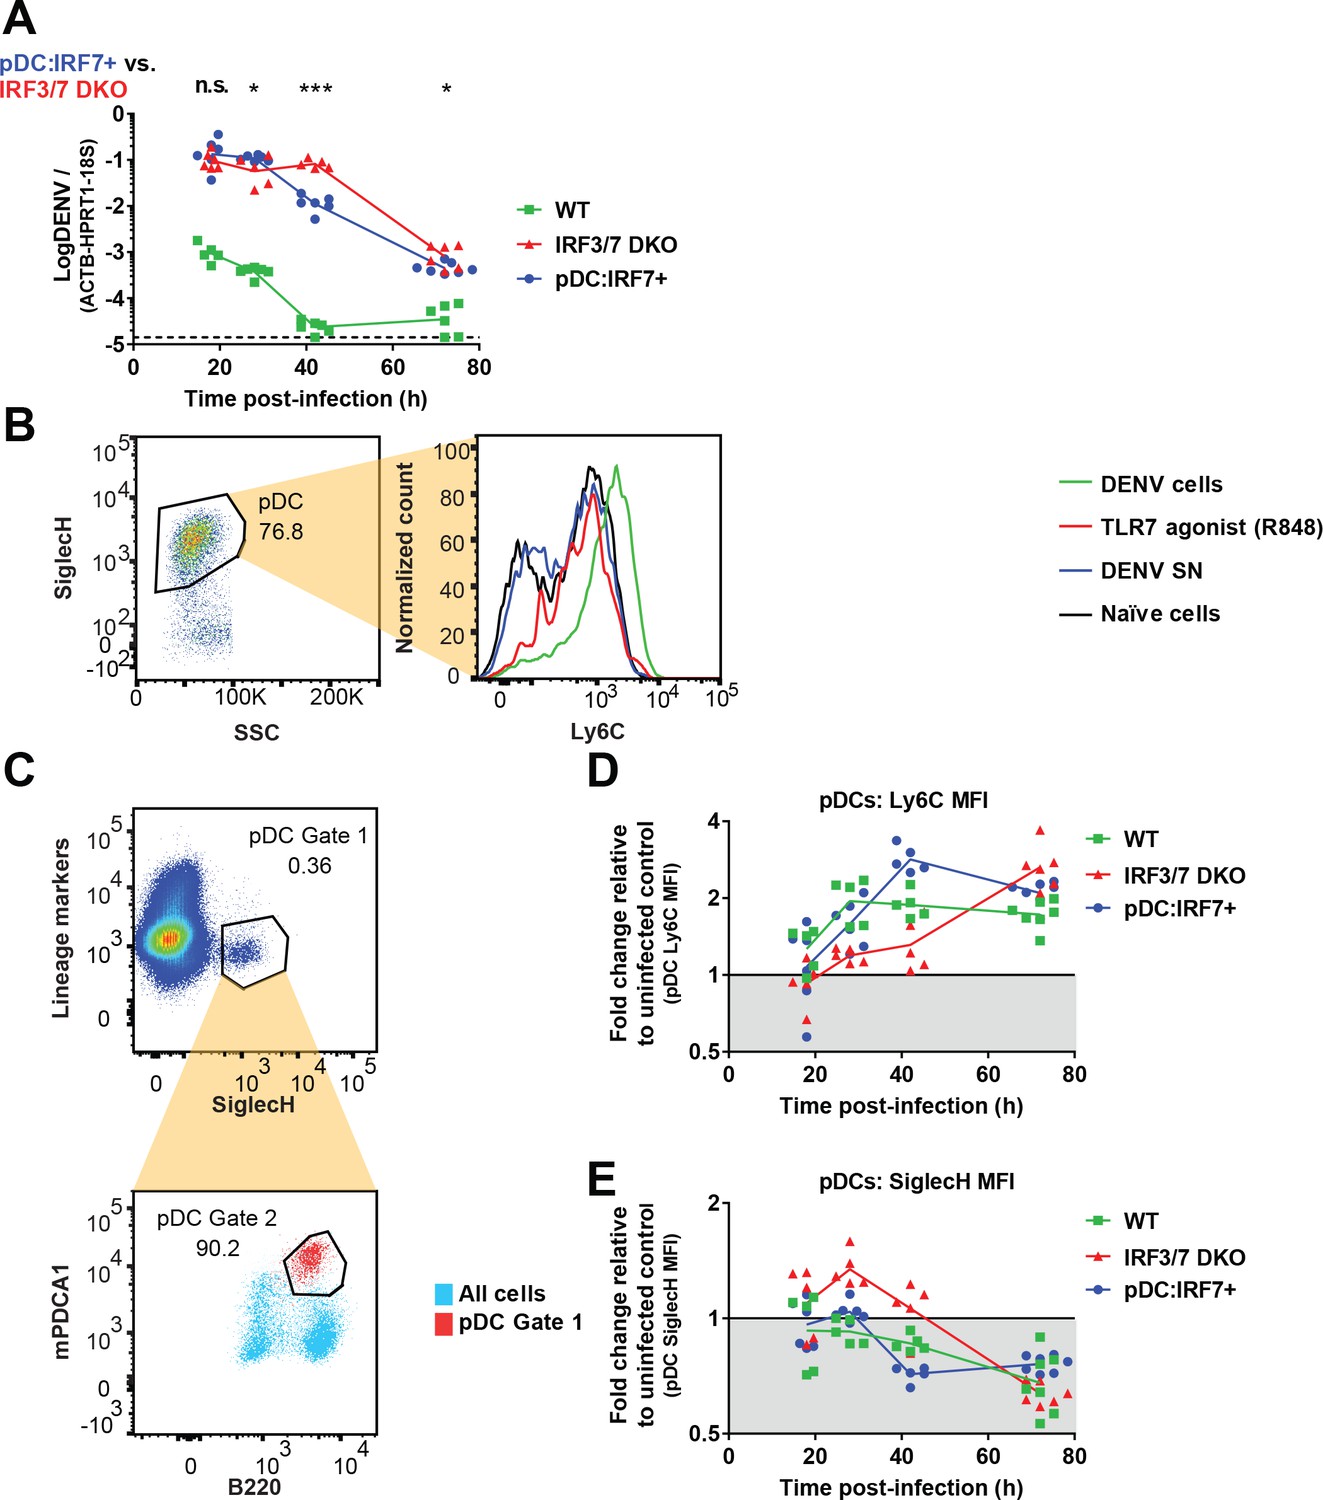
Regulation of splenic pDC markers and DENV levels is concomitant with IFN responses.
(A) Quantification of DENV genome levels in WT, Irf3/7 DKO and pDC:Irf7+mice using a primer set more specific for replicative DENV by targeting the 3’UTR of DENV genome. WT, Irf3/7 DKO and pDC:Irf7+ mice were infected as in Figure 4. Levels of DENV RNA were assessed by qRT-PCR using a primer set targeting the DENV 3’ UTR in spleens collected at the indicated time p.i. Results are expressed as log10 DENV genome equivalent (GE) normalized to a panel of housekeeping genes (hprt1, β-actin, and 18S rRNA). (B) Ly6C is upregulated on pDCs following exposure to DENV infected cells. pDCs were isolated from BM of WT mice and cocultured with DENV infected Huh7.5.1 cells infected (DENV cells) or treated with DENV infectious supernatant (DENV SN) or TLR7 agonists (R848) for 22 hr. pDCs were identified as Siglec-H+ cells and Ly6C MFI was compared on pDCs under the indicated conditions. (C) Gating strategy for pDCs from splenocyte populations. Lineage markers (CD2, CD3, CD19, CD49b, TER119) were used to gate out lymphocytes/NK cells/erythrocytes and Siglec-H+/mPDCA1+/B220med cells were positively identified as pDCs. (D–E) The upregulation of Ly6C and down-regulation of Siglec-H expression on pDCs is temporally associated with the type I IFN-induced ISG response. pDCs were gated as in (C) from splenocytes isolated from mice infected for 18-to-72h as in Figure 4, and Ly6C and Siglec-H MFI were compared on pDCs to uninfected controls of each mouse genotype; geometric mean, n = 3–6 mice per condition.
Figure 5 with 1 supplement
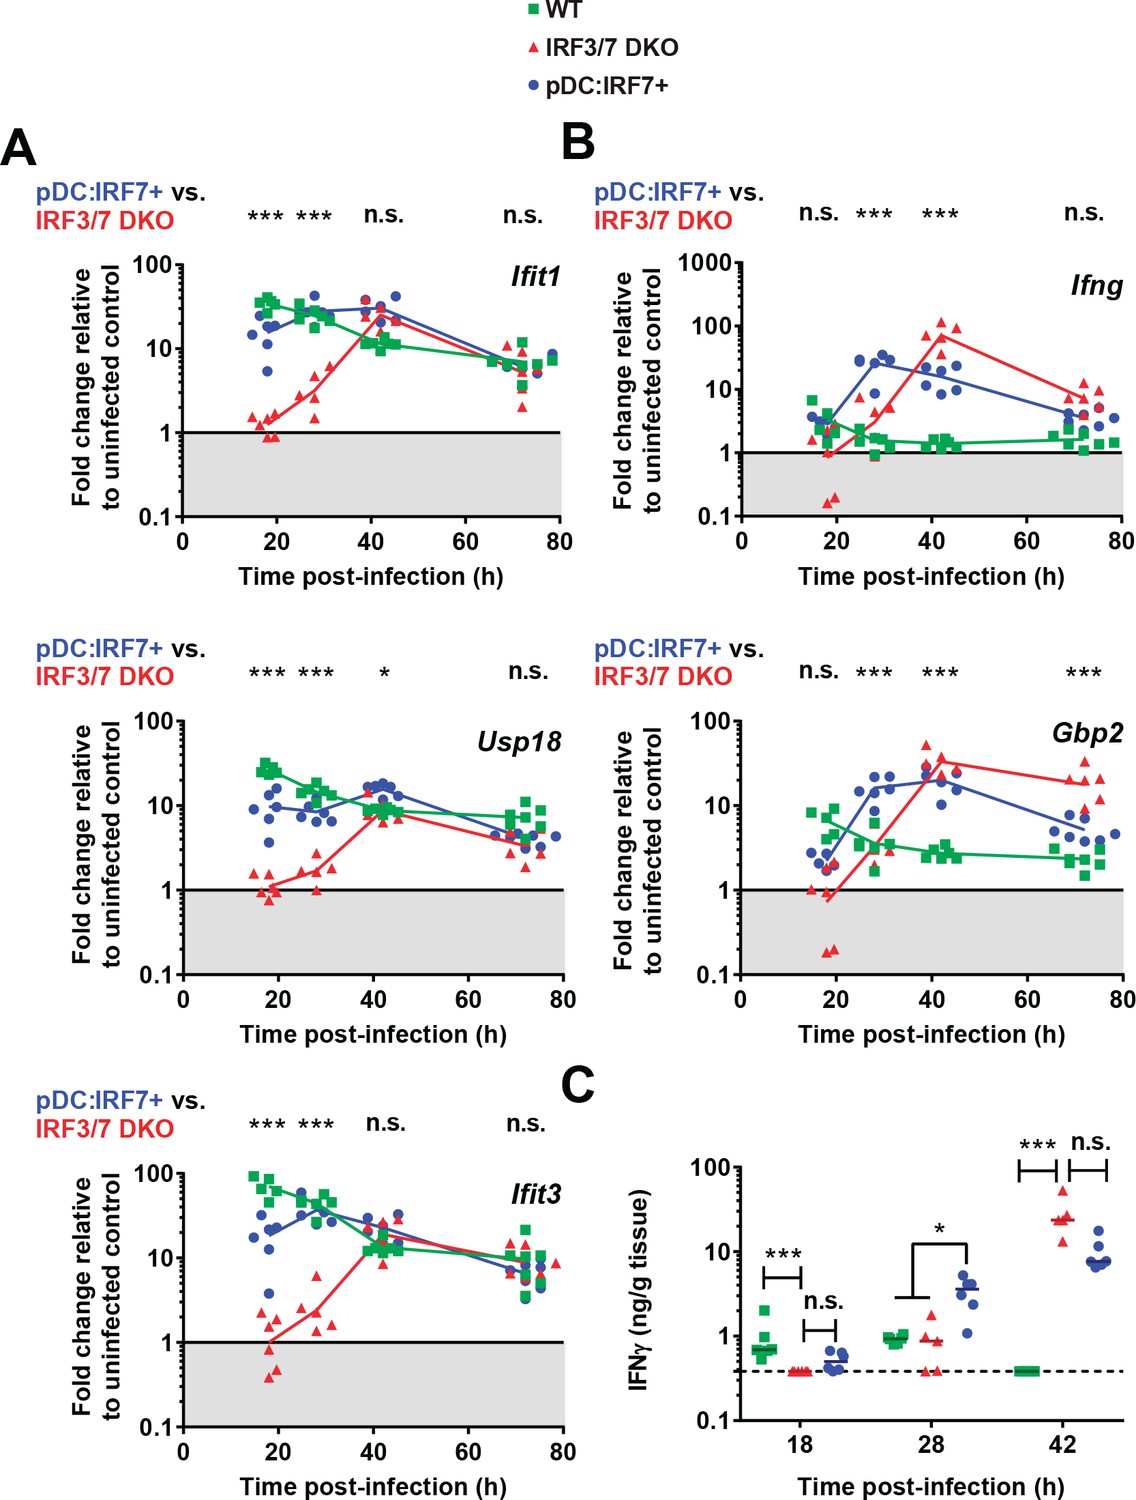
pDC:Irf7+mice display elevated IFN-I and accelerated IFN-II responses compared to Irf3/7 DKO mice during DENV infection.
Mice were infected as in Figure 4. (A–B) Type I IFN-induced ISGs (A) and ISG specifically induced by type II IFN signaling (B). RNA levels were assessed in the spleen and normalized to housekeeping panel (hprt1, β-actin, 18S). Transcript levels expressed as the fold change relative to uninfected mice for each genotype; geometric mean, n = 5–7 mice per condition, each data point corresponds to an individual mouse. (C) Quantification of IFNγ in spleen homogenates by ELISA; median, n = 5–6 mice per condition. IFNγ was undetectable in uninfected control mice.
Figure 5—figure supplement 1
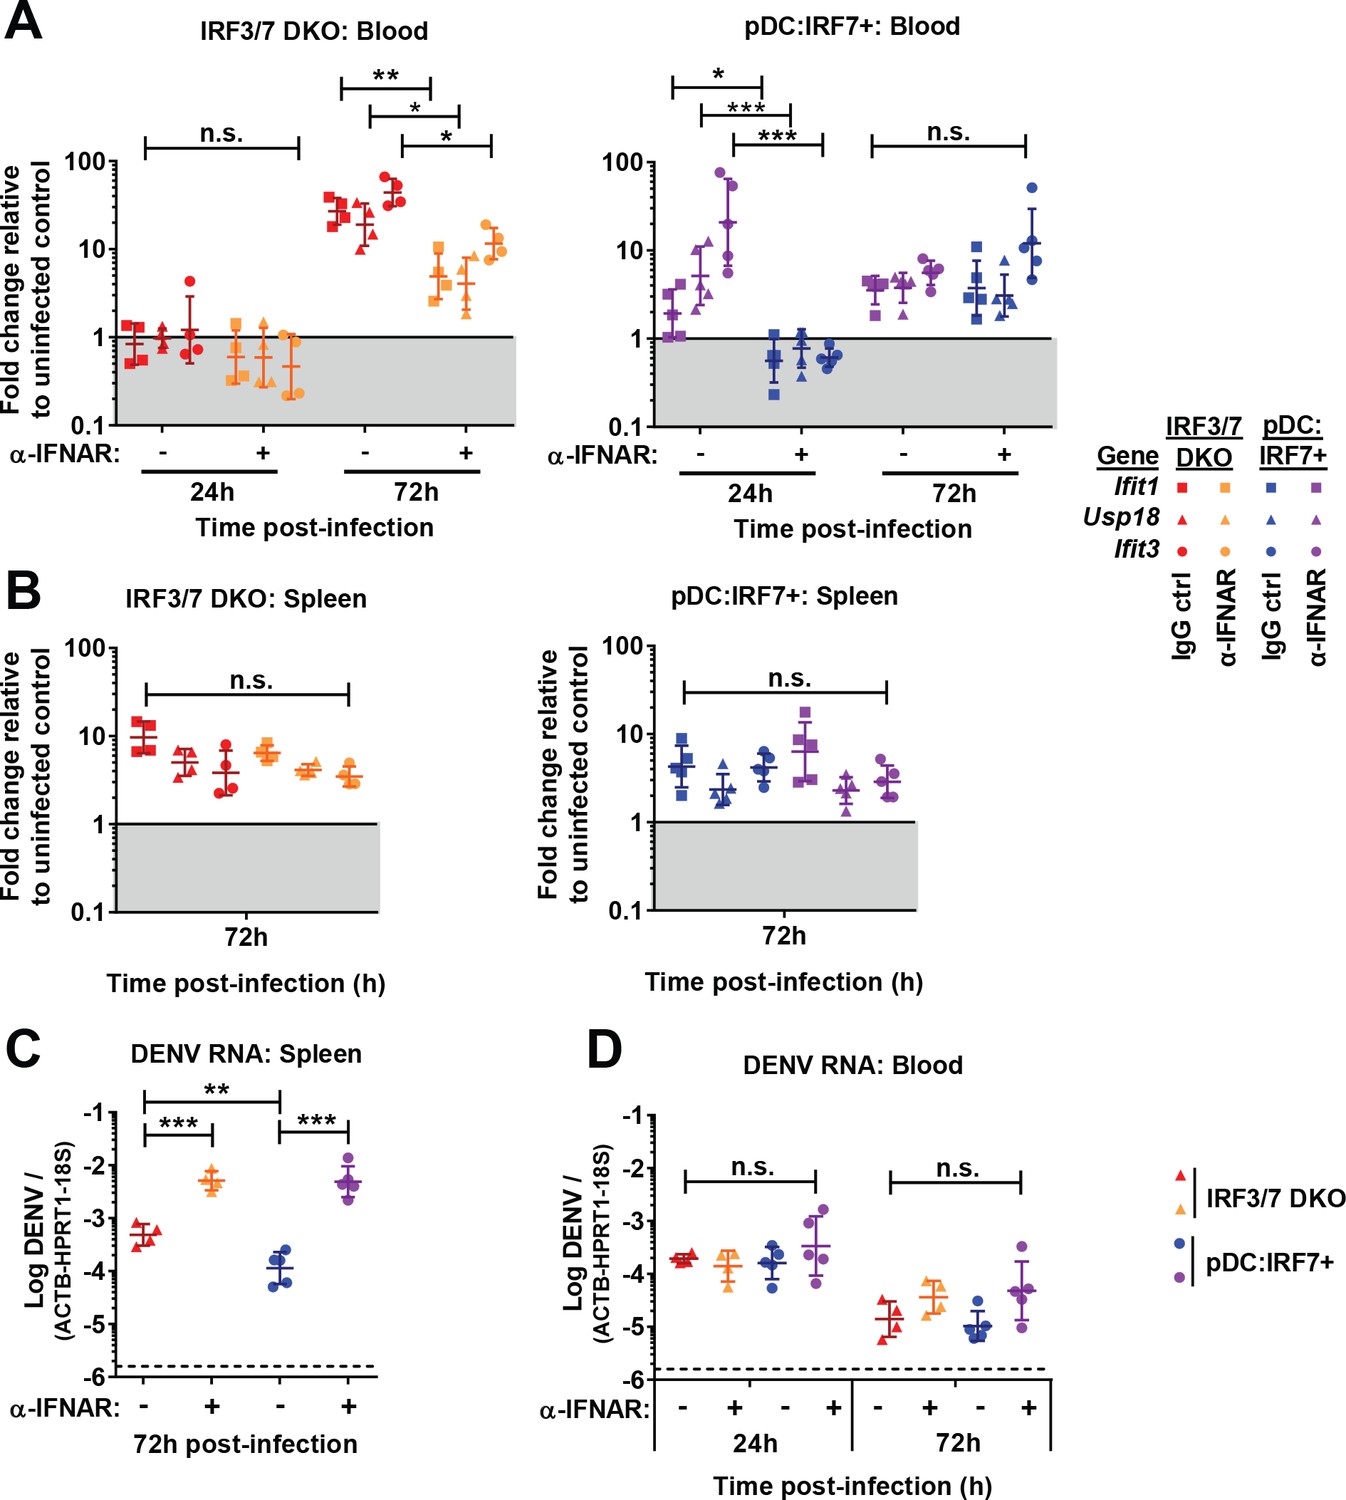
Protection in pDC:Irf7+mice involves IFNAR1.
Irf3/7 DKO and pDC:Irf7+ mice were injected with 800 μg of anti-IFNAR1 blocking or IgG1 control antibodies intraperitoneally (i.p.) and infected with DENV (i.v. 3 hr later). (A–B) IFN-I-induced ISG RNA levels (i.e. Ifit1, Usp18, Ifit3) in blood (A) and spleen (B), at the indicated times. Results are expressed as fold change relative to uninfected IgG-treated control mice; geometric mean ± SD, n = 4–5 mice per condition. (C–D) Log10 DENV genome levels assessed in spleen and blood; mean ± SD. DENV and ISG RNA levels were normalized to housekeeping gene panel (hprt1, β-actin, and 18S rRNA).
Figure 6 with 2 supplements
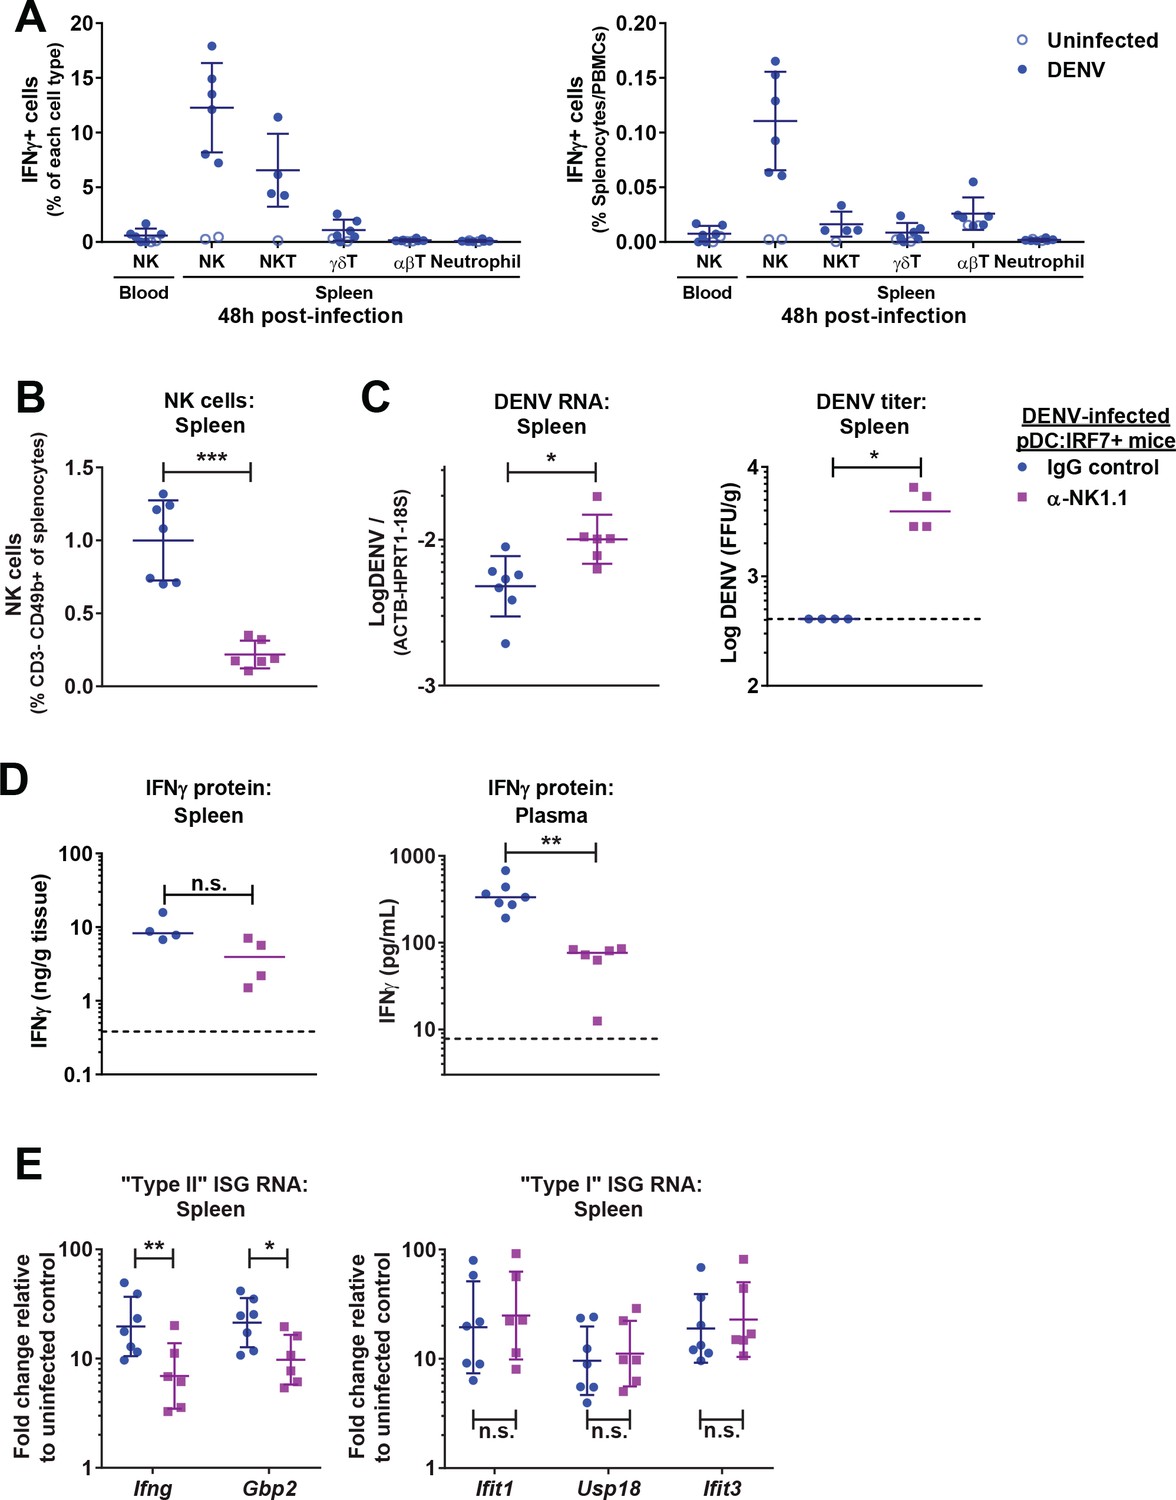
NK cells produce IFNγ and control DENV infections in pDC:Irf7+mice.
(A) Quantification of IFNγ+ cells in spleen/blood samples from DENV infected pDC:Irf7+ mice at 48 h p.i. by FACS. Cell subsets were identified as shown in Figure 6—figure supplement 1A. Results presented as a percentage of each cell type (left panel) or relative to total splenocytes/PBMCs (right panel); mean ± SD, n = 4–6 infected, n = 1–2 uninfected mice per cell population. (B–E) pDC:Irf7+ mice were injected i.p. with anti-NK1.1 depleting or IgG2a control antibody and infected 24 hr later with DENV i.v.; n = 6–7 mice per condition. Analyses were performed at 48 h p.i. in the indicated tissues. (B) NK cells as a percentage of splenocytes were identified by FACS as in Figure 6—figure supplement 2A; mean ± SD. (C) Log10 DENV genome levels; mean ± SD and Log10 foci forming unit (ffu)/g tissue ; median. (D) Quantification of IFNγ by ELISA; median. IFNγ was undetectable in uninfected control mice. (E) ISG RNA levels are expressed as fold change relative to uninfected IgG2a-treated control mice; geometric mean ± SD.
Figure 6—figure supplement 1
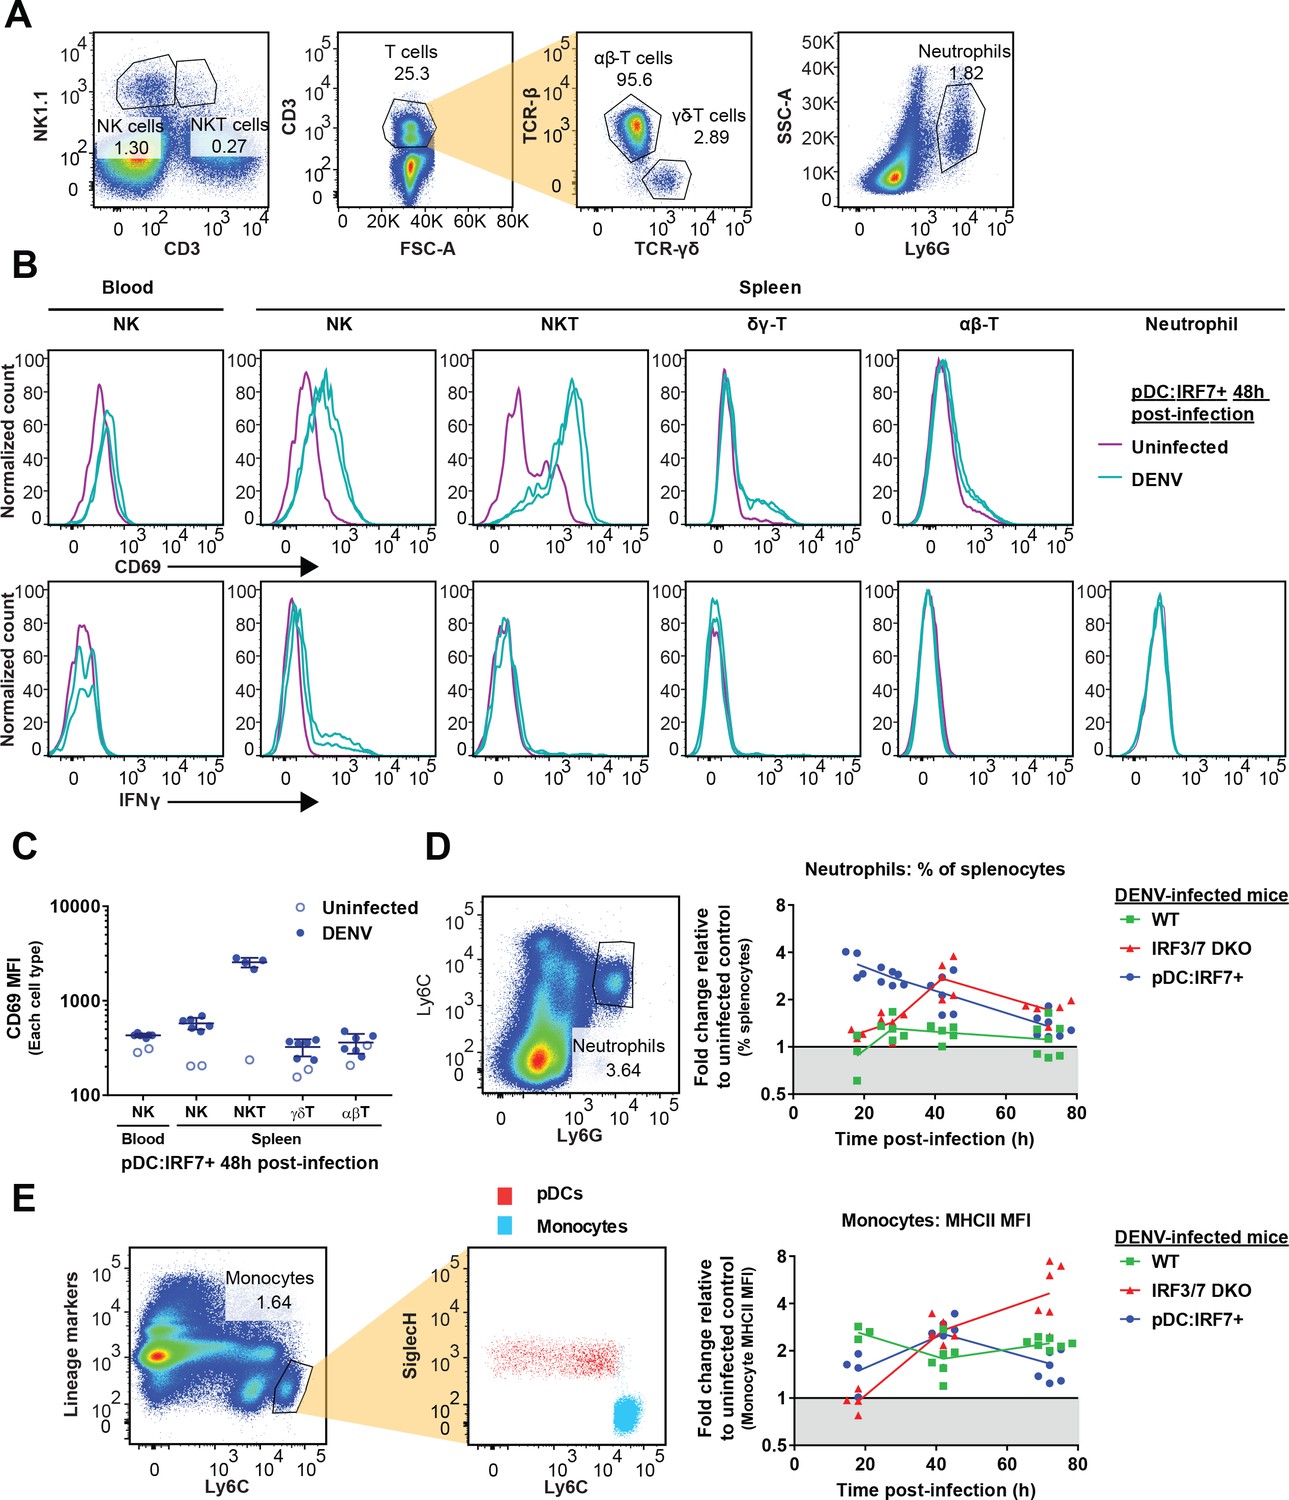
Activation of NK cells in DENV-infected mice, neutrophil influx into the spleen and monocyte activation correlate with pDC-dependent responses to DENV.
(A) Gating strategy for cell populations from splenocytes/PBMCs. Cells were identified as follows: NK cells: CD3-/NK1.1+, NKT cells: CD3+/NK1.1+, γδ-T cells: CD3+/TCRβ-/TCRγδ+, αβ-T cells: CD3+/TCRβ+/TCRγδ-, Neutrophils: SSC-Amed/Ly6G+. (B–C) Greater activation and IFNγ secretion in splenic compared to blood NK cells in response to DENV in pDC:Irf7+mice. Spleen and blood samples were collected from DENV-infected pDC:Irf7+ mice at 48 h p.i.. Cell populations were identified as in (A). (B) Representative histograms of CD69 activation marker and IFNγ fluorescence on various cell populations in n = 2 infected and n = 1 uninfected representative mice. (C) CD69 activation marker median fluorescence intensity on various cell populations; geometric mean ±SD, n = 4–6 infected, n = 1–2 uninfected mice per population. (D) Neutrophil influx into the spleen correlates with the timing/magnitude of type II IFN responses. Left panel, neutrophils were identified as Ly6Cmed/Ly6G+ population in splenocytes isolated from mice infected as in (A–C). Right panel, the percentages of neutrophils relative to total splenocytes were expressed as fold change relative to uninfected controls for each mouse genotype; n = 3–7 mice for each condition. (E) Early monocyte activation is enhanced by IRF7 activity in pDCs. Left panel, lineage markers (CD2, CD3, CD19, CD49b, TER119) were used to gate out lymphocytes/NK cells/erythrocytes and Ly6C++ cells were identified as inflammatory monocytes. Note the lack of Siglech expression on this population. Right panel, results are shown as the fold change of the median fluorescence intensity (MFI) of the activation marker MHCII on inflammatory monocytes, identified as in the left panel and normalized to uninfected mice from each genotype; n = 3–7 mice per condition.
Figure 6—figure supplement 2
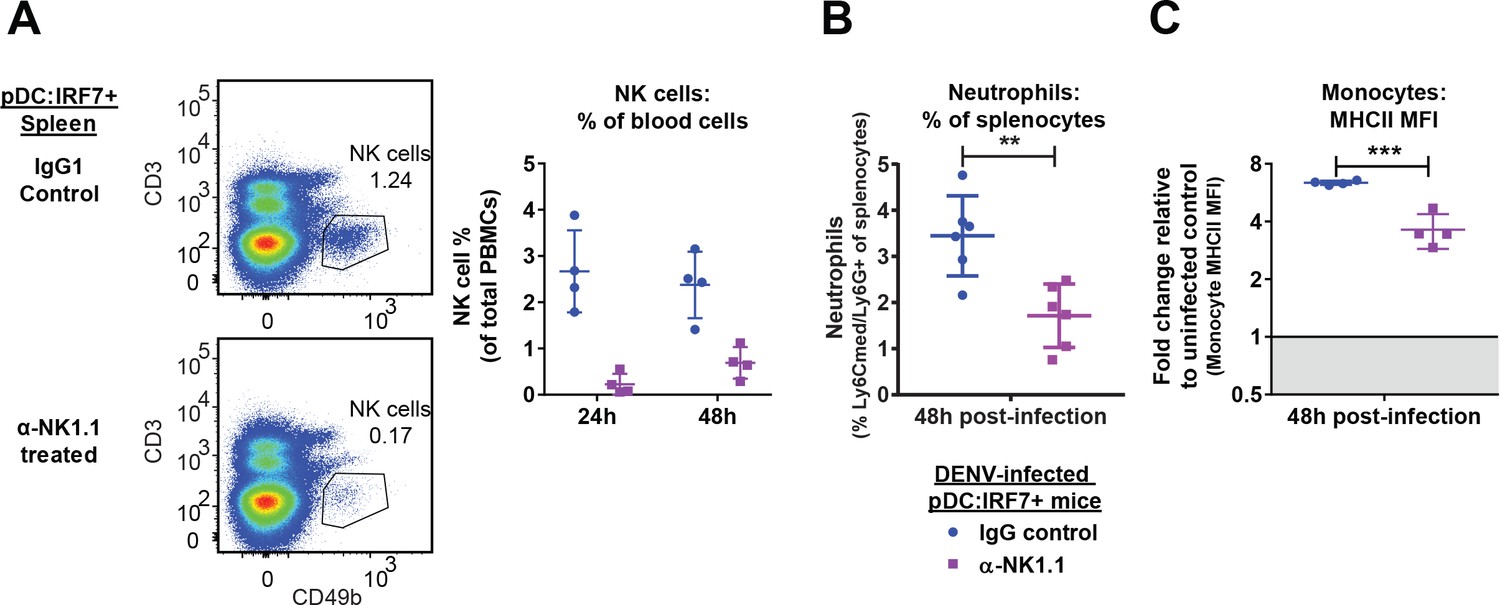
Depletion of NK cells in DENV infected mice.
(A) NK cell depletion assessed in the spleen and blood samples of anti-NK1.1-treated pDC:Irf7+mice. pDC:Irf7+ mice were injected i.p. with anti-NK1.1 blocking antibody or IgG1 control antibody and infected as in Figure 6. Left panels, gating strategy for NK cells (CD3-/CD49b+) in splenocytes of anti-NK1.1 and control IgG1-treated pDC:Irf7+ mice, collected at 48 hr. Note the use of CD49b as an alternate NK cell marker to avoid epitope masking. Right panel, NK cells as a percentage of total PBMCs were identified as in left panels, mean ± SD, n = 4 mice per condition. (B) Neutrophil influx into the spleen depends on the presence of NK cells. Splenocytes were isolated from pDC:Irf7+ mice 48 h p.i. with DENV and neutrophils were identified as Ly6Cmed/Ly6G+ cells, as in Figure 6—figure supplement 1D; mean ± SD; n = 6–7 mice for each condition. (C) Early monocyte activation depends on the presence of NK cells. Splenocytes were isolated from pDC:Irf7+ mice 48 hr post-infection with DENV and monocytes were identified as in Figure 6—figure supplement 1E and results displayed as in Figure 6—figure supplement 1E; geometric mean ± SD, n = 4 mice per condition.
Figure 7 with 1 supplement
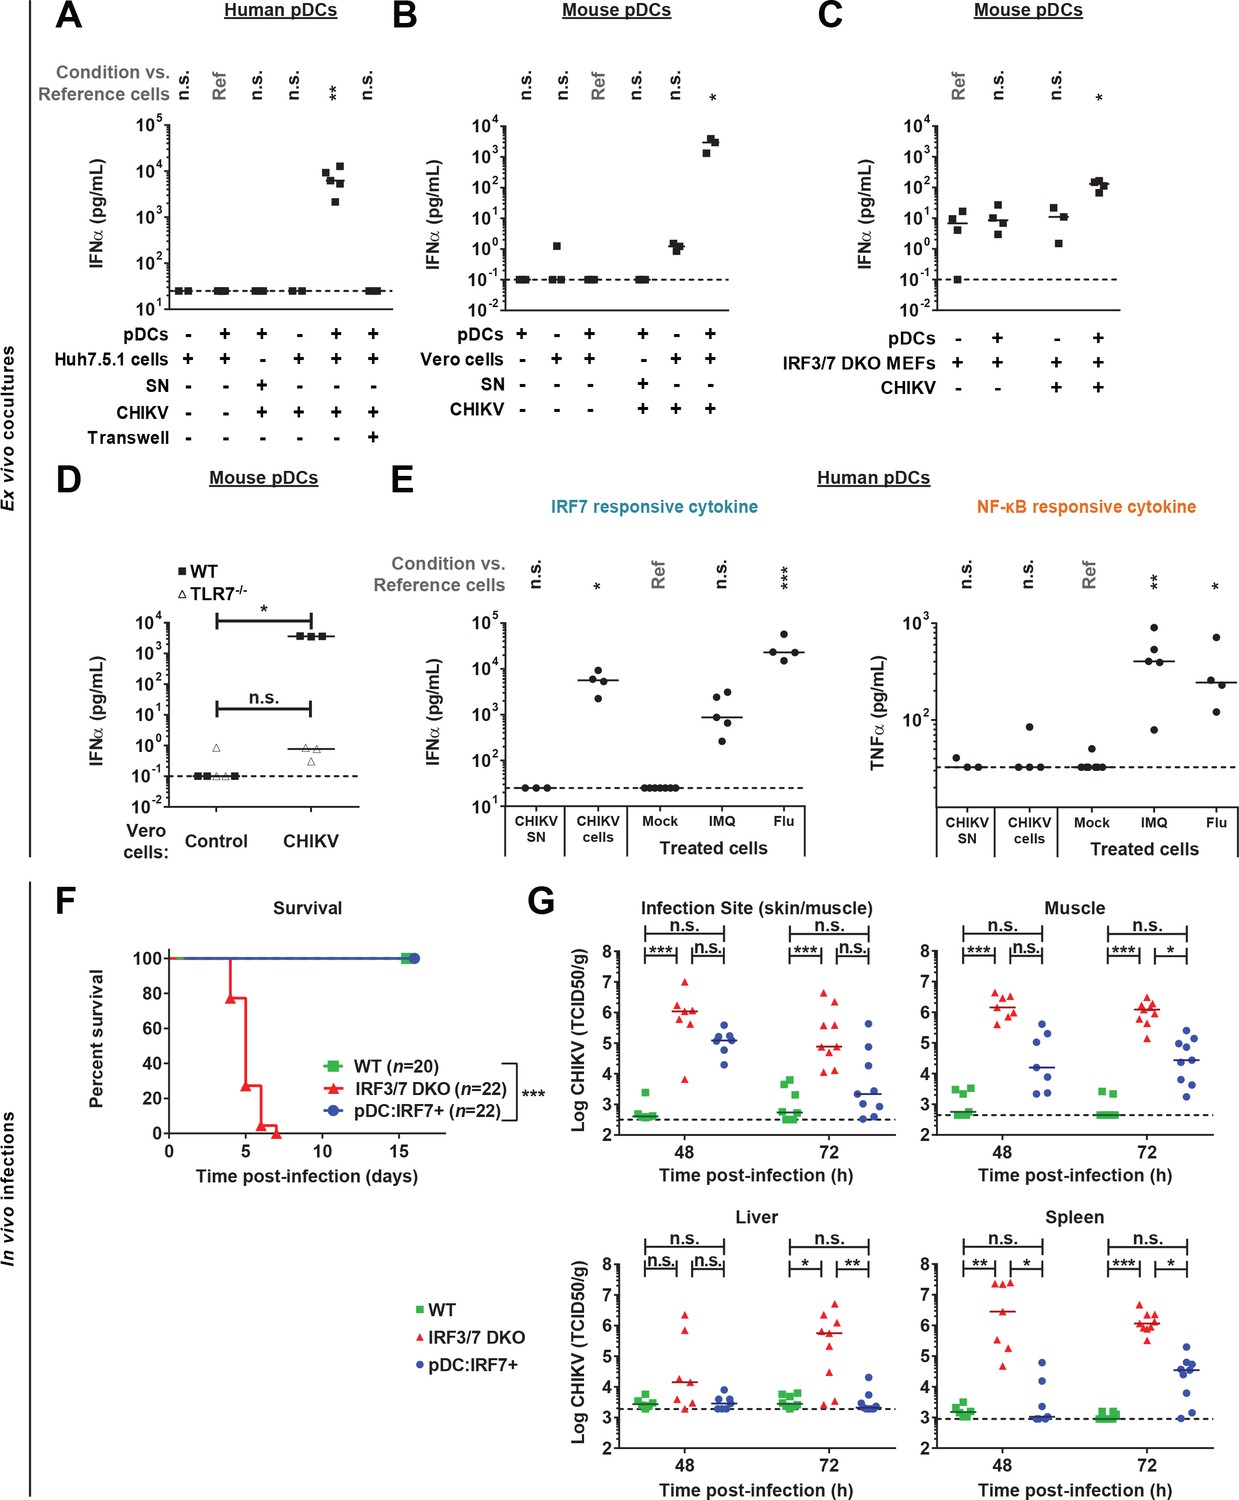
CHIKV activates a pDC IRF7-restricted response via cell-cell contact and pDC:Irf7+mice control CHIKV viremia.
(A) Quantification of IFNα by ELISA in supernatants of human pDCs cocultured for 22–24 hr with CHIKV-infected or uninfected Huh7.5.1 cells [seeded together or separated by a 0.4 µm transwell membrane] or treated with CHIKV infectious supernatant (SN); median, n = 3–5 independent experiments. (B–D) Quantification of IFNα levels by single molecule array (SiMoA) assay in supernatants of pDCs isolated from spleens of WT or TLR7-/- mice and cocultured with Vero cells (B, D) or Irf3/7 DKO MEFs (C) for 24 hr. Cultured cells were infected or not with CHIKV-GFP, as indicated; median, n = 3–4 independent experiments. (E) Quantification of IFNα and TNFα by ELISA in supernatants of human pDCs treated for 22–24 hr with CHIKV infectious supernatant (CHIKV SN), TLR7 agonists [IMQ; 1 µg/mL and Flu; 3 × 10³ FFU], or cocultured with CHIKV-infected Huh7.5.1 cells; median, n = 4–5 independent experiments. (F–G) CHIKV infection subcutaneously (s.c.) of mice with the indicated genotypes followed by analysis of the survival rate (F) and CHIKV infectious titers in the indicated tissue homogenates (G); median, n = 7–22 mice per condition.
Figure 7—figure supplement 1
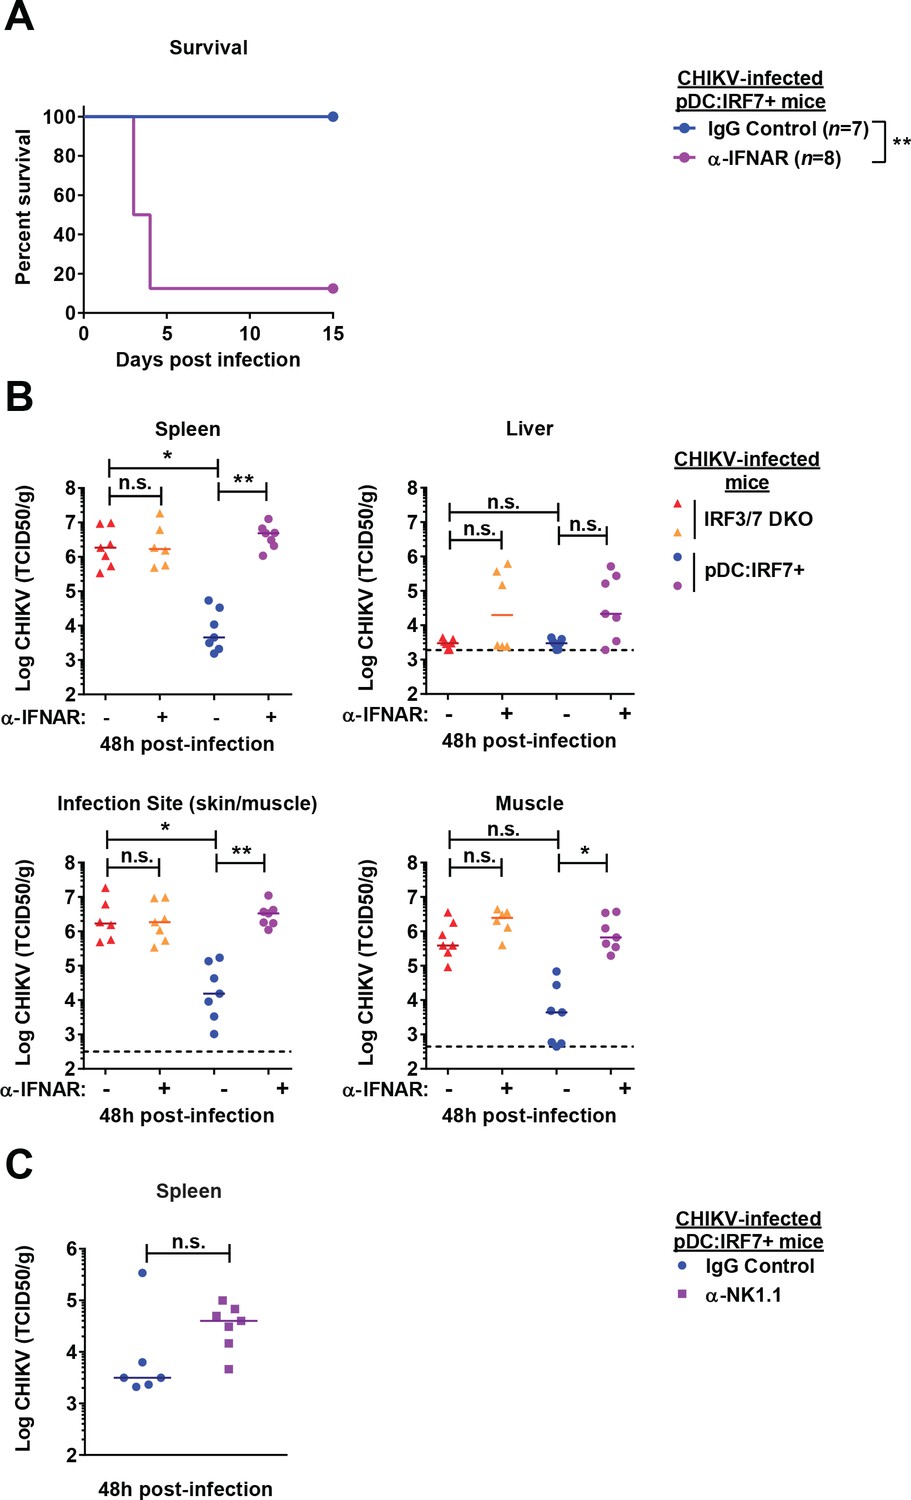
Protection in pDC:Irf7+mice involves IFNAR1 and NK response.
(A–B) Irf3/7 DKO and pDC:Irf7+ mice were injected with 800 μg of anti-IFNAR1 blocking or IgG1 control antibodies (i.p.) and infected with CHIKV (s.c.) 24 hr later. (A) Infected pDC:Irf7+ mice were monitored daily for lethality. (B) CHIKV viral titers assessed in indicated tissue homogenates; median; n = 6–7 mice per condition. (C) pDC:Irf7+ mice were injected i.p. with anti-NK1.1 depleting or IgG2a control antibody and infected 24 hr later with CHIKV s.c.. CHIKV viral titers at 48 h p.i. in the spleen homogenates; n = 6–7 mice per condition; median.
Author response image 1
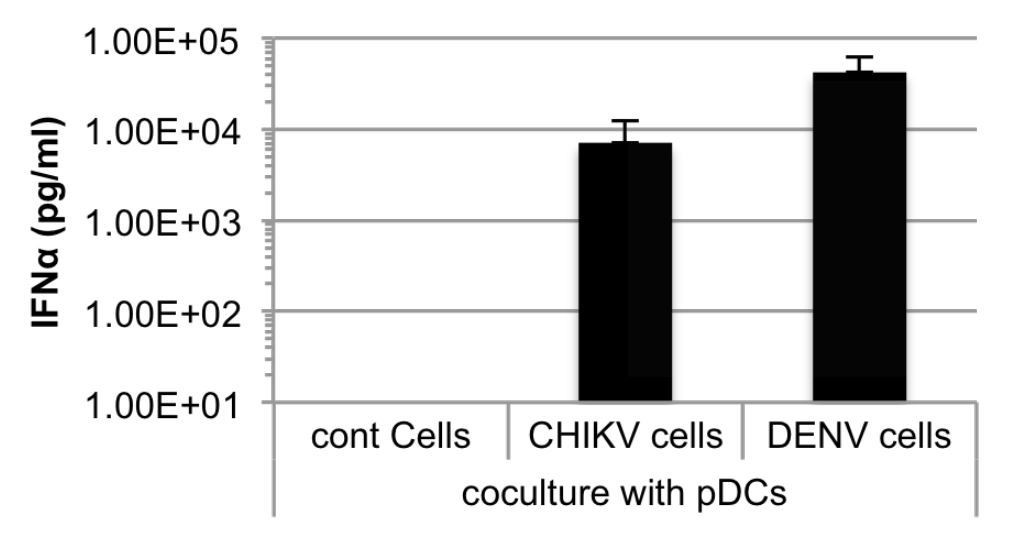
Quantification of IFNα by ELISA in supernatants of human pDCs cocultured with Huh7.5.1 cells infected by either CHIKV or DENV, or uninfected.
Cells were infected 48 hours prior to cocultures.
Additional files
-
Supplementary file 1
Mouse cohorts used for in vivo studies.
- https://doi.org/10.7554/eLife.34273.017
-
Supplementary file 2
Primer sets used in quantitative RT-PCR.
The primer sets used to amplify genes from cDNA for expression analysis are provided.
- https://doi.org/10.7554/eLife.34273.018
Download links
A two-part list of links to download the article, or parts of the article, in various formats.
Downloads (link to download the article as PDF)
Open citations (links to open the citations from this article in various online reference manager services)
Cite this article (links to download the citations from this article in formats compatible with various reference manager tools)
Plasmacytoid dendritic cells control dengue and Chikungunya virus infections via IRF7-regulated interferon responses
eLife 7:e34273.
https://doi.org/10.7554/eLife.34273


