Acute intermittent hypoxia enhances corticospinal synaptic plasticity in humans
- University of Miami, United States
- University of Florida, United States
Figures
Figure 1
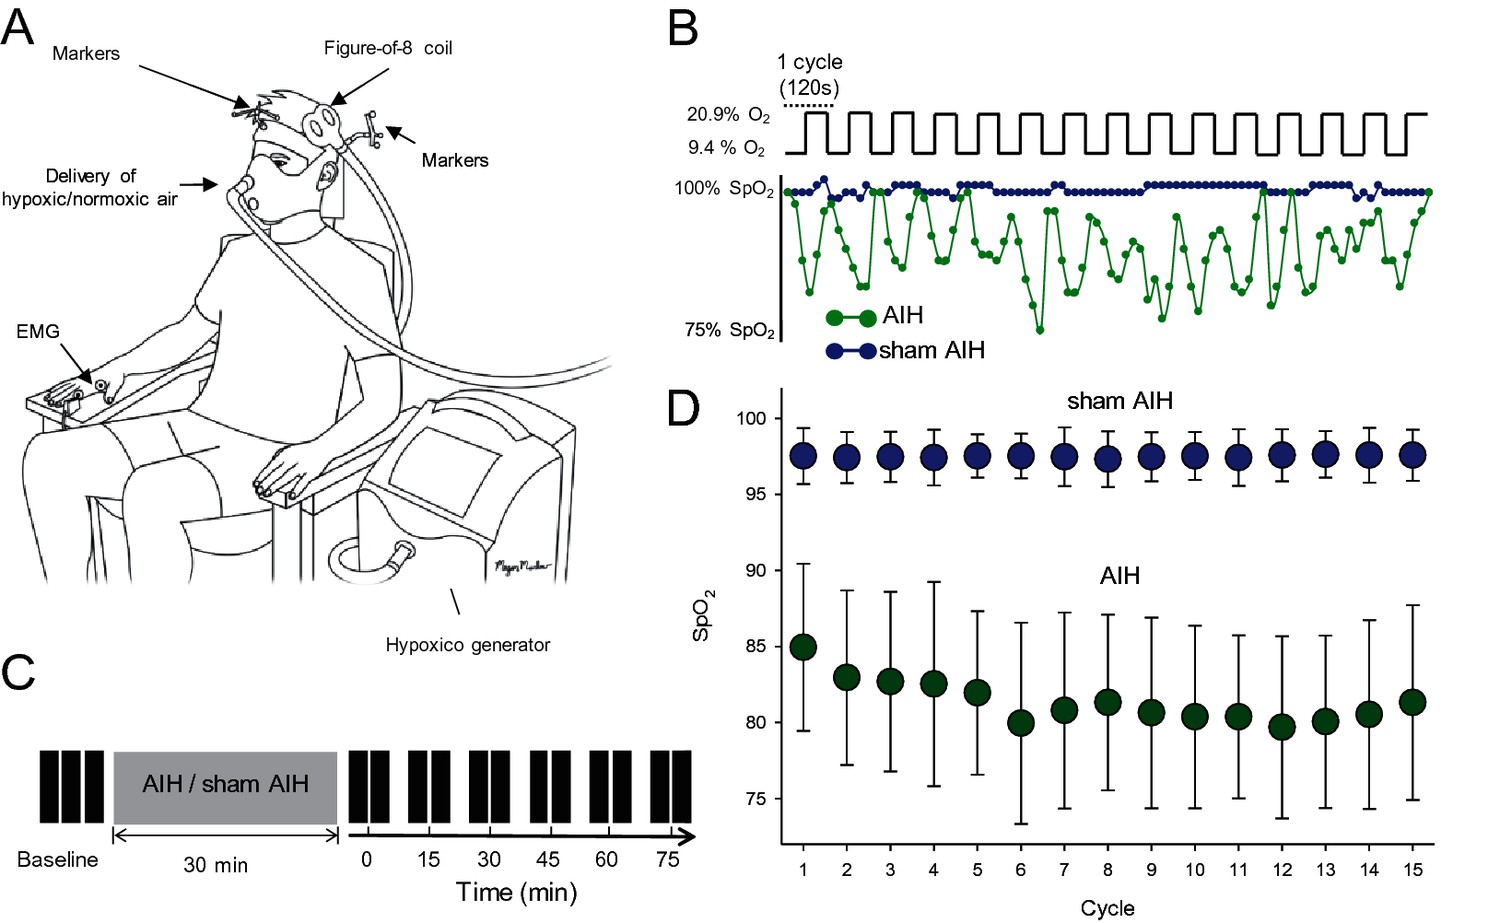
Experimental setup.
(A) Participants were seated in a customized chair during acute intermittent hypoxia (AIH) and sham AIH protocols using the Hypoxico Inc. (EVEREST SUMMIT II, New York). During electrophysiological outcomes using transcranial magnetic stimulation (TMS) the coil was monitored by markers using a frameless stereotaxic system and electromyographic (EMG) activity was recorded from the first dorsal interosseous (FDI) muscle. (B) SpO2 from a representative participant during the AIH (green) and sham AIH (blue) protocols. The AIH protocol consisted of 15 cycles of 1 min of inspiring ambient air (20.9% O2) with 1 min of hypoxic air (9.4% O2). (C) Timeline of the experimental protocol. Electrophysiological outcomes were measured before (baseline), immediately after (0) and 15, 30, 45, 60 and 75 min each after protocol. (D) Group data (n = 19) showing the SpO2 observed during the 15 cycles for the AIH (green circles) and sham AIH (blue circles) protocols. Error bars denote SDs.
Figure 2
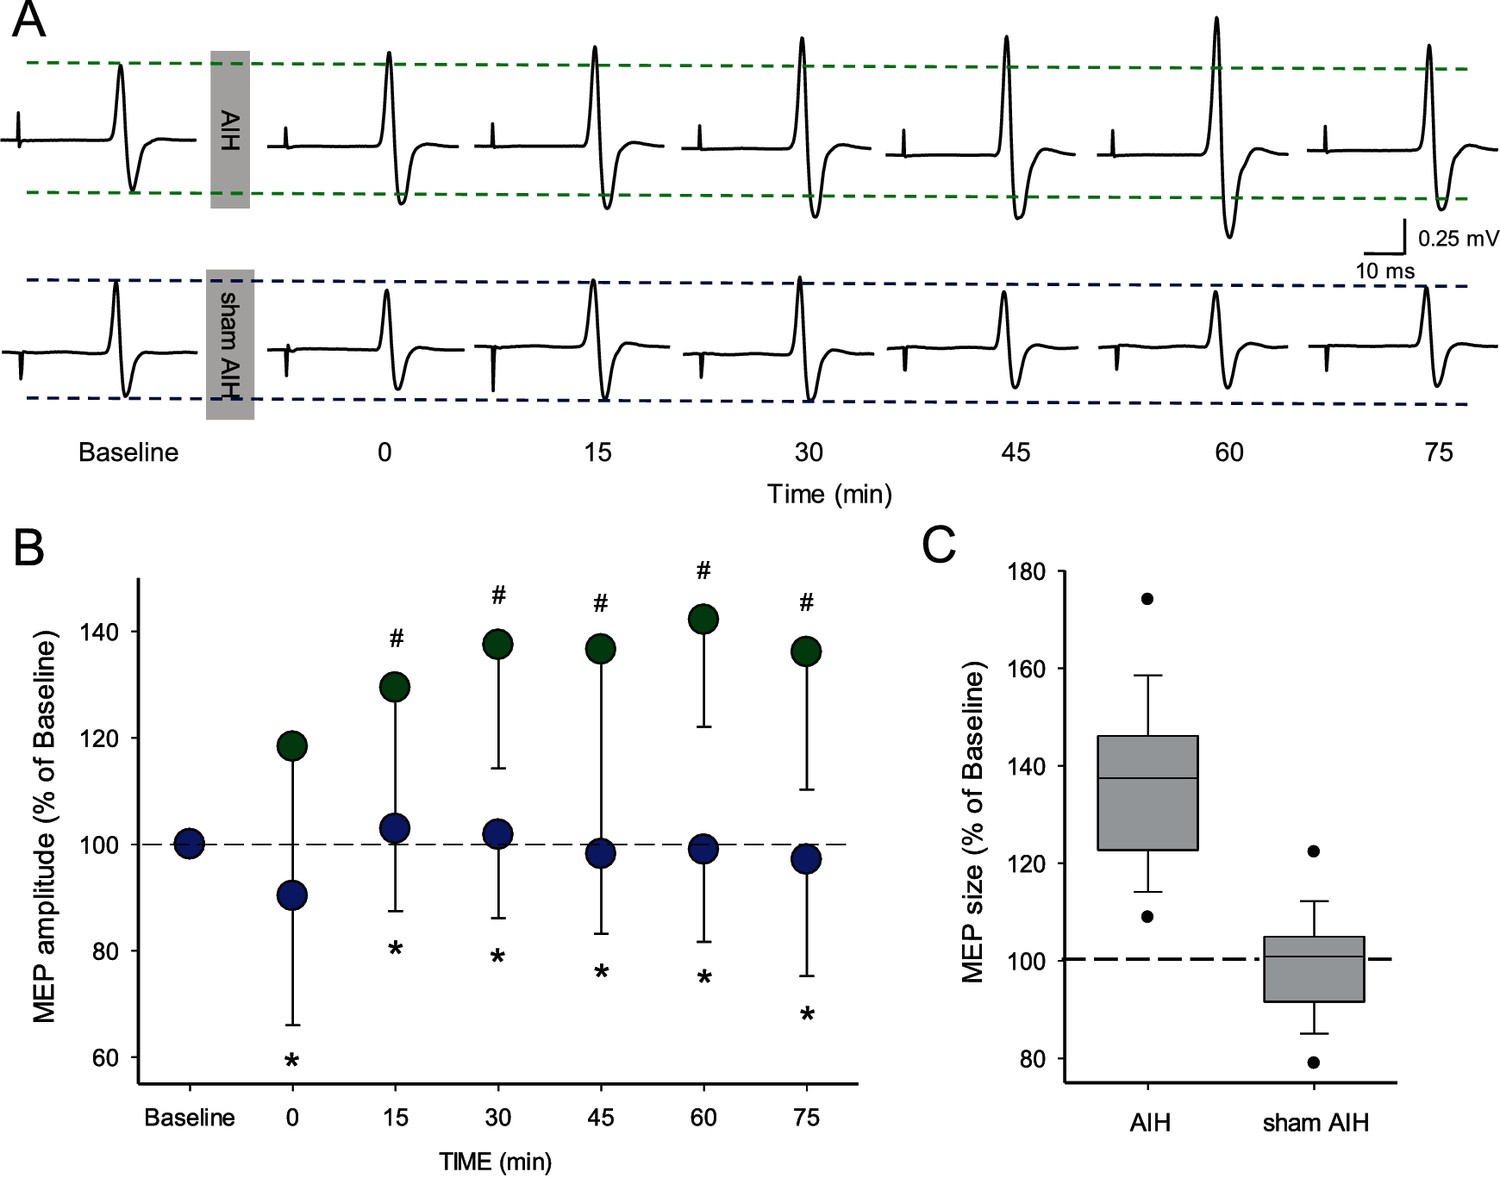
Motor evoked potentials (MEPs) elicited by TMS.
(A) Raw MEP traces elicited by TMS in the FDI muscle in a representative participant before and after the AIH (upper traces) and sham AIH (lower traces) protocols. Each waveform represents the average of 20 MEPs before and after each protocol. (B) Group data (n = 19) showing normalized MEP amplitudes before and after the AIH (green circles) and sham AIH (blue circles) protocols. The abscissa shows the time of measurements (baseline, immediately after (0), 15, 30, 45, 60 and 75 min after each protocol). The ordinate shows the MEP amplitude as a percentage of the baseline MEP (% of Baseline) for each protocol. (C) Graph shows box-plots group normalized MEP data at baseline (dotted line) and after the AIH and sham AIH protocols from 15-75 minutes averaged (n = 19). The abscissa shows the baseline and protocols tested (AIH and sham AIH) and the ordinate shows the MEP amplitude as a percentage of the baseline MEP (% of Baseline) for each protocol. Whiskers illustrate 5th and 95th percentiles and dots represent minimal and maximal values. Error bars indicate SDs. *p<0.05, comparison between protocols. #p<0.001, comparison with the baseline.
Figure 3
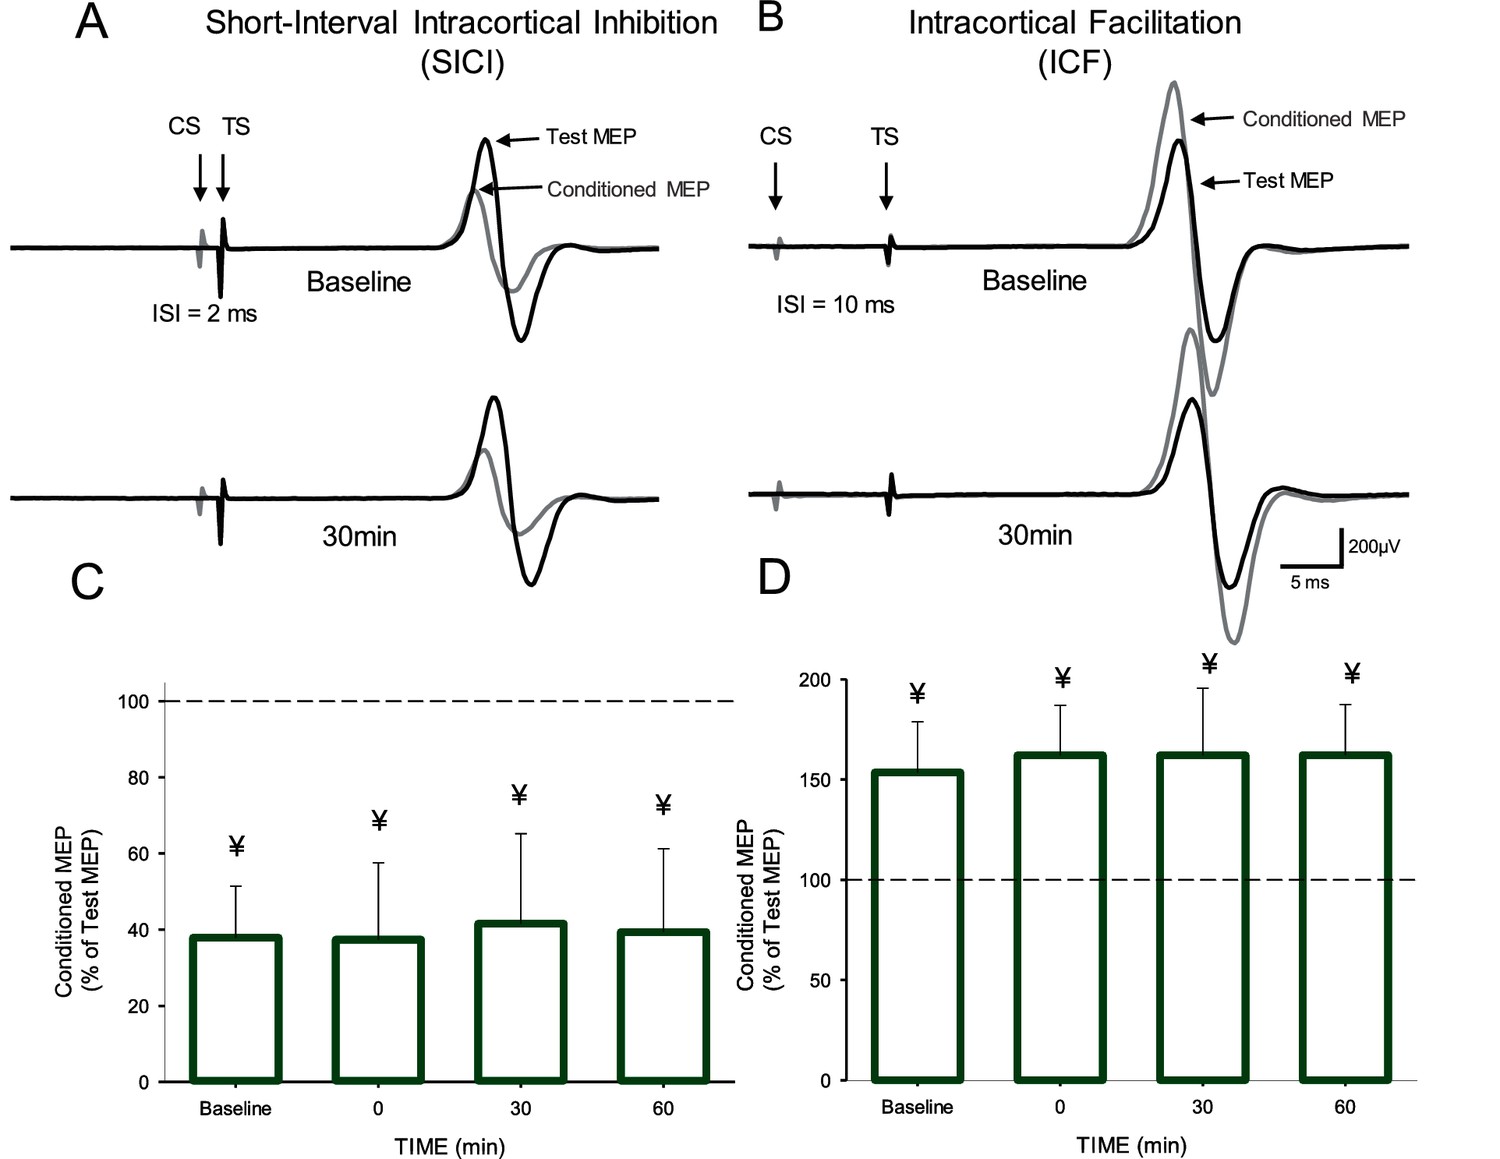
Short-interval intracortical inhibition (SICI) and intracortical facilitation (ICF).
Raw traces showing SICI (A) and ICF (B) in the FDI muscle in a representative participant before and 30 min after the AIH protocol. Each waveform represents the average 15 test (black traces) and 15 conditioned (gray traces) MEPs. Arrows at the beginning of each trace indicate the test (TS) and conditioned (CS) stimuli used during testing. Arrows also indicate the test (black traces) and conditioned (gray traces) MEPs. Group SICI (n = 10, C) and ICF (n = 11, D) data before and after the AIH protocol. The abscissa shows the time of measurements (baseline, immediately after (0), 30, and 60 min after the AIH protocol). The ordinate shows the conditioned MEP as a percentage of the test MEP at baseline (% of Test Response). Error bars indicate SDs. ¥p<0.05, significant inhibition compared with the test response.
Figure 4

MEPs elicited by electrical stimulation.
(A) Raw MEP traces elicited by electrical stimulation at the primary motor cortex in the FDI muscle in a representative participant before and after the AIH protocol. Each waveform represents the average of 10 MEPs. (B) Group data (n = 13). The abscissa shows the time of measurements (baseline, immediately after (0), 15, 30, 45, 60 and 75 min after the AIH protocol). The ordinate shows the MEP amplitude as a percentage of the MEP at baseline (% of Baseline). (C) Box-plots illustrate grouped MEP data before and after AIH (n=13). The abscissa shows the time of measurement (Pre and Post). Note that for post measurements data from 15 to 75 minutes were averaged.The ordinate shows the MEP amplitude (in millivolts). Whiskers illustrate 5th and 95th percentiles and dots represent minimal and maximal values. Error bars indicate SDs. #p<0.05, comparison with the baseline.
Figure 5
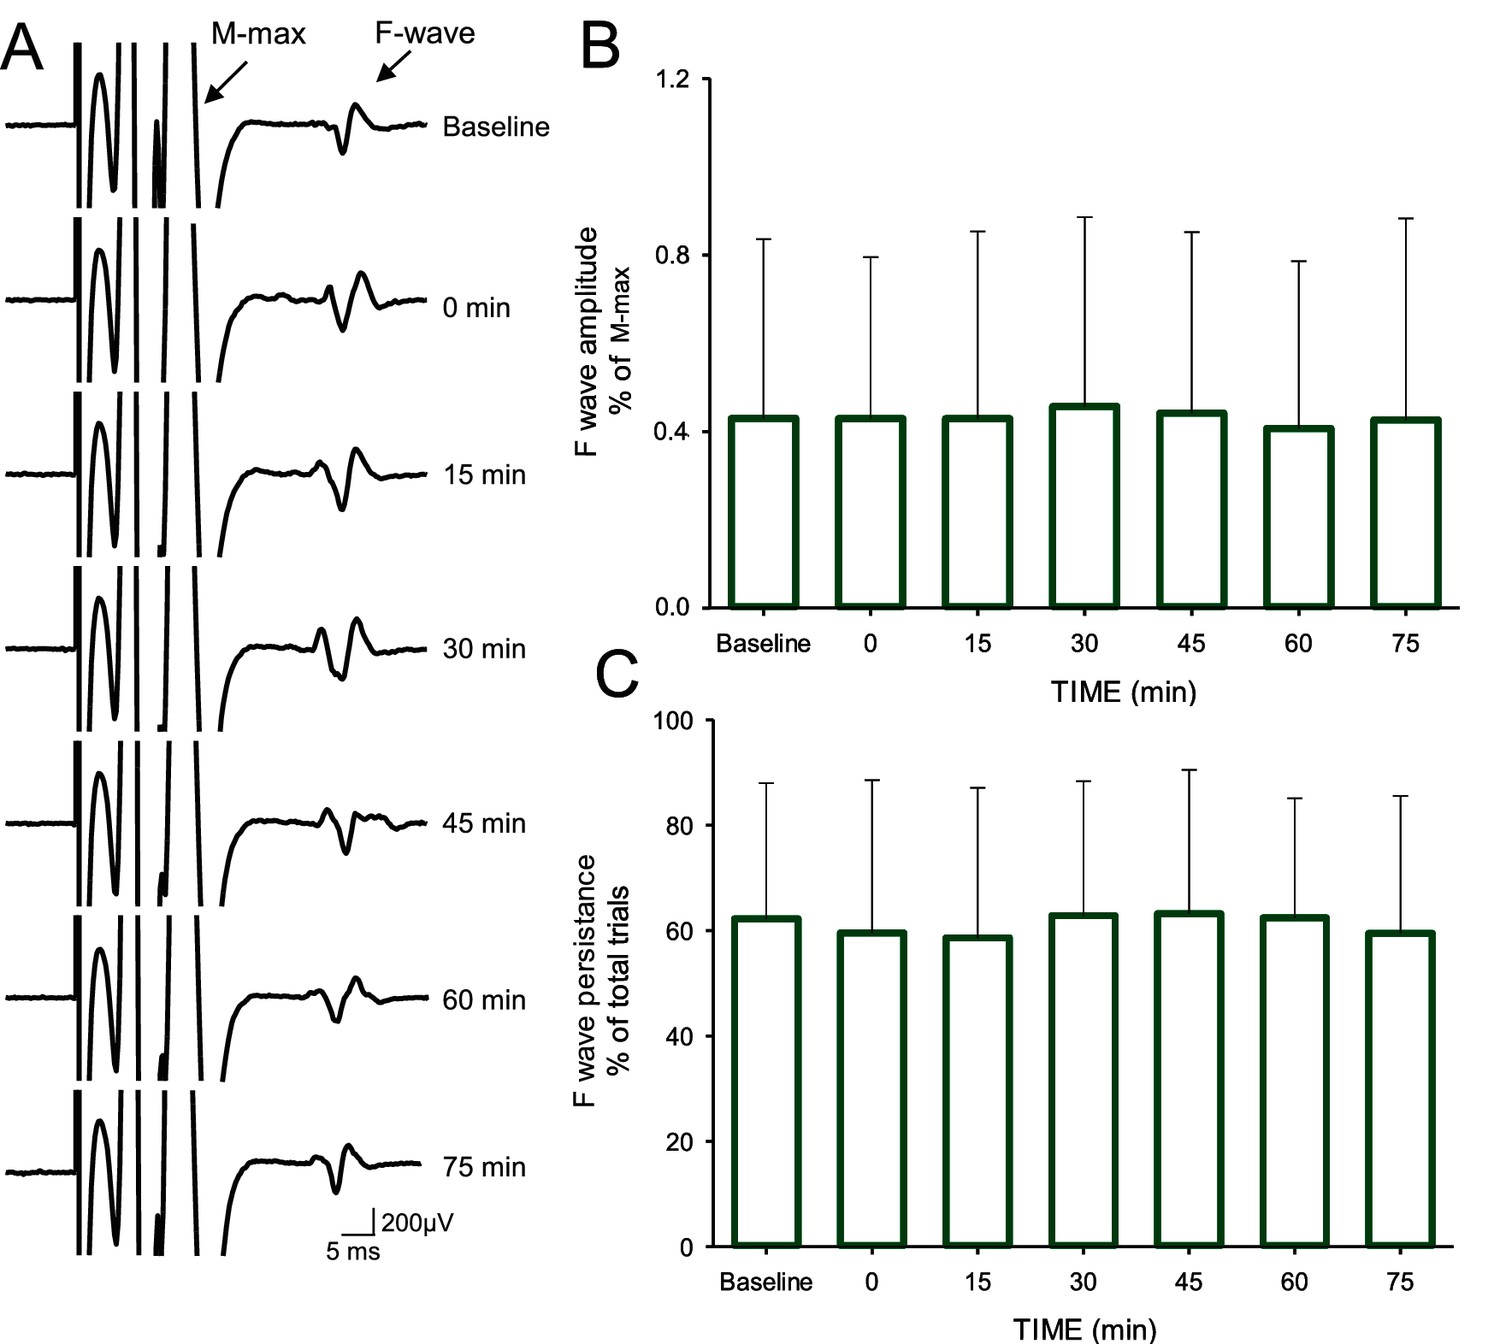
F-waves.
(A) Maximal motor response (M-max) and F-wave traces recorded from the FDI muscle in a representative subject before and after the AIH protocol. The M-max is truncated to better visualize the F-wave. Note the multi-phasic shape of the M-max due to the post hoc filtering conducted to reduce the M-max ‘tail’ (see Materials and methods). Each waveform represents the average of 30 trials. Group data (n = 12) showing the F-wave amplitude (B) and persistence (C). In each graph, the abscissa shows the time of measurements (baseline, immediately after (0), 15, 30, 45, 60 and 75 min after the AIH protocol) and the ordinate shows the F-wave amplitude (expressed as a % of the M-max; B) and persistence (expressed as a % of total trials; C). Error bars indicate SDs.
Figure 6
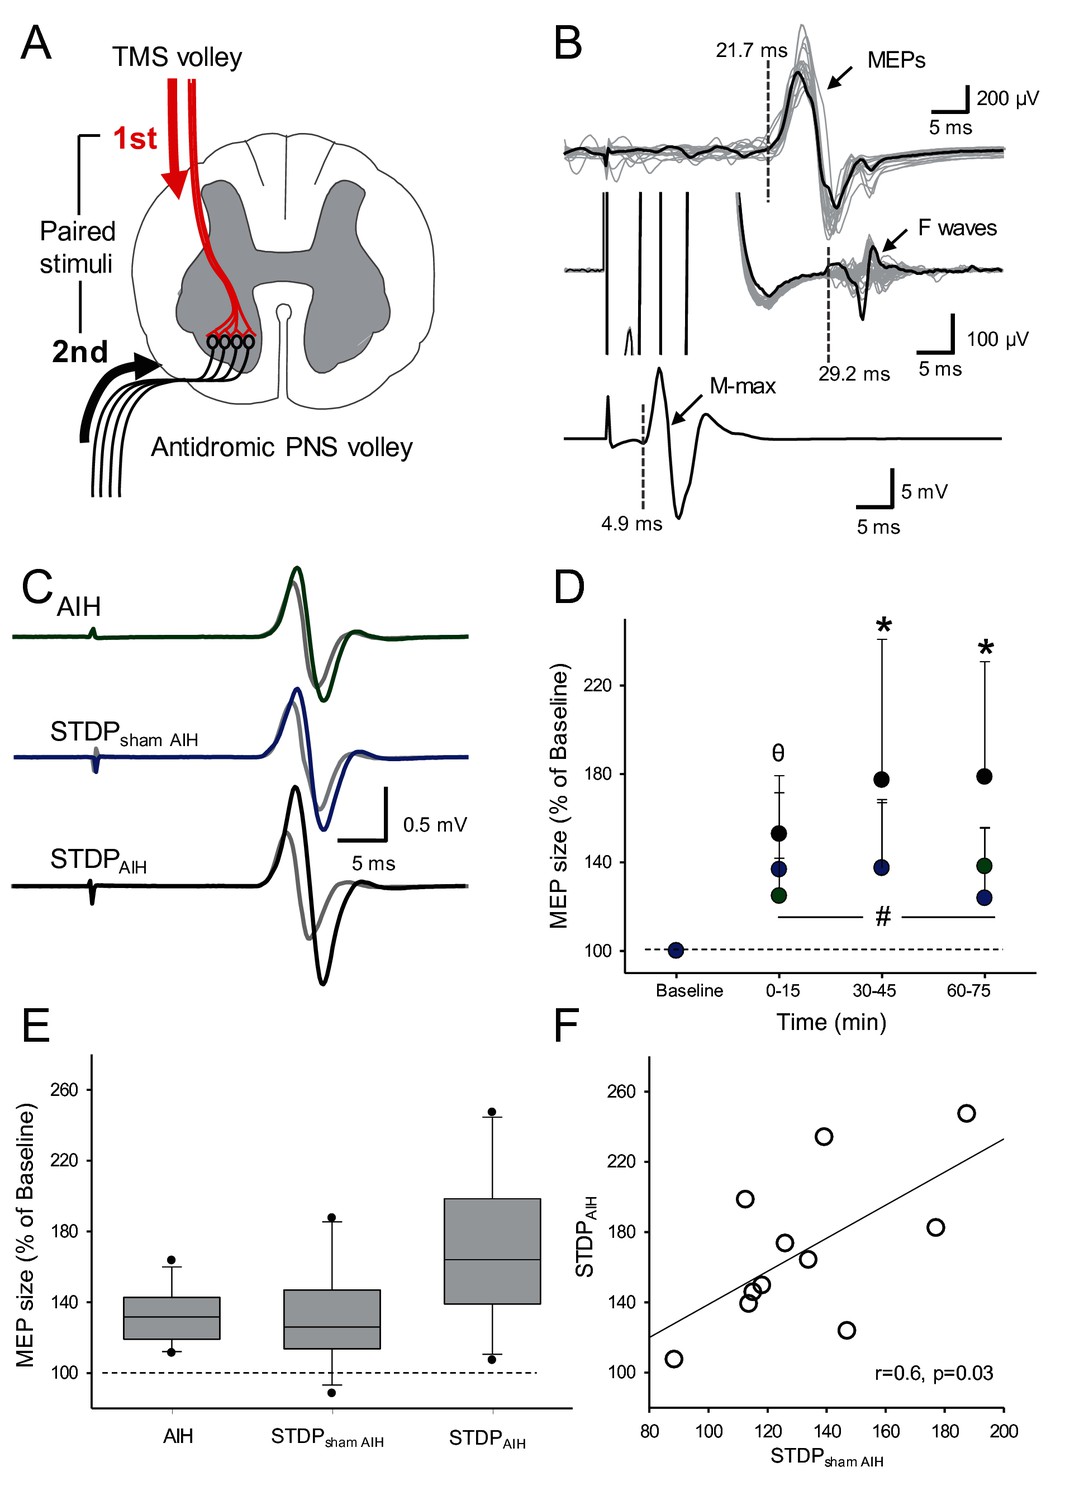
Spike-timing dependent plasticity (STDP).
(A) Diagram showing the STDP protocol where corticospinal volleys evoked by TMS over the hand representation of the primary motor cortex were timed to arrive at corticospinal-motoneuronal synapses of the FDI muscle 2 ms before antidromic potentials elicited in motoneurons by peripheral nerve stimulation (PNS) of the ulnar nerve. (B) Raw traces showing a MEP, an F-wave, and the M-max from a representative subject recorded from the FDI muscle used to calculate central and peripheral conduction time to estimate the arrival of pre- and post-synaptic volleys at the corticospinal-motoneuronal synapse. (C) Raw MEP traces from a representative participant showing MEPs at baseline (grey traces) and immediately after AIH (green trace), STDP combined with sham AIH (STDPsham AIH, blue trace) and STDP combined with AIH (STDPAIH, black trace). Each trace is the average of 20 trials. (D) Group data (n = 11) showing the effect of AIH (green circles), STDPsham AIH (blue circles), and STDPAIH (black circles). The abscissa shows the time of measurements (baseline, immediately after (0–15), 30–45, and 60–75 min after each protocol) and the ordinate shows the MEP amplitude (expressed as a % of Baseline). (E) Graph shows box-plots group normalized MEP data at baseline (dotted line) and after the AIH and sham AIH protocols from all time points averaged. The abscissa shows the protocol tested (AIH, STDPsham AIH and STDPAIH) and the ordinate shows the MEP amplitude (expressed as a % of Baseline). Whiskers illustrate 5th and 95th percentiles and dots represent minimal and maximal values. (F) Correlation analysis between increases in MEP amplitude after STDPAIH and STDPsham AIH. Error bars indicate SDs. *p<0.05, STDPAIH different than AIH and STDPsham, θ p<0.05, STDPAIH different than AIH, #p<0.001, comparison with the baseline.
Additional files
-
Transparent reporting form
- https://doi.org/10.7554/eLife.34304.008
Download links
A two-part list of links to download the article, or parts of the article, in various formats.
Downloads (link to download the article as PDF)
Open citations (links to open the citations from this article in various online reference manager services)
Cite this article (links to download the citations from this article in formats compatible with various reference manager tools)
Acute intermittent hypoxia enhances corticospinal synaptic plasticity in humans
eLife 7:e34304.
https://doi.org/10.7554/eLife.34304


