Macro-connectomics and microstructure predict dynamic plasticity patterns in the non-human primate brain
- Icahn School of Medicine at Mount Sinai, United States
- Friedman Brain Institute, Icahn School of Medicine at Mount Sinai, United States
- National Institute of Mental Health, United States
- Newcastle University, United Kingdom
- John Radcliffe Hospital, University of Oxford, United Kingdom
- Radboud University, The Netherlands
Figures
Figure 1
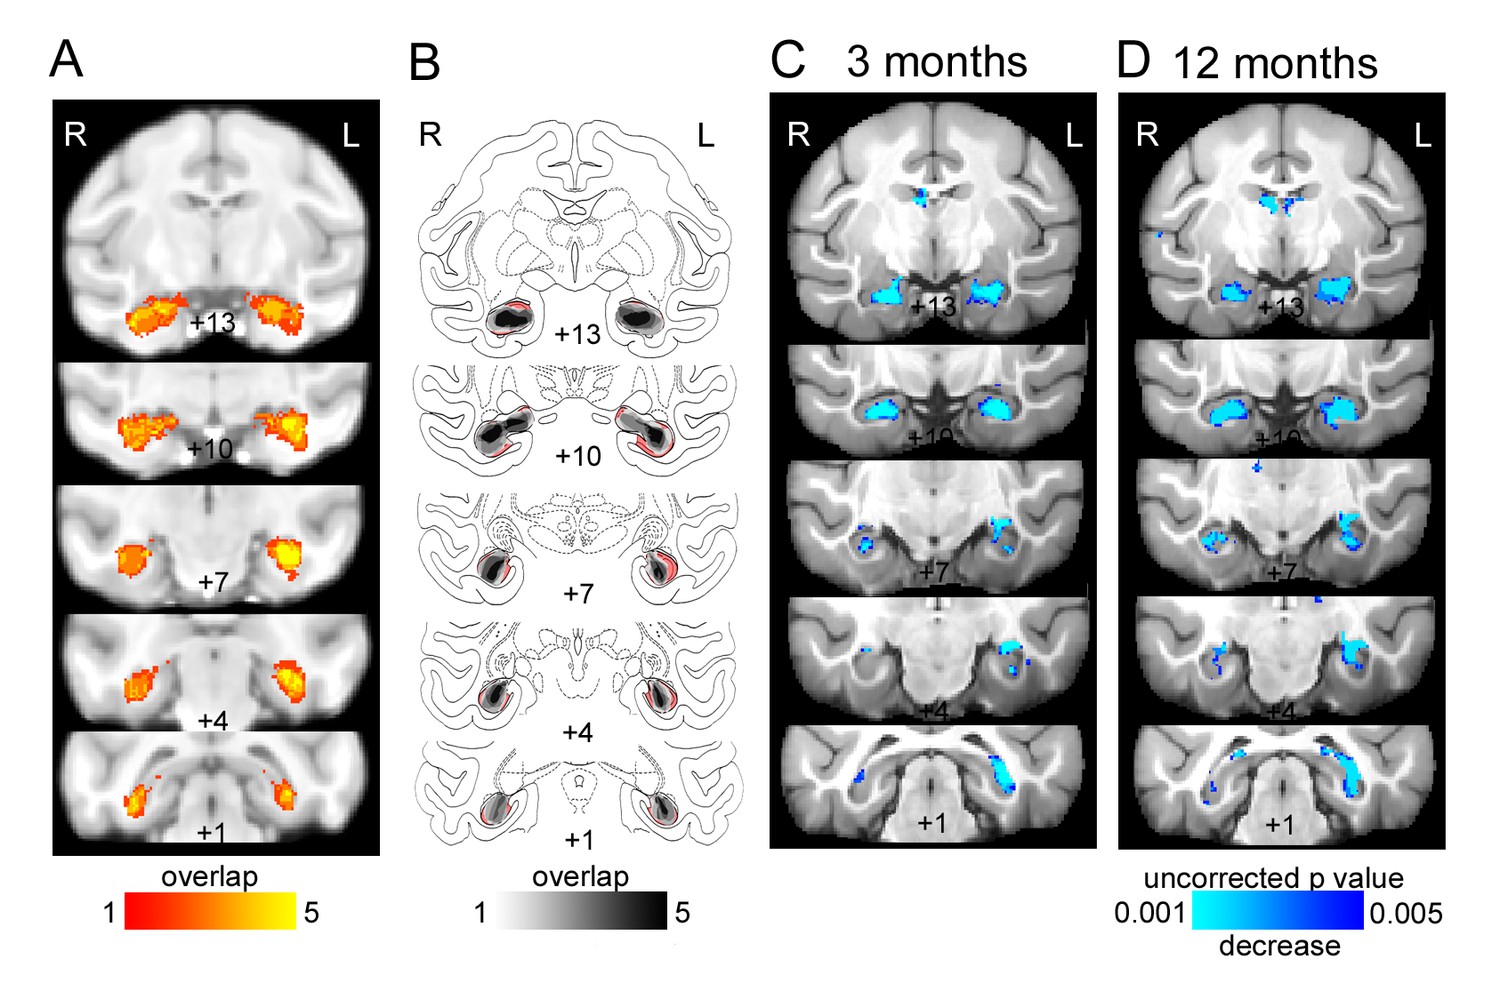
Bilateral hippocampal lesions.
(A) T2-weighted hypersignal 6 days after surgery indicating local inflammation in the hippocampus; overlap is shown for the five monkeys. (B) Sketch of hippocampal size based on histology (Nissl stained sections) overlaid on atlas sections. The unlesioned hippocampal volume is shown in red. Overlap of remaining hippocampal volume is shown for the five monkeys indicating shrinkage of the hippocampus bilaterally in all monkeys. (C-D) Results of deformation-based morphometry analysis showing atrophy of the hipppocampus (C) 3 months after the lesion and (D) 12 months after the lesion.
Figure 2
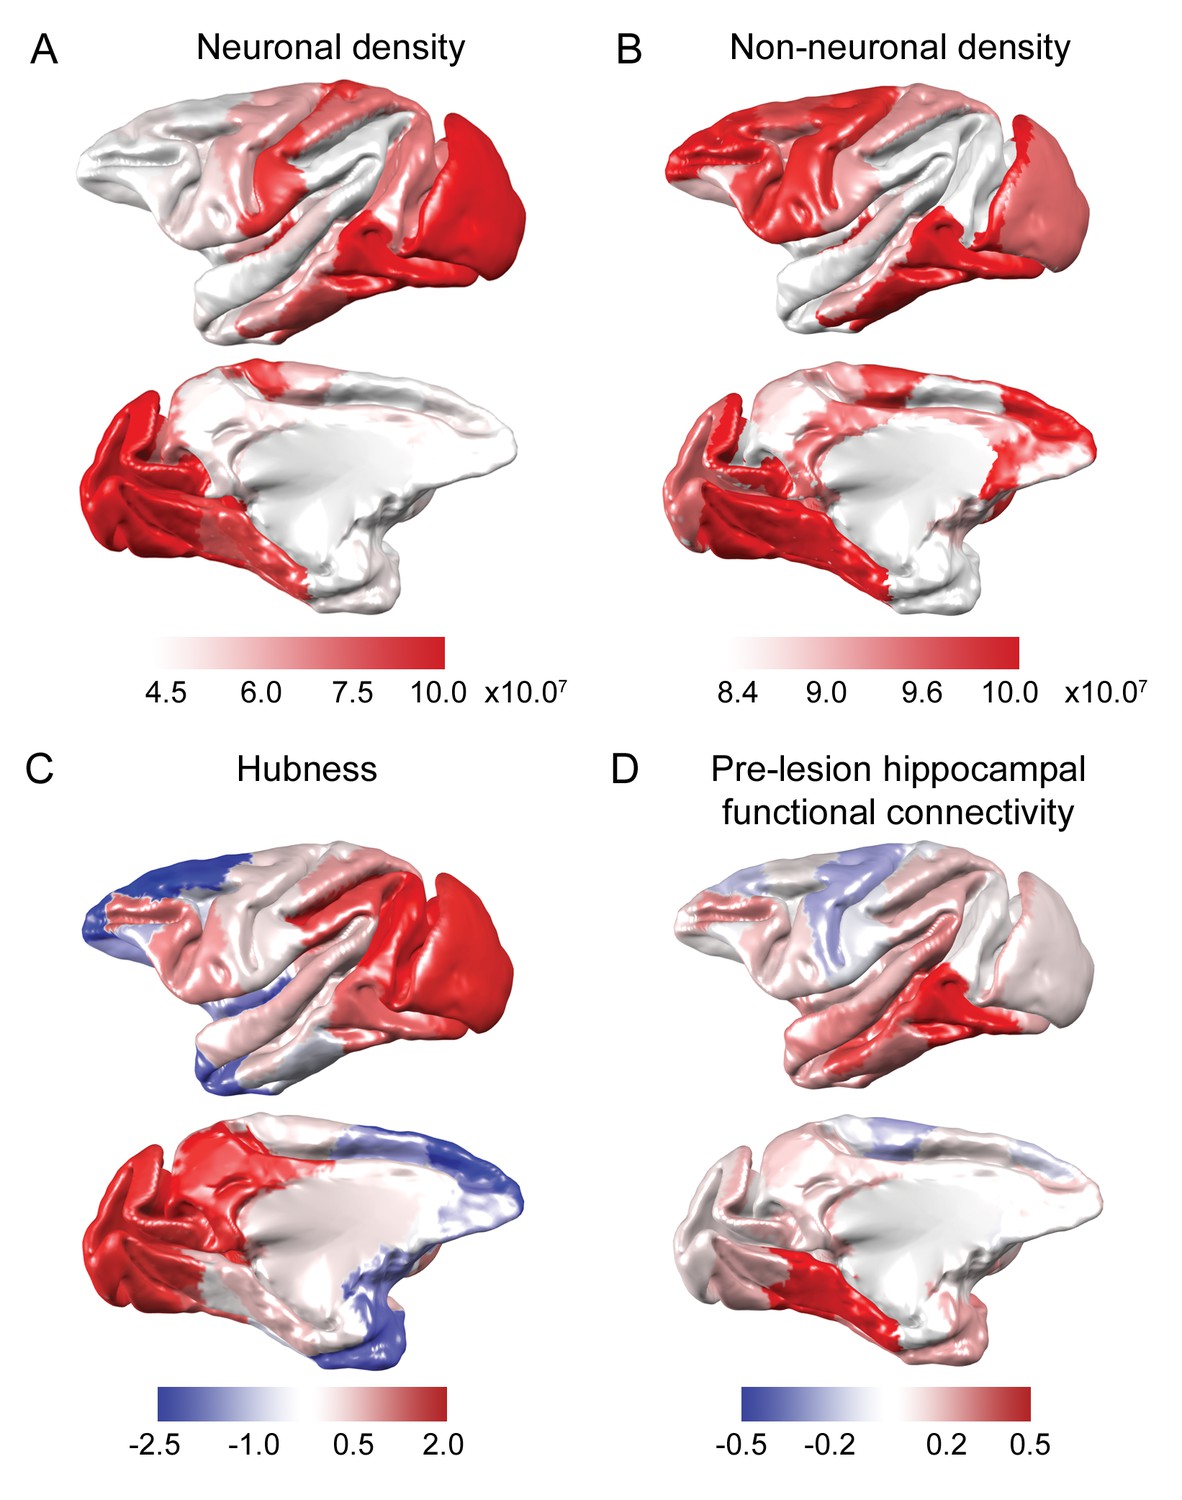
Anatomical and functional predictors of plasticity.
(A-B) Neuron and non-neuronal cell densities were mapped from Collins et al., 2010. (C) Hubness was calculated as each area’s projection onto the first principal component of node strength and network participation coefficient data. (D) Pre-lesion hippocampal functional connectivity was strongly correlated with anatomical connectivity derived from the CoCoMac tract-tracing atlas (r = 0.54, p = 2.2×10⁻⁷) and enhanced versions of the CoCoMac Atlas (r = 0.60, p = 3.6×10⁻⁹). The hippocampus was most strongly connected to ventral temporal lobe structures..
Figure 3
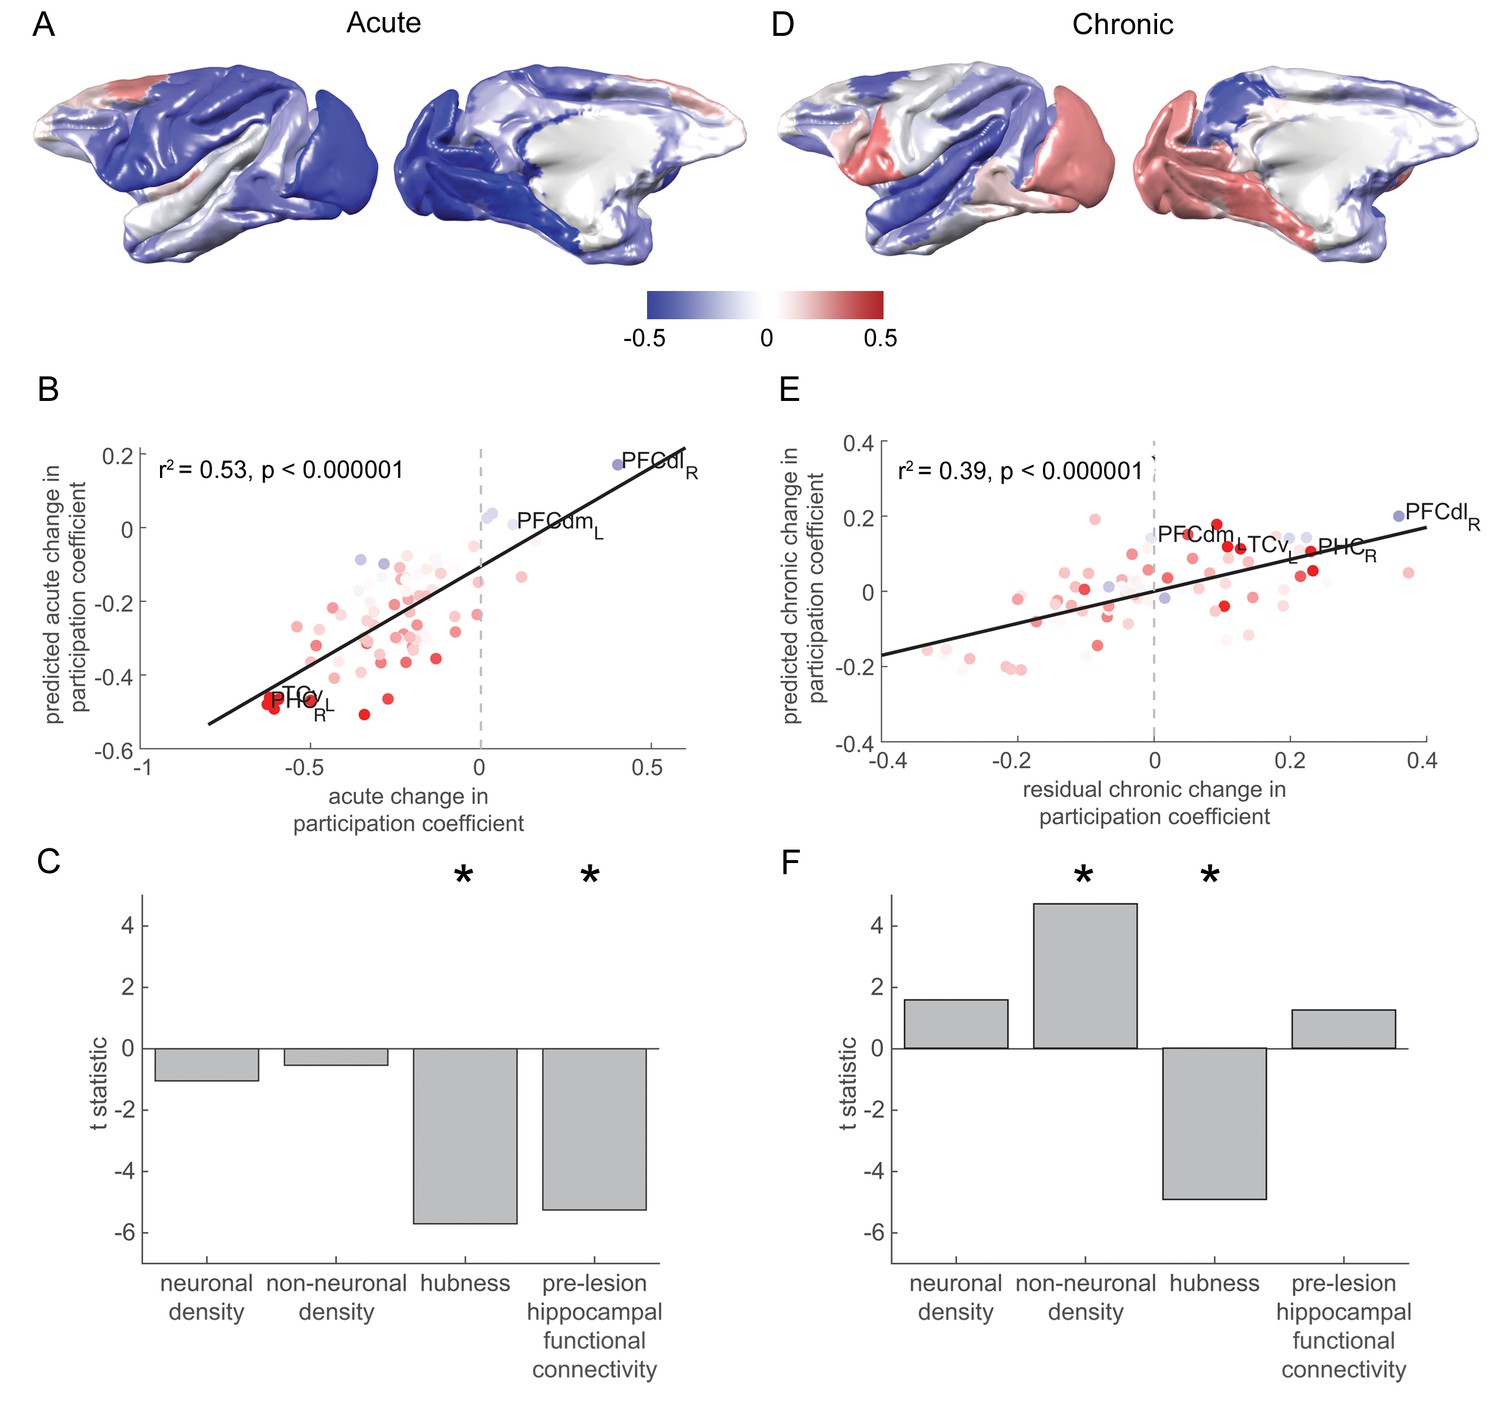
Changes in network participation are strongly predicted by pre-lesion anatomy and functional connectivity.
(A) Most brain regions showed a drop in network participation over the acute stage. (B-C) The degree to which individual brain regions reduced their network participation over the acute stage was well predicted by their pre-lesion connectivity to the hippocampus and the extent to which they acted as hubs in the pre-lesion network (‘hubness’). (B) A scatter plot of the acute stage changes to the network participation coefficient for each brain regions, compared to model predictions. Brain regions are coloured according to their pre-lesion connectivity with the hippocampus (compare with Figure 2D). (D-F) As in (A-C), but for chronic stage changes to network participation. Note that areas with a higher non-neuronal cell density showed the greatest increase in the network participation coefficient over the chronic stage. Note that (D) shows the overall within network participation coefficient changes for the chronic stage, while the model predictions and data shown in (E-F) corresponded to the residual chronic stage changes to within the network participation coefficient, after regressing out acute stage changes. * signifies that these predictors were significant and included in the final model.
Figure 4
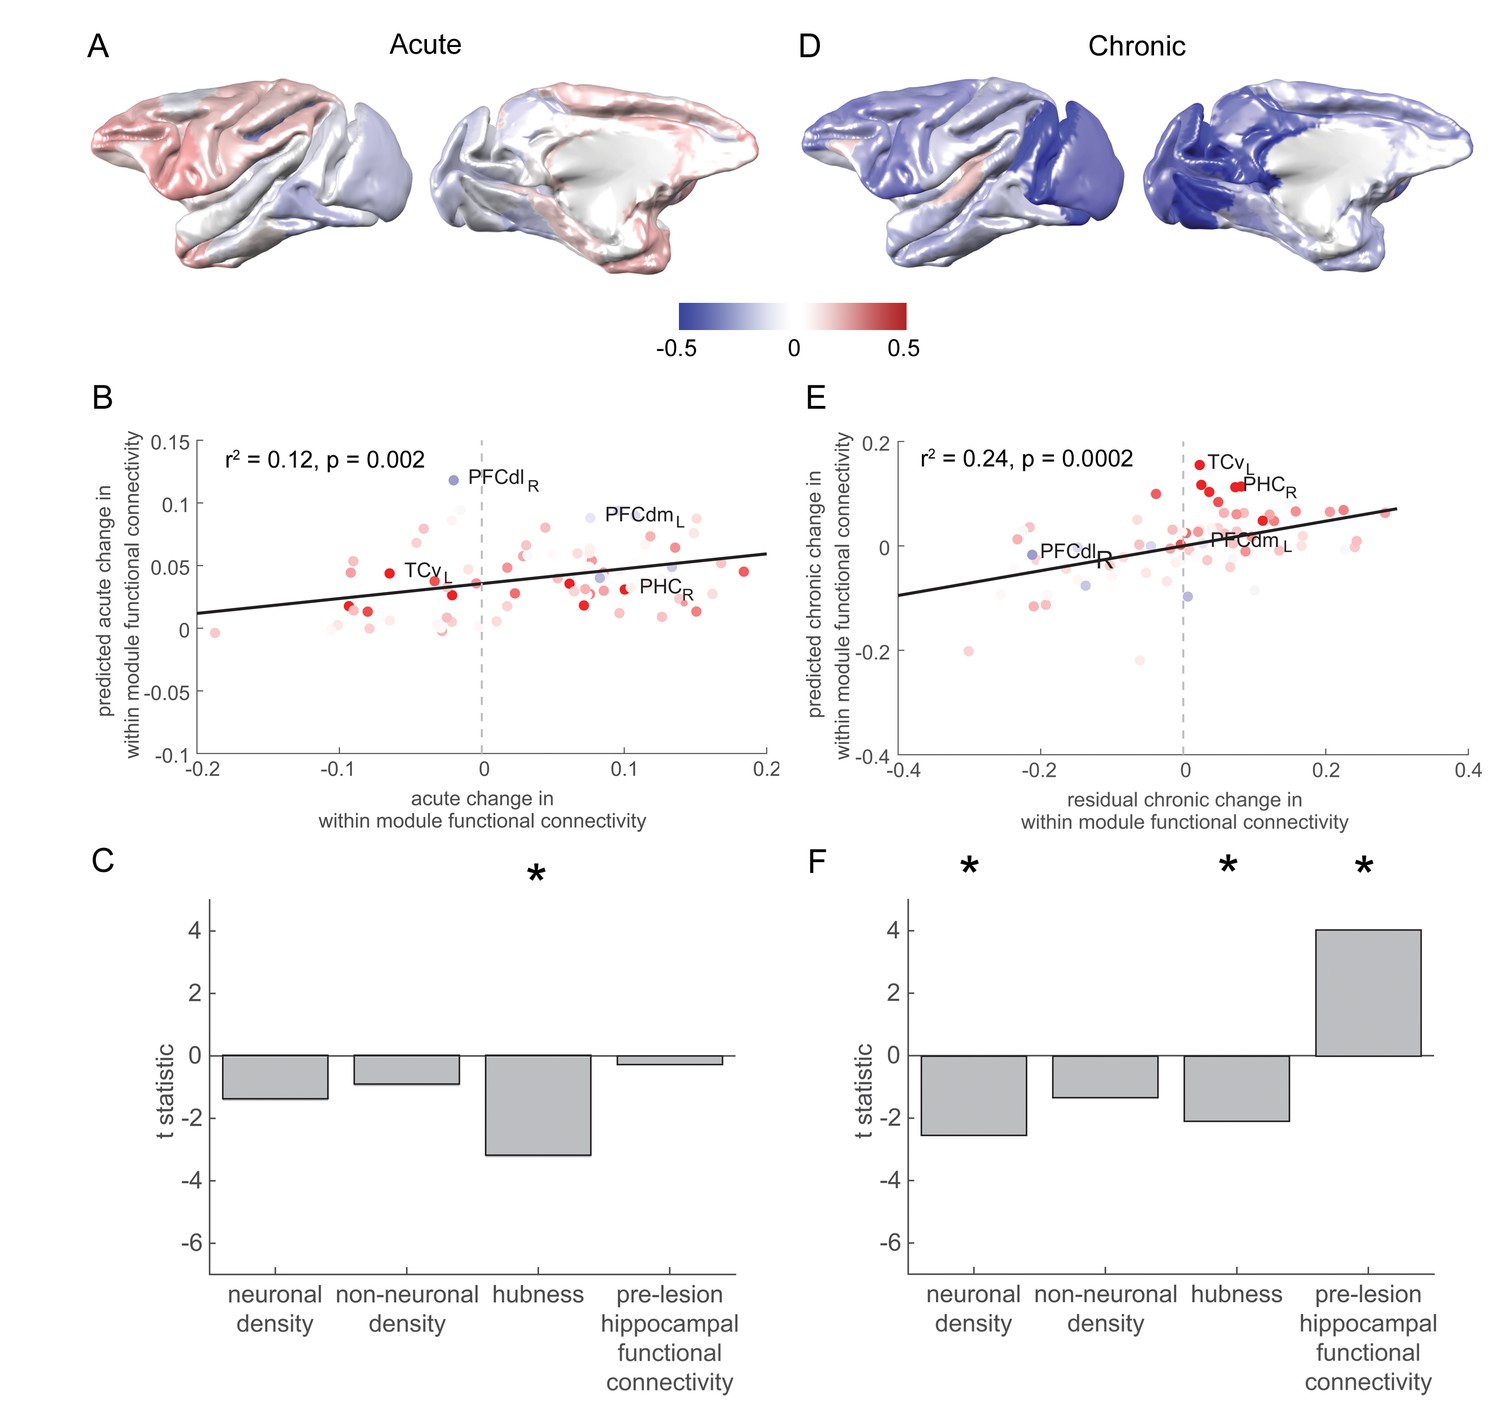
Pre-lesion hippocampal connectivity is associated with a rise in within-module connectivity over the chronic stage.
(A) The pattern of acute stage increases and decreases to within-module connectivity. (B-C) The degree to which individual brain regions changed their within-module connectivity over the acute stage was significantly associated with the extent to which they acted as hubs in the pre-lesion network (‘hubness’). Scatter plot in (B) shows brain regions coloured according to their pre-lesion connectivity with the hippocampus (compare with Figure 2D). (D-F) As in (A-C), but for chronic stage changes to within-module connectivity. Note that (D) shows the overall within module-connectivity changes for the chronic stage, while the model predictions and data shown in (E-F) corresponded to the residual chronic stage changes to within module-connectivity, after regressing out acute stage changes. * signifies that these predictors were significant and included in the final model.
Figure 5
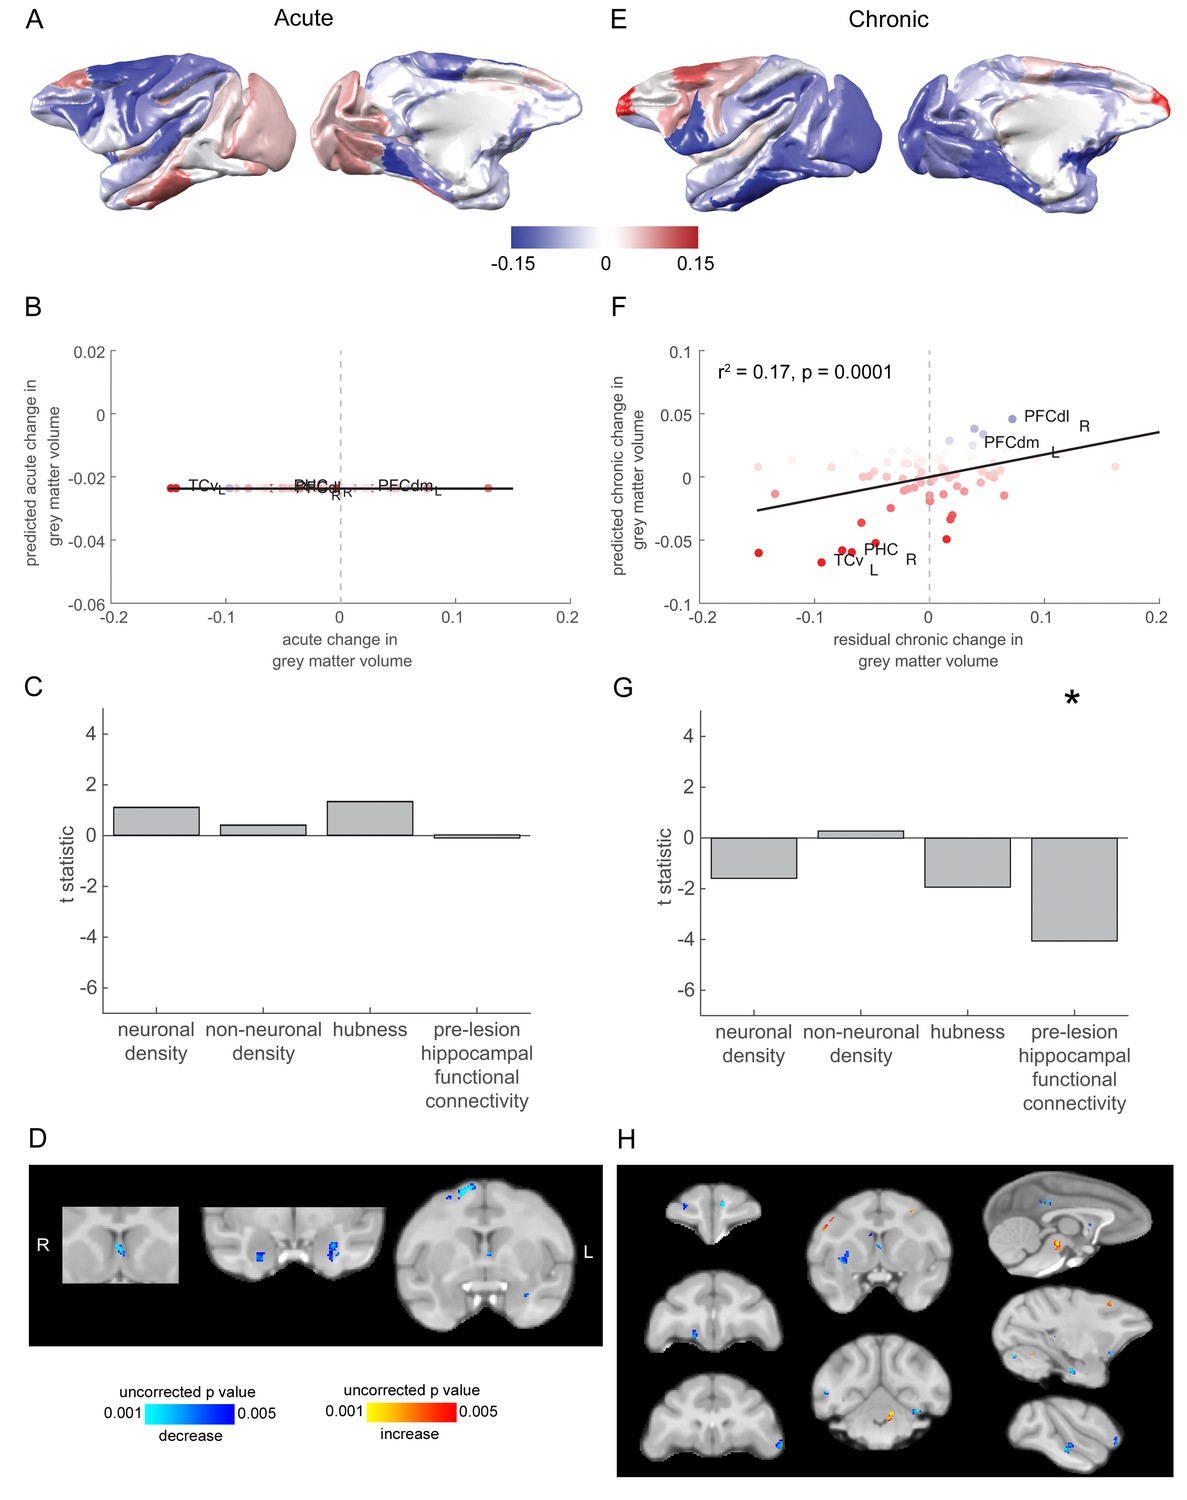
Grey matter loss at the chronic stage was most prominent in cortical regions that were strongly connected to the hippocampus.
(A) The pattern of acute stage increases and decreases to cortical grey matter volume. (B-C) No significant predictors of acute stage cortical grey matter changes were identified. (D) Whole brain voxelwise analysis revealed very limited volumetric decreases in the medial septum, amygdala and dorsal premotor cortex. (E) As in (A), but for chronic stage changes to cortical grey-matter volume. (E-F). The degree to which individual cortical regions changed their grey-matter volume over the chronic stage was significantly associated with the extent to which they were functionally connected to the hippocampus before the lesion. Scatter plot in (B) shows brain regions coloured according to their pre-lesion connectivity with the hippocampus (compare with Figure 2D). Note that (E) shows the overall within module-connectivity changes for the chronic stage, while the model predictions and data shown in (F-G) corresponded to the residual chronic stage changes to within module-connectivity, after regressing out acute stage changes. * signifies that this predictor was significant and included in the final model. (H) Whole brain voxelwise analysis revealed a larger range of decreases in grey-matter volume over the chronic stage. There were also volumetric increases in the cerebellum, midbrain and premotor cortex. These results did not survive multiple comparisons correction.
Figure 6
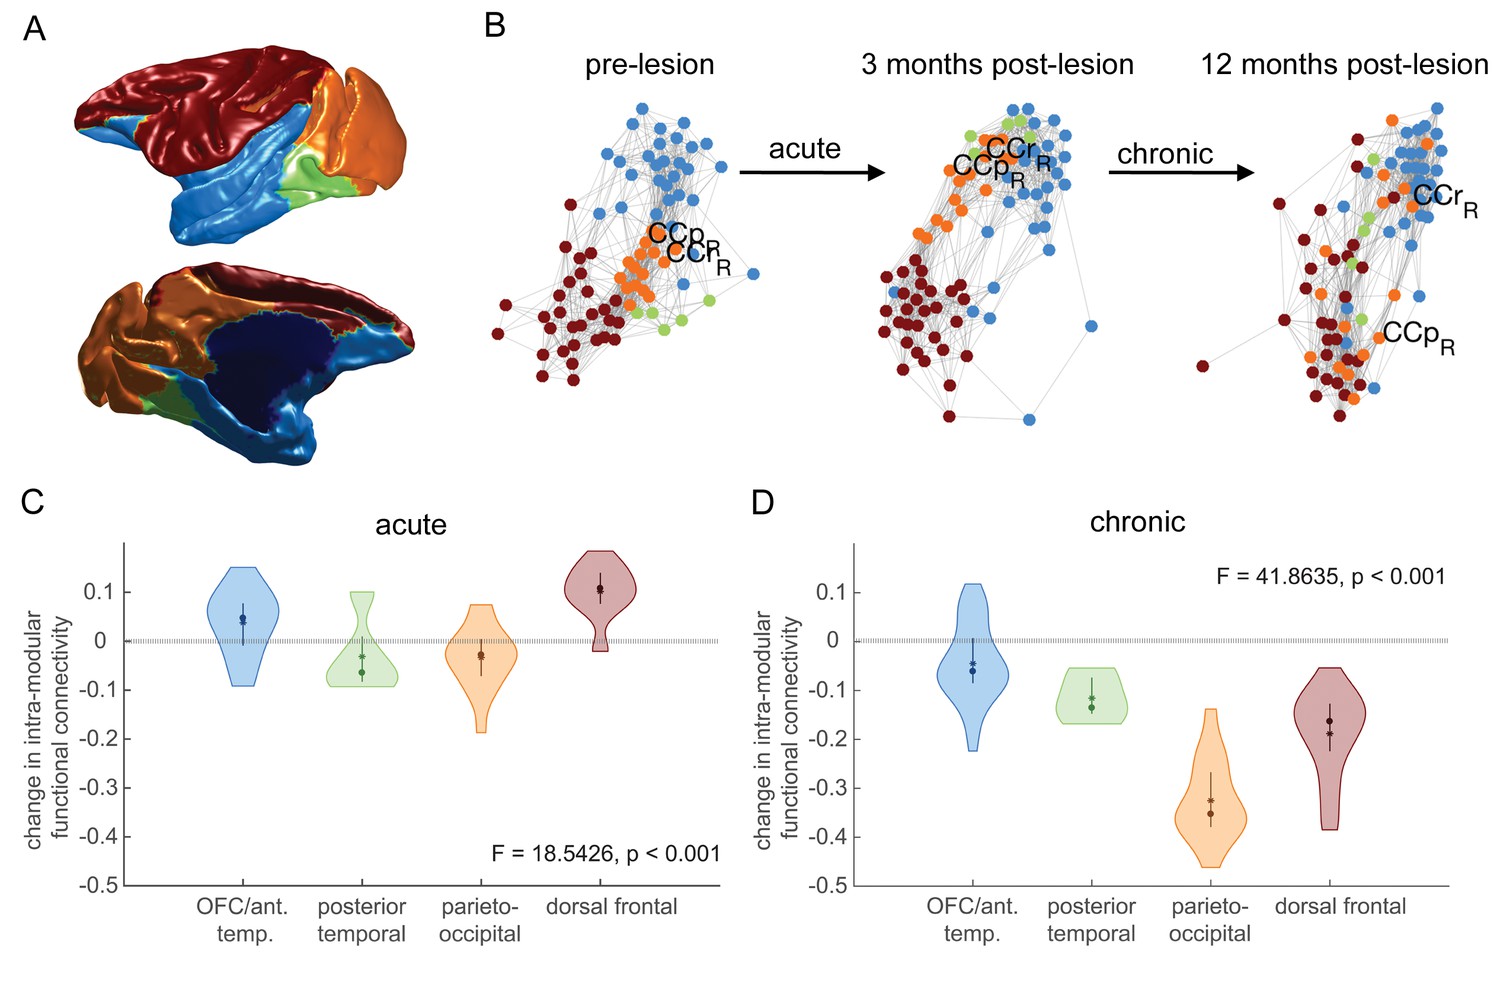
Effects of hippocampal lesions on module structure.
The most consistent pre-operatively defined modules are shown anatomically (A) and using a force-directed graph representation (B) where highly functionally connected brain regions are plotted close together. Before the lesion, the parieto-occipital module (orange) is highly connected to the three other modules. At 3 months post-lesion, the network looks largely similar, although there may have been some dispersion. At 12 months post-lesion however, the parieto-occipital module is completely dispersed, with some dispersion of other modules. (C-D) We quantified this dispersion by the mean change in within-module functional connectivity for each module. There is a significant effect of module on node dispersion over both the acute (C – pre-lesion vs. 3 months post-lesion) and chronic (D – 3 months vs 12 months post-lesion) stages.
Author response image 1
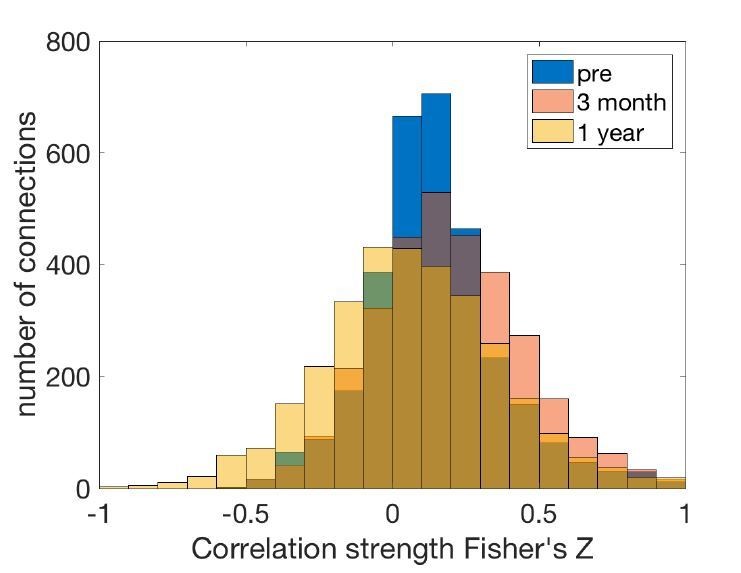
Connectivity strength distribution at different stages.
Author response image 2
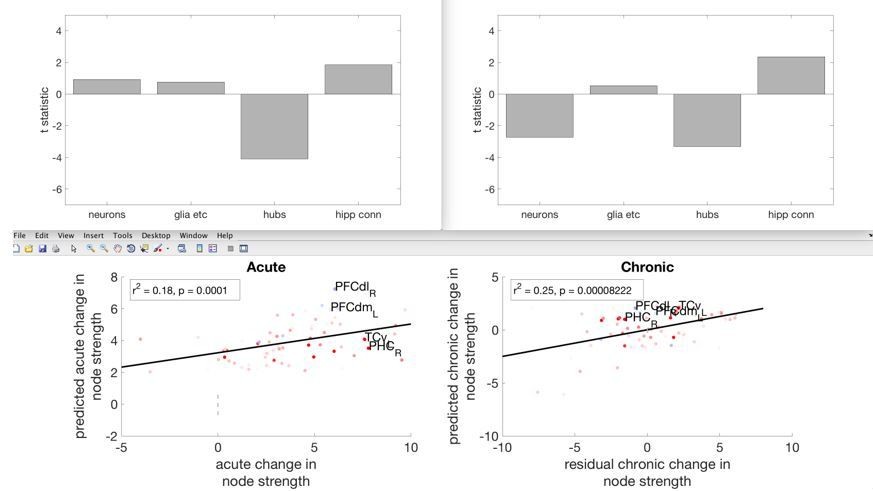
Showing the acute and chronic changes in overall node strength, and its relationship with the four independent variables.
Tables
Table 1
Remaining volume of tissue in each lesioned monkey (calculated relative to atlas volumes from Nissl-stained histological sections registered to atlas sections) and lesion extent expressed as a percentage (1-(remaining volume/normal volume)).
https://doi.org/10.7554/eLife.34354.010| Monkey | Left hemisphere remaining volume | Right hemisphere remaining volume | Bilateral remaining volume | Left hemisphere lesion % | Right hemisphere lesion % | Total lesion % |
|---|---|---|---|---|---|---|
| Atlas | 268144 | 268665 | 536809 | |||
| Mean | 149379 | 121895 | 271274 | 44.29 | 54.63 | 49.46 |
| E | 184498 | 146047 | 330545 | 31.19 | 45.64 | 38.42 |
| M | 129741 | 84877 | 214618 | 51.62 | 68.41 | 60.02 |
| N | 159535 | 158787 | 318322 | 40.50 | 40.90 | 40.70 |
| S | 94769 | 89512 | 184281 | 64.66 | 66.68 | 65.67 |
| T | 178354 | 130254 | 308608 | 33.49 | 51.52 | 42.51 |
Table 2
Details of monkeys and surgeries.
https://doi.org/10.7554/eLife.34354.009| T1-weighted | Resting-state | ||||||
|---|---|---|---|---|---|---|---|
| Monkey | Group | Pre | 3 month | 1 year | Pre | 3 month | 1 year |
| E | Lesion | X | X | X | X | ||
| M | Lesion | X | X | X | X | X | X |
| N | Lesion | X | X | X | X | ||
| S | Lesion | X | X | X | X | X | |
| T | Lesion | X | X | X | X | X | X |
| C | Control | X | X | ||||
| L | Control | X | X | ||||
| W | Control | X | X | ||||
| Total | 8 | 5 | 4 | 6 | 4 | 4 | |
Table 3
Lesion volumes calculated from T2-weighted hypersignal relative to whole hippocampal volume for each monkey. All monkeys received two lesion attempts except monkey E.
https://doi.org/10.7554/eLife.34354.011| Hippocampus | Left | Right | ||||||||
|---|---|---|---|---|---|---|---|---|---|---|
| Monkey | Lesion attempts | Volume | Lesion | % | Volume | Lesion | % | Volume | Lesion | % |
| E | 1 | 821.38 | 244.13 | 29.72 | 429.25 | 94.88 | 22.10 | 392.13 | 149.25 | 38.06 |
| M | 2 | 1019.75 | 563.38 | 55.25 | 516.63 | 190.50 | 36.87 | 503.13 | 372.88 | 74.11 |
| N | 2 | 1161.38 | 179.50 | 15.46 | 607.63 | 109.38 | 18.00 | 553.75 | 70.13 | 12.66 |
| S | 2 | 979.24 | 706.49 | 72.15 | 484.12 | 398.37 | 82.29 | 495.12 | 308.12 | 62.23 |
| T | 2 | 937.38 | 690.63 | 73.68 | 442.88 | 364.00 | 82.19 | 494.50 | 326.63 | 66.05 |
Table 4
List of regional map abbreviations and corresponding brain areas.
https://doi.org/10.7554/eLife.34354.012| Regional map abbreviation | Brain area |
|---|---|
| A1 | Primary auditory cortex |
| A2 | Secondary auditory cortex |
| Ia | Anterior insula |
| Ip | Posterior insula |
| Amyg | Amygdala |
| CCa | Anterior cingulate cortex |
| CCp | Posterior cingulate cortex |
| CCr | Retrosplenial cortex |
| CCs | Subgenual cingulate cortex |
| FEF | Frontal eye field |
| G | Gustatory area |
| HC | Hippocampus |
| M1 | Primary motor cortex |
| PFCcl | Centrolateral prefrontal cortex |
| PFCdl | Dorsolateral prefrontal cortex |
| PFCdm | Dorsomedial prefrontal cortex |
| PFCm | Medial prefrontal cortex |
| PFCoi | Intermediate orbital prefrontal cortex |
| PFCol | Orbitolateral prefrontal cortex |
| PFCom | Orbitomedial prefrontal cortex |
| PFCvl | Ventrolateral prefrontal cortex |
| PFCpol | Polar prefrontal cortex |
| PHC | Parahippocampal cortex |
| PMCdl | Dorsolateral premotor cortex |
| PMCm | Medial (supplementary) premotor cortex |
| PMCvl | Ventrolateral premotor cortex |
| S1 | Primary somatosensory cortex |
| S2 | Secondary somatosensory cortex |
| PCi | Inferior parietal cortex |
| PCip | Cortex of the intraparietal sulcus |
| PCm | Medial parietal cortex |
| PCs | Superior parietal cortex |
| TCc | Central temporal cortex |
| TCi | Inferior temporal cortex |
| TCs | Superior temporal cortex |
| TCpol | Polar temporal cortex |
| TCv | Ventral temporal cortex |
| V1 | Primary visual cortex |
| V2 | Secondary visual cortex |
| VACd | Dorsal anterior visual cortex |
| VACv | Ventral anterior visual cortex |
Additional files
-
Transparent reporting form
- https://doi.org/10.7554/eLife.34354.013
Download links
A two-part list of links to download the article, or parts of the article, in various formats.
Downloads (link to download the article as PDF)
Open citations (links to open the citations from this article in various online reference manager services)
Cite this article (links to download the citations from this article in formats compatible with various reference manager tools)
Macro-connectomics and microstructure predict dynamic plasticity patterns in the non-human primate brain
eLife 7:e34354.
https://doi.org/10.7554/eLife.34354


