Replication Study: Intestinal inflammation targets cancer-inducing activity of the microbiota
- University of Michigan Medical School, United States
Figures
Figure 1 with 2 supplements
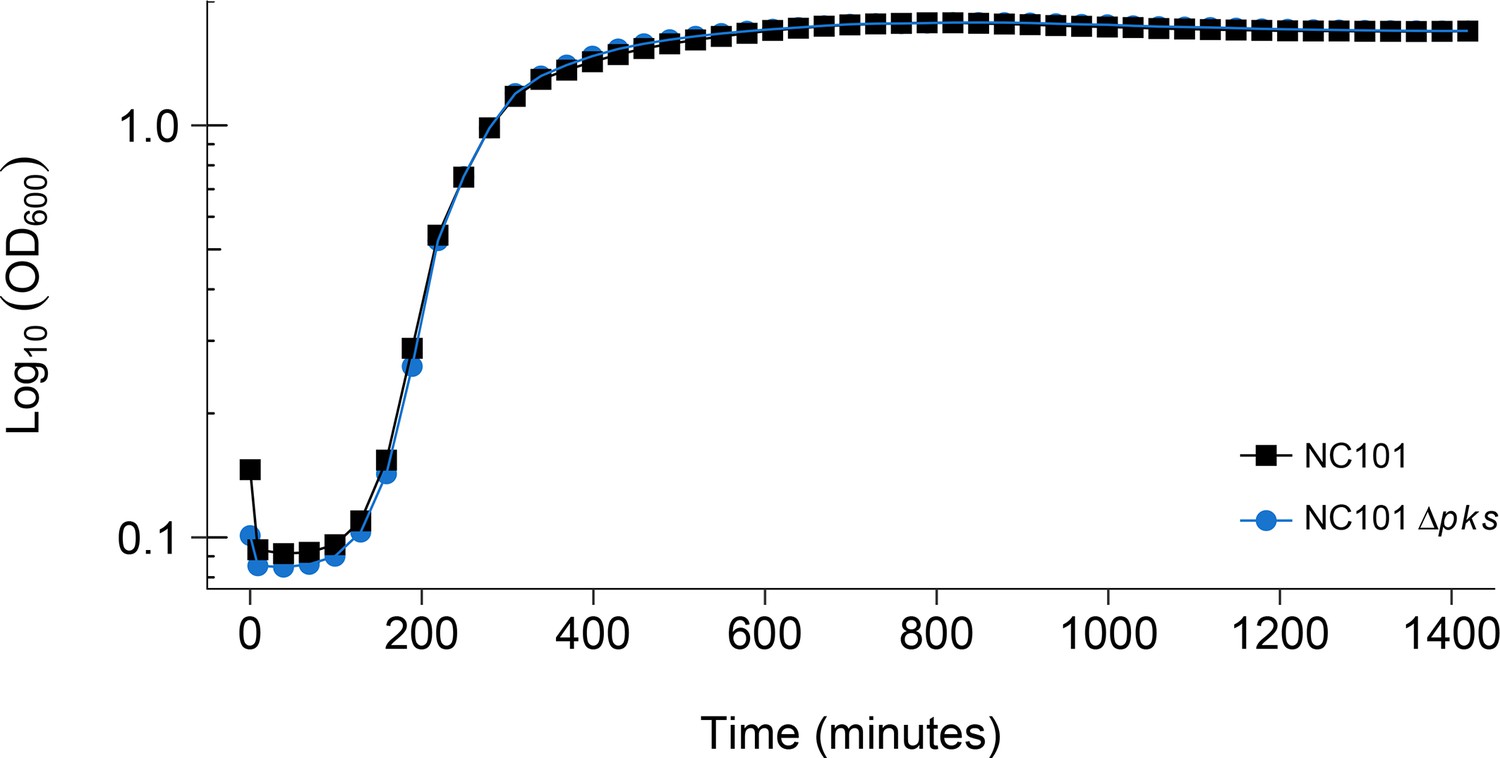
Detection of pks island and impact of pks island deletion on bacterial growth in vitro.
In vitro growth curve of E. coli NC101 and E. coli NC101 pks. Overnight bacterial cultures were diluted 1:500 in Luria-Bertani (LB) broth and incubated at 37˚C. Absorbance at 600 nm (OD600) was measured every 30 min. Representative growth curves of 3 independent biological repeats. The intrinsic doubling time was determined to be 36 min, 95% CI [27-45] for the NC101 strain and 52 min, 95% CI [6-97] for the NC101 pks strain. Additional details for this experiment can be found at https://osf.io/54rgt/.
Figure 1—figure supplement 1
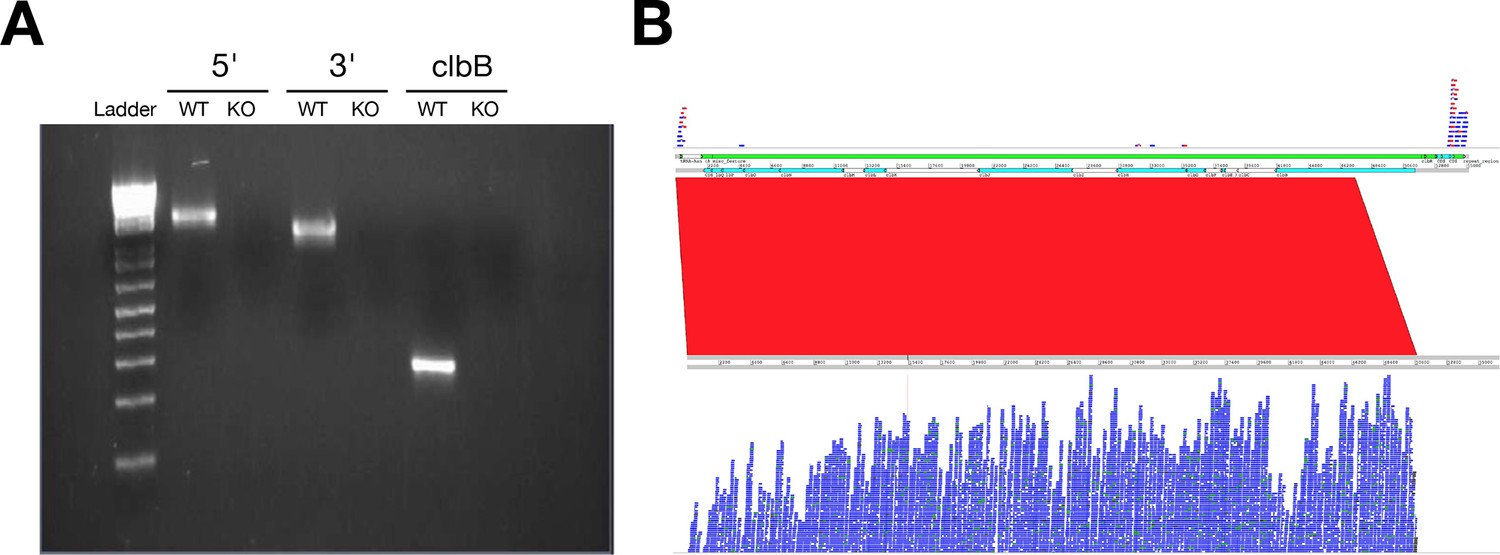
Confirmation of pks island deletion.
(A) Representative gel image of PCR reactions from each bacterial strain (E. coli NC101 and E. coli NC101 pks) performed with primers specific for the 5’ or 3’ end of the pks island (product size = 1824 bp or 1413 bp, respectively) or the genotoxin colibactin (clbB) (product size = 280 bp). (B) Screenshot from the Artemis Comparison Tool showing the absence of pks island from E. coli NC101 pks and its presence in E. coli NC101. Reads from NC101 pks were mapped to the pks island region (top panel), where reads only mapped to the flanking region of the pks island region of the reference genome assembly (GenBank Accession number: AM229678.1). Reads from NC101 were mapped to the pks island region (bottom panel), where reads mapped across the entire pks island region of the reference genome assembly. The red band indicates the sequence similarity from the pks island region sequenced from NC101 and the region extracted from the wild type genome reference assembly. Additional details for this experiment can be found at https://osf.io/ye9gh/.
Figure 1—figure supplement 2
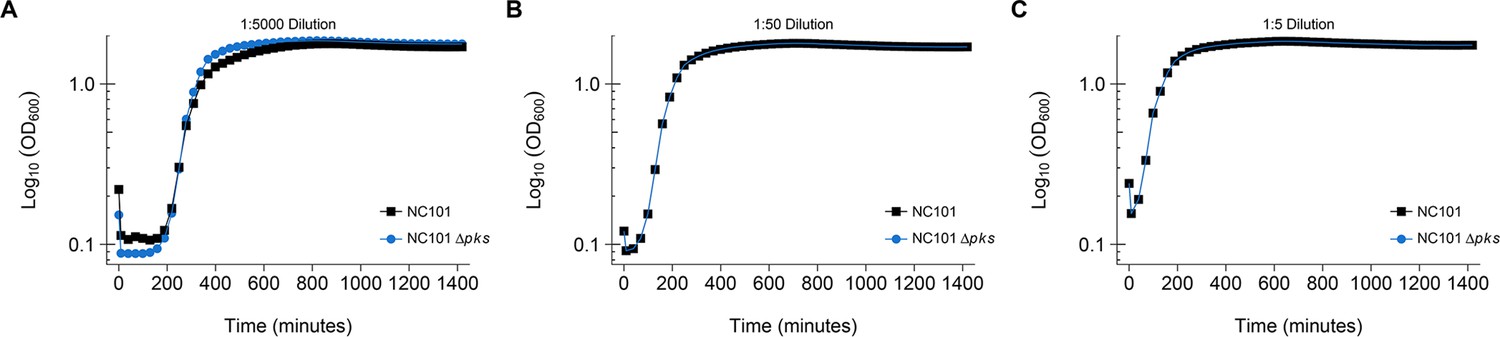
Additional dilutions used with growth curve assay.
This is the same experiment as in Figure 1. In addition to 1:500 dilutions of the bacterial strains, 1:5, 1:50, and 1:5000 dilutions were also performed with OD600 measurements taken every 30 min. Representative growth curves of 3 independent biological repeats. Additional details for this experiment can be found at https://osf.io/54rgt/.
Figure 2 with 2 supplements
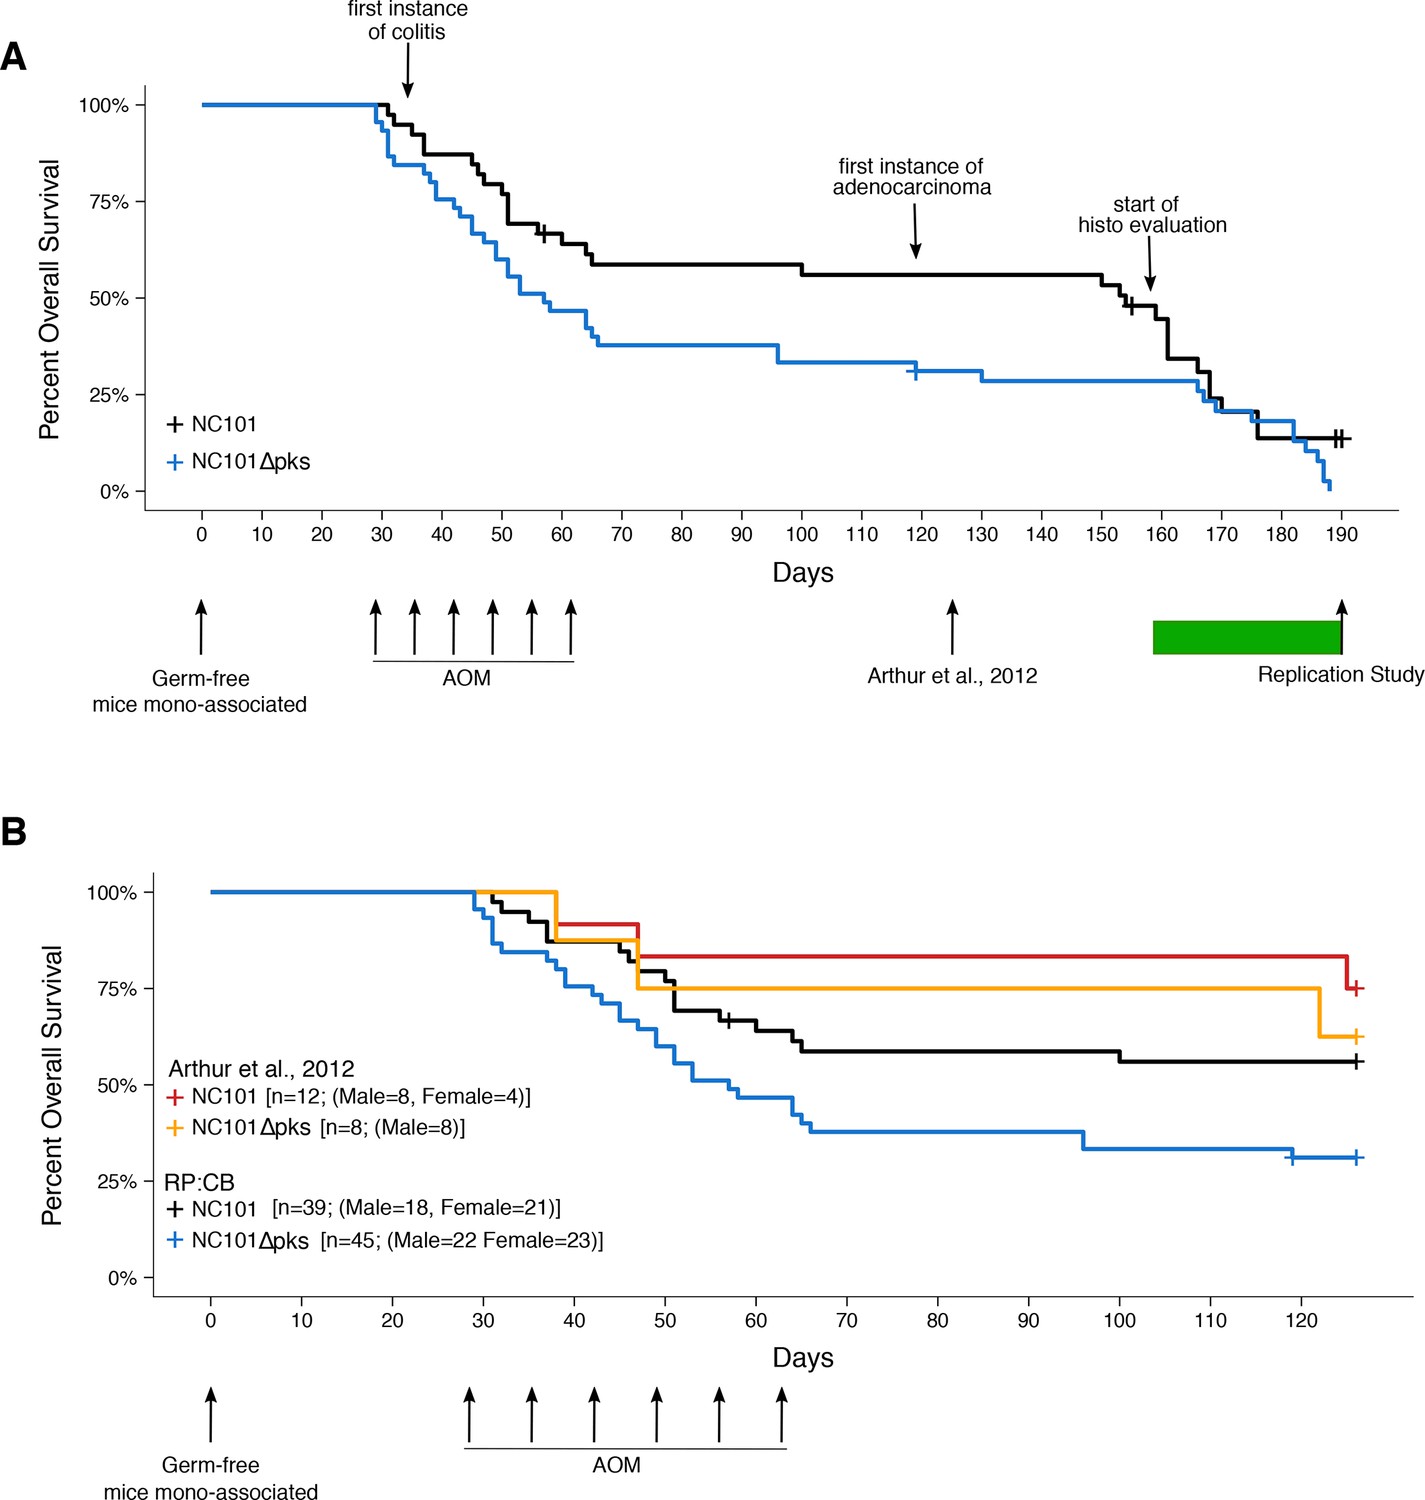
Impact of pks island deletion on mouse survival.
Female and male Il10-/- germ-free mice were randomly assigned to be mono-associated with either E. coli NC101 or E. coli NC101 pks at age 7-12 weeks. Four weeks after mono-association, mice received six weekly azoxymethane (AOM) injections to induce colon tumors. Mice were monitored until euthanized due to health complications or the pre-specified study end-point of 18 weeks after the last AOM injection (Replication Study). This experimental end-point was longer than the original study, which euthanized mice at 18 weeks after mono-association (Arthur et al., 2012). Number of mice monitored: n=39 for NC101 mono-associated mice and n=45 for NC101 pks mono-associated mice. Early in the study a few isocages were contaminated and had to be removed from the study. This did not affect the other isocages which remained gnotobiotic. Animals where bacterial contamination was detected (n=7 in 3 cages) were censored in the plots (denoted by a cross line). (A) Kaplan-Meier plot of overall survival starting at time of mono-association until 18 weeks after the last AOM injection, which is the experimental timing used in this replication. Green bar indicates when euthanized mice were histopathologically (histo) evaluated for inflammation and tumorigenesis. Log-rank (Mantel-Cox) test of NC101 pks compared to NC101 (p = 0.0608); HR=1.57, 95% CI [0.98, 2.51]. (B) Kaplan-Meier plot of overall survival starting at time of mono-association until 18 weeks after mono-association, which is the experimental timing used in the original study (Arthur et al., 2012). Original and replication data are plotted for direct comparison. Exploratory analysis of replication data: Log-rank (Mantel-Cox) test of NC101 pks compared to NC101 (p = 0.0230); HR=1.95, 95% CI [1.10, 3.45]. Additional details for this experiment can be found at https://osf.io/pm5xa/.
Figure 2—figure supplement 1
Impact of pks island deletion on bacterial growth in vivo.
The number of colony forming units (CFU/ml) were quantified from fecal matter collected at sacrifice for Il10-/- germ-free mice treated with AOM and mono-associated with either E. coli NC101 (range: 35-190 days after mono-association) or E. coli NC101 pks (range: 38-187 days after mono-association). Box and whisker plot with median represented as the line through the box and whiskers representing values within 1.5 IQR of the first and third quartile. Means as black dot and bold error bars represent 95% CI. Number of mice quantified: n=19 for NC101 mono-associated mice and n=17 for NC101 pks mono-associated mice. Additional details for this experiment can be found at https://osf.io/pm5xa/.
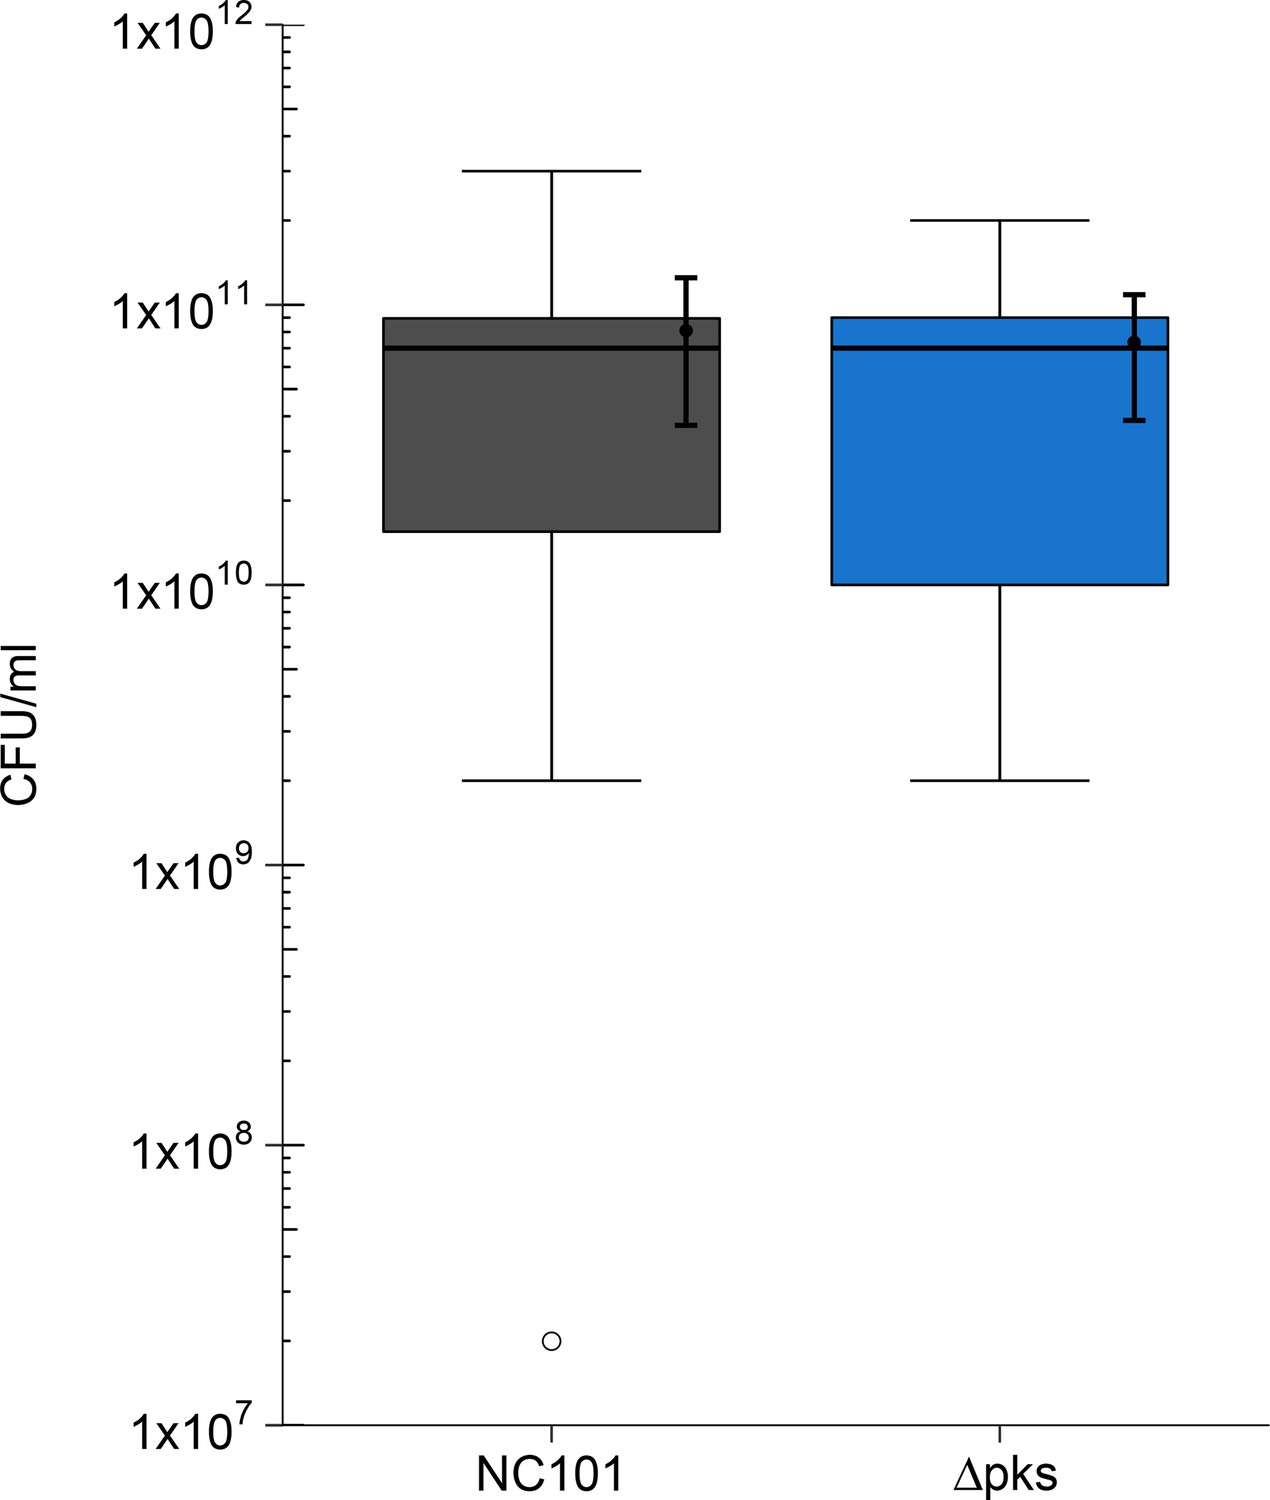
Figure 2—figure supplement 2
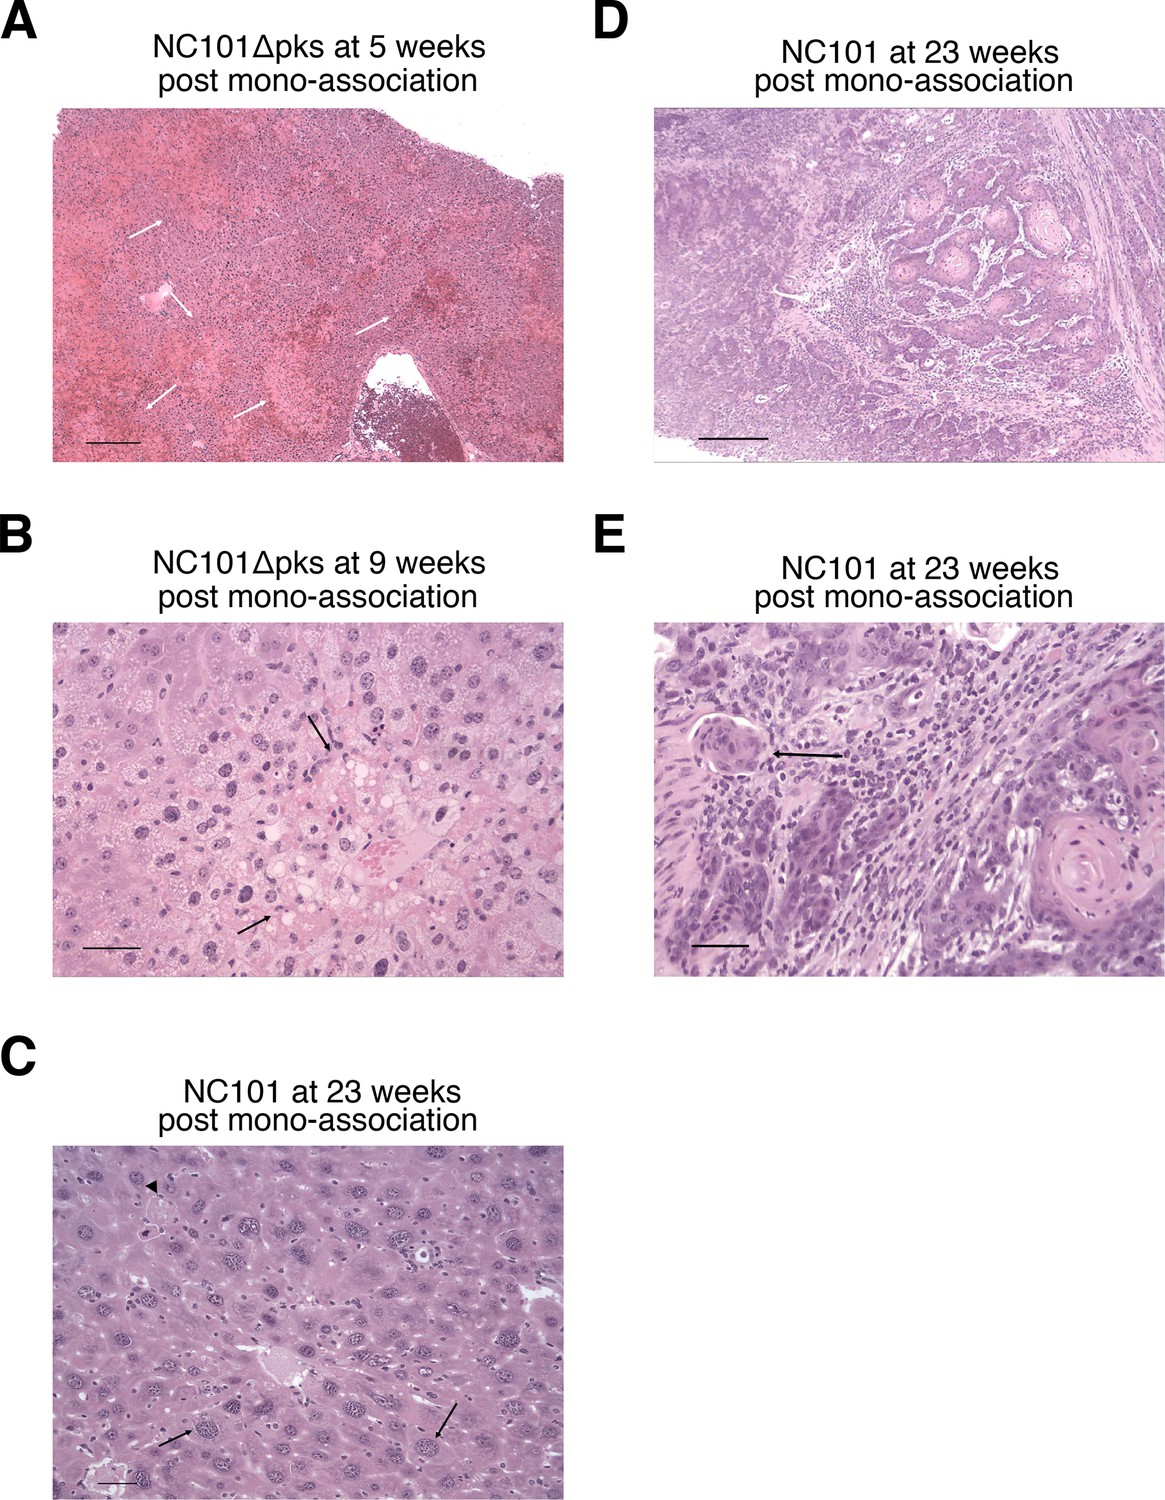
Histopathology of mouse tissues.
This is from the same experiment as in Figure 2. Tissues were fixed, sectioned, and stained with hematoxylin and eosin (H&E). (A) Liver from a mouse that was mono-associated with NC101 pks and died acutely 2 days after the second AOM treatment (5 weeks after bacterial inoculation). There is widespread acute centrilobular coagulation necrosis and hemorrhage (arrows). Bar = 250 µm. (B) Liver from a mouse that was mono-associated with NC101 pks and died 2 days after the 6th AOM treatment (9 weeks after bacterial inoculation). There is widespread hepatocellular vacuolation, anisocytosis, and focal necrosis (arrows). Bar = 50 µm. (C) Liver from a mouse that was mono-associated with NC101 and died 23 weeks after bacterial inoculation. Giant hepatocellular nuclei (arrows), single-cell necrosis (arrowhead), and disorganization of hepatic cords are evidence of ongoing liver damage. Bar = 50 µm. (D) Anal squamous cell carcinoma in a mouse that was mono-associated with NC101 and euthanized 23 weeks after bacterial inoculation. Bar = 250 µm. (E) Higher magnification of anal squamous cell carcinoma in D) showing neoplastic squamous cells invading the muscularis (arrow). Bar = 50 µm. Additional details for this experiment can be found at https://osf.io/pm5xa/.
Figure 3 with 3 supplements
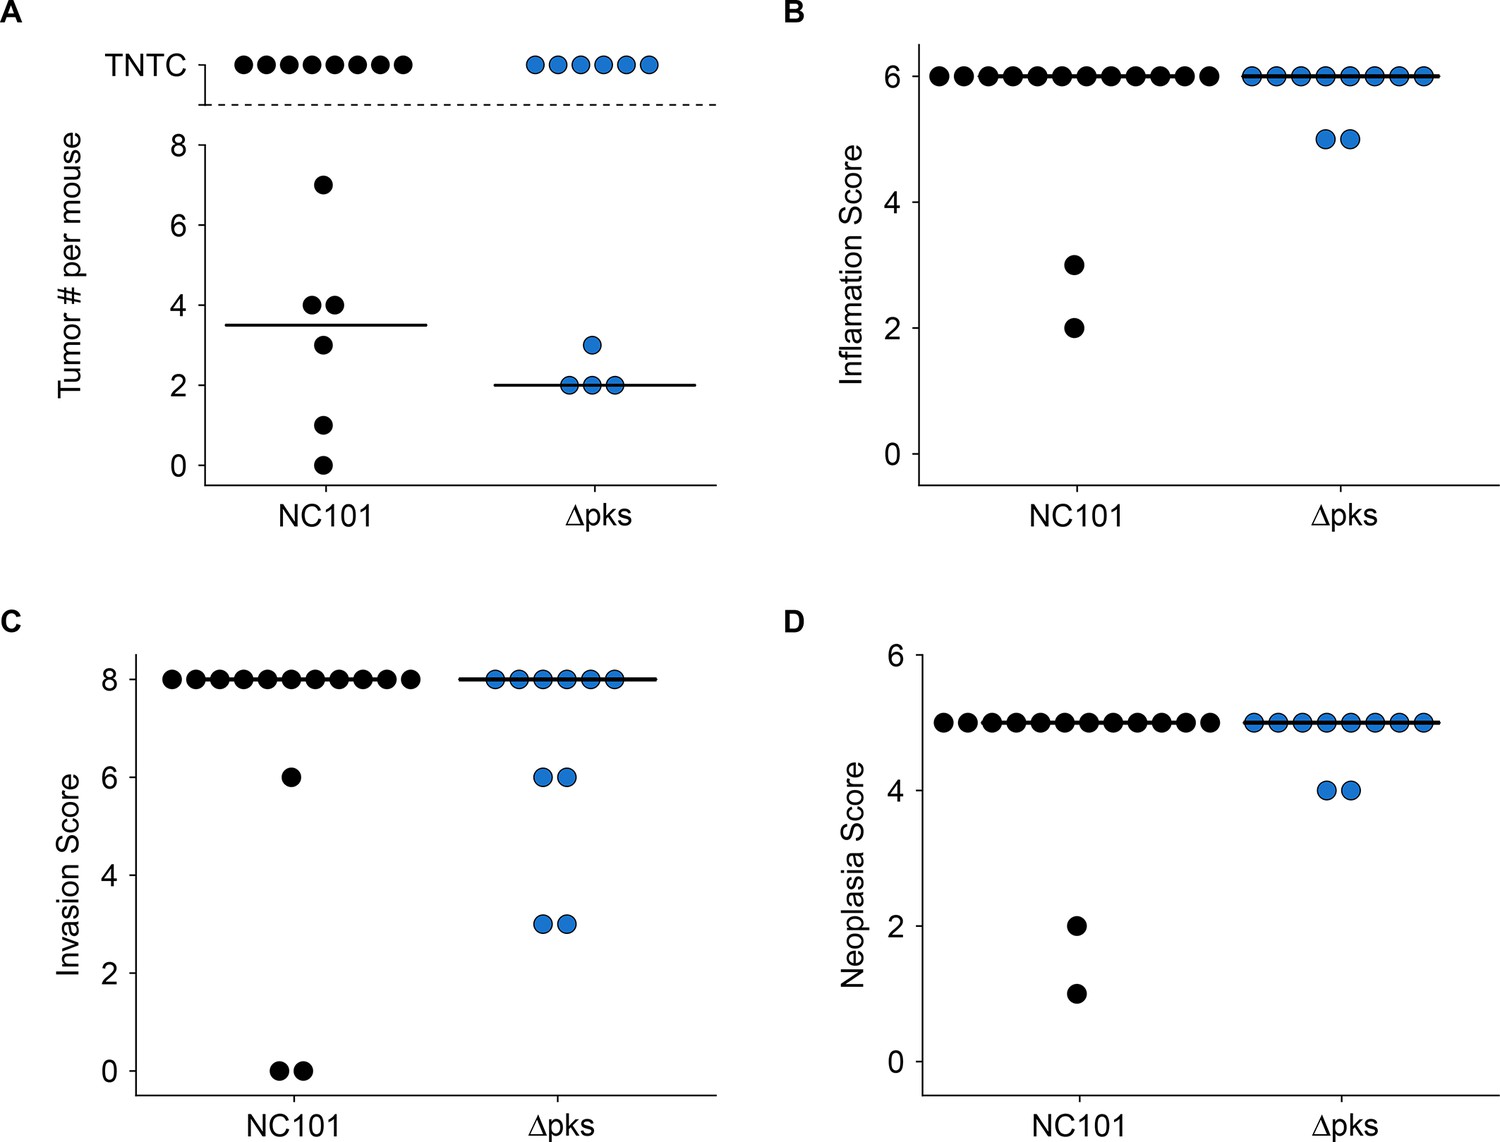
Impact of pks island deletion on colonic inflammation and tumorigenesis.
Female and male Il10-/- germ-free mice mono-associated with either E. coli NC101 or E. coli NC101 pks and treated with AOM were blindly assessed for inflammation and tumorigenesis at sacrifice. This is from the same experiment as in Figure 2. Results presented for mice that survived 14 weeks post-AOM treatment or later (Number of mice analyzed: n=14 for NC101, n=10 for NC101 pks). Dot plots where each symbol represents data from one mouse with medians reported as crossbars. One mouse inoculated with NC101 pks was found dead (186 days post-AOM) and was too autolyzed for interpretation, and thus was not included in plots. (A) Macroscopic tumor number where individual tumors were detectable. TNTC (too numerous to count) indicates mice where individual tumors could not be enumerated because of the coalescing nature of the lesions. (B) Histological inflammation scores. Exploratory analysis: Wilcoxon-Mann-Whitney test; U = 72, p = 0.892; Cliff’s d = 0.029, 95% CI [-0.28, 0.33]. (C) Histological invasion scores. Exploratory analysis: Wilcoxon-Mann-Whitney test; U = 80, p = 0.488; Cliff’s d = 0.14, 95% CI [-0.25, 0.49]. (D) Histological neoplasia scores. Exploratory analysis: Wilcoxon-Mann-Whitney test; U = 72, p = 0.892; Cliff’s d = 0.029, 95% CI [-0.28, 0.33]. Additional details for this experiment can be found at https://osf.io/pm5xa/.
Figure 3—figure supplement 1
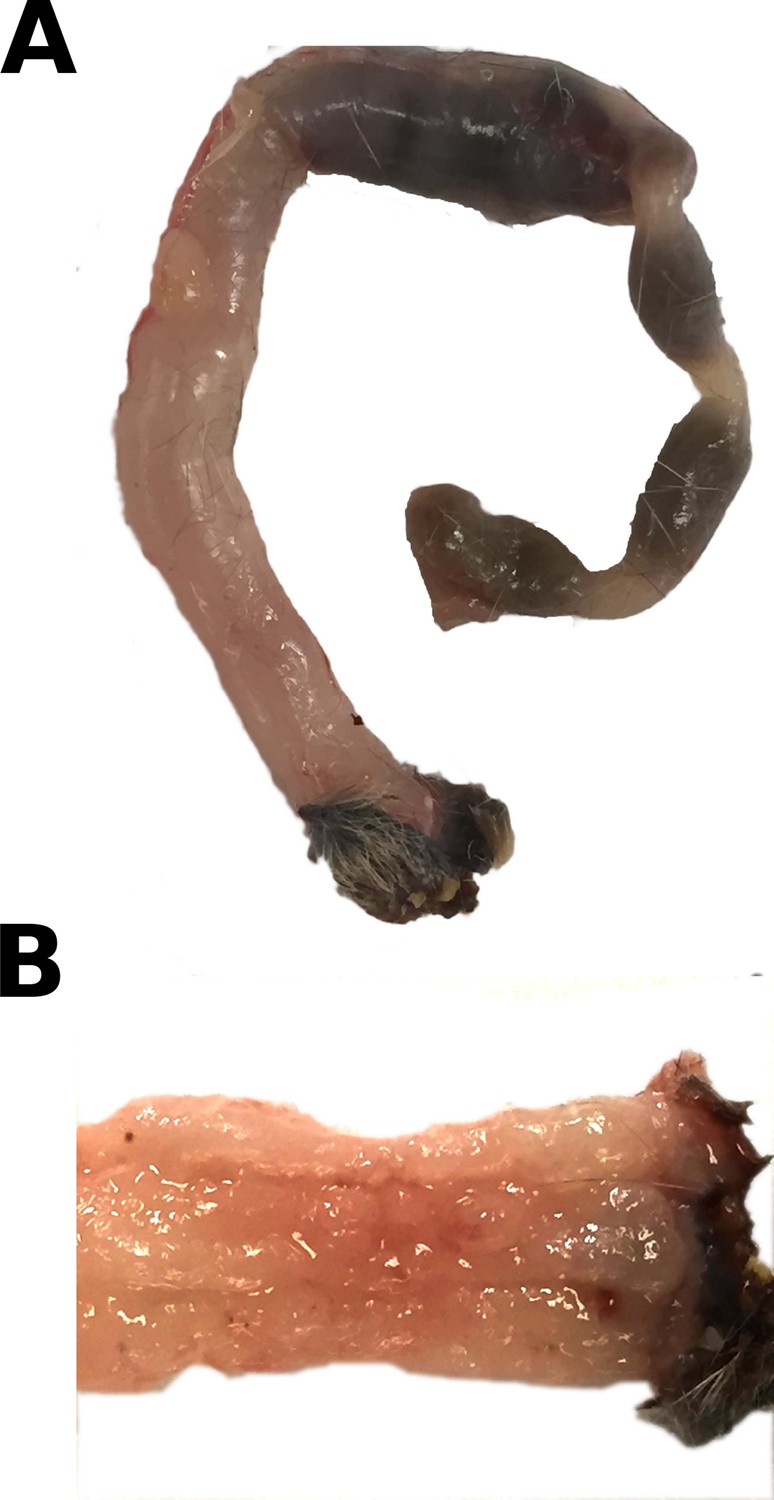
Gross appearance of mouse colon.
At necropsy, gross lesions were recorded and photographed. This is from the same experiment as in Figure 2. (A) Colon from a mouse that was mono-associated with NC101 and died 13 weeks after AOM treatment. Typical gross appearance shows diffuse thickening of the distal half of the colon with fecal material proximal to the hypertrophic region. (B) Mucosal surface of the distal colon from the same tissue illustrated in A). The mucosa is irregularly thickened, and individual tumor foci are not distinguishable. Additional details for this experiment can be found at https://osf.io/pm5xa/.
Figure 3—figure supplement 2
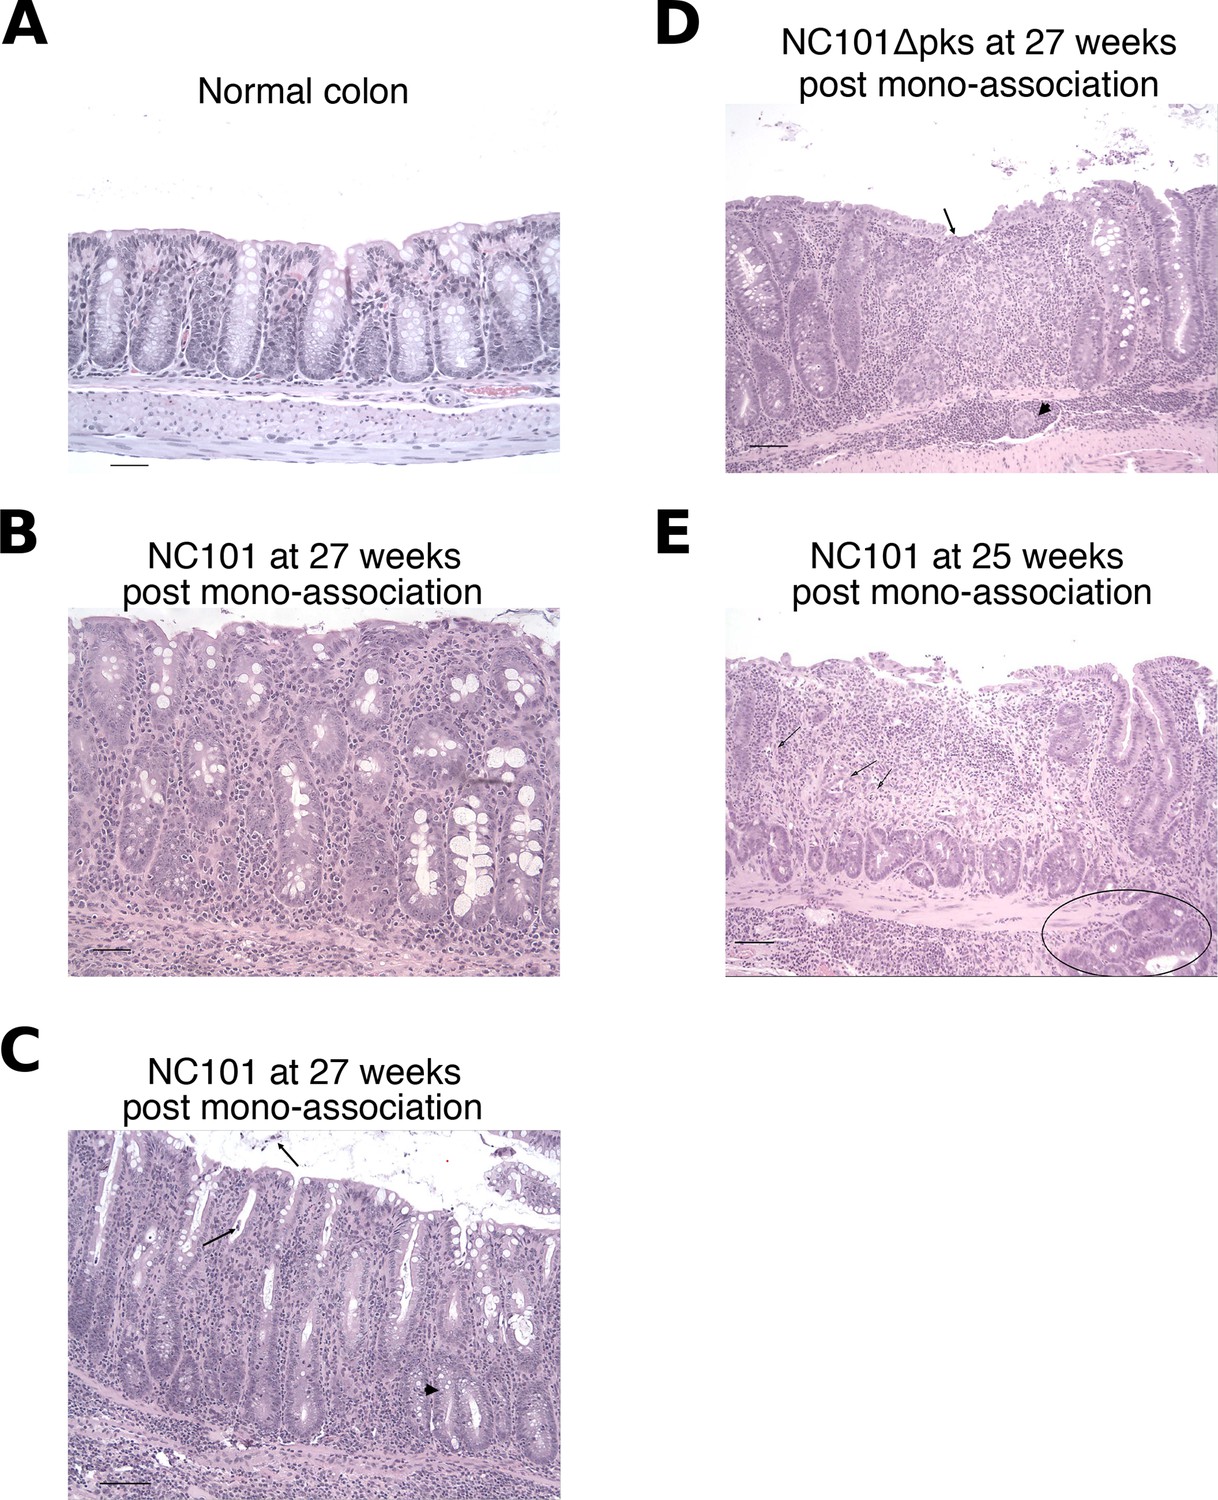
Illustrative photomicrographs of scoring system used to semi-quantify colon inflammation.
Tissues were fixed, sectioned, and stained with hematoxylin and eosin (H&E). (A) Normal colon from a germ-free mouse for comparison. Score = 0. Glands are evenly distributed and unbranched, many goblet cells are present throughout the luminal half of the glands, and few inflammatory cells are present in the lamina propria and submucosa. Bar = 50 µm. (B) Colon from a mouse mono-associated with NC101 and euthanized 27 weeks after bacterial inoculation. Score = 2. Glands are separated by mixed inflammatory cells in the lamina propria, with rare infiltration of the submucosa. Glands are somewhat elongated with occasional mitotic figures and piling up of epithelial cells (hyperplasia), resulting in increased mucosal thickness (hypertrophy). Goblet cells are still present, but decreased in some areas. Bar = 50 µm. (C) Colon from a mouse mono-associated with NC101 and euthanized 27 weeks after bacterial inoculation. Score = 3. Inflammation extends throughout the lamina propria and submucosa, mitotic figures are prominent in the epithelium, and goblet cells are moderately decreased in number. Damage to epithelial architecture is characterized by dilated glands, sloughed epithelial cells (arrows), and occasional branching of glands (arrowhead). Bar = 100 µm. (D) Colon from a mouse mono-associated with NC101 pks and euthanized 27 weeks after bacterial inoculation. Score = 4. Lesions are more severe than in C). There is superficial mucosal erosion (arrow), goblet cells are largely absent, and inflammation replaces the normal mucosa (arrowhead). Bar = 50 µm. (E) Colon from a mouse mono-associated with NC101 and euthanized 25 weeks after bacterial inoculation. Score = 6. In addition to severe inflammation, there is a large mucosal ulcer and there are gland abscesses are present (arrows). Note that in this section there is also glandular dysplasia and herniation of a proliferative gland through the muscularis mucosae (circled). Bar = 100 µm.
Figure 3—figure supplement 3
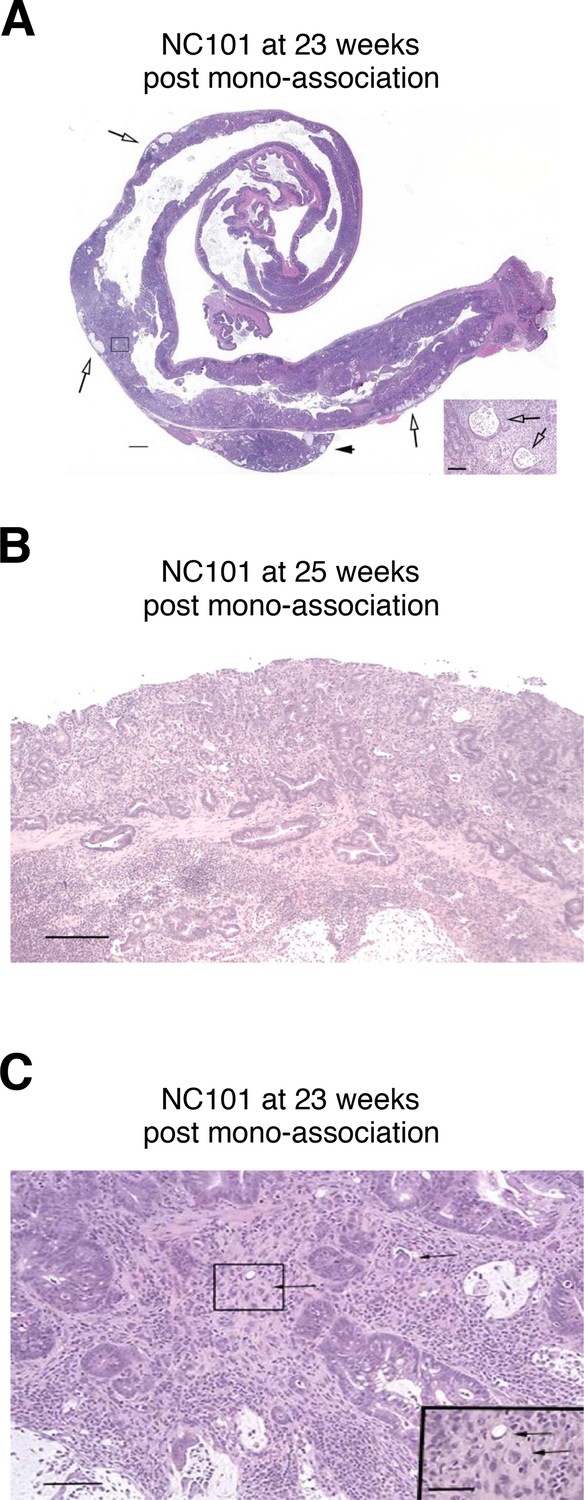
Illustrative photomicrographs of scoring system used to quantify proliferative, dysplastic, and neoplastic lesions.
Tissues were fixed, sectioned, and stained with hematoxylin and eosin (H&E). (A) Colon from a mouse mono-associated with NC101 and euthanized 23 weeks after bacterial inoculation. Typical subgross appearance demonstrating widespread, coalescing neoplastic transformation involving most of the distal 2/3 of the colon. There is widespread invasion with rupture of glands and mucus lakes within the tissue. Severe, widespread inflammation is present throughout the lamina propria and submucosa, extending through the muscularis in some locations (arrows). A local lymph node is markedly inflamed, but no convincing neoplastic cells are present (arrowhead). Bar = 1 mm. Inset shows boxed region demonstrating mucus lakes (arrows). Bar = 100 µm. (B) Colon from a mouse mono-associated with NC101 and euthanized 25 weeks after bacterial inoculation. There is intraepithelial neoplasia with high-grade dysplasia characterized by abnormal glandular architecture, cellular atypia, and herniation of glands through the muscularis mucosae. The lesion is distinguishable from invasive neoplasia by the well-differentiated character of the herniated cells, the absence of a scirrhous response, and the intact basement membranes. Bar = 250 µm. (C) Invasive colon adenocarcinoma from the same mouse illustrated in A), mono-associated with NC101 and euthanized 23 weeks after bacterial inoculation. There is marked cellular atypia, scirrhous stromal response, and single neoplastic cells present within the stroma (arrows). Bar = 100 µm. Inset shows higher magnification of neoplastic cells. Bar = 50 µm.
Figure 4
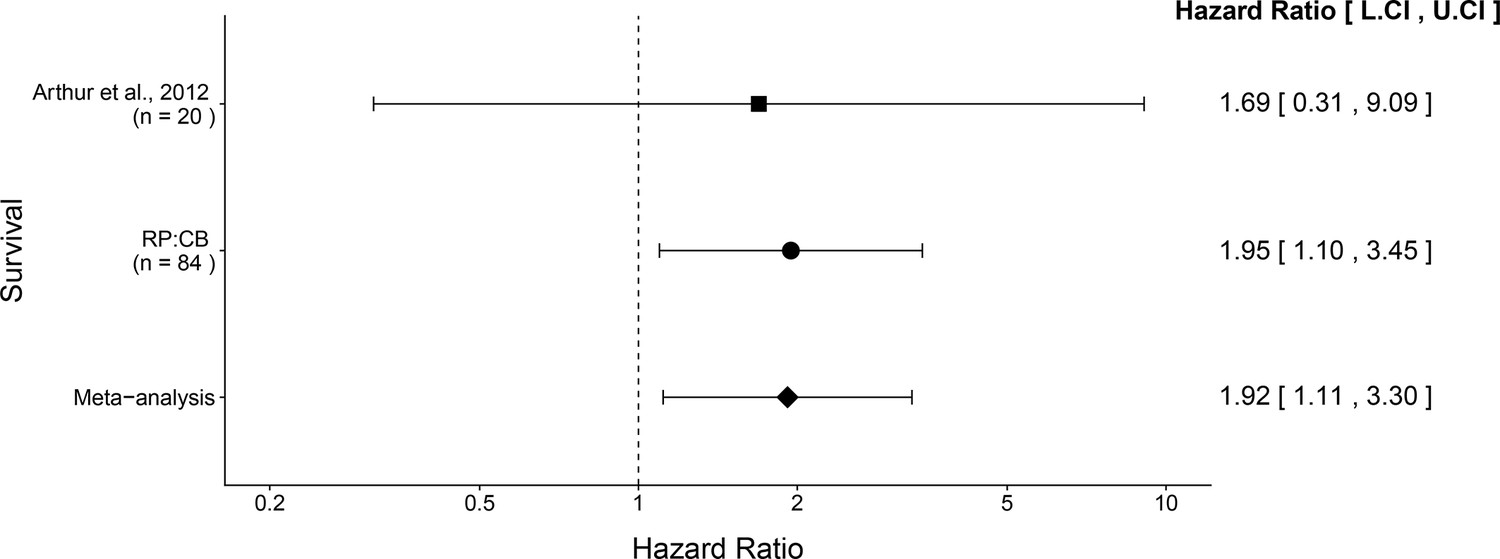
Meta-analysis of survival.
Effect size and 95% confidence interval are presented for Arthur et al. (2012), this replication attempt (RP:CB), and a random effects meta-analysis of those two effects. To directly compare and combine the results of both studies, the survival data during the same timeframe was used (i.e. 18 weeks from mono-association). HR greater than 1 indicates death occurred more often in NC101 pks compared to NC101, while HR less than 1 indicates the reverse. Sample sizes used in Arthur et al. (2012) and this replication attempt are reported under the study name. Random effects meta-analysis of HR for NC101 mono-associated mice compared to NC101 pks mono-associated mice (meta-analysis p = 0.0188). Additional details for this meta-analysis can be found at https://osf.io/2raud/.
Tables
Key resources table
| Reagent type (species) or resource | Designation | Source or reference | Identifiers | Additional information |
|---|---|---|---|---|
| Strain, strain background (Escherichia coli, NC101) | NC101 | doi:10.1126/science.1224820 | ||
| Strain, strain background (E. coli, NC101Δpks) | NC101Δpks | doi:10.1126/science.1224820 | ||
| Strain, strain background (Mus musculus , 129/SvEv, Il10-/-) | Germ-free Il10-/- | doi:10.1126/science.1224820 | Germ-free mice | |
| Commercial assay or kit | MoBio PowerMag Microbial DNA Isolation Kit | Qiagen | cat# 27200–4 | |
| Commercial assay or kit | NEBNext Ultra DNA Library Prep Kit for Illumina | New England BioLabs | cat# E7370 | |
| Chemical compound, drug | AOM | Sigma-Aldrich | cat# A5486 | lot# SLBN5975V |
| Software, algorithm | FastQC | http://www.bioinformatics.babraham.ac.uk/projects/fastqc | RRID: SCR_014583 | version 0.11.5 |
| Software, algorithm | Trimmomatic | doi:10.1093/bioinformatics /btu170 | RRID: SCR_011848 | version 0.36 |
| Software, algorithm | SPAdes | doi:10.1089/cmb.2012.0021 | RRID: SCR_000131 | version 3.5.0 |
| Software, algorithm | ABACAS | doi:10.1093/bioinformatics /btp347 | RRID: SCR_015852 | version 1.3.1 |
| Software, algorithm | Prokka | doi:10.1093/bioinformatics /btu153 | RRID: SCR_014732 | version 1.11 |
| Software, algorithm | short-read Burrows-Wheeler Aligner | doi:10.1093/bioinformatics/ btp324 | RRID: SCR_015853 | version 0.7.13 |
| Software, algorithm | Picard | http://broadinstitute.github.io/picard | RRID: SCR_006525 | version 1.130 |
| Software, algorithm | SAMtools and BCFtools | doi:10.1093/bioinformatics/ btr509 | RRID: SCR_005227 | version 1.2 |
| Software, algorithm | GATK’s VarieantFiltration | doi:10.1002/0471250953. bi1110s43 | RRID: SCR_001876 | version 3.3.0 |
| Software, algorithm | Artemis Comparison Tool | doi:10.1093/bioinformatics/ bti553 | RRID: SCR_004507 | version 13.0.0 |
| Software, algorithm | R Project for statistical computing | https://www.r-project.org | RRID: SCR_001905 | version 3.4.4 |
Additional files
-
Transparent reporting form
- https://doi.org/10.7554/eLife.34364.013
-
Reporting standard 1
- https://doi.org/10.7554/eLife.34364.014
Download links
A two-part list of links to download the article, or parts of the article, in various formats.
Downloads (link to download the article as PDF)
Open citations (links to open the citations from this article in various online reference manager services)
Cite this article (links to download the citations from this article in formats compatible with various reference manager tools)
Replication Study: Intestinal inflammation targets cancer-inducing activity of the microbiota
eLife 7:e34364.
https://doi.org/10.7554/eLife.34364


