The MR-Base platform supports systematic causal inference across the human phenome
- University of Bristol, United Kingdom
- University of Cambridge, United Kingdom
- Translational Research Institute, Australia
Figures
Figure 1
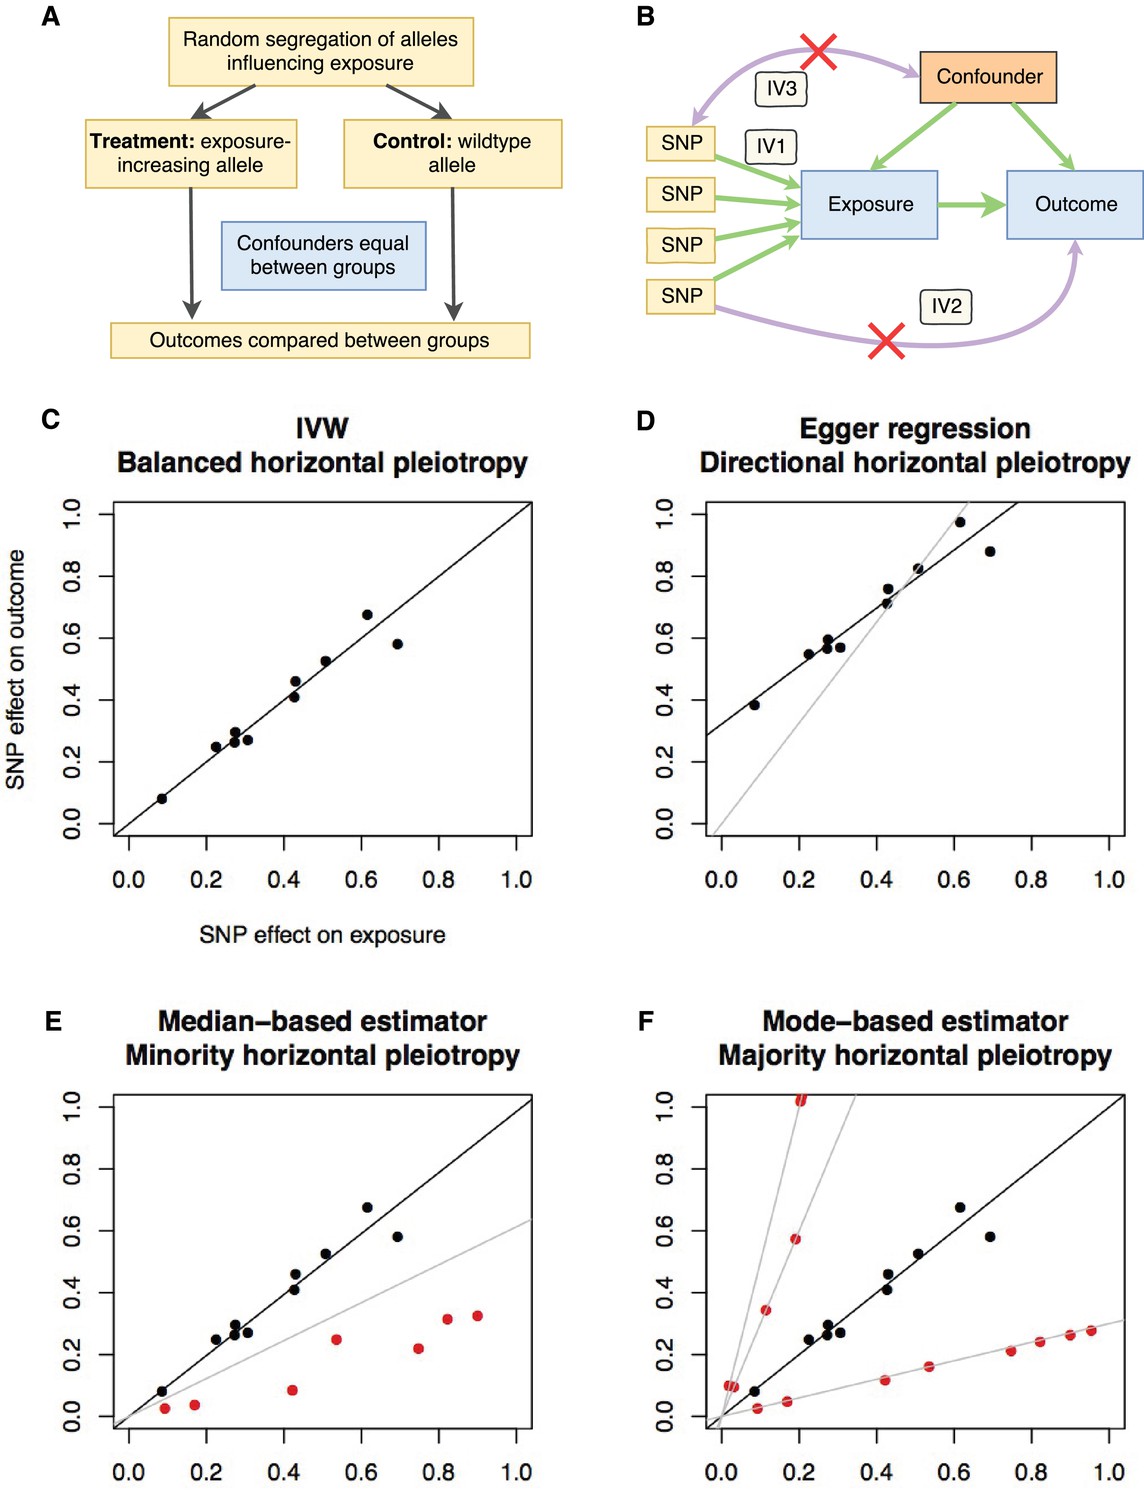
Principles and assumptions behind Mendelian randomization.
(A) Diagram illustrating the analogy between Mendelian randomization (MR) and a randomised controlled trial. (B) A directed acyclic graph representing the MR framework. Instrumental variable (IV) assumption 1: the instruments must be associated with the exposure; IV assumption 2: the instruments must influence the outcome only through the exposure; IV assumption 3: the instruments must not associate with measured or unmeasured confounders. (C-F) Scatter plots demonstrating the relationship between the instrumental single nucleotide polymorphism (SNP) effects on the exposure against their corresponding effects on the outcome. The slope of the regression is the estimate of the causal effect of the exposure on the outcome. (C) If there is no violation of the IV2 assumption (no horizontal pleiotropy), or the horizontal pleiotropy is balanced, an unbiased causal estimate can be obtained by inverse-variance weighted (IVW) linear regression, where the contribution of each instrumental SNP to the overall effect is weighted by the inverse of the variance of the SNP-outcome effect. Fixed and random effects IVW approaches are available (the slopes from both approaches are identical but the variance of the slope is inflated in the random effects model in the presence of heterogeneity between SNPs). (D) If there is a tendency for the horizontal pleiotropic effect to be in a particular direction, then constraining the slope to go through zero will incur bias (grey line). Egger regression relaxes this constraint by allowing the intercept to pass through a value other than zero, returning an unbiased effect estimate if the instrument-exposure and pleiotropic effects are uncorrelated, also known as the InSIDE (Instrument Strength Independent of Direct Effect) assumption (Bowden et al., 2015). Pleiotropic effect here refers to the effect of the instrument on the outcome that is not mediated by the exposure. (E) If the majority of the instruments are valid (black points), with some invalid instruments (red points), the median based approach will provide an unbiased estimate in the presence of unbalanced horizontal pleiotropy (black line), whereas IVW linear regression will provide a biased estimate (grey line). In addition, the median-based estimator does not require the InSIDE assumption of the Egger approach. (F) If a group of SNPs influences the outcome through a particular pathway other than the exposure (i.e. the SNPs are horizontally pleiotropic) then that group of SNPs will return consistently biased estimates. Clustering SNPs based on their estimates (grey lines) is possible with the mode-based estimator. The cluster with the largest weight (black line) is selected as the final causal estimate. The causal estimate from the mode-based estimator is unbiased if the SNPs contributing to the largest cluster are valid instruments.
Figure 2
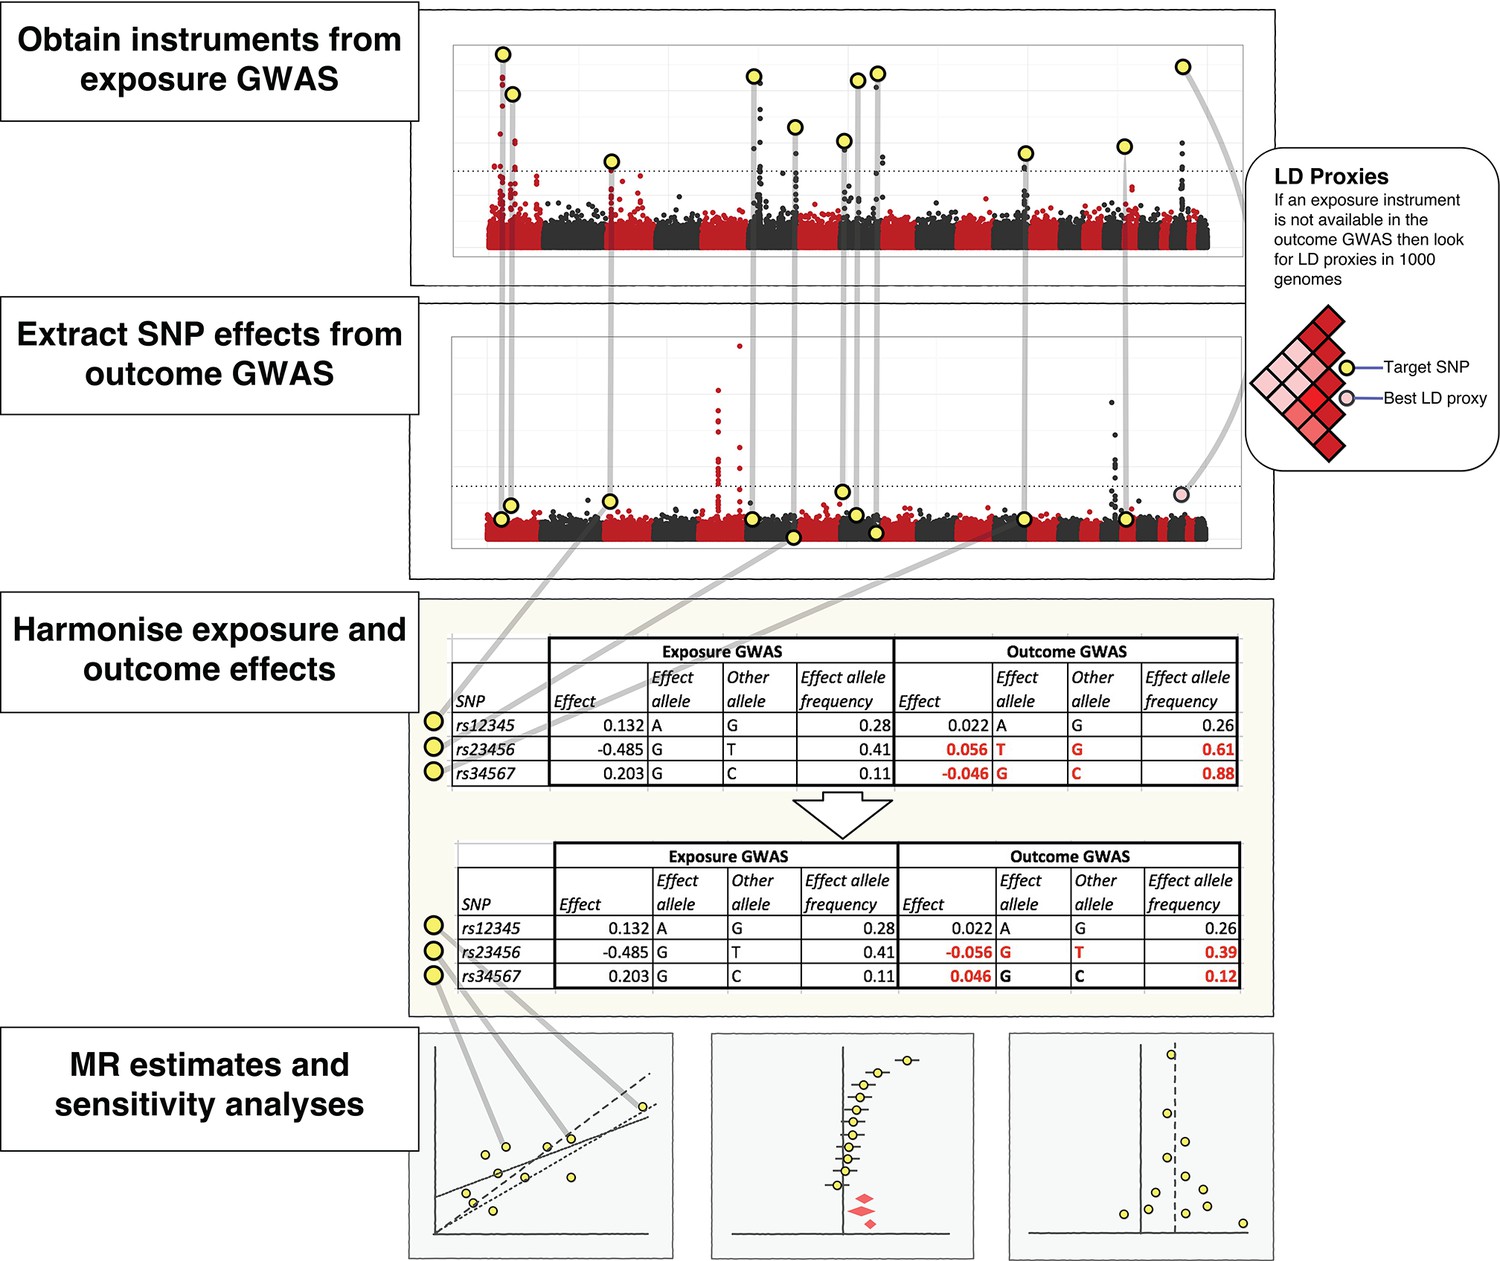
The practical steps for performing 2-sample Mendelian randomization (2SMR), as described in the Model section of the paper.
The database of genome-wide association study results and R packages (‘TwoSampleMR’ and ‘MRInstruments’) curated by MR-Base support the data extraction, harmonisation and analysis steps required for 2SMR. Additional R packages for MR from other researchers are also accessible, including MendelianRandomization (Yavorska and Burgess, 2017), RadialMR ( Bowden et al., 2017b), MR-PRESSO (Verbanck et al., 2018) and mr.raps (Zhao et al., 2018). The available methods are updated on a regular basis.
Figure 3
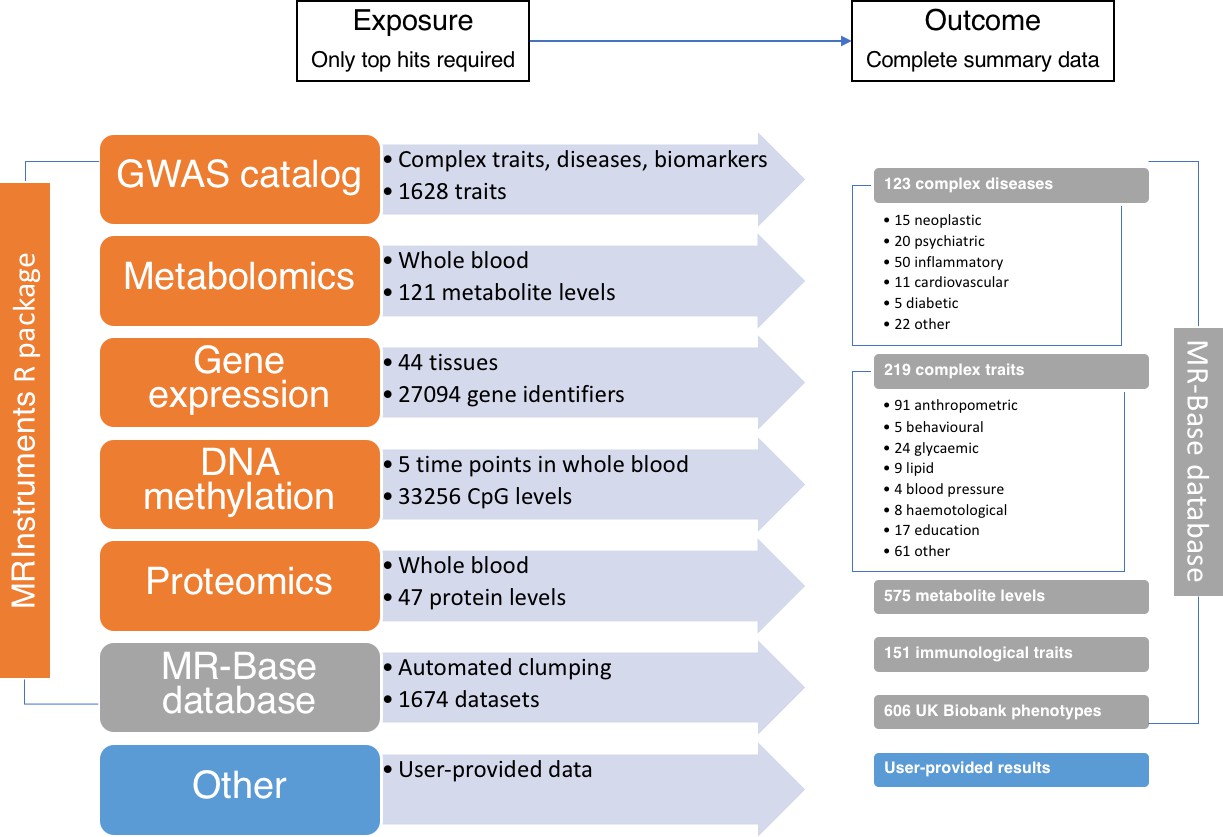
The data available through MR-Base and the possible exposure-outcome analyses that can be performed.
Exposure traits can very broadly defined and may include molecular traits like gene expression, DNA-methylation, metabolites and proteins, as well as more complex traits, including cholesterol, body mass index, smoking and education. Further details on the traits with complete summary data can be found in Supplementary file 1A. The numbers reflect MR-Base in December 2017 and are updated on a regular basis.
Figure 4
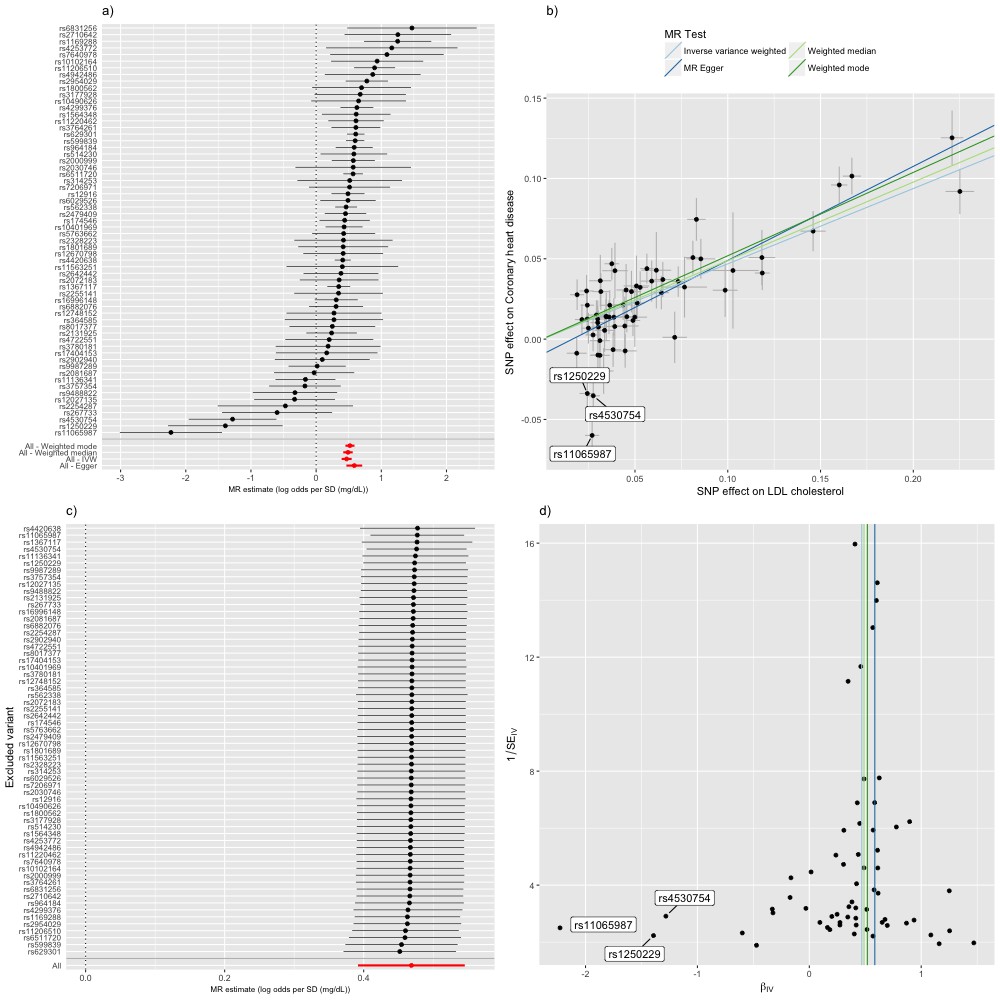
Mendelian randomization study of the effect of low density lipoprotein cholesterol levels on coronary heart disease.
(a) A forest plot, where each black point represents the log odds ratio (OR) for coronary heart disease (CHD) per standard deviation (SD) increase in low density lipoprotein (LDL) cholesterol, produced using each of the ‘LDL single nucleotide polymorphisms (SNPs)’ as separate instruments, and red points showing the combined causal estimate using all SNPs together in a single instrument, using each of four different methods (weighted median, weighted mode, inverse-variance weighted [IVW] random effects and MR-Egger). Horizontal lines denote 95% confidence intervals. (b) A plot relating the effect sizes of the SNP-LDL association (x-axis, SD units) and the SNP-CHD associations (y-axis, log OR) with standard error bars. The slopes of the lines correspond to causal estimates using each of the four different methods. Outlier SNPs are labeled. (c) Leave-one-out sensitivity analysis. Each black point represents the IVW MR method applied to estimate the causal effect of LDL on CHD excluding that particular variant from the analysis. The red point depicts the IVW estimate using all SNPs. There are no instances where the exclusion of one particular SNP leads to dramatic changes in the overall result. (d) Funnel plot showing the relationship between the causal effect of LDL on CHD estimated using each individual SNP as a separate instrument against the inverse of the standard error of the causal estimate. Vertical lines show the causal estimates using all SNPs combined into a single instrument for each of four different methods. There is some asymmetry in the plot (an excess of strong protective effects associated with higher LDL cholesterol), which is potentially indicative of violations of instrumental variable (IV) assumptions, e.g. violation of the IV2 assumption through horizontal pleiotropy. Outlier SNPs are labeled.
Figure 5
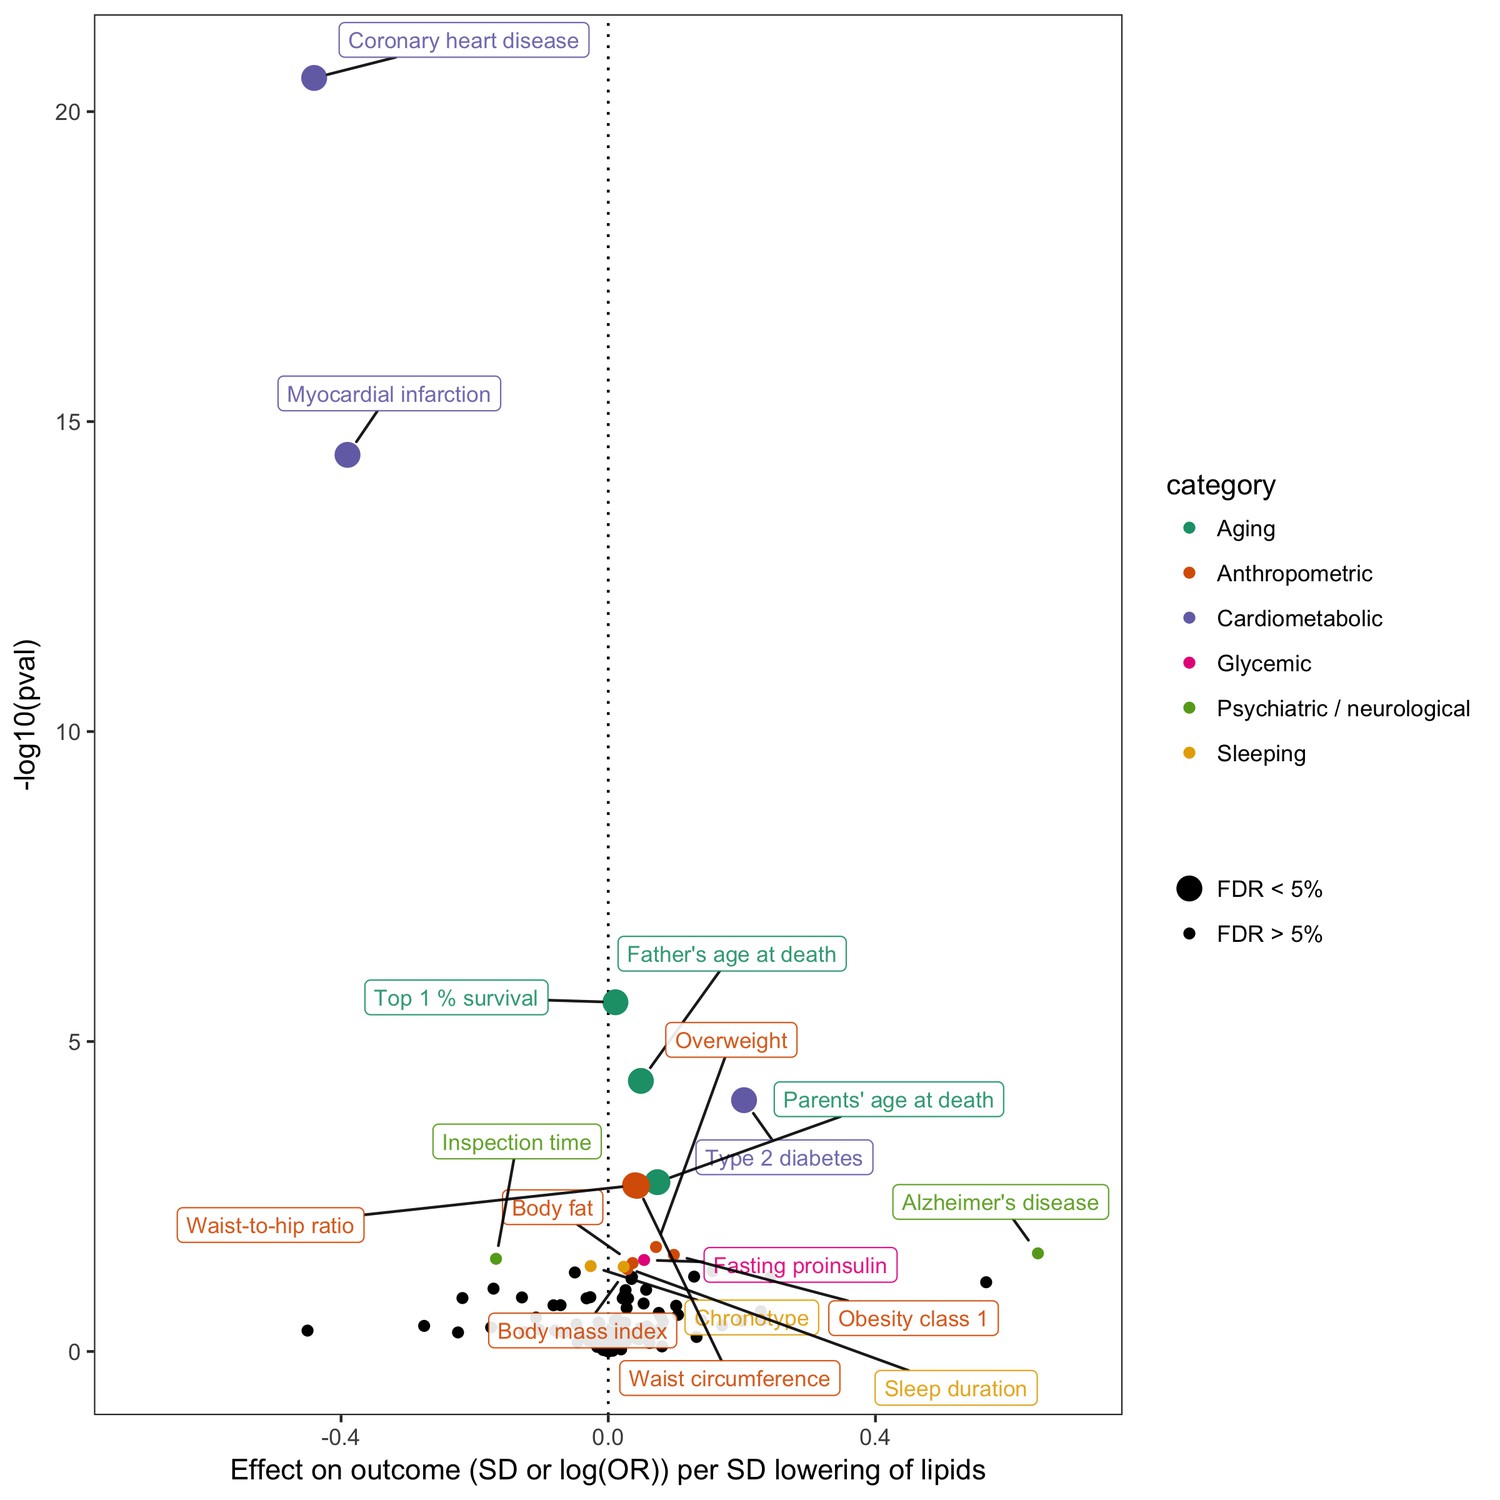
Effect of lower low density lipoprotein cholesterol on 150 traits in MR-Base.
The x-axis shows the standard deviation (SD) change or log odds ratio (OR) for each of 150 traits per SD decrease in low density lipoprotein (LDL) cholesterol. The y-axis shows the p-value for the association on a -log10 scale. The effects on the x-axis correspond to the slope from fixed effects inverse variance weighted (IVW) linear regression of single nucleotide polymorphism (SNP)-outcome effects regressed on the SNP-LDL effects. Those results that have a p-value<0.05 are labelled. Larger points denote false discovery rate (FDR) < 0.05. LDL cholesterol was instrumented by 62 SNPs.
Additional files
-
Supplementary file 1
(A) Genome-wide association studies with complete summary data in MR-Base as of December 2017.
(B) List of Mendelian randomization analysis methods.
(C) Genetic instruments for low density lipoprotein cholesterol.
(D) Phenome-wide association study of LDL-C raising cardio-protective variant.
(E) Limitations of Mendelian randomization and potential solutions.
(F) Glossary of terms.
(G) The schema of the MR-Base database.
- https://doi.org/10.7554/eLife.34408.008
-
Transparent reporting form
- https://doi.org/10.7554/eLife.34408.009
Download links
A two-part list of links to download the article, or parts of the article, in various formats.
Downloads (link to download the article as PDF)
Open citations (links to open the citations from this article in various online reference manager services)
Cite this article (links to download the citations from this article in formats compatible with various reference manager tools)
The MR-Base platform supports systematic causal inference across the human phenome
eLife 7:e34408.
https://doi.org/10.7554/eLife.34408


