Mucosal absorption of therapeutic peptides by harnessing the endogenous sorting of glycosphingolipids
- Boston Children's Hospital, United States
- Harvard Medical School, United States
- Harvard Digestive Diseases Center, United States
- Joslin Diabetes Center and Harvard Medical School, United States
- Univeristy of Bath, United Kingdom
- Novo Nordisk, Denmark
- Massachusetts Institute of Technology, United States
Figures
Figure 1 with 2 supplements
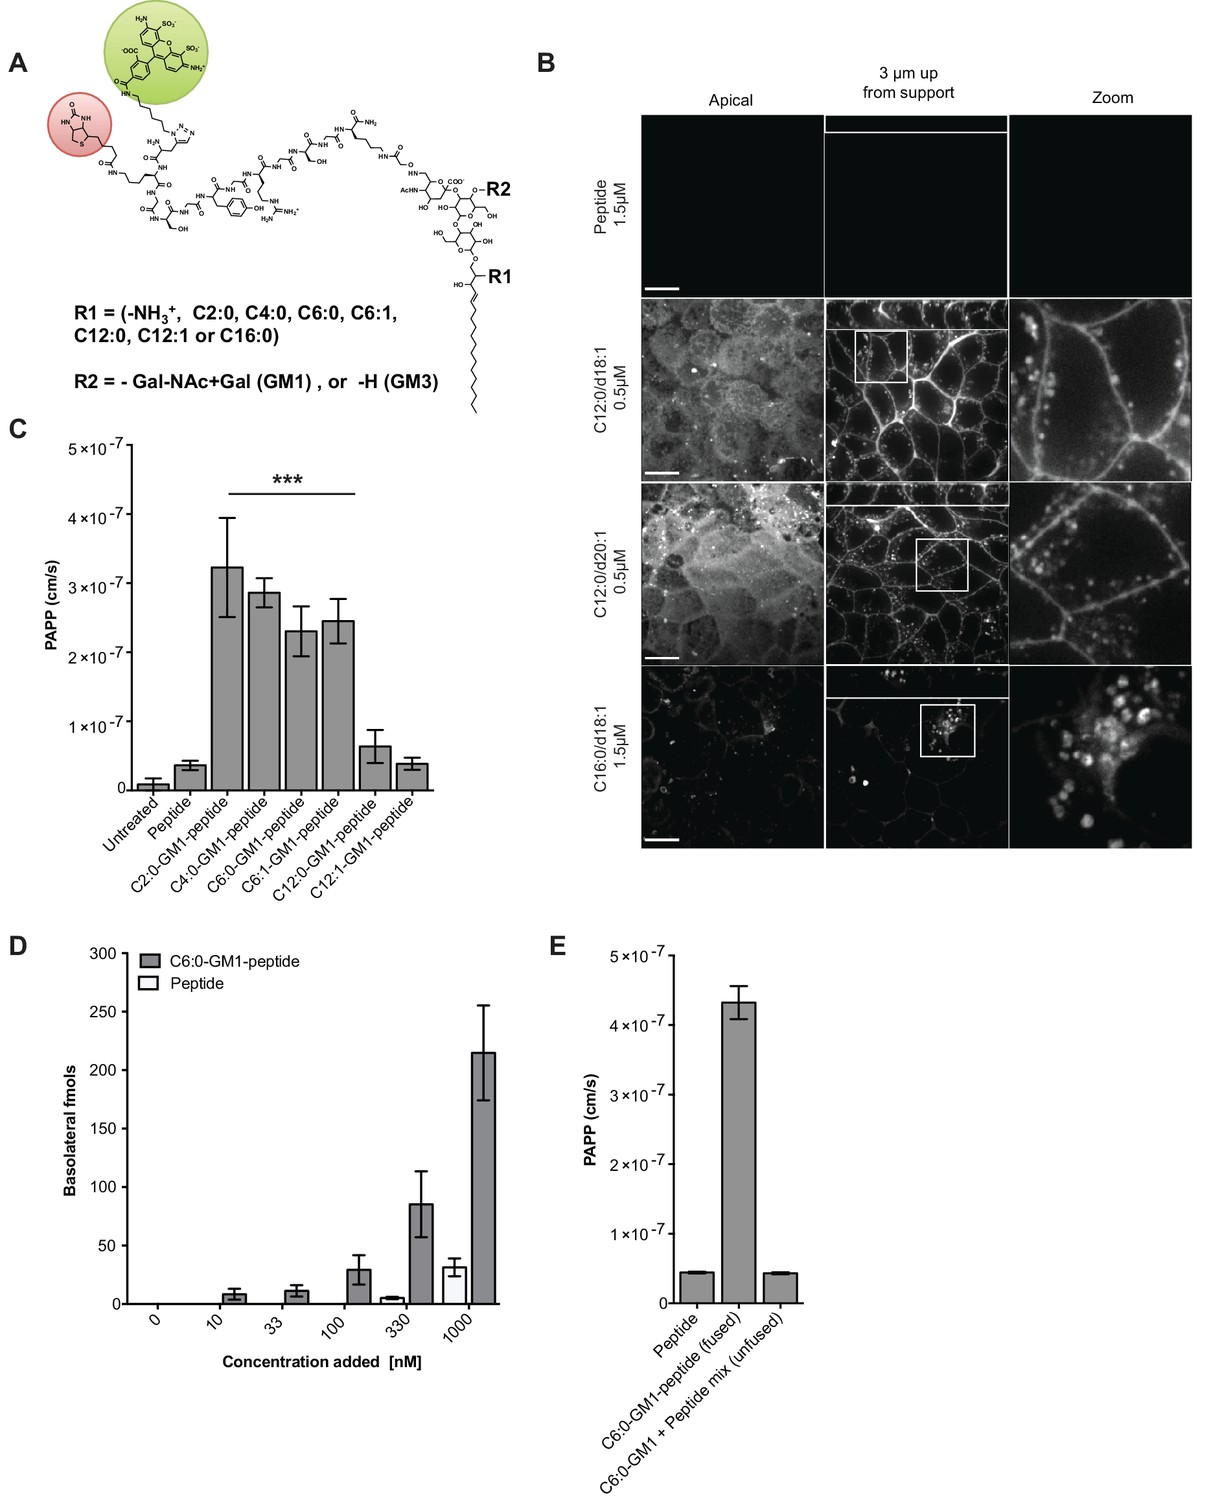
Modifications to the ceramide domain of GM1 results in enhanced trans-epithelial transport.
(A) Representative structure of GM1 sphingolipids fused to an all-D amino acid reporter peptide. The reporter peptide contains a lysine-linked biotin (red circle) used for affinity purification and an N-terminal Alexa Fluor 488 (green circle). (B) GM1-peptide fusions or unfused reporter peptide were added apically to MDCK-II cells grown on filter supports and imaged by live cell confocal microscopy. Transcytosis of the C12:0-GM1-reporter peptide fusion (with either a C18:1 or C20:1 sphingosine) is evident by basolateral membrane fluorescence. The C16:0-GM1 reporter molecule is delivered to intracellular puncta, presumably lysosomes. Scale bars 10 um (C) Transport of the indicated GM1-reporter peptide fusions across T84 cell monolayers with the indicated fatty acid chain length and degree of saturation. The GM1-peptide fusions containing ceramide domains with short fatty acids have a ~10 fold increase in trans-epithelial transport over the unfused reporter peptide. (D) Transepithelial transport of the C6:0-GM1 peptide fusion across T84 monolayers is dose-dependent and far exceeds transport of the unconjugated reporter peptide. (E) T84 monolayers were simultaneously treated with unfused peptide and unfused C6:0-GM1. Mixing experiments confirm that fusion of the reporter peptide to the glycosphingolipid carrier is required for amplified transcellular transport.
Figure 1—figure supplement 1
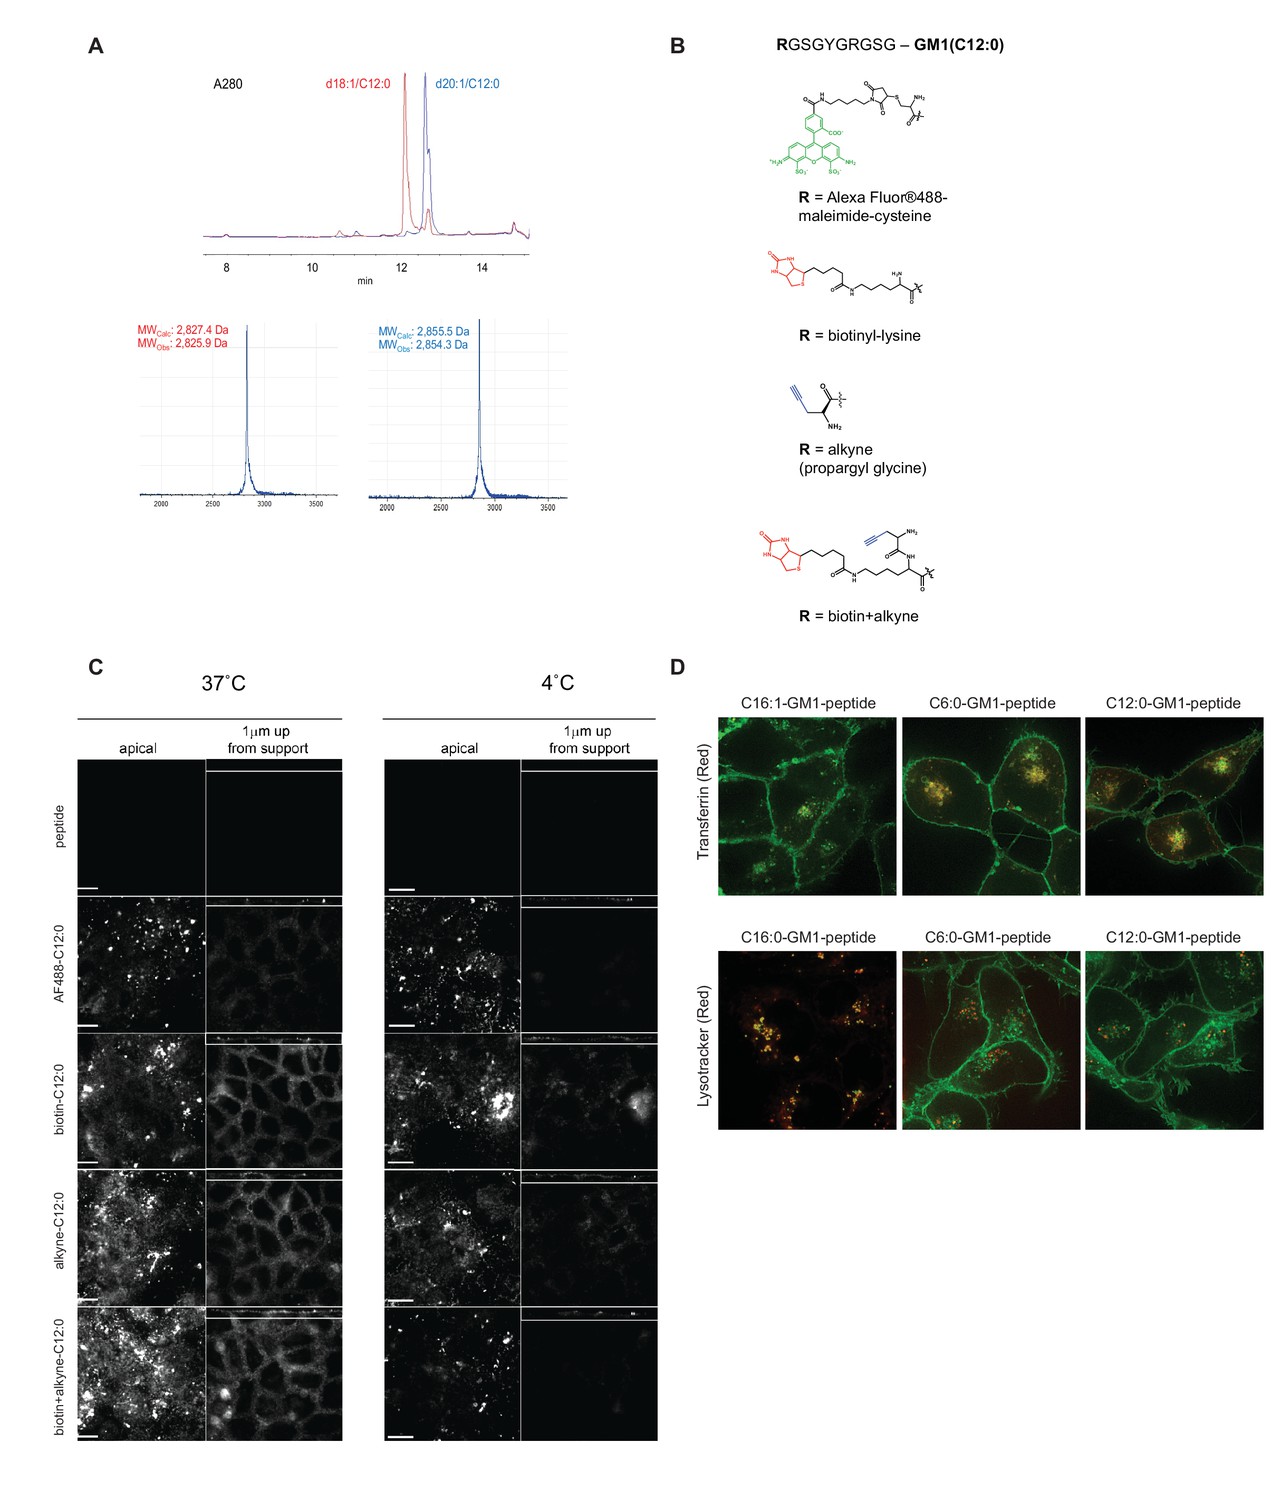
Synthesis and modifications to the reporter peptide and ceramide domain of GM1.
(A) HPLC and mass spectrometry of purified C12:0-GM1-peptide fusion. Compound shows high purity with resolution to separate fusions containing C18:1 and C20:1 sphingosine isomers of the original lipids and the correct mass. (B) Functional groups tested individually to validate our GM1-peptide constructs. (C) To test effects of the various functional groups, we performed confocal imaging of MDCK-II monolayers treated with the reporter peptide or with the different lipid fusions. Scale bars 10 um. After incubation with the indicated molecule, monolayers were treated with fluorescently labeled cholera toxin B-subunit and examined for fluorescence at basolateral membranes. In all cases, the C12:0-GM1 fusion is sorted into the recycling and transcytotic pathway. (D) C6:0-GM1 and C12:0-GM1 peptide fusions (green labeling) are sorted to the recycling endosome as measured by co-localization with the transferrin receptor (red, top panels) and away from the lysosome as measured by lysotracker (red, bottom panels).
Figure 1—figure supplement 2
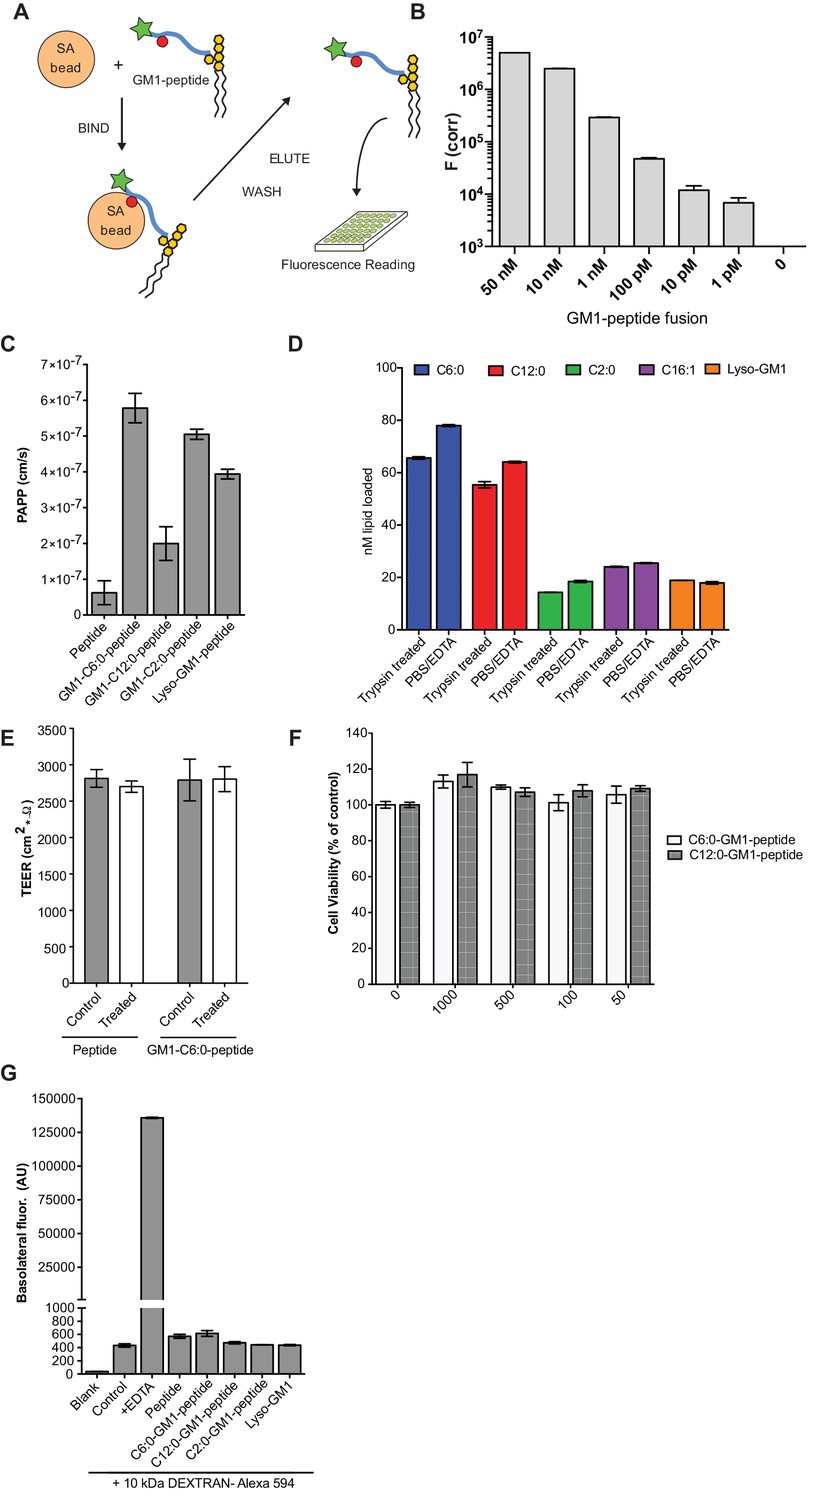
Validation of the transcytosis assay.
(A) Schematic representation of our transcytosis assay. GM1-peptide fusions containing a biotin (red circle) and fluorophore (green star) are affinity isolated from basolateral media by addition of streptavidin beads. (B) Standard curve for the transcytosis assay demonstrates our assay is sensitive to picomolar concentrations. (C) Transport of GM1-reporter peptide fusions across T84 cell monolayers with very short chain fatty acids chain. Data shows that GM1-peptide fusions containing ceramide domains with very short fatty acid chains have a 10-fold increase in trans-epithelial transport over the unconjugated reporter peptide. (D) Membrane loading of the different GM1-peptide fusion molecules determined by quantitative fluorescence measurement of cells after trypsin treatment. (E) TEER measurements of T84 cells before treatment (control, grey bars) or after a 3 hr treatment (white bars) with the reporter peptide or C6:0-GM1 peptide fusion. (F) MTT assay after a 3 hr treatment with the C6:0 or C12:0-GM1 peptide fusion shows no effect on cell viability at a wide range of doses. (G) Permeability assay in MDCK-II monolayers treated simultaneously with 1 mg/mL AlexaFlour-594 conjugated Dextran and the indicated GM1-peptide fusion. Cumulative amount of Dextran AlexaFlour-594 (MW = 10 kDa) transported from the apical to the basolateral compartment over 3 hr is not affected by addition of GM1-peptide fusions. Results are summarized as the mean ± s.e.m of a representative experiment.
Figure 2
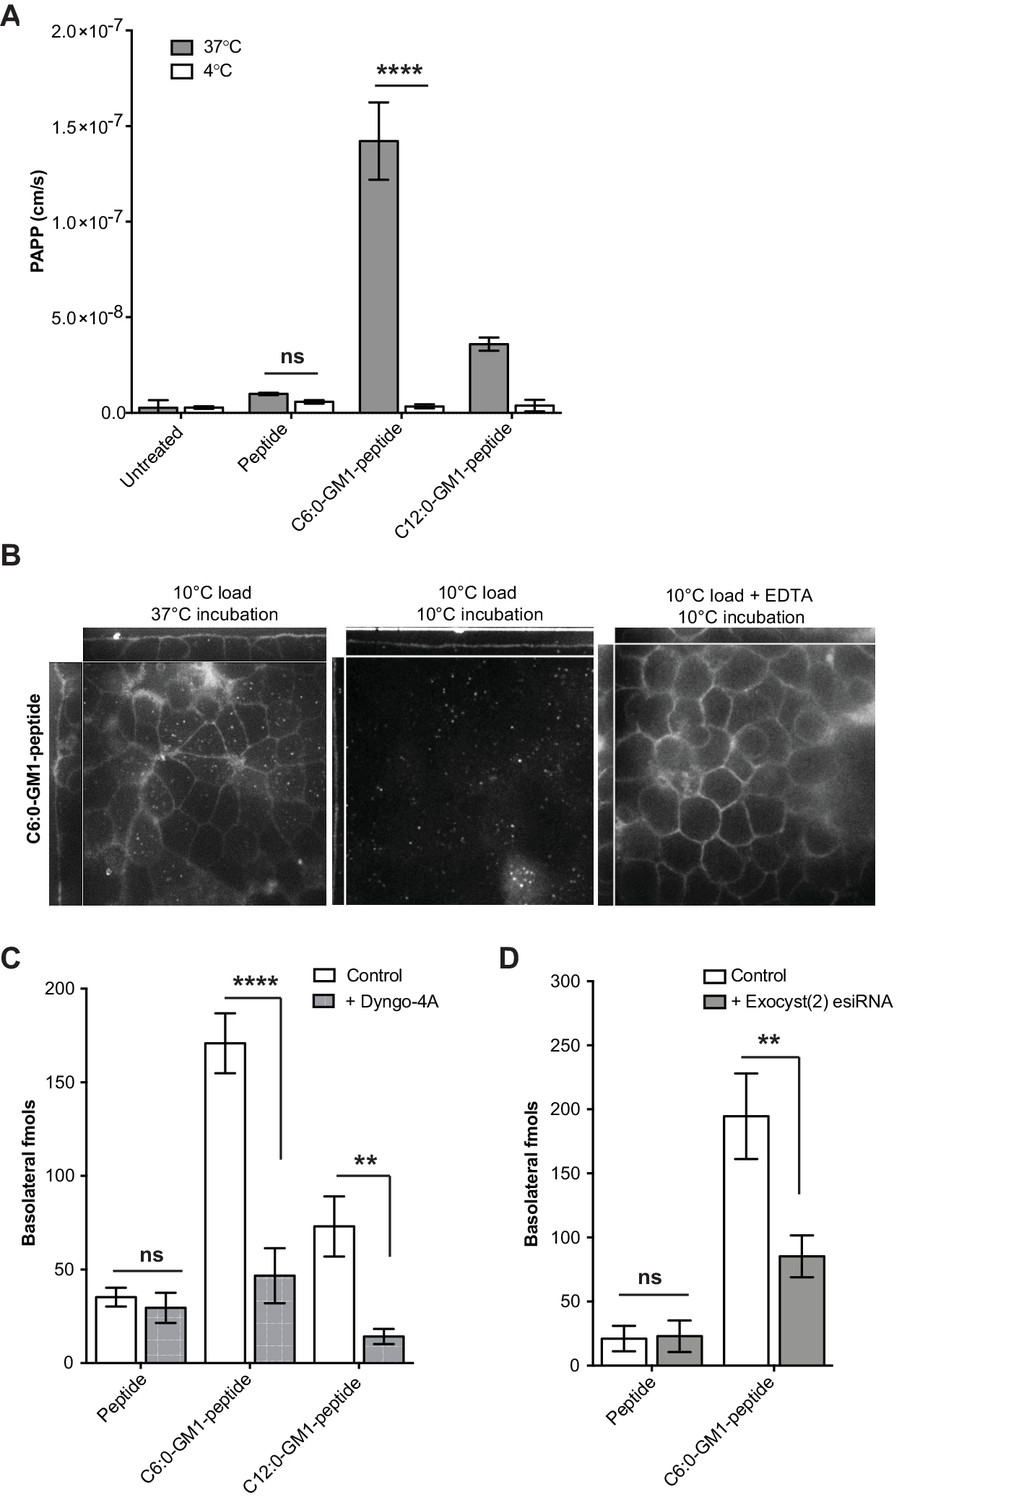
Transport of short-chain GM1 ceramides occurs via transcytosis.
(A) Transport of C6:0 and C12:0 GM1-peptide fusions across T84 cell monolayers reported as apparent permeability (PAPP) shows that minimal transport occurs during a 4°C temperature block. (B) Analysis of MDCK-II monolayers loaded with 0.5 μM C6:0-GM1 peptide fusion in the absence (left and middle panels) or presence (right panel) of 2 mM EDTA. Live cell confocal imaging shows minimal transport occurs during a 10°C temperature block (middle panel) consistent with transcellular transport by membrane trafficking and minimal paracellular leak. In the presence of disrupted tight junctions (i.e. in the presence of EDTA, right panel) basolateral membranes are stained by paracellular passive diffusion (transcellular leak). (C) Transcytosis across MDCK-II monolayers is blocked by dynamin inhibition of endocytosis (50 μM Dyngo-4A). In Dyngo-4A treated cells (gray bars), there is a significant decrease in transepithelial transport of both C6:0 (n = 8) and C12:0 (n = 8) GM1-peptide fusions but not the unfused reporter peptide (n = 6). (D) Transcellular transport of the C6:0-GM1 peptide fusion (n = 6) or unfused reporter peptide (n = 5) in cell monolayers depleted of the exocyst complex by esiRNA transfection against EXO2 (gray bars). (mean ± s.e.m) (ns = non significant, **p<0.01, ****p<0.0001; Bonferroni’s multiple comparison test).
Figure 3 with 1 supplement
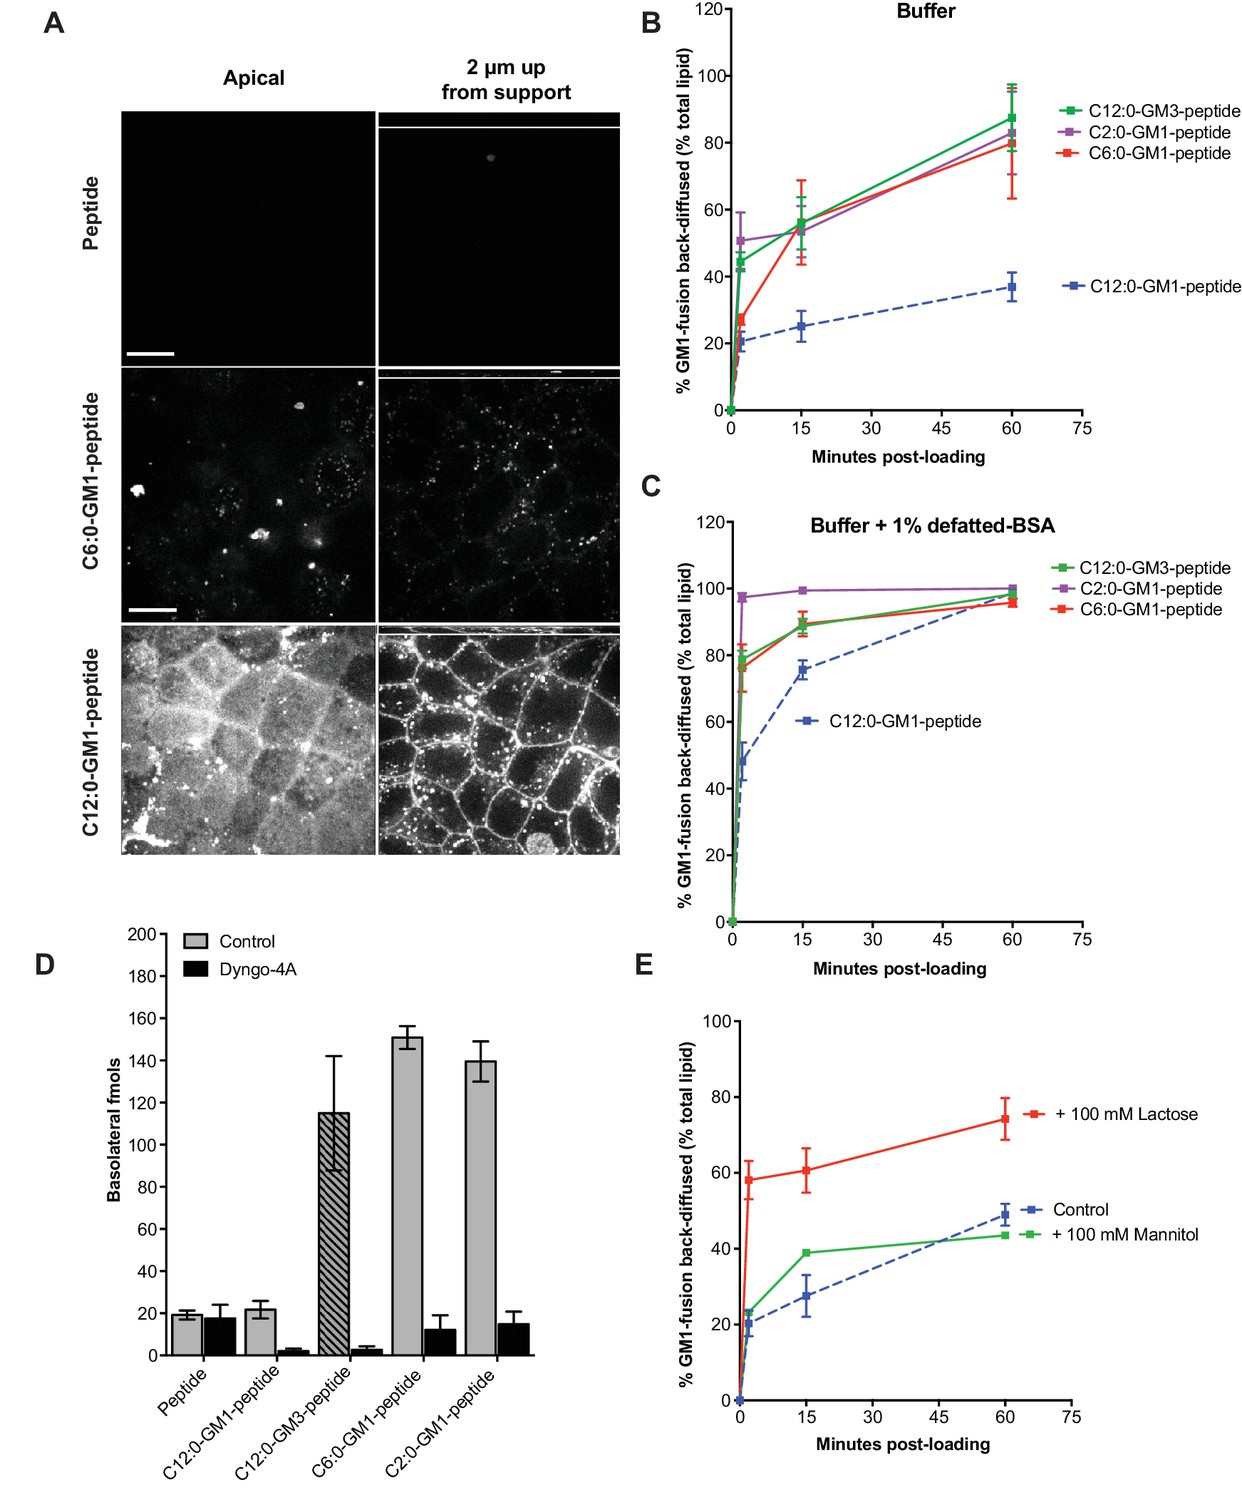
Release from membranes to solution by short-chain GM1 species.
(A) Live cell confocal images of MDCK-II cell monolayers after a 10 min pulse and 3 hr chase with 0.5 μM reporter peptide, C6:0 or C12:0-GM1 peptide fusion. Images are taken at the plane of apical membranes (left column) or midway through cell body (right column) (B-C) Time courses of diffusion from MDCK-II cell membranes to media (B) or media containing defatted-BSA (C) of C2:0 (n = 5), C6:0 (n = 8), C12:0 (n = 12) GM1-peptide fusions and C12:0-GM3-pepide fusion (n = 9). (D) The C12:0-GM3 peptide fusion has enhanced transepithelial transport across T84 cell monolayers compared to the C12:0-GM1-peptide fusion and is dynamin dependent (n = 4). (E) The rate of membrane release of the C12:0- GM1-peptide molecule is enhanced in the presence of 100 mM lactose, but not 100 mM mannitol implicating a galactose-specific lectin membrane anchor (n = 10) (mean ± s.e.m).
Figure 3—figure supplement 1
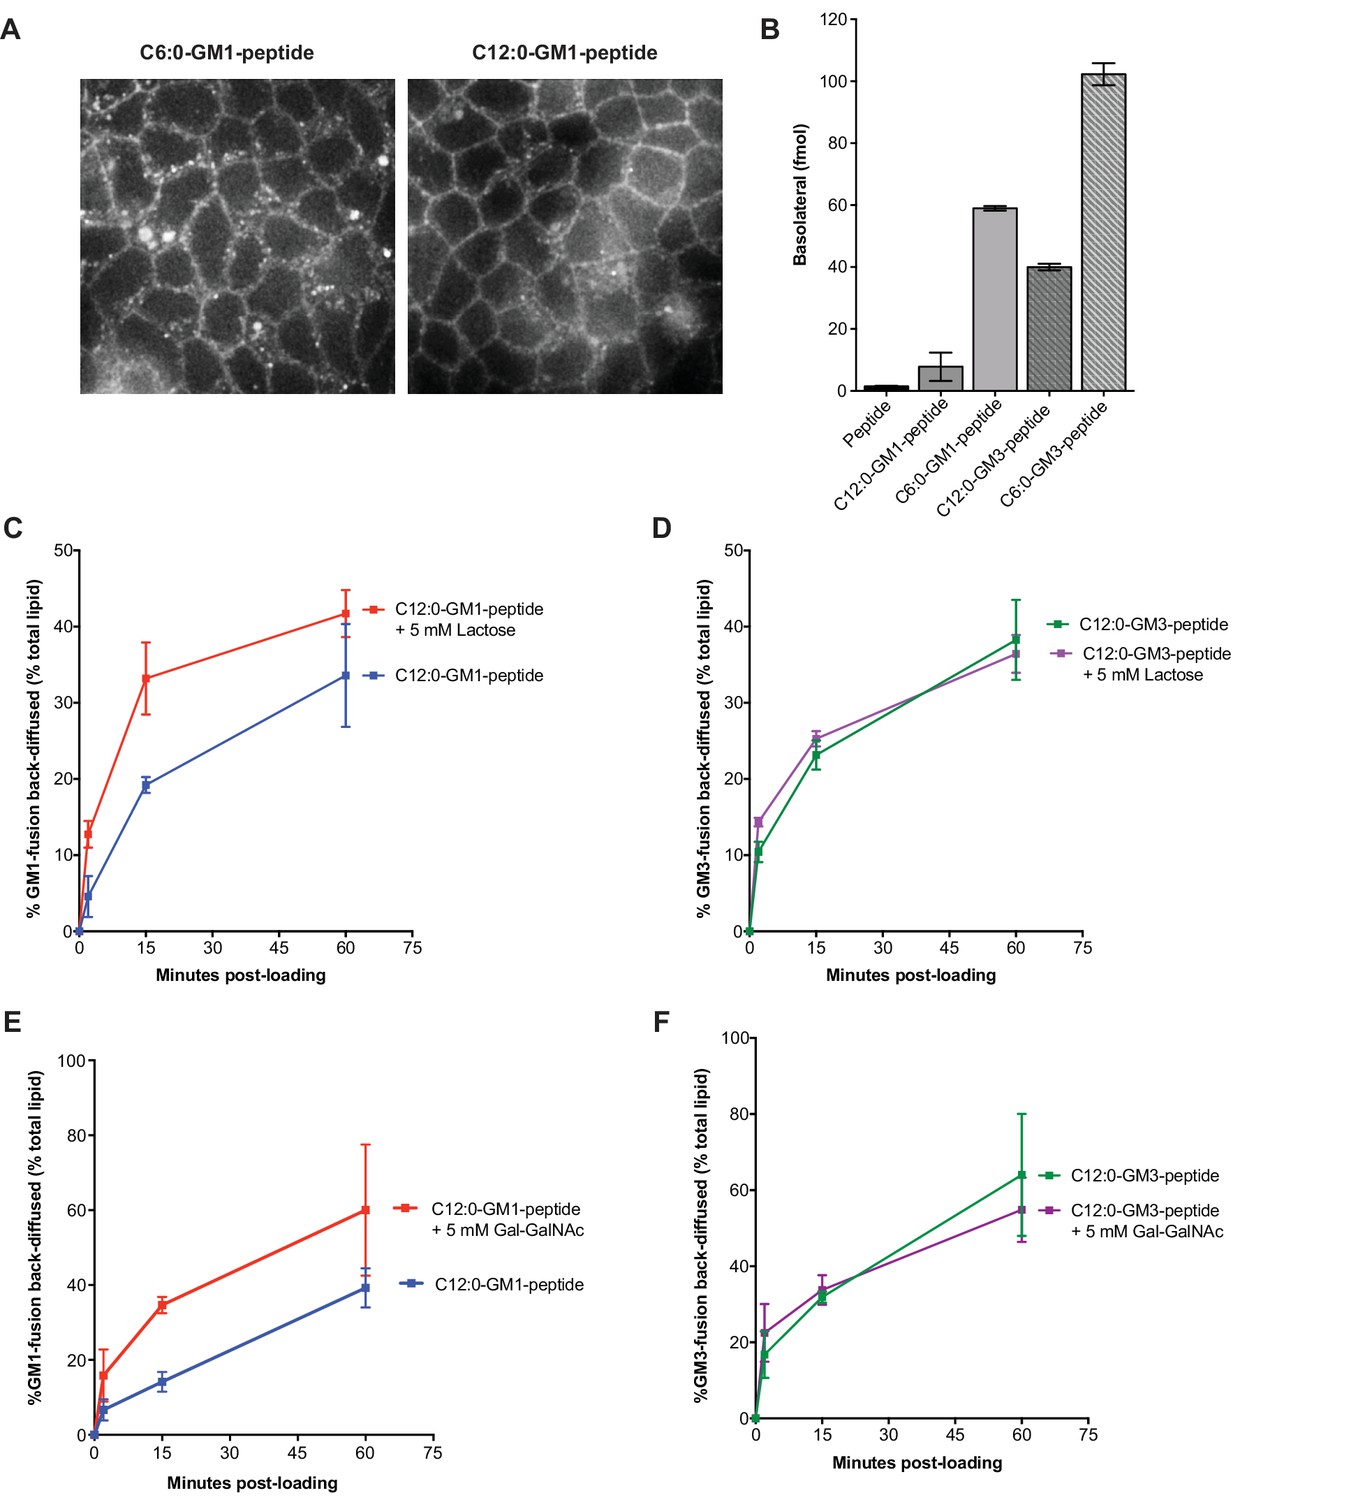
Membrane release to solution depends on ceramide and oligosaccharide structure.
(A) Live cell confocal images of MDCK cell monolayers after a 10 min pulse and 10 min chase with 0.5 μM C6:0 or C12:0-GM1 peptide fusion. Images are taken at level of basolateral membranes. (B) The C6:0-GM3 peptide fusion shows enhanced transepithelial transport compared to the C6:0-GM1-peptide fusion (n = 2). (C–D) Time course of diffusion from MDCK cell membranes to solution for C12:0-GM1 and C12:0-GM3 peptide fusions in the presence of 5 mM lactose. The rate of membrane release of the C12:0-GM1-peptide molecule is enhanced in the presence of 5 mM lactose (n = 4) (mean ± s.e.m). In contrast, the rate of diffusion from cell membranes to solution for the C12:0-GM3 peptide fusion is not affected by treatment with 5 mM lactose (n = 4) (mean ± s.e.m). (E–F) In the presence of 5 mM galactosyl-N-acetyl-galactosamine- (Gal-GalNAc), the GM1-peptide fusion molecule shows a faster rate of diffusion from cell membranes to solution (n = 6) (mean ± s.e.m). Treatment with 5 mM Gal-GalNAc had no effect on the rate of diffusion for the GM3-peptide fusion molecule (n = 6) (mean ± s.e.m).
Figure 4
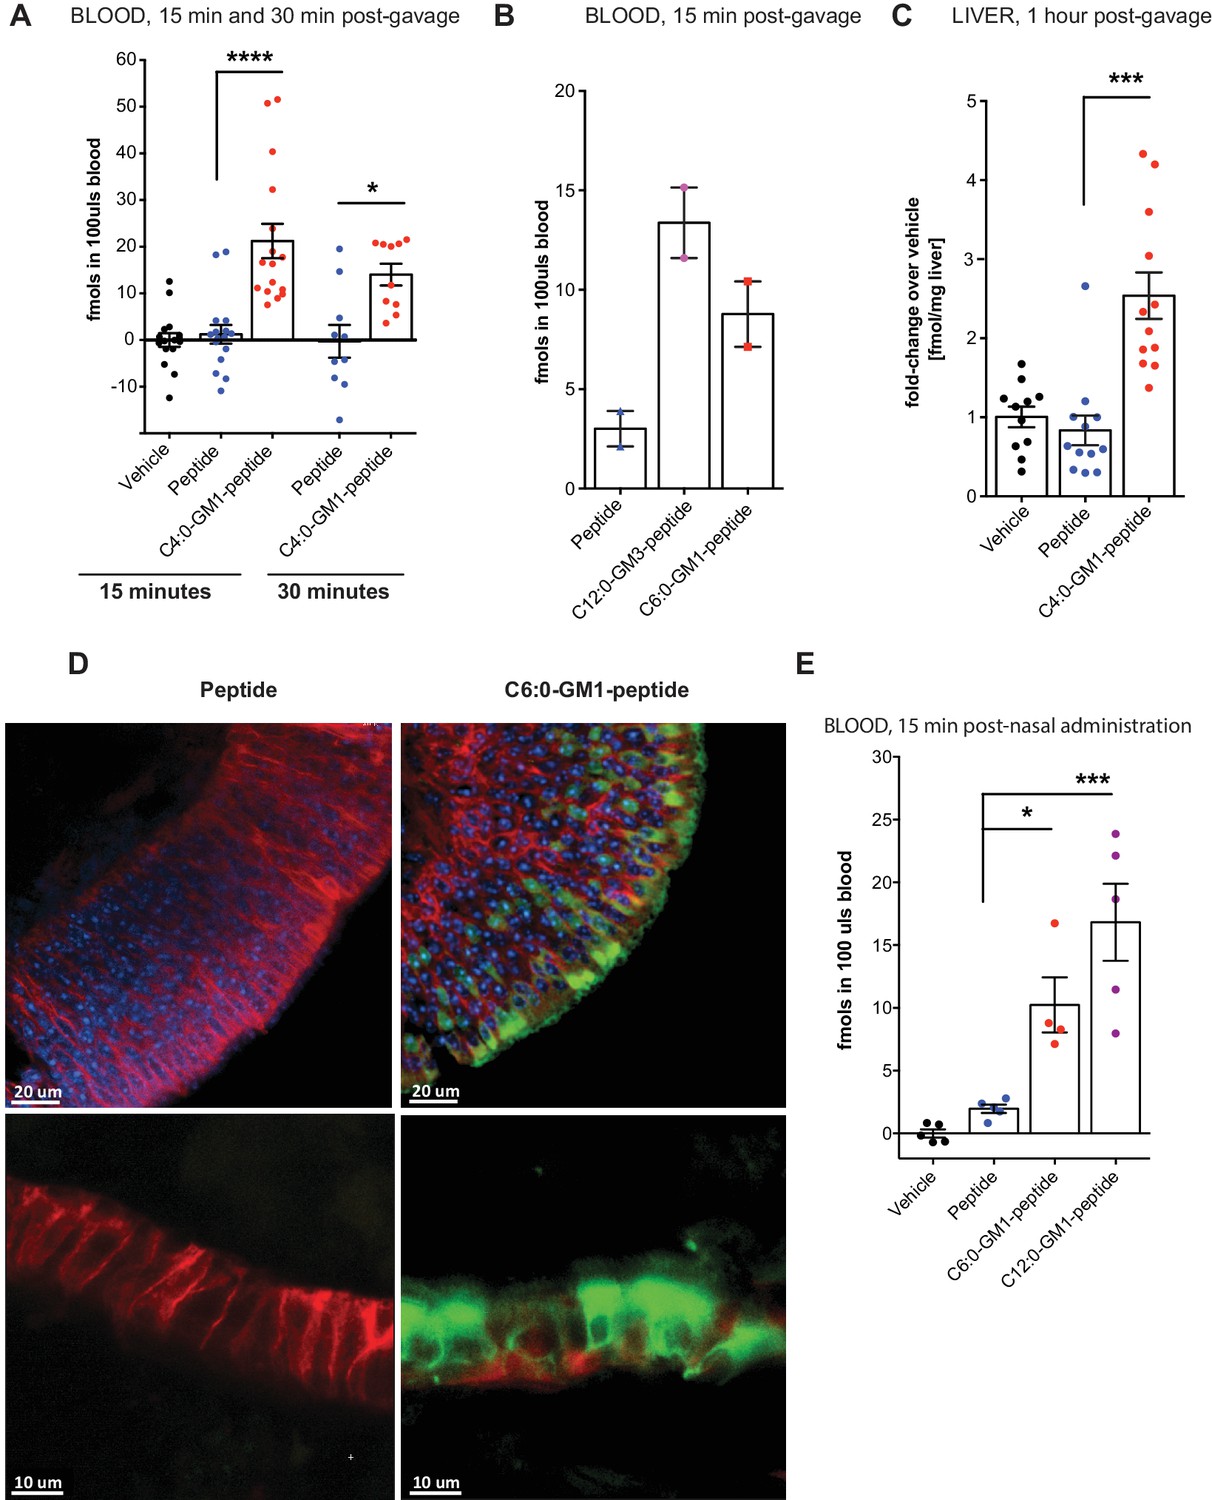
Absorption across intestinal and nasal epithelial barriers in vivo.
(A) In vivo studies showing absorption across intestinal epithelial barriers into blood after gastric administration of the C4:0-GM1-peptide fusion, vehicle alone, or unfused reporter peptide (five independent experiments). (B) Absorption across the intestine into blood 15 min after gastric administration of the C12:0-GM3, C6:0-GM1 peptide fusions or unfused reporter peptide (n = 2). (C) 1 hr after gastric gavage the C4:0-GM1 peptide fusion is absorbed to the liver whereas the unfused reporter peptide is not detected (four independent experiments). (D) Uptake into nasal epithelium. After topical nasal administration, tissue was fixed with 4% formaldehyde and stained with anti-EpCAM to label epithelium (red) and DAPI (blue) for nuclei. Images by two-photon microscopy comparing transport of the unfused reporter peptide (left panels) and C6:0-GM1 peptide fusion (green labeling, right panels) Scale bars 20 um upper panels, 10 um lower panels. (E) Biochemical analysis of blood 30 min after nasal administration shows systemic absorption of C6:0 and C12:0-GM1 peptide fusions (two independent experiments). (A–E) Each data point on graphs represents individual mice and bars represent mean ± s.e.m. (ns = non significant, *p<0.5; ***p<0.0001, Tukey’s multiple comparison test).
-
Figure 4—source data 1
Summary Data for Figure 4A.
Columns represent treatment groups. Groupings of rows represent data collected on the same day (independent experiments). Every number is fmols per 100uls blood calculated from standard curves per individual mouse (each measured is an average of two technical replicates). Raw data and data corrected for vehicle (background) are provided.
- https://doi.org/10.7554/eLife.34469.010
-
Figure 4—source data 2
Summary Data for Figure 4E.
Columns represent treatment groups. Groupings of rows represent data collected on the same day (independent experiments). Every number is fmols per 100uls blood calculated from standard curves per individual mouse (each measure is an average of two technical replicates). Raw data and data corrected for vehicle (background) are provided.
- https://doi.org/10.7554/eLife.34469.011
Figure 5 with 1 supplement
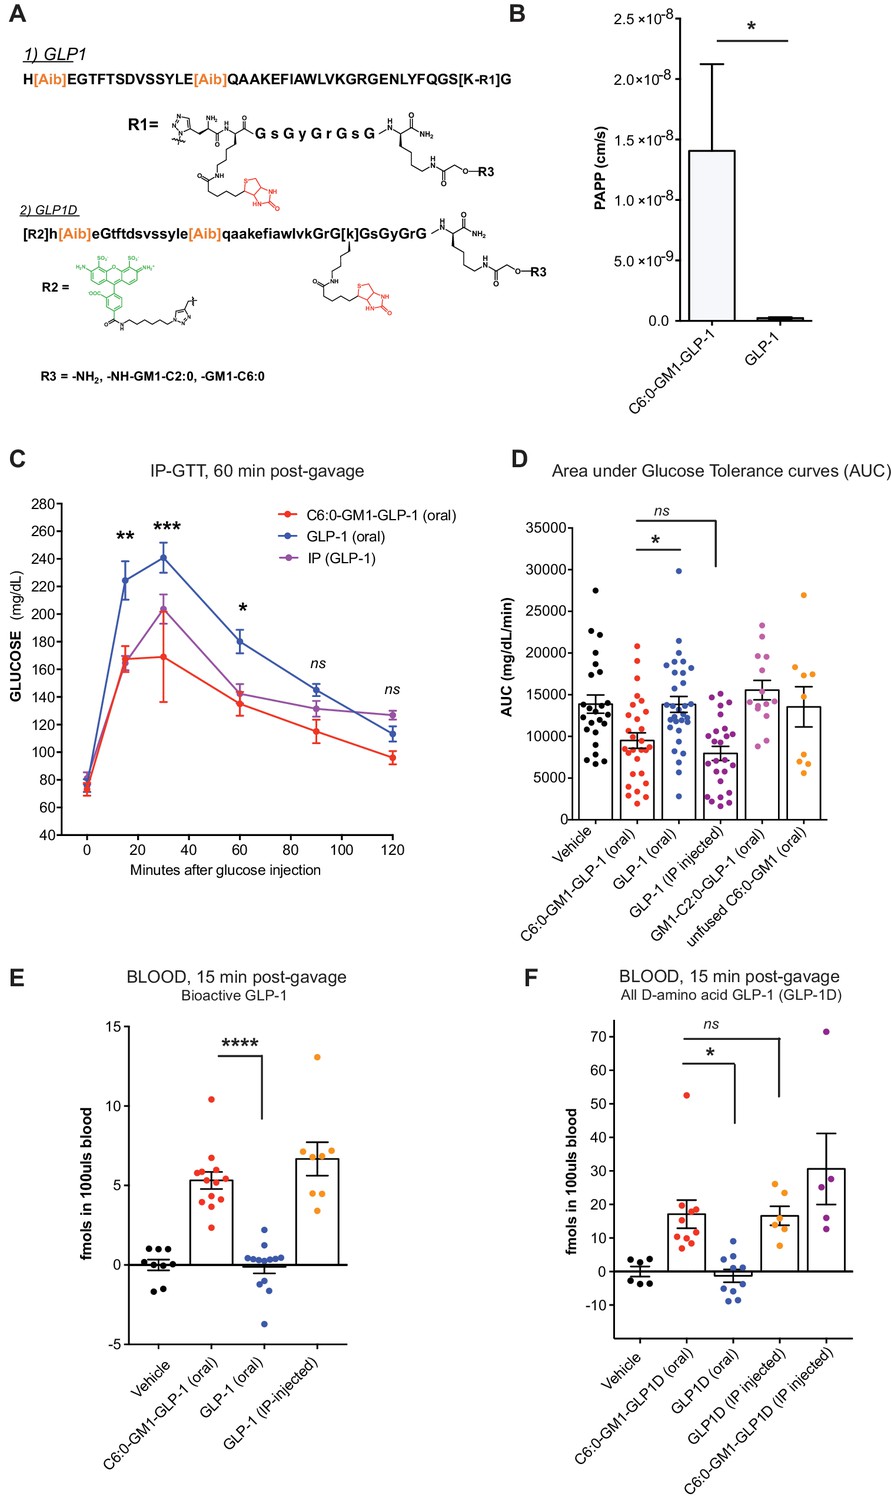
GM1-mediated absorption of GLP-1 affects blood glucose metabolism.
(A) GLP-1 and all-D GLP-1 isomer sequence used for coupling to a C6:0 and C2:0 GM1 ceramide species. (B) In vitro transcytosis assay with C6:0-GM1-GLP-1, or unfused GLP-1 across T84 cell monolayers (three independent experiments) (Unpaired t-test, *p<0.5). (C) Representative intraperitoneal glucose tolerance test after gastric gavage of 10 nmol/kg C6:0-GM1-GLP-1. Each point represents mean ± s.e.m (n = 4 mice). Mice fed C6:0-GM1-GLP-1 (red curve) show faster recovery after a glucose challenge in contrast to mice gavaged with unfused GLP-1 (blue curve) or vehicle (black curve) (D) Effect of the indicated GM1-GLP-1 species, GLP-1 alone, or vehicle on glucose tolerance quantified as Area under Curve (AUC) for 10 independent experiments with each data point representing individual mice and bar representing the mean ± s.e.m. (E) GLP-1 in blood 15 min after gastric gavage quantified for each species using the luciferase bioassay (fmols of compound per 100uls blood for three independent experiments). (F) Systemic absorption of an all D-isomer of GLP-1 used to directly measure the cargo in blood (three independent experiments). (A–E) Each data point on graphs represents individual mice and bars represent mean ± s.e.m. (ns = non significant, *p<0.5; ***p<0.0001, Tukey’s multiple comparison test).
-
Figure 5—source data 1
Source Data for Figure 5D.
Columns represent treatment groups. Groupings of rows represent data collected on the same day (independent experiments, exp 1–10). Every number is the total area under glucose tolerance curves per individual mice calculated using GraphPad PRISM 7.0 software. This AUC data (not corrected) was used to produce Figure 5D.
- https://doi.org/10.7554/eLife.34469.014
-
Figure 5—source data 2
Source Data for Figure 5E.
Columns represent treatment groups. Groupings of rows represent data collected on the same day (independent experiments). Every number is fmols per 100uls blood calculated from GLP-1 or C6:0-GM1-GLP-1 bioactivity/luciferase curves for each individual mouse.
- https://doi.org/10.7554/eLife.34469.015
-
Figure 5—source data 3
Source Data for Figure 5F.
Columns represent treatment groups. Groupings of rows represent data collected on the same day (independent experiments). Every number is fmols per 100uls blood calculated from standard curves per individual mouse (each measured is an average of two technical replicates (with variance well less than 10%).
- https://doi.org/10.7554/eLife.34469.016
Figure 5—figure supplement 1
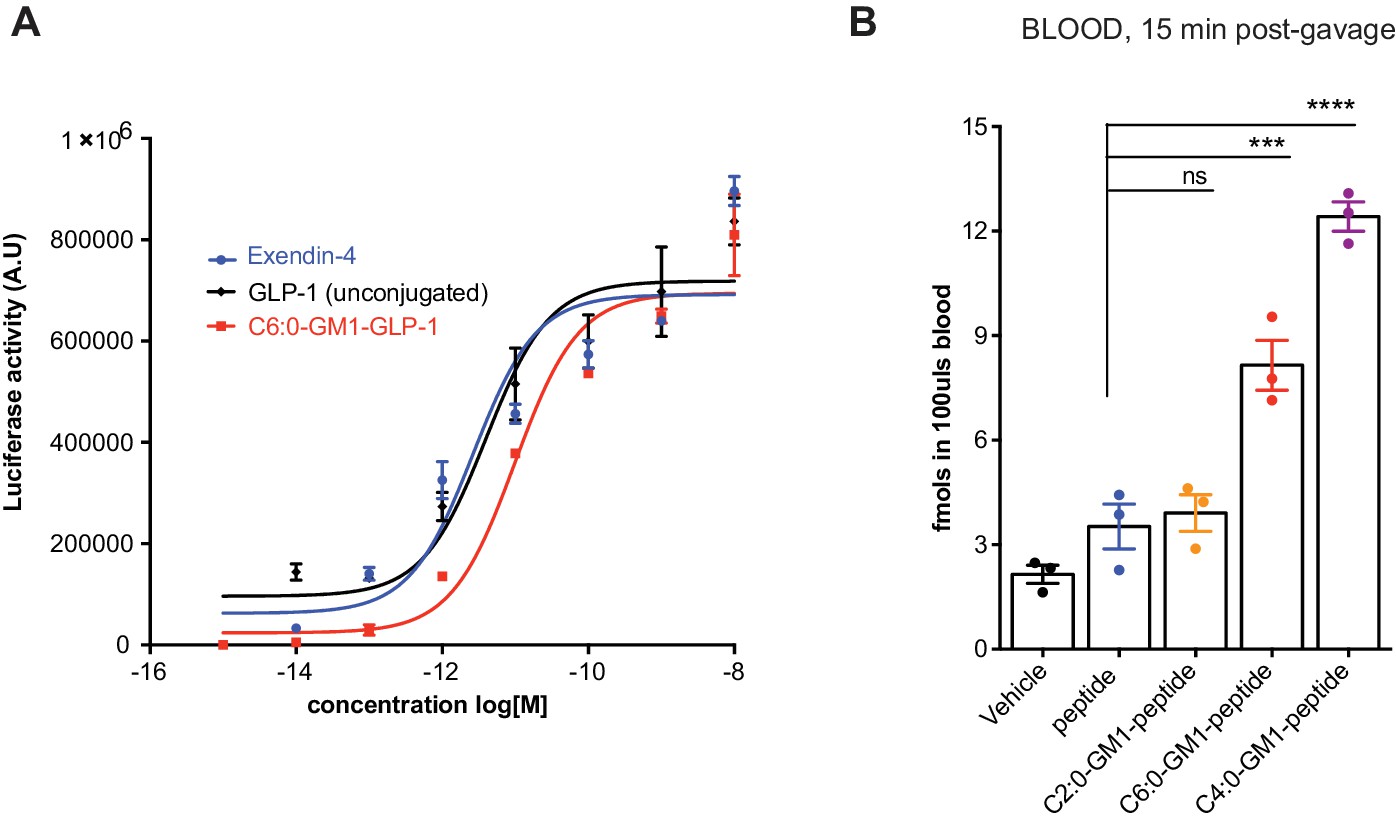
GM1-mediated absorption of GLP-1.
(A) Representative luciferase assay confirming enzymatic activity of our C6:0-GM1-GLP-1 fusion compared to unfused GLP-1 and commercially available Exendin-4. (B) In vivo study showing absorption across intestinal epithelial barriers into blood after oral administration of the C6:0 and C4:0-GM1 peptide fusion compared to vehicle and the unfused reporter peptide. In contrast, the C2:0-GM1-peptide fusion is not absorbed.
Additional files
-
Transparent reporting form
- https://doi.org/10.7554/eLife.34469.017
Download links
A two-part list of links to download the article, or parts of the article, in various formats.
Downloads (link to download the article as PDF)
Open citations (links to open the citations from this article in various online reference manager services)
Cite this article (links to download the citations from this article in formats compatible with various reference manager tools)
Mucosal absorption of therapeutic peptides by harnessing the endogenous sorting of glycosphingolipids
eLife 7:e34469.
https://doi.org/10.7554/eLife.34469


