Estimating the protein burden limit of yeast cells by measuring the expression limits of glycolytic proteins
- Okayama University, Japan
- Kobe University, Japan
- Meiji University, Japan
Figures
Figure 1

Overexpression of most glycolytic proteins using a strong promoter and a multicopy plasmid causes growth defects.
(A) The plasmid used in this study. Each glycolytic gene was cloned into a 2-µm-based multicopy plasmid (pTOW40836) and expressed from the TDH3 promoter (TDH3pro) (with the exception of PYK1 which was expressed from the PYK1 promoter [PYK1pro], represented in the figure as (p)). In +leucine conditions, the copy number of the plasmid is relatively low (~30). In –leucine conditions, the copy number goes up to 150 copies per cell due to the bias of leu2-89 (Moriya et al., 2012). Here, we designate these conditions low- and high-copy conditions, respectively. (B and C) Maximum growth rate of yeast cells harboring the plasmid overexpressing each glycolytic protein in the indicated growth conditions. The unit is min−1 × 10⁻⁴. (D and E) Copy number of the plasmid overexpressing each glycolytic protein in the indicated growth conditions. The unit is copy number per haploid genome. The error bars shows the standard deviation of at least three independent biological measurements.
-
Figure 1—source data 1
This spreadsheet contains all data and statistical values associated with the figure.
- https://doi.org/10.7554/eLife.34595.004
Figure 2 with 3 supplements
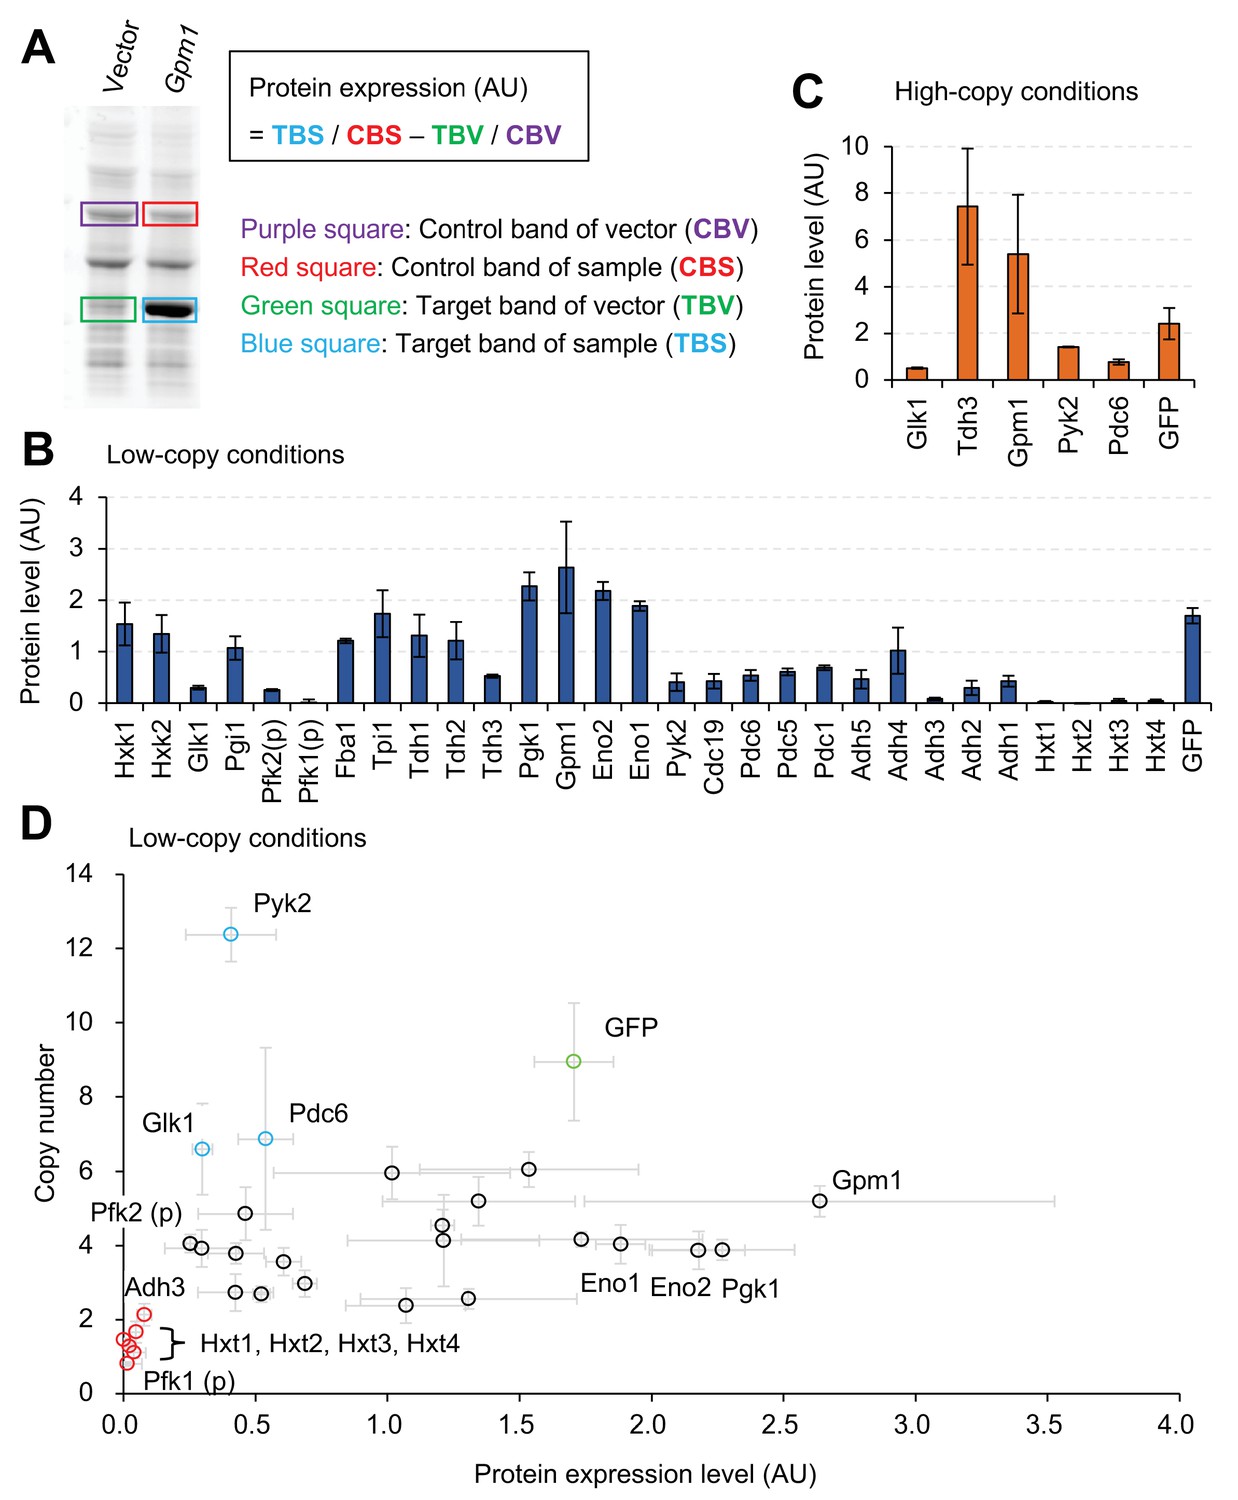
Expression limits of glycolytic proteins.
(A) Measurement of the expression level of an overexpressed glycolytic protein. Whole cellular proteins were stained by a fluorescent dye and separated by SDS-PAGE. The overexpression of the target protein (TBS), estimated from the intensity of it's band on the gel an its molecular weight, was compared with the corresponding expression of the vector control (TBV), after normalization using control bands (CBS and CBV) to calculate protein expression (AU). Measurement of Gpm1 expression level is shown as an example. (B and C) The expression level of glycolytic proteins overexpressed using the experimental system shown in Figure 1 in the indicated conditions. The TDH3 promoter was used for the expression of all genes except where (p) indicates the use of the PYK1 promoter. (D) Relationship between copy number and protein level in low-copy conditions. The copy number data are the same as in Figure 1D, and the protein level data are the same as in Figure 2B. The error bars shows the standard deviation of at least three independent biological measurements.
-
Figure 2—source data 1
This spreadsheet contains all data and statistical values associated with the figure.
- https://doi.org/10.7554/eLife.34595.009
Figure 2—figure supplement 1
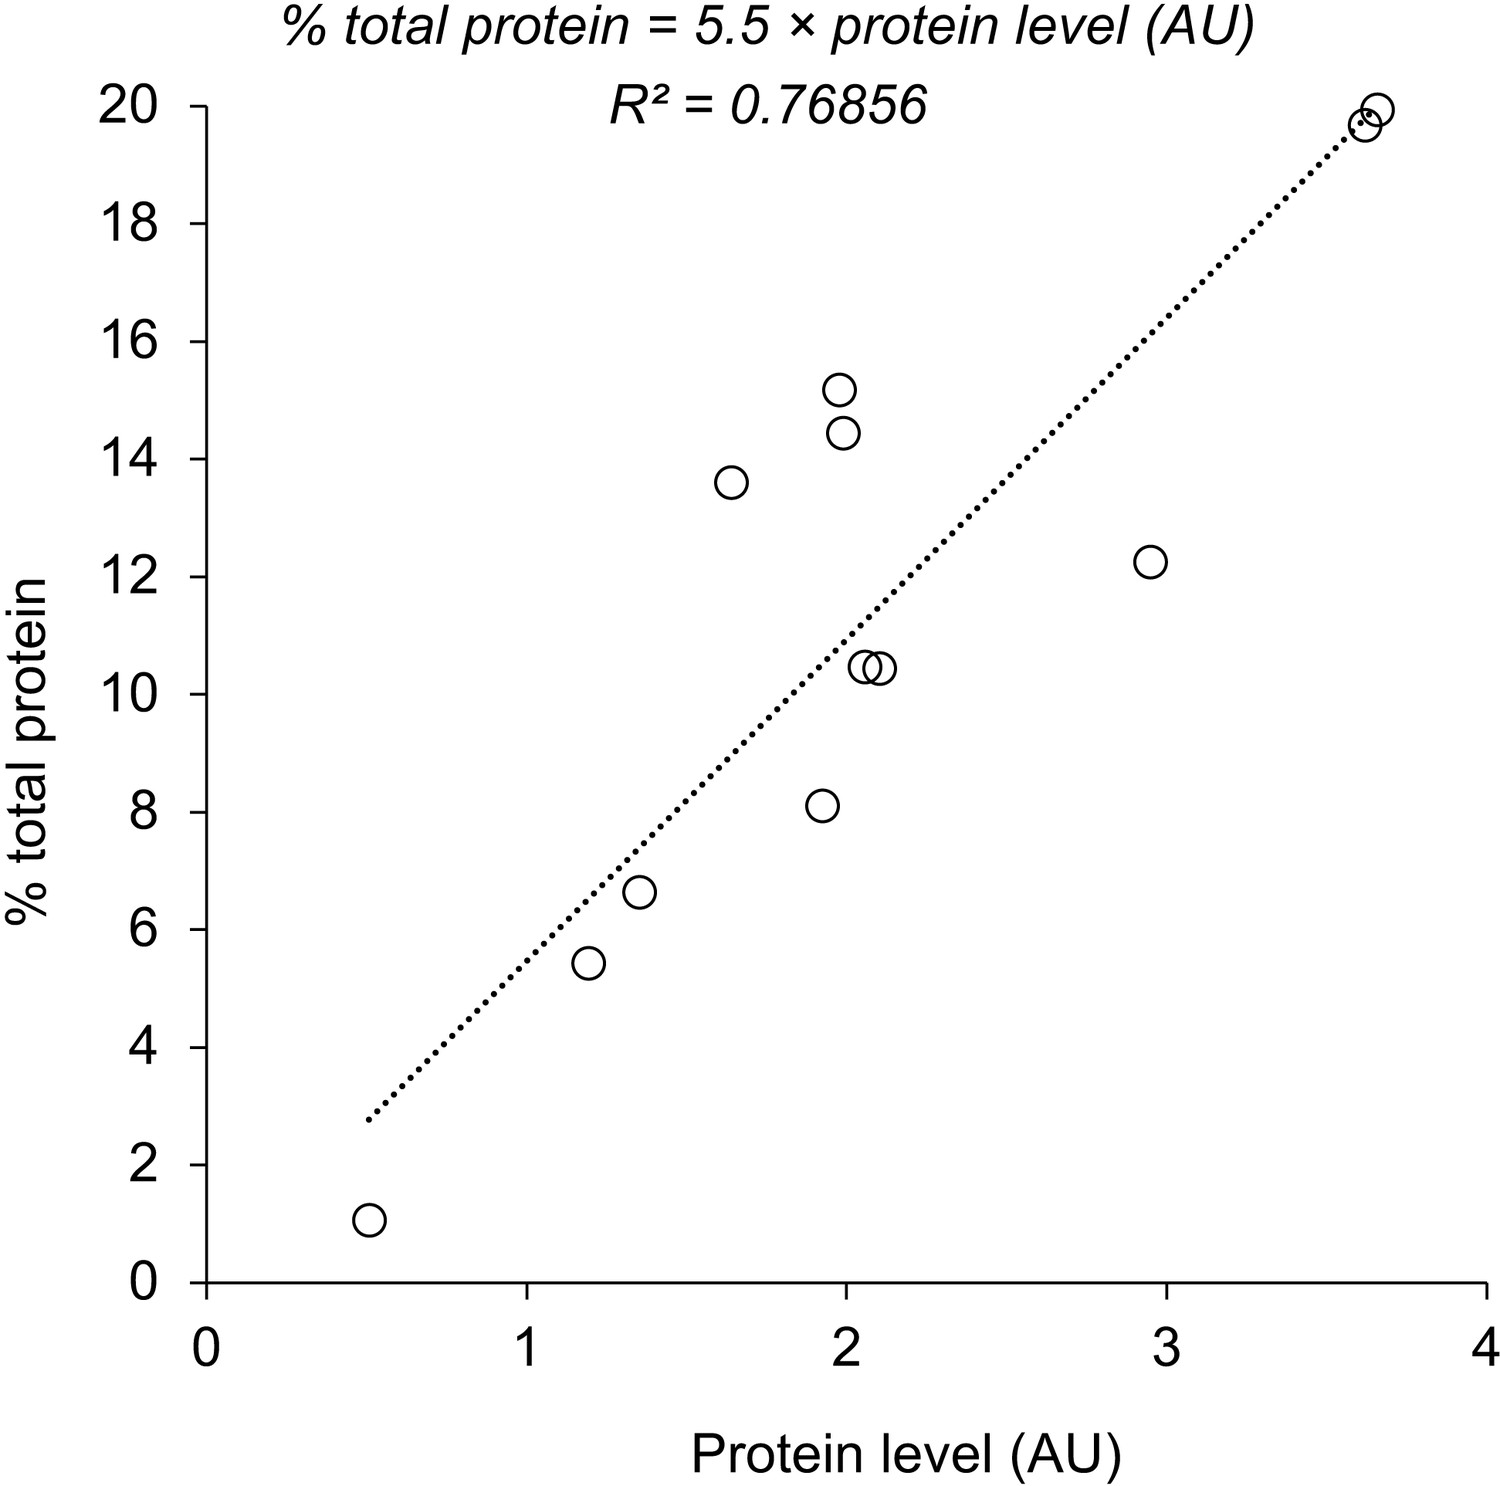
Relationship between percentage of total protein in (Kintaka et al., 2016) and protein level (AU) in this study.
The equation derived by the linear regression of the data and the R-squared value are shown. Each circle indicates an independent measurement from Gpm1 (six samples), Pgk1 (three samples), and Adh4 (four samples) experiments.
Figure 2—figure supplement 2
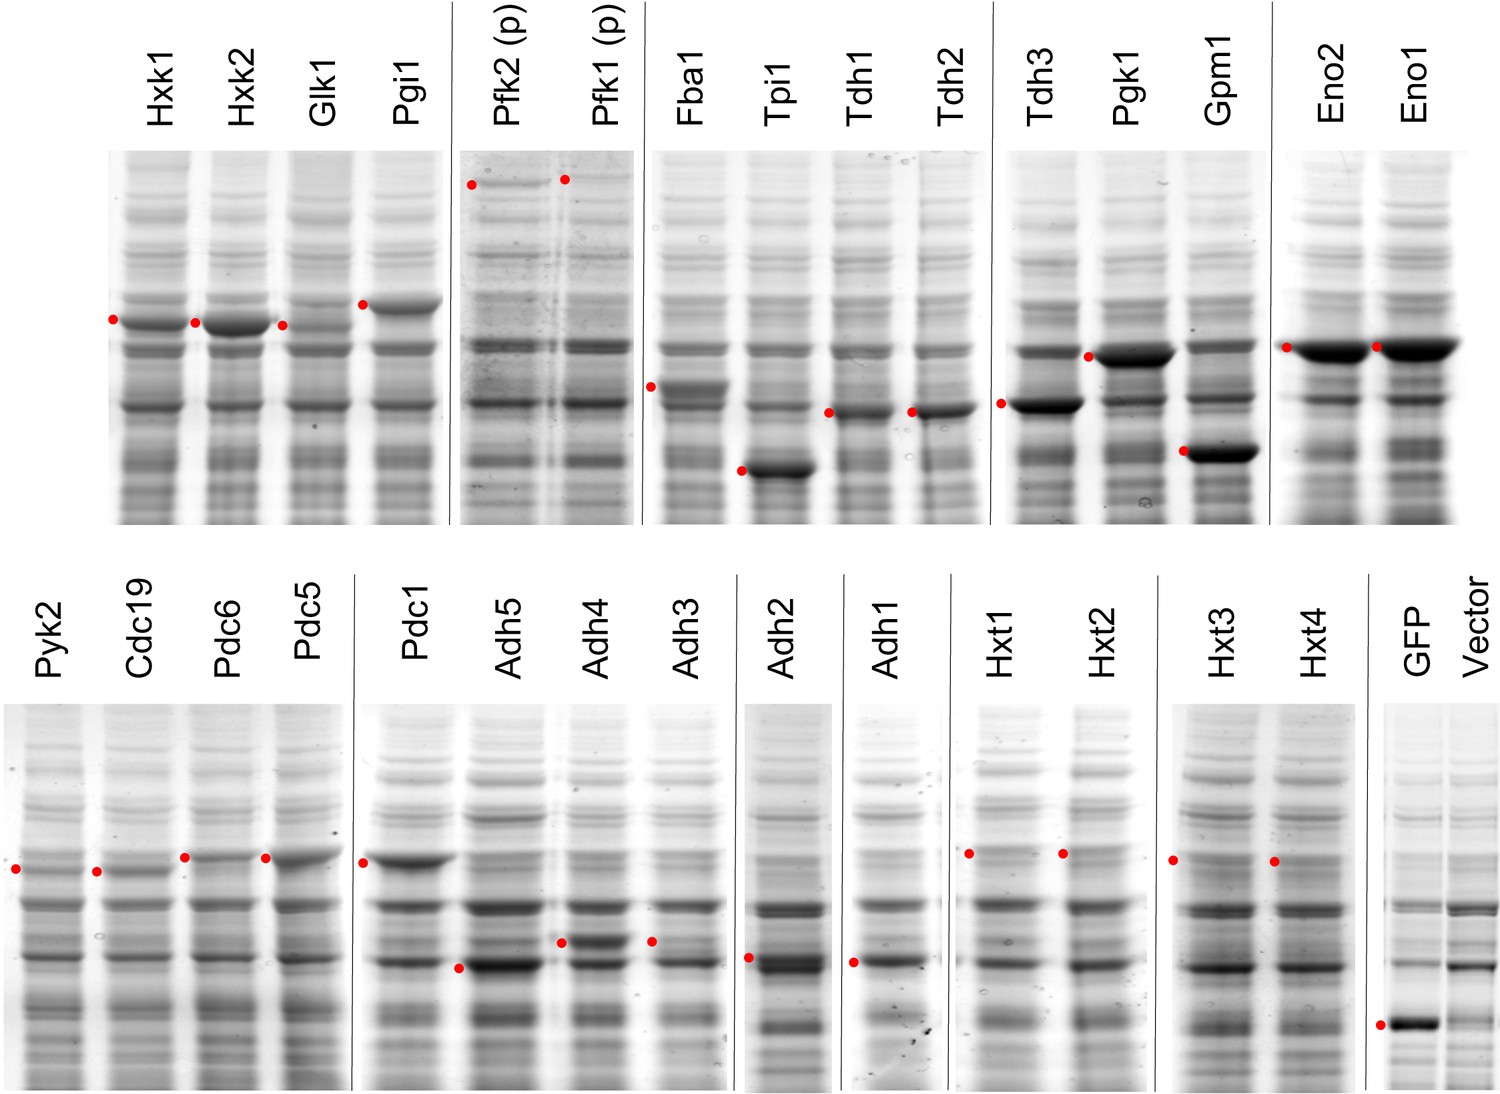
SDS-PAGE-separated total cellular proteins of the cells overexpressing glycolytic proteins.
Proteins were analyzed in low-copy conditions. Red dots indicate the expected size of the target proteins. The TDH3 promoter was used for the expression of all genes except where (p) indicates the use of the PYK1 promoter.
Figure 2—figure supplement 3
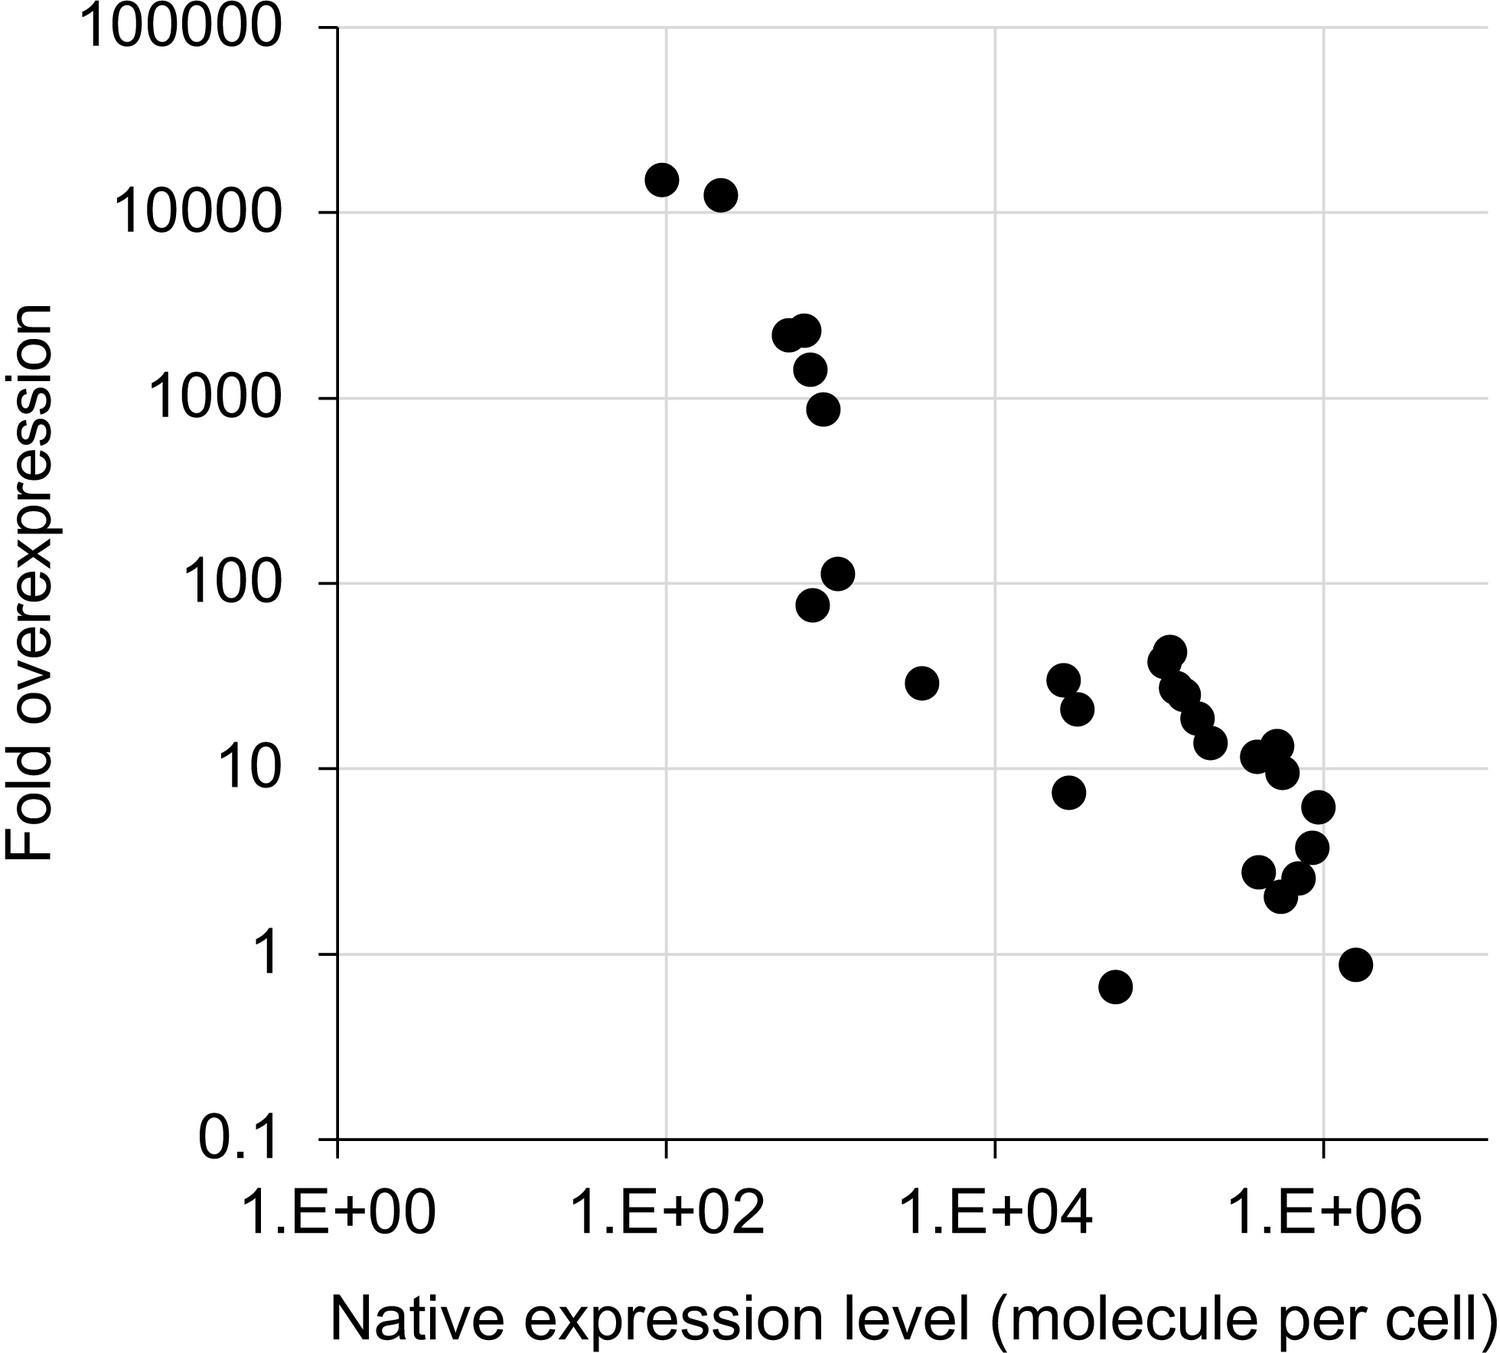
Estimated fold overexpression of glycolytic proteins in this study.
Native expression level of each protein (A) and the percentage per total S. cerevisiae protein were obtained and calculated using published data (Kulak et al., 2014). The percentage of each overexpressed protein (B) was calculated using the data in Figure 2B and the equation in Figure 2—figure supplement 1. Fold overexpression of each target protein over the native level was then calculated as B/A.
Figure 3 with 1 supplement
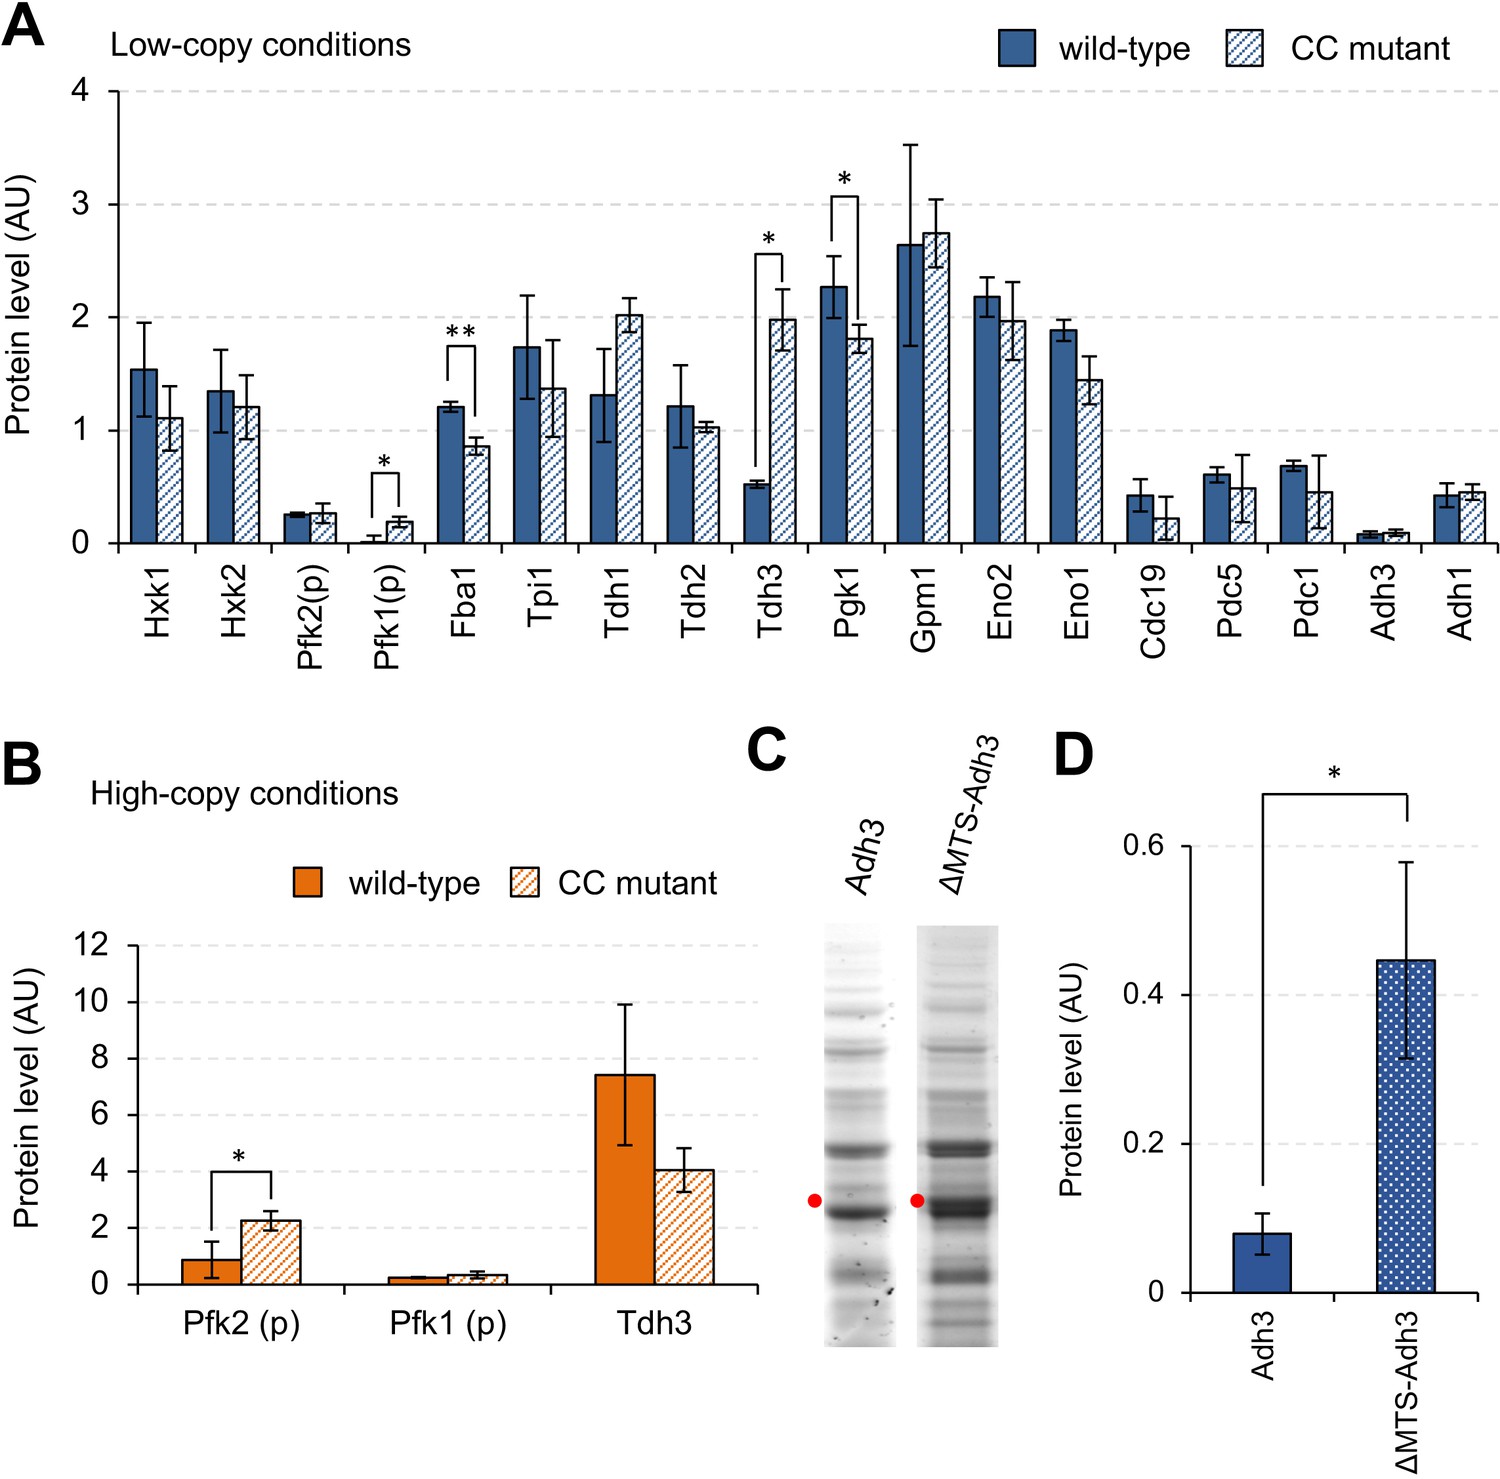
Effects of mutations on the expression limits of glycolytic proteins.
(A and B) Expression levels of wild-type and CC mutant glycolytic proteins in the indicated conditions. Each CC mutant has a mutation in the position shown in Supplementary file 1. (C) SDS-PAGE gel images of whole cellular proteins overexpressing Adh3 and ΔMTS-Adh3 in low-copy conditions. Red dots indicate the expected sizes of the target proteins. (D) Protein expression levels of Adh3 and ΔMTS-Adh3 in low-copy conditions. The error bars indicates the standard deviation of the mean. *p<0.05; **p<0.01 in Welch's t-test.
-
Figure 3—source data 1
This spreadsheet contains all data and statistical values associated with the figure.
- https://doi.org/10.7554/eLife.34595.012
Figure 3—figure supplement 1
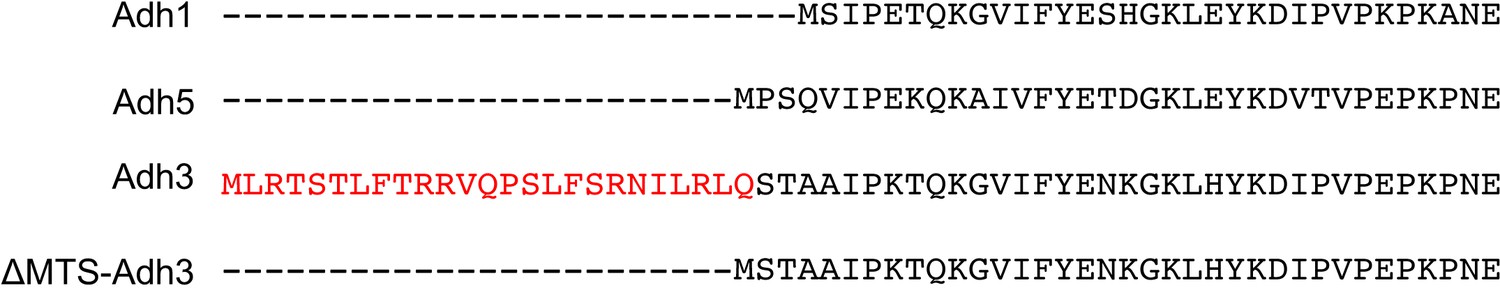
Comparison of the N-terminal amino-acid sequences of Adh1, Adn5, Adh3, and Adh3 mutants without the mitochondrial targeting sequence (ΔMTS-Adh3).
Red letters indicate the predicted mitochondrial targeting sequence.
Figure 4 with 1 supplement
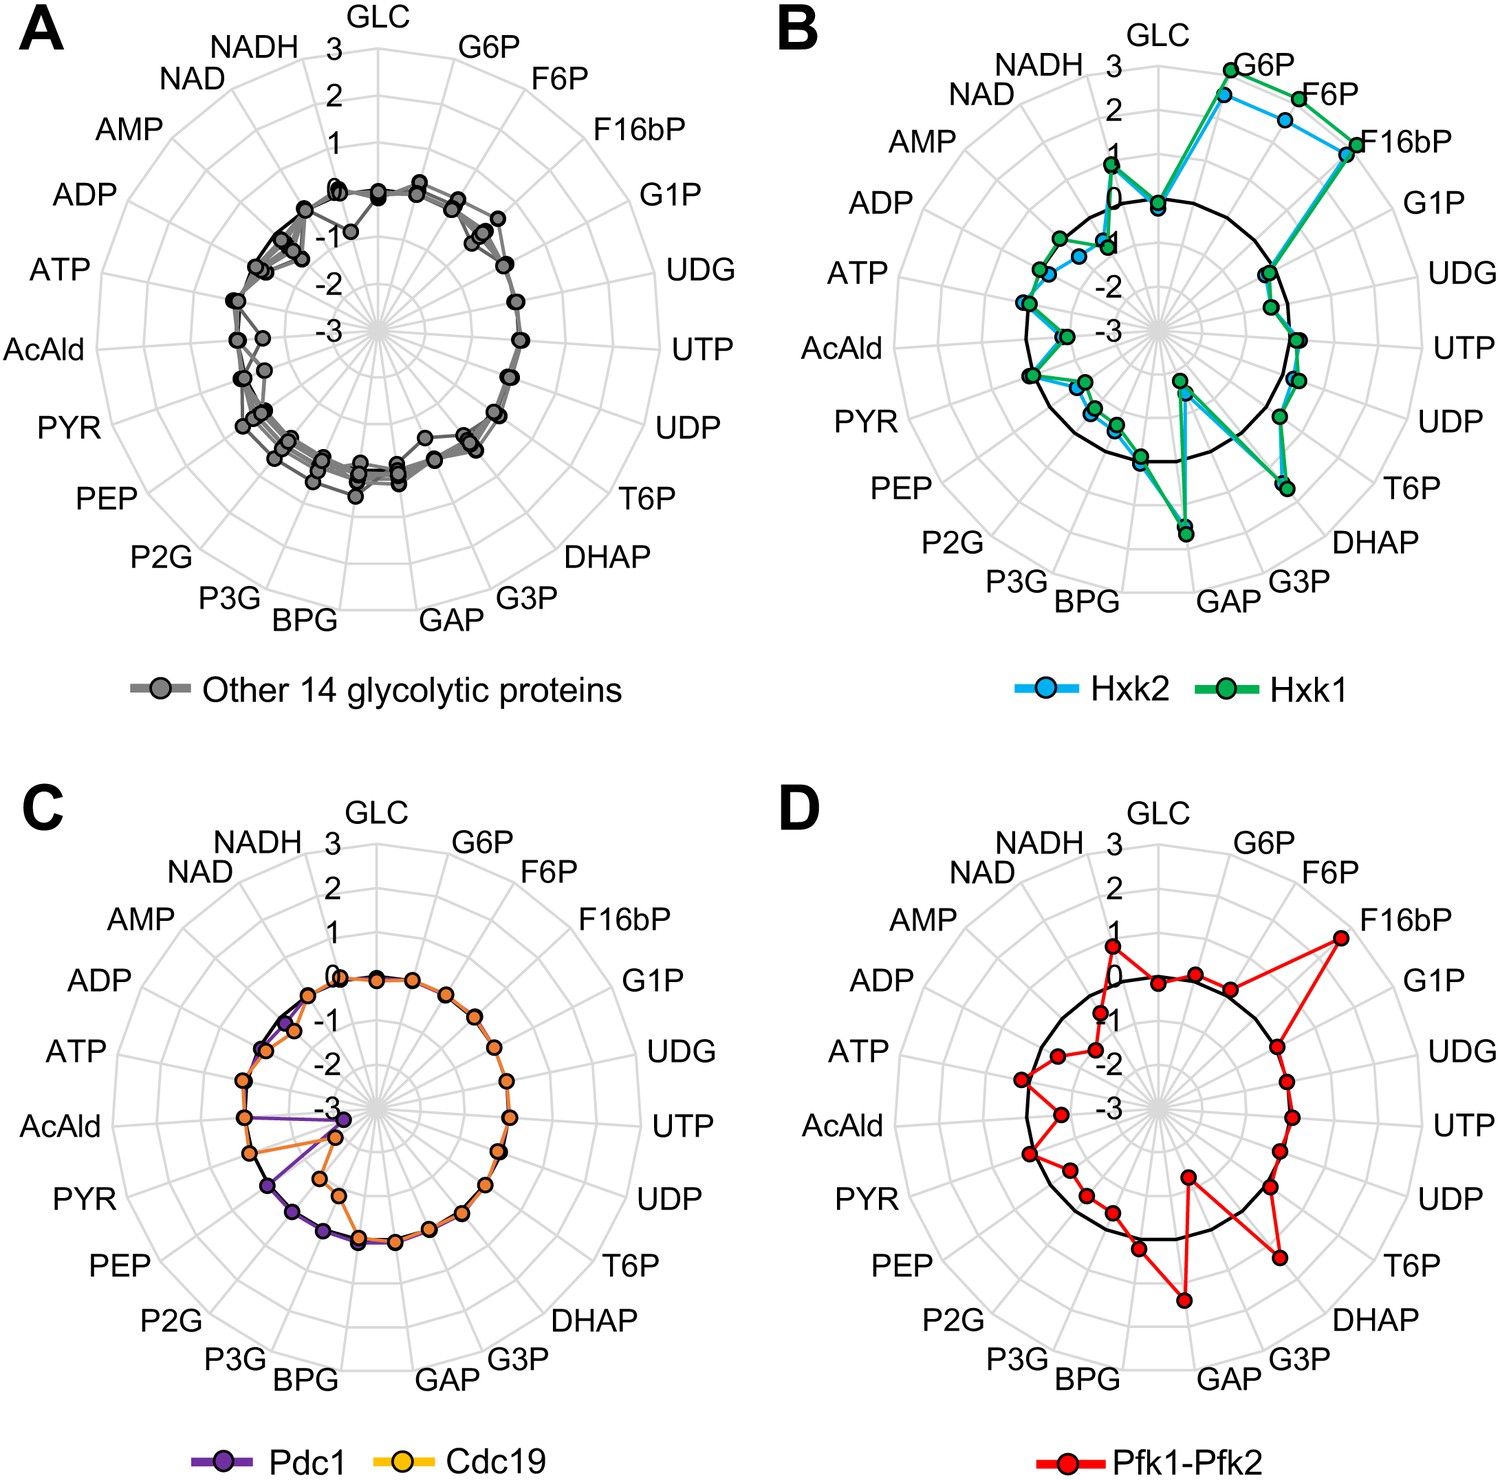
Metabolic perturbations triggered by overexpression of glycolytic proteins in silico.
(A–D) Metabolic change triggered by overexpression of the indicated glycolytic protein in a kinetic model of glycolytic metabolism (Smallbone et al., 2013). Log10 fold-change in each metabolite level in a simulation with 128-fold overexpression of each glycolytic protein compared to that in the wild-type is shown. In (D), Pfk1 and Pfk2 are simultaneously overexpressed.
-
Figure 4—source data 1
This spreadsheet contains all data and statistical values associated with the figure.
- https://doi.org/10.7554/eLife.34595.015
Figure 4—figure supplement 1

Schematic representation of the kinetic model of glycolytic metabolism used in this study (Smallbone et al., 2013).
The diagram is drawn using the Systems Biology Graphic Notation (Le Novère et al., 2009).
Figure 5 with 1 supplement

Metabolic changes triggered by overexpression of glycolytic proteins in vivo.
(A–C) The bar graph shows the log2-fold change in each metabolite in the cells overexpressing wild-type and mutant Pfk2, Pfk1, and Tdh3 over the vector controls. The red circle shows the log2 fold-difference in each metabolite between the wild-type and the CC mutant measurements. The metabolites were measured in exponentially growing cells cultured in low-copy conditions. The error bars indicates the standard deviations of the mean for three (Pfk2) and two (Pfk1, Tdh3) biological replicates. *p<0.05 in Welch's t-test.
-
Figure 5—source data 1
This spreadsheet contains all data and statistical values associated with the figure.
- https://doi.org/10.7554/eLife.34595.018
Figure 5—figure supplement 1
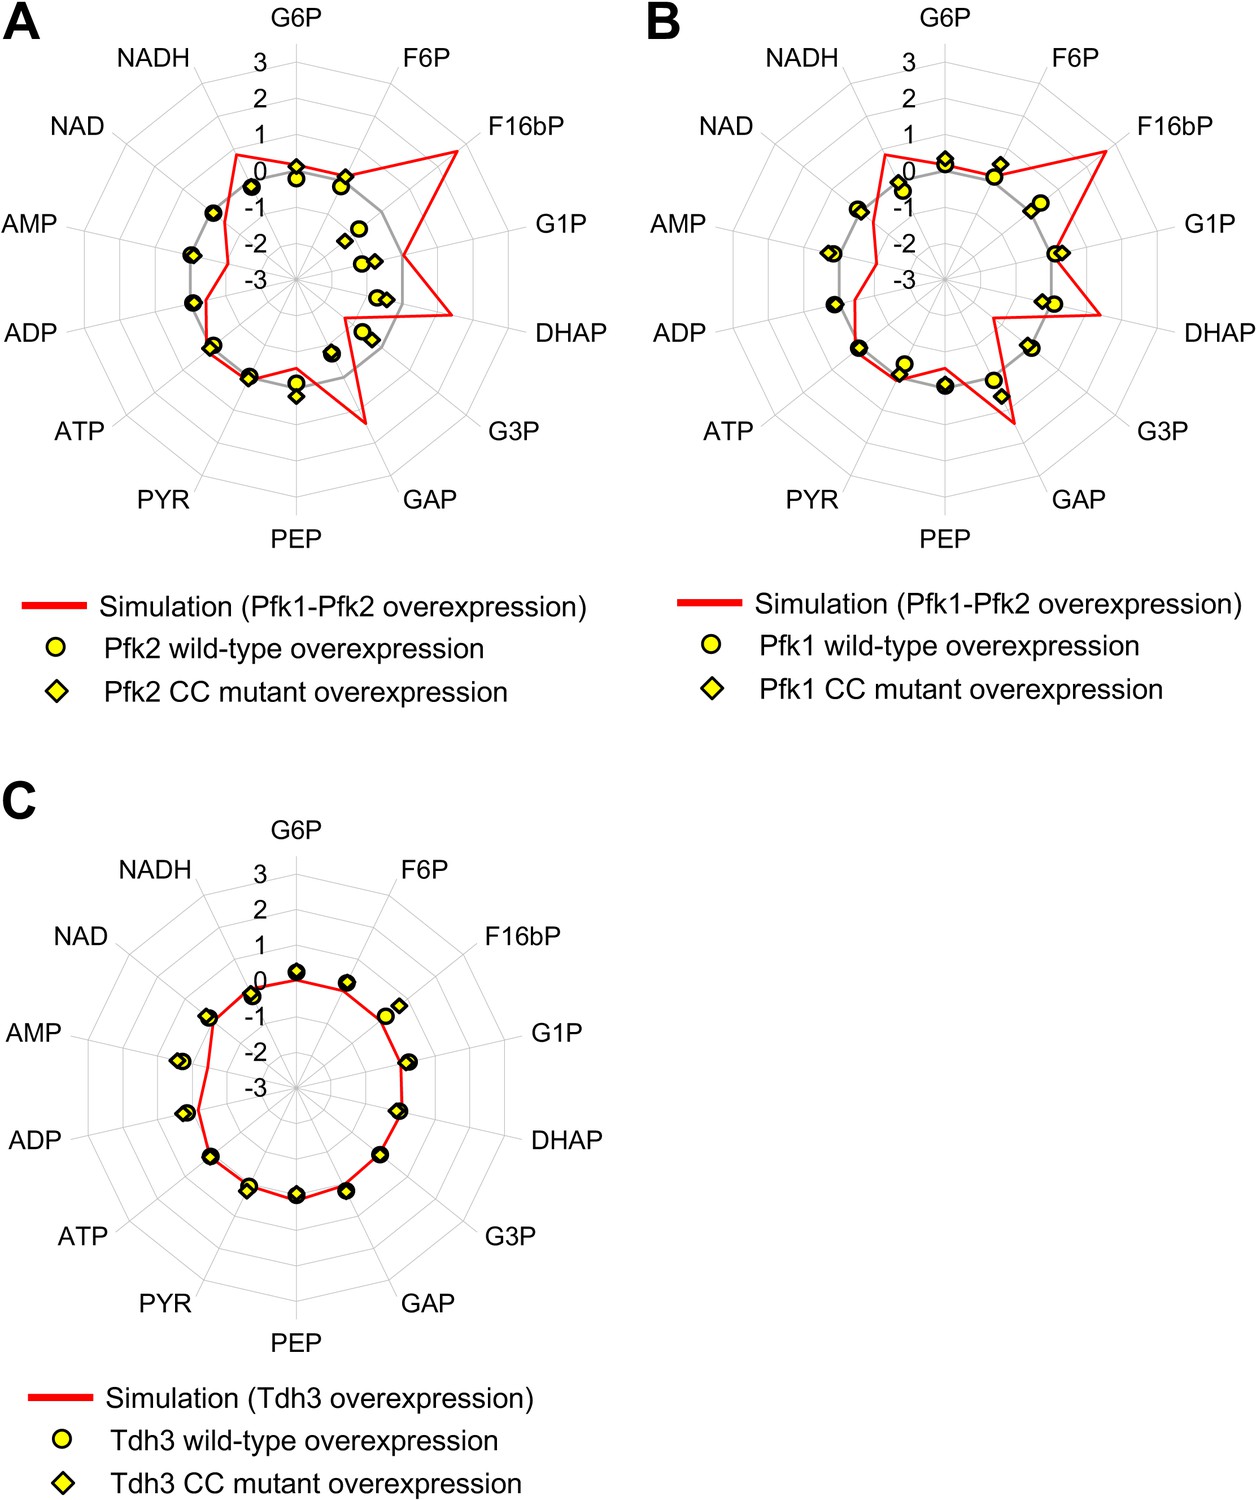
Comparison of metabolic changes triggered by overexpression of glycolytic proteins in silico and in vivo.
The line graph shows the simulation result, and the data are the same as those used in Figure 4. Circles and diamonds show the metabolic measurements in vivo, and the data are the same as those used in Figure 5.
Figure 6 with 1 supplement
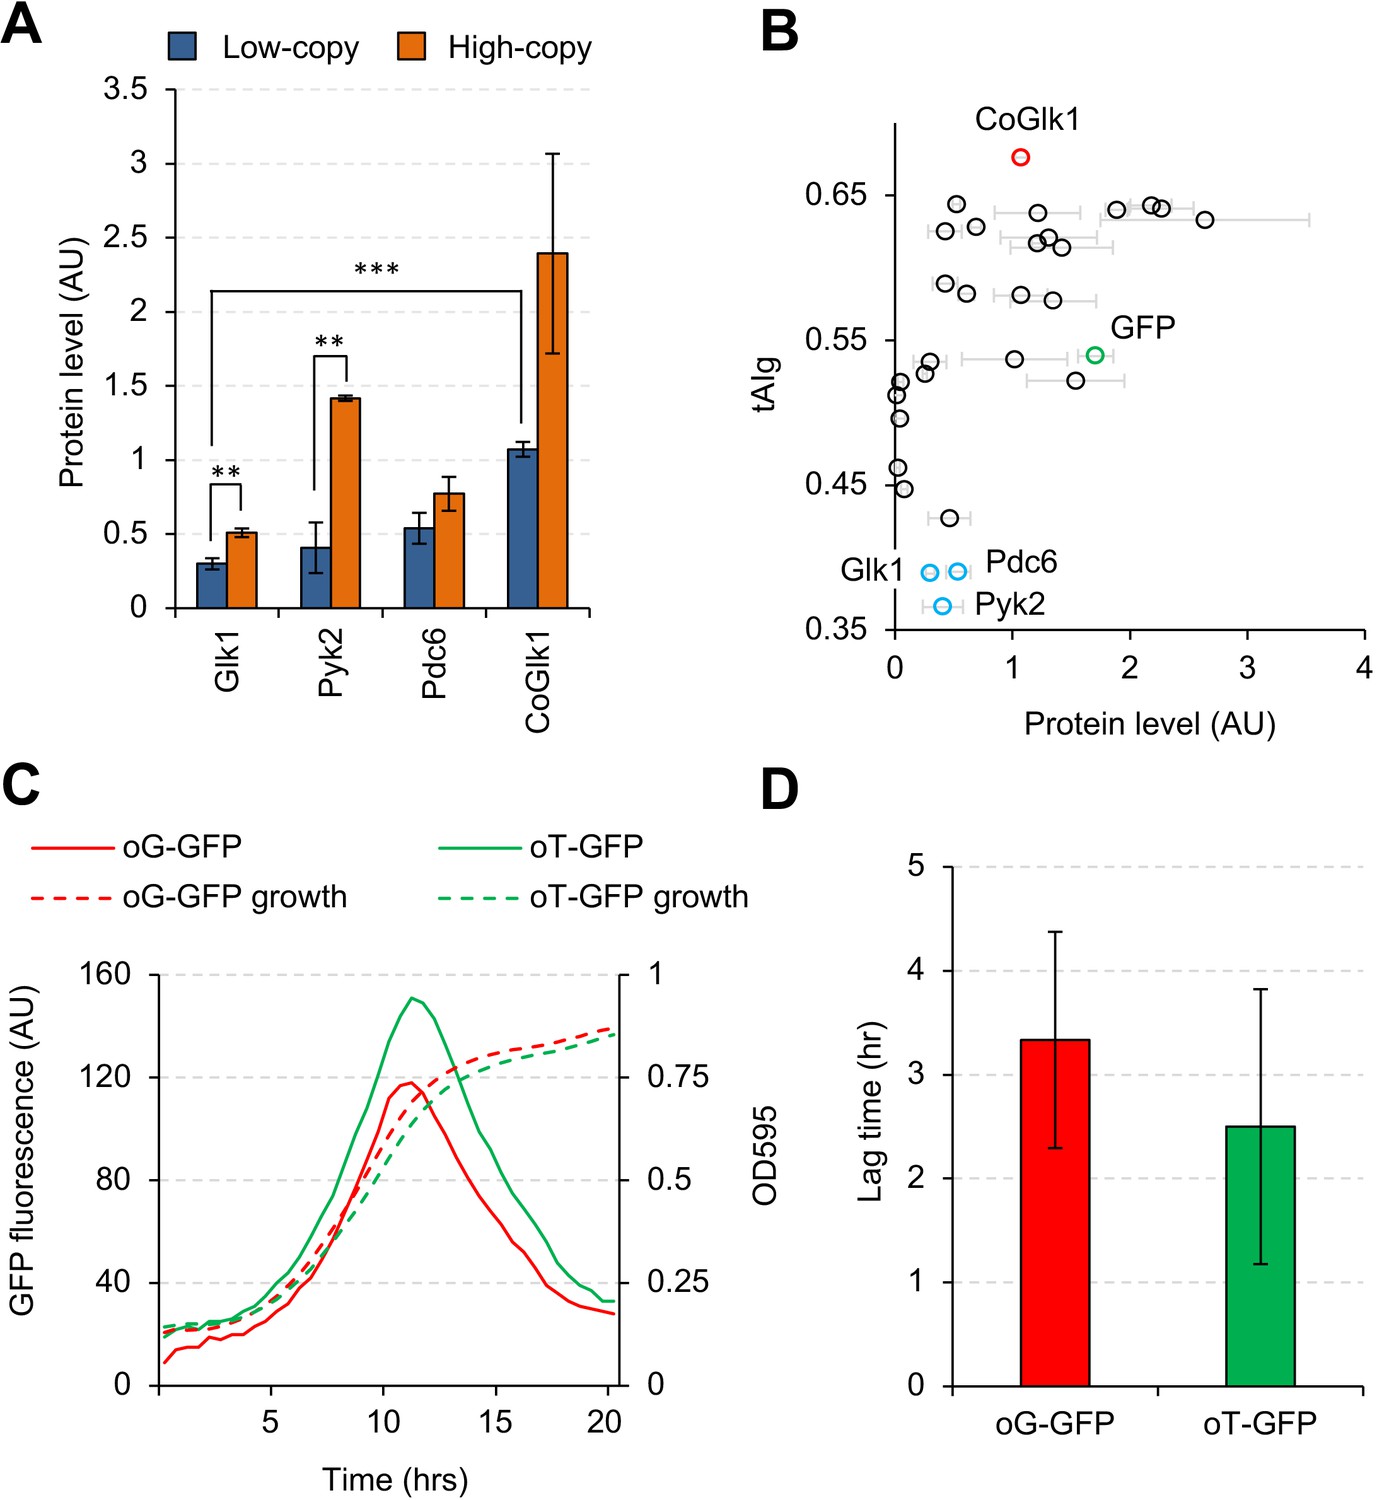
Codon usage affects the expression level, but not the synthesis timing, of Glk1.
(A) Expression levels of Glk1, Pyk2, Pdc6, and codon-optimized GLK1 (CoGlk1) in the indicated conditions. (B) Relationship between the tAIg and the expression level of each glycolytic protein in low-copy conditions. Protein level data are the same as those shown in Figure 2B. (C) Growth curves and GFP fluorescence of cells expressing codon-optimized GFPs. oG-GFP (tAIg = 0.40): a GFP gene whose codons were optimized for the GLK1 codon usage. oT-GFP (tAIg = 0.64): a GFP gene whose codons were optimized for the TDH3 codon usage. (D) Lag time between the timings with the maximum GFP fluorescence and the maximum growth rate. Timings of the maximum GFP fluorescence and the maximum growth rate are the time points with maximum second derivatives of GFP fluorescence and growth curves. The error bars indicate the standard deviations of the means. **p<0.01; ***p<0.001 in Welch's t-test.
-
Figure 6—source data 1
This spreadsheet contains all data and statistical values associated with the figure.
- https://doi.org/10.7554/eLife.34595.021
Figure 6—figure supplement 1
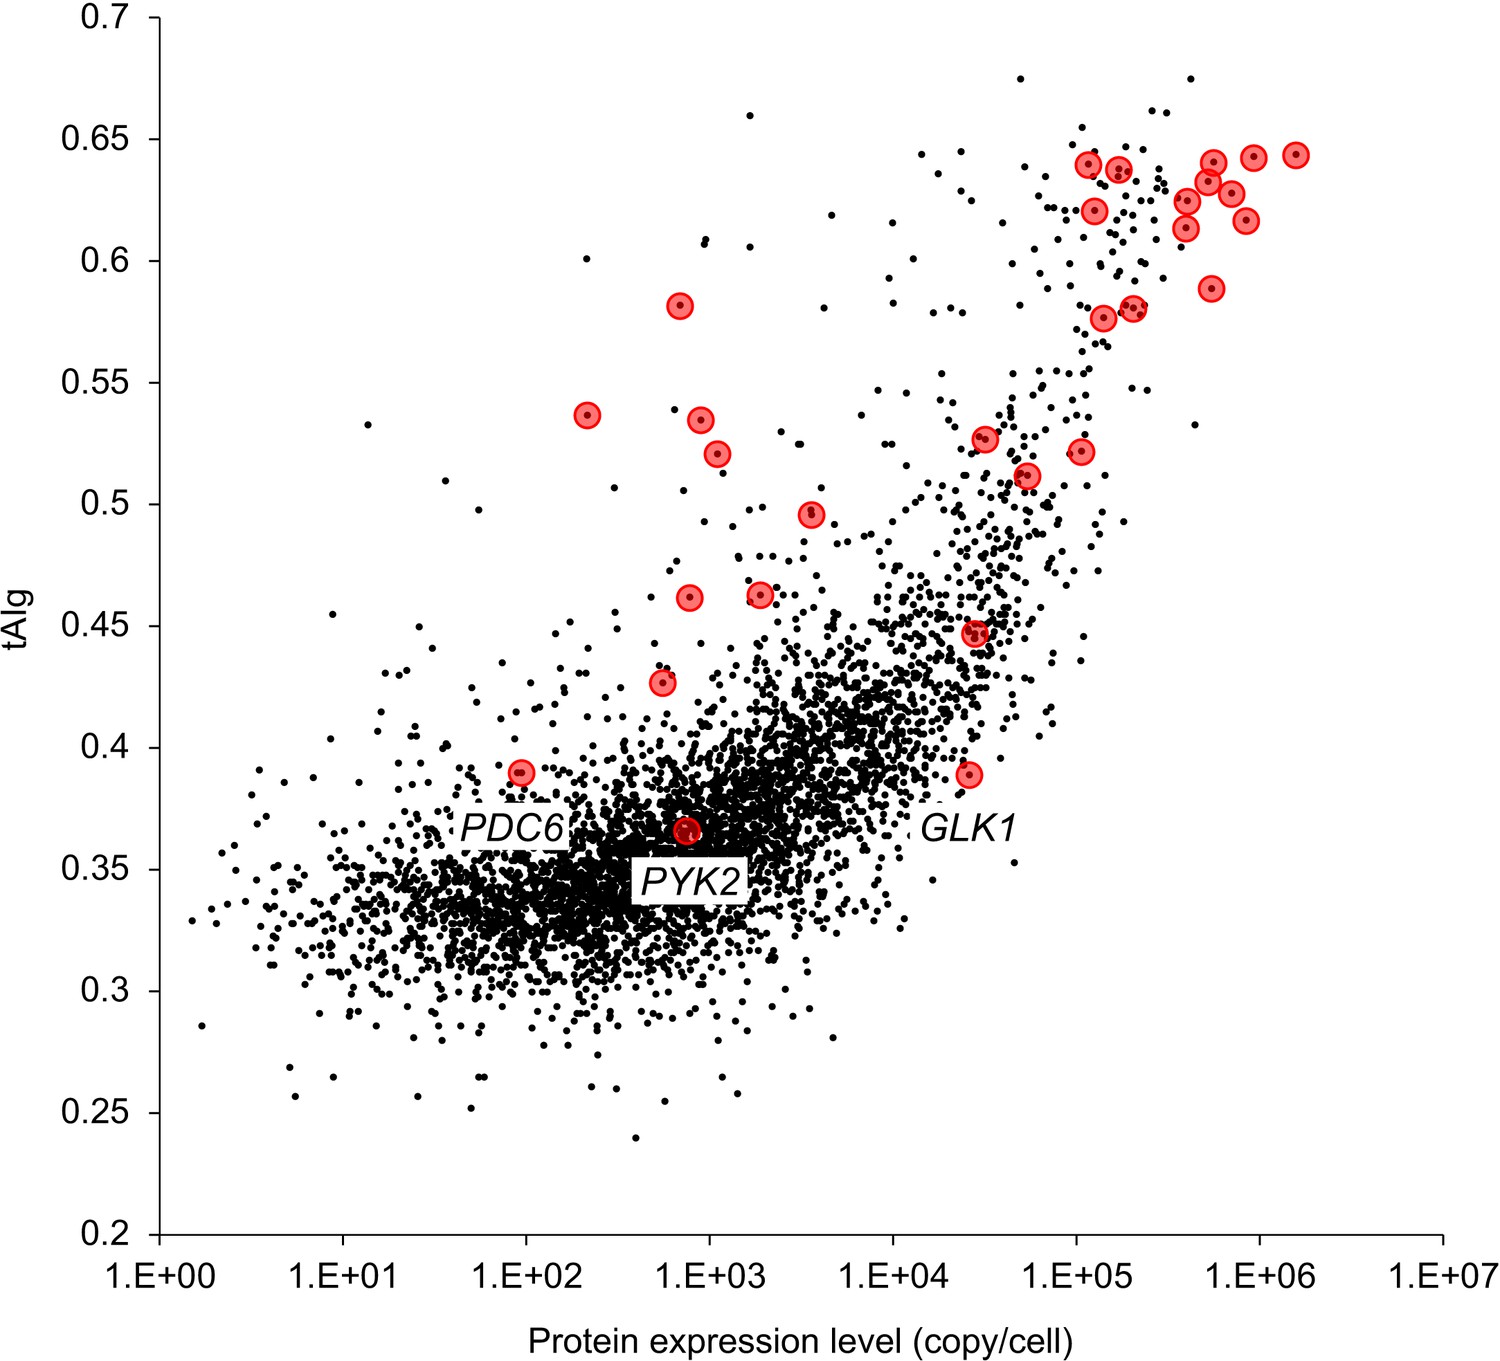
Scatter plot showing the tAIg and native expression level of S. cerevisiae protein.
The tAIg was calculated on the basis of the method described by Tuller et al. (2010). For the native expression level of S. cerevisiae protein, a published dataset was used (Kulak et al., 2014). Red points indicate glycolytic genes/proteins that are analyzed in this study. The tAIgs of all yeast proteins are listed in Figure 6—source data 1.
Figure 7 with 2 supplements
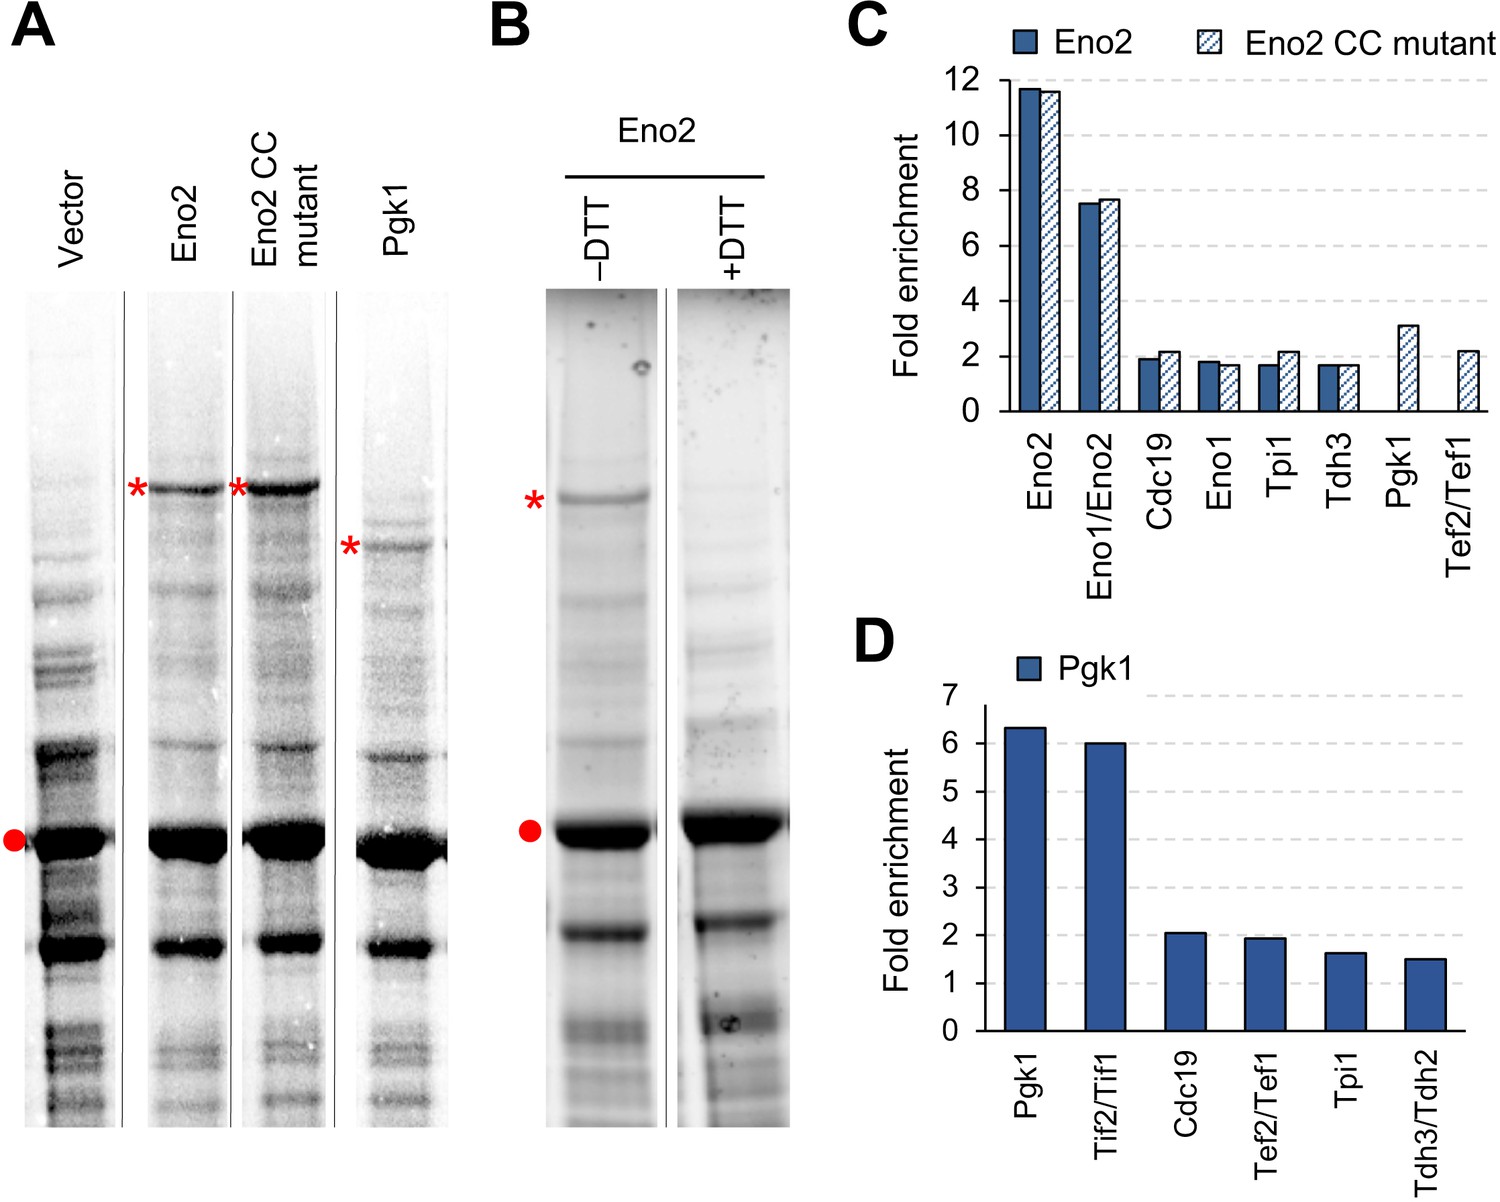
Overexpressed Eno2 and Pgk1 form protein aggregates.
(A) SDS-PAGE-separated total cellular proteins from cells overexpressing the indicated proteins. (B) SDS-PAGE-separated total cellular proteins from cells overexpressing Eno2 after treatment with (+) or without (–) the reducing agent DTT. (C and D) Enriched proteins in the high molecular bands from cells overexpressing the indicated proteins. Proteins enriched in the high molecular bands > 1.5-fold over the vector control are shown. Proteins were analyzed in low-copy conditions. The red point indicates the expected molecular weight of overexpressed proteins. The asterisk indicates the high-molecular-weight band specifically observed upon overexpression of each glycolytic protein. Gel images were contrasted so that high-molecular-weight bands were visible. CC mut.: catalytic center mutant.
-
Figure 7—source data 1
This spreadsheet contains all data and statistical values associated with the figure.
- https://doi.org/10.7554/eLife.34595.025
Figure 7—figure supplement 1
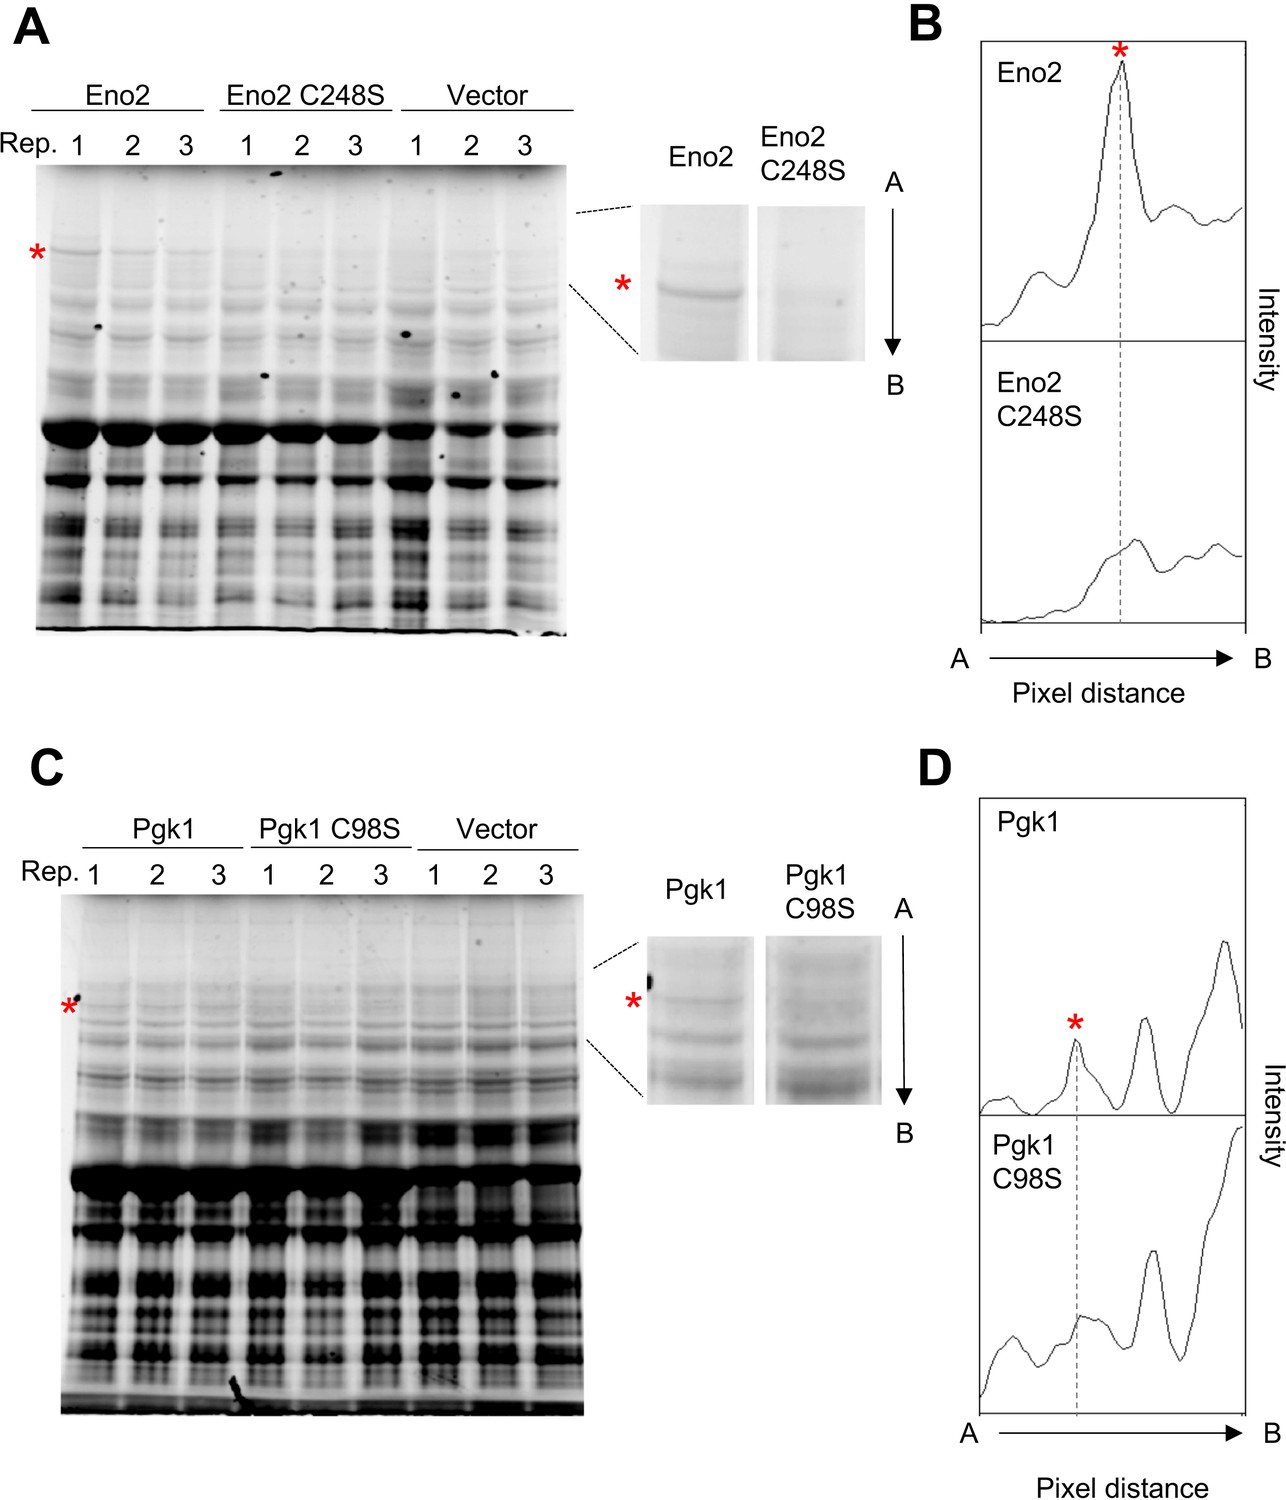
Aggregation of Eno2 and Pgk1 requires cysteine residues in Eno2 and Pgk1.
(A and C) SDS-PAGE-separated total proteins of cells overexpressing the indicated proteins. Three biological replicates for each experiment are shown. C248S: substitution of cysteine 248 to serine; C98S: substitution of cysteine 98 to serine. The arrow from A to B indicates the direction of the pixel intensity analysis shown in (B) and (D). (B and D) The pixel intensity analysis of the gel corresponding to the location containing the protein aggregate shown as the arrow between A and B. Image Quant TL software was used for the image analysis. The asterisk indicates the high-molecular-weight band specifically observed upon overexpression of each glycolytic protein.
Figure 7—figure supplement 2

Effect of cysteine substitutions on the expression levels of Eno2 and Pgk1.
C248S: substitution of cysteine 248 with serine; C98S: substitution of cysteine 98 to serine. Proteins were analyzed in low-copy conditions.
Figure 8
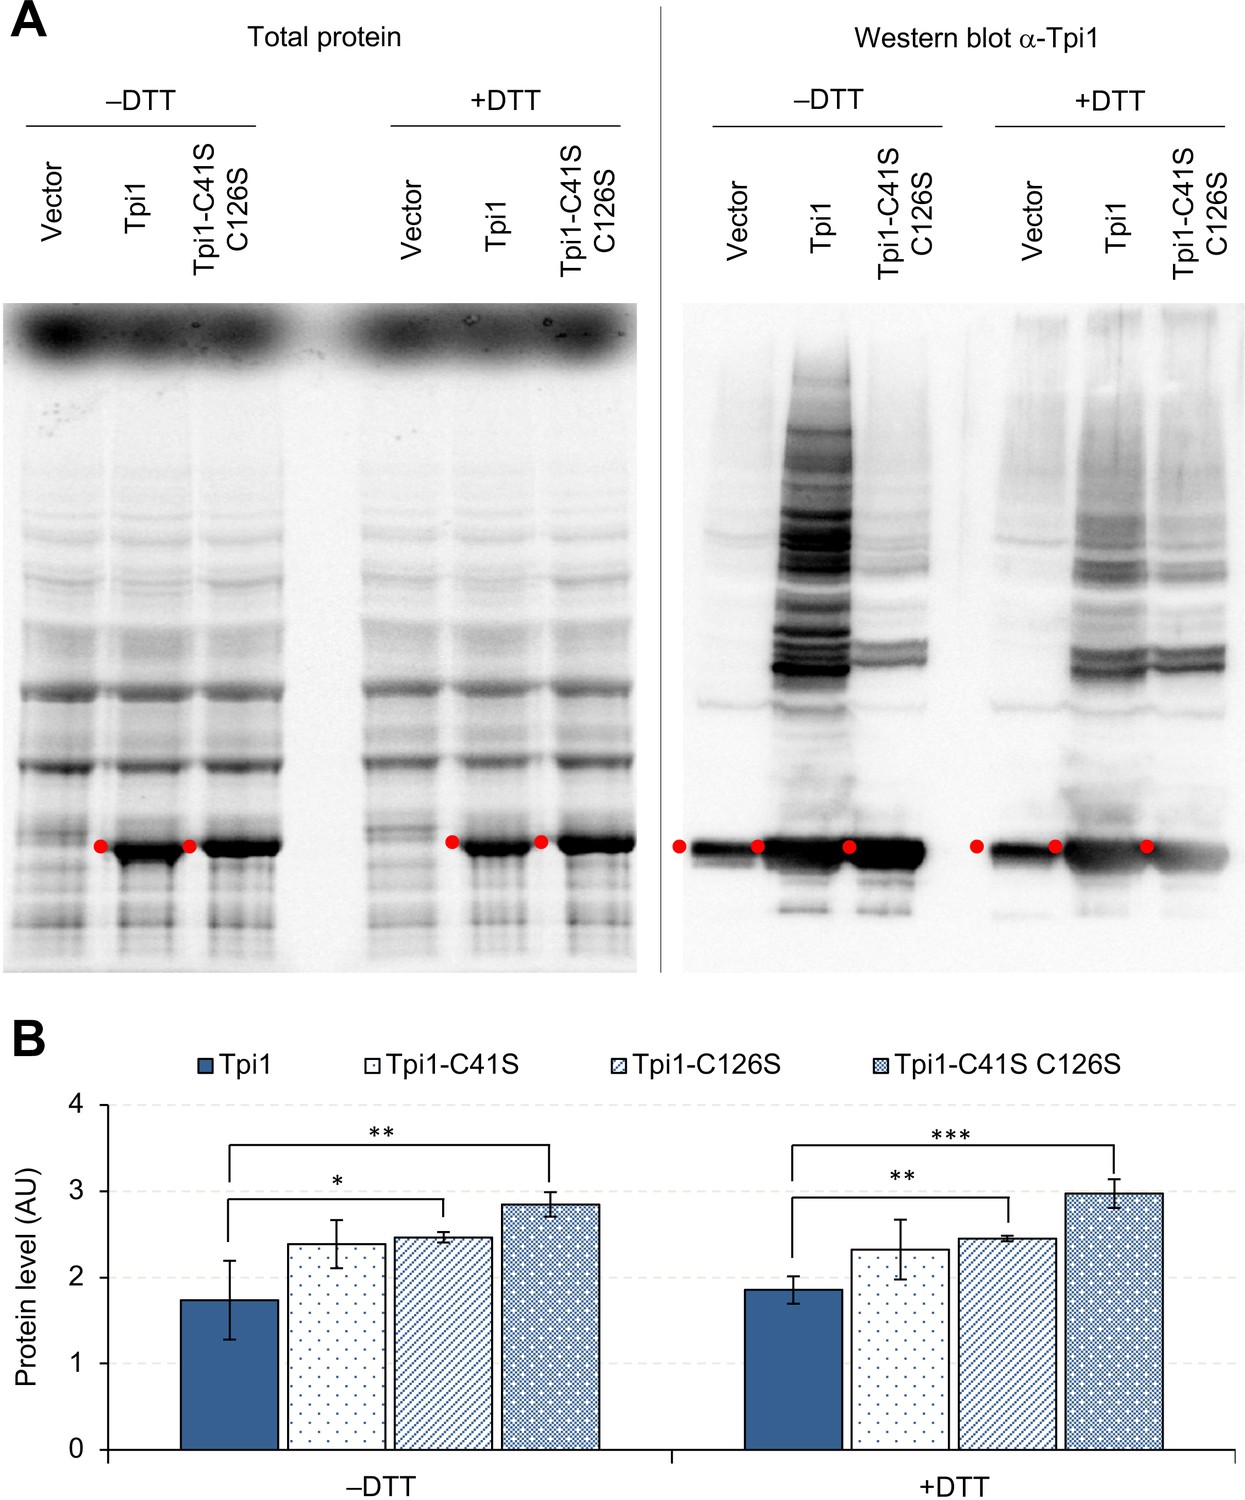
Overexpressed Tpi1 forms protein aggregates.
(A) SDS-PAGE-separated total proteins from cells overexpressing indicated proteins, and their Western blot imaging using anti-Tpi1 antibodies. The red points indicate the expected molecular weight of overexpressed proteins. (B) Effect of cysteine substitutions on the expression level of Tpi1. *p<0.05; **p<0.01; ***p<0.001 in Welch's t-test. C41S: substitution of cysteine 41 to serine; C126S: substitution of cysteine 126 to serine. Proteins were analyzed in low-copy conditions.
-
Figure 8—source data 1
This spreadsheet contains all data and statistical values associated with the figure.
- https://doi.org/10.7554/eLife.34595.027
Additional files
-
Supplementary file 1
Summary table showing analyzed glycolytic proteins, their characteristics, analysis types, quantitative interpretation of the results, and proposed mechanisms to restrict expression limits of glycolytic proteins.
- https://doi.org/10.7554/eLife.34595.028
-
Supplementary file 2
Key resources table.
- https://doi.org/10.7554/eLife.34595.029
-
Transparent reporting form
- https://doi.org/10.7554/eLife.34595.030
Download links
A two-part list of links to download the article, or parts of the article, in various formats.
Downloads (link to download the article as PDF)
Open citations (links to open the citations from this article in various online reference manager services)
Cite this article (links to download the citations from this article in formats compatible with various reference manager tools)
Estimating the protein burden limit of yeast cells by measuring the expression limits of glycolytic proteins
eLife 7:e34595.
https://doi.org/10.7554/eLife.34595


