Value generalization in human avoidance learning
- University of Cambridge, United Kingdom
- National Institute of Information and Communications Technology, Japan
Figures
Figure 1 with 3 supplements
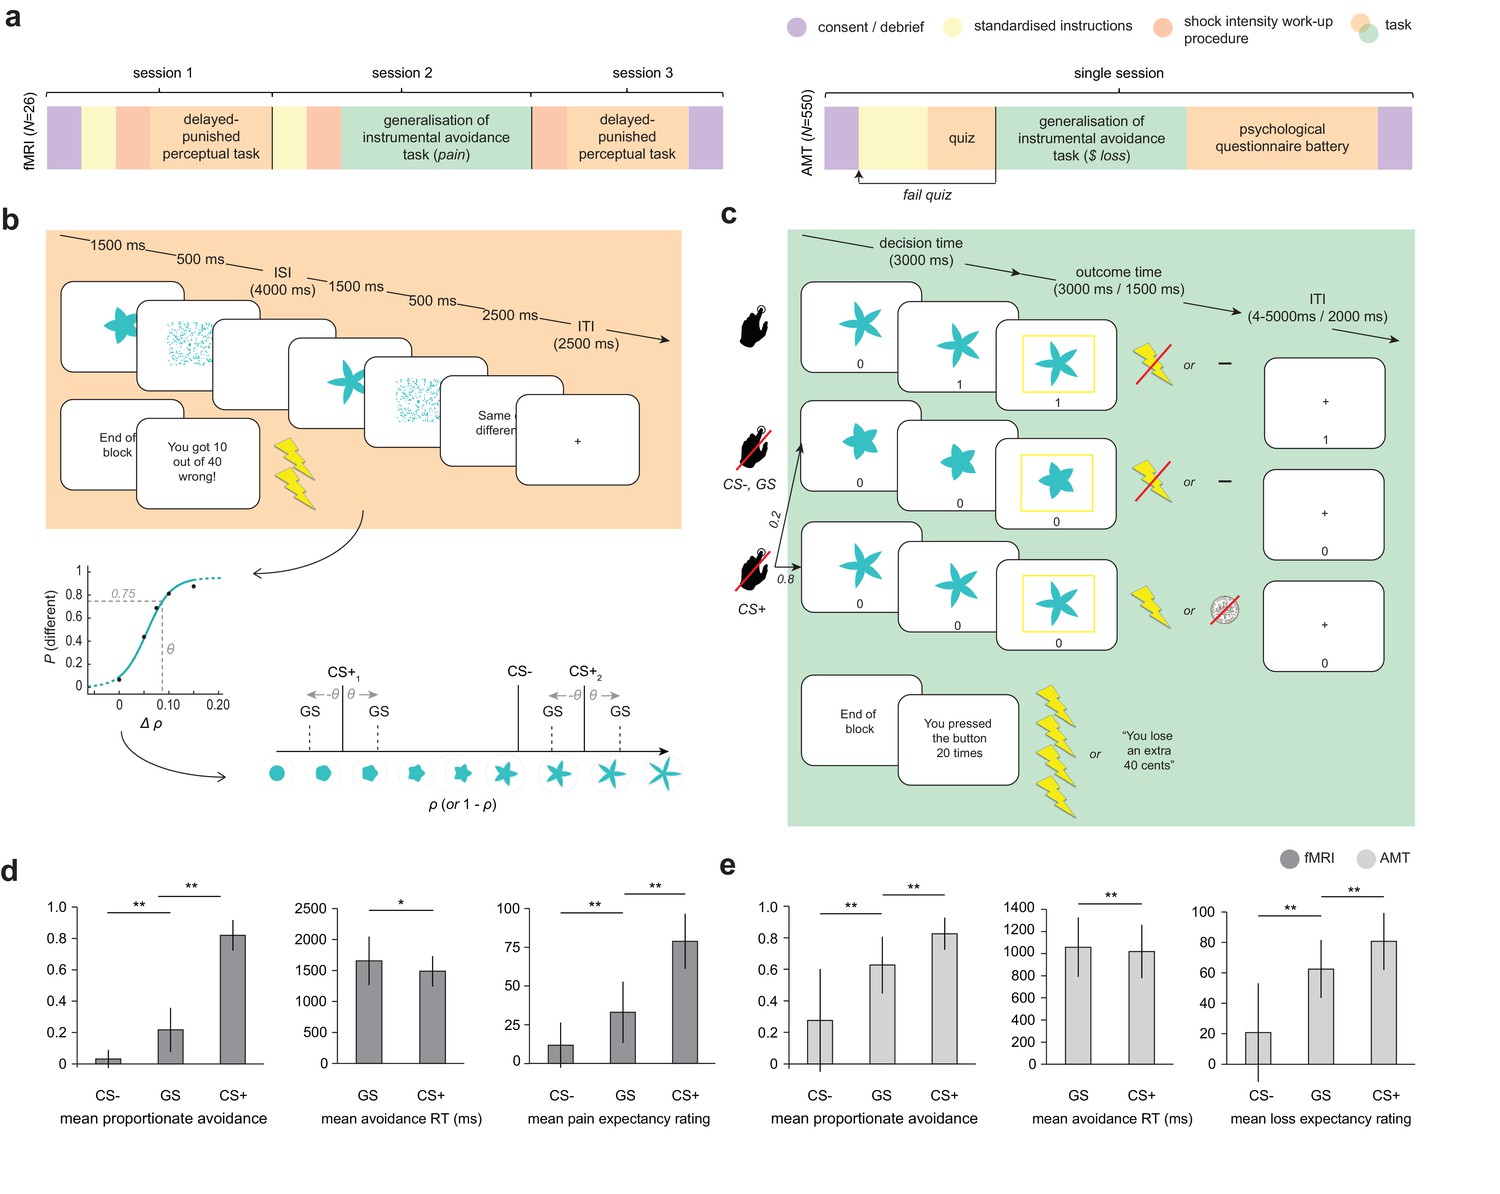
Study design and overall behaviour summary.
(a) Study design and protocol for the two participant groups; fMRI, laboratory and functional imaging sample; AMT, Amazon Mechanical Turk (web-based) sample. (b) Delayed-punished perceptual task, used to determine 75% reliably perceptually distinguishable generalization stimuli (GSs) on in individual basis for the generalization of instrumental avoidance task (c) in the fMRI sample (in the AMT sample, GSs were generated based on mean perceptual acuity determined in pilot testing). (d) Summary of behaviour on the generalization task in fMRI and (e) AMT samples. ISI, inter-stimulus interval; ITI, inter-trial interval; CS+, conditioned stimulus with pain or loss outcome, CS-, conditioned stimulus with neutral outcome (no pain or loss). Error bars represent SD. *p=0.006, **p<0.001, paired sample t-tests.
Figure 1—figure supplement 1
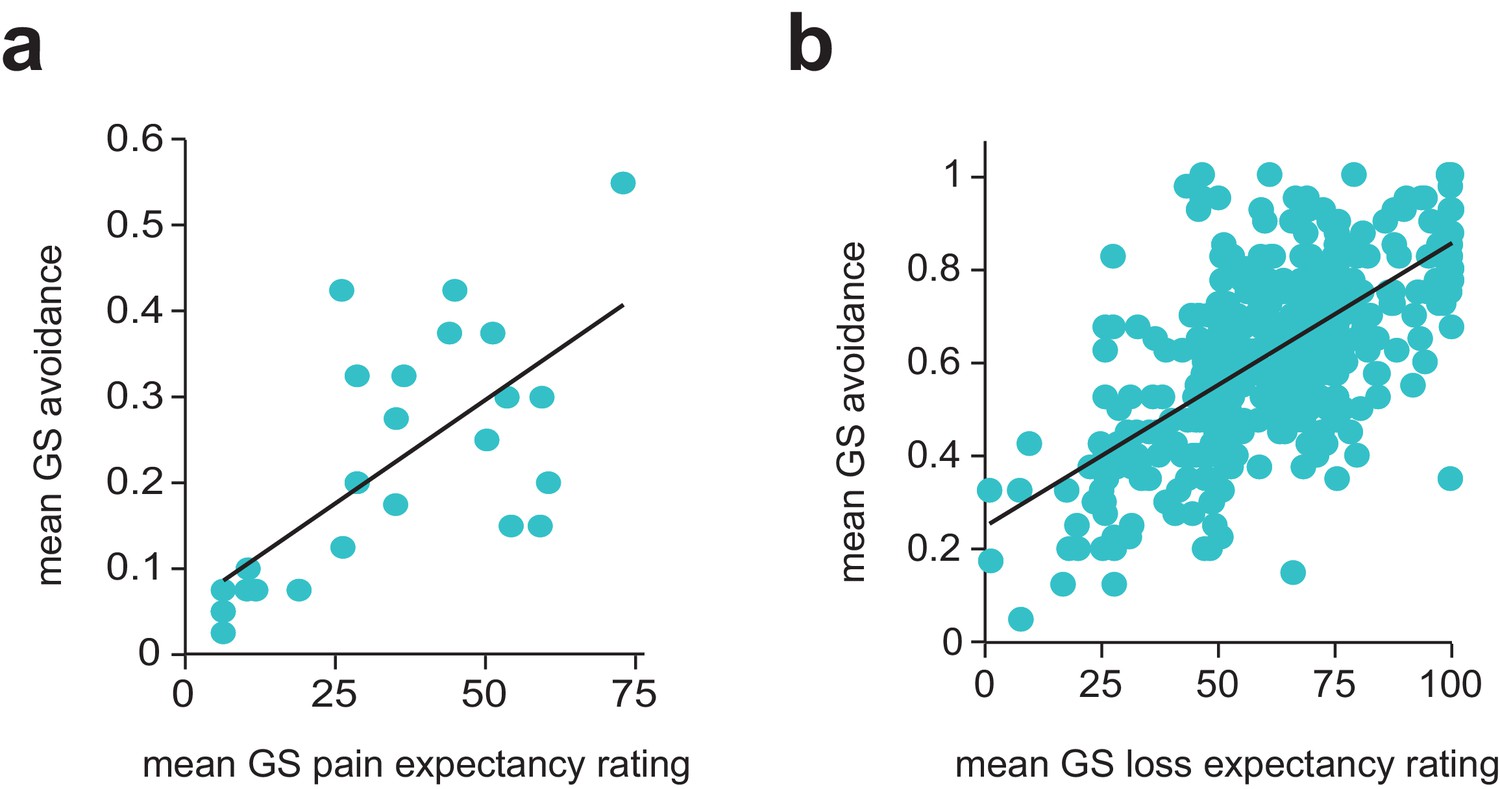
Relationship between mean avoidance on generalization stimulus (GS) trials during the generalization of instrumental avoidance task, and mean post-task visual analogue scale pain/loss expectancy ratings.
(a) fMRI, (b) AMT, samples (Spearman’s ρ = 0.692, 0.641, respectively).
Figure 1—figure supplement 2
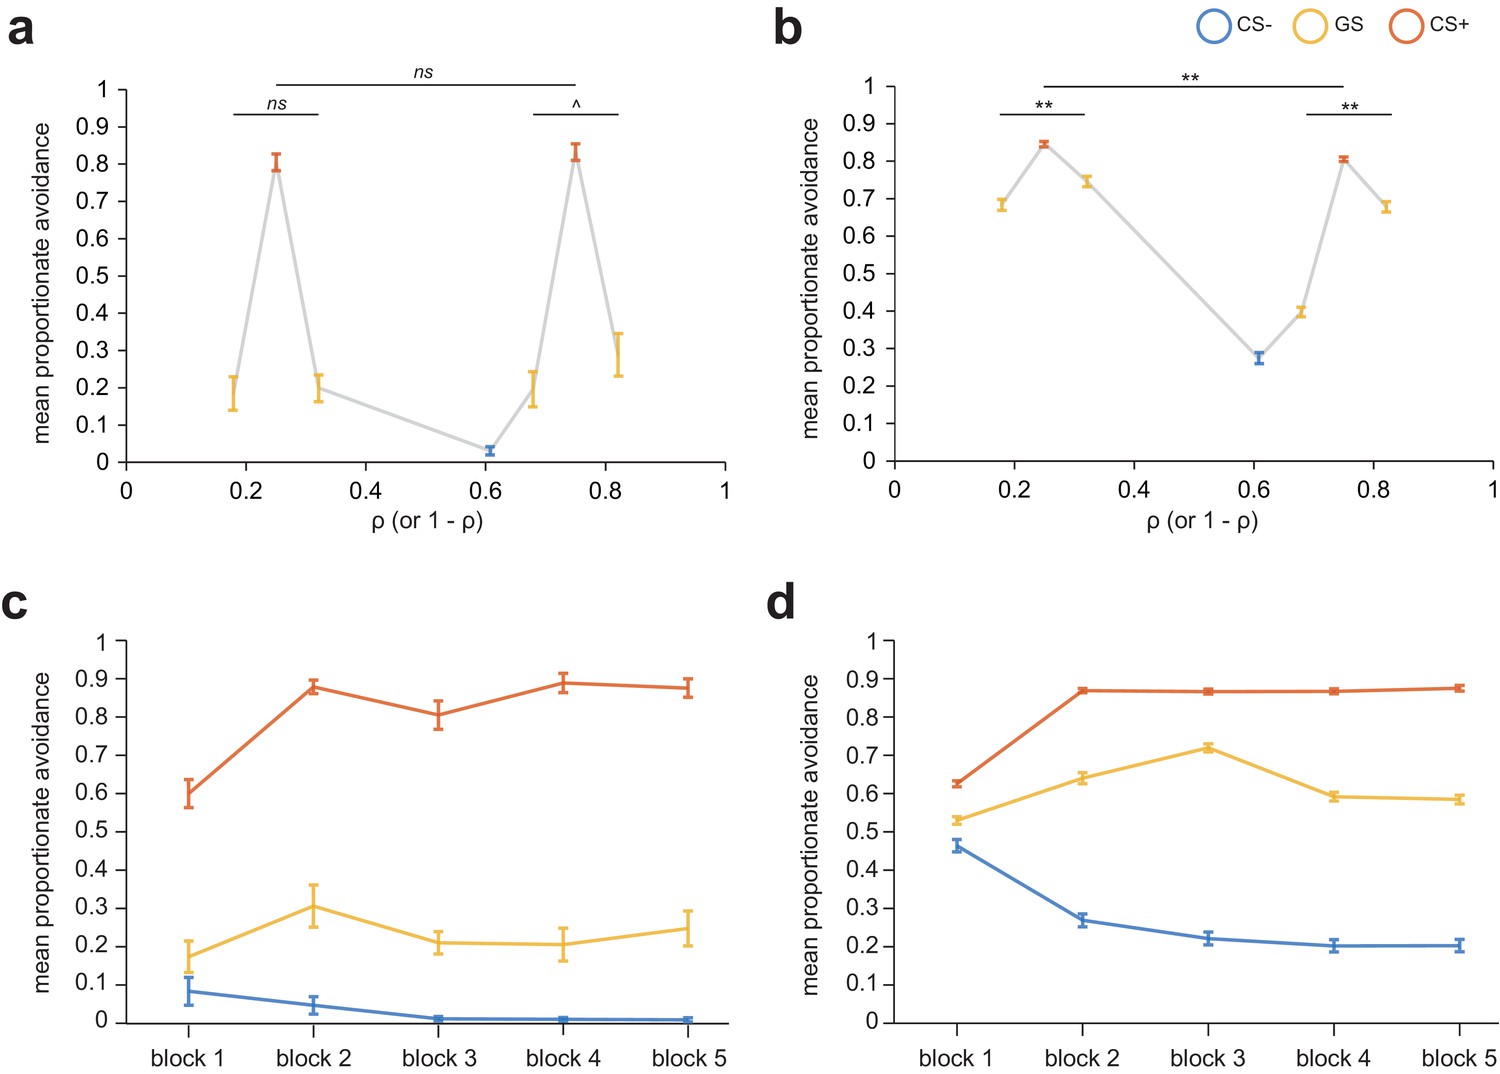
Proportionate avoidance for individiual task stimuli (top row) and by CS type and block number (bottom row) for the generalization of instrumental avoidance task.
(a) fMRI, (b) AMT, samples. ns, p>0.3. ^p=0.19, **p<0.001, repeated-measures ANOVA for differences in mean avoidance across generalization stimuli (GSs). (c) fRMI, (d) AMT, samples. Error bars represent standard error.
Figure 1—figure supplement 3
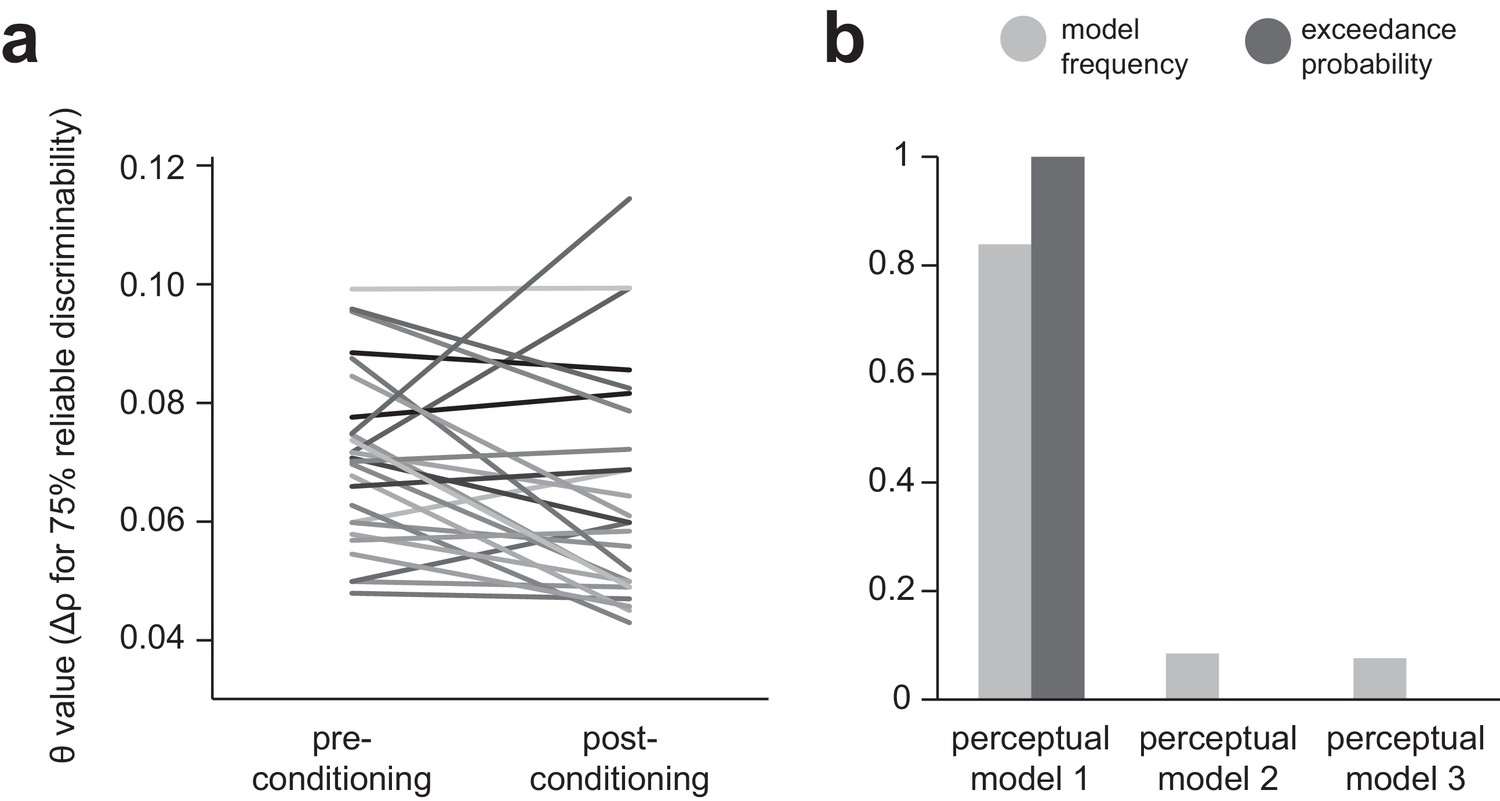
Effects of conditioning on perceptual acuity for task stimuli.
(a) Changes in perceptual acuity as measured by the delayed-punished perceptual task, before and after conditioning (performance of the generalization of instrumental avoidance task), for each participant in the fMRI group. θ, change in stimulus ‘spikiness’ parameter ρ required to identify a shape as different on 75% of trials. (b) Results of Bayesian model comparison carried out to determine the best model of participants’ perceptual performance during the generalization of instrumental avoidance task. Model 1, a perceptual-only generalization model in which perceptual discriminability of GSs is fixed at 75%. Model 2, a perceptual-only generalization model in which perceptual discriminability of GSs is fixed at the value determined by the post-conditioning acuity test. Model 3, a perceptual-only generalization model in which GS discriminability changes linearly from the pre to post-conditioning derived value, over the course of the task. Model frequency, proportion of participants for whom a model was the best model; exceedance probability, probability that the model in question is the most frequently utilized in the population.
Figure 2
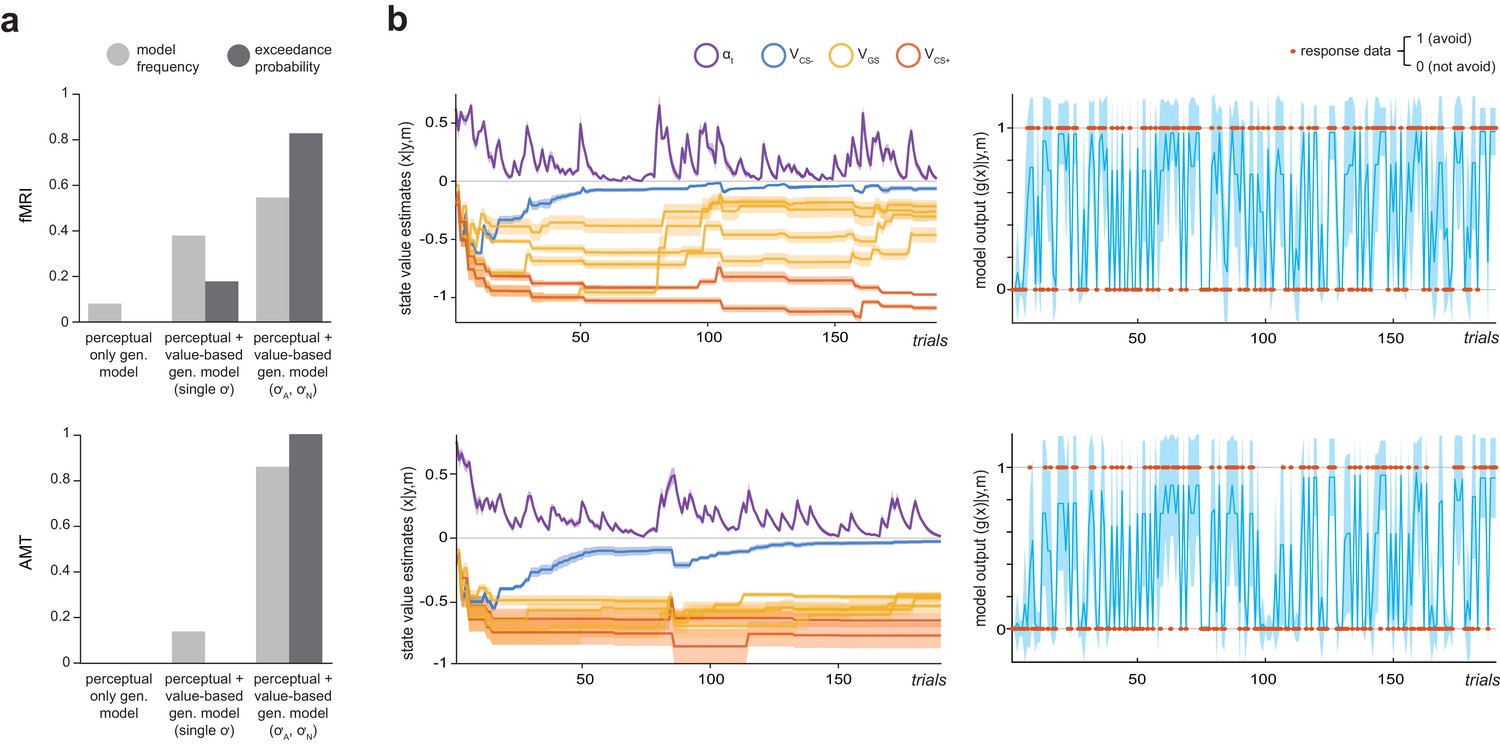
Computational modelling of instrumental avoidance behaviour.
(a) Results of random-effects Bayesian model comparison for the laboratory (fMRI) and online (AMT) samples. For both groups, the best model was one that implemented both perceptual and additional value-based generalization between stimuli, with separate parameters governing width of generalization from aversive (σA) and neutral (σN) feedback. Model frequency, proportion of participants for whom a model was the best model; exceedance probability, probability that the model in question is the most frequently utilized in the population. (b) Ilustration of posterior state value estimates (x: the value of not avoiding for each CS, VCS, plus the trial-varying learning rate, αt) and model output (g(x)) for the winning model (m) for a lower generalizing participant (top row) and higher generalizing participant (bottom row) from the fMRI group. Orange dots on the right hand side panels illustrate actual response data (y) on each trial. Shading represents variance of the posterior density.
Figure 3
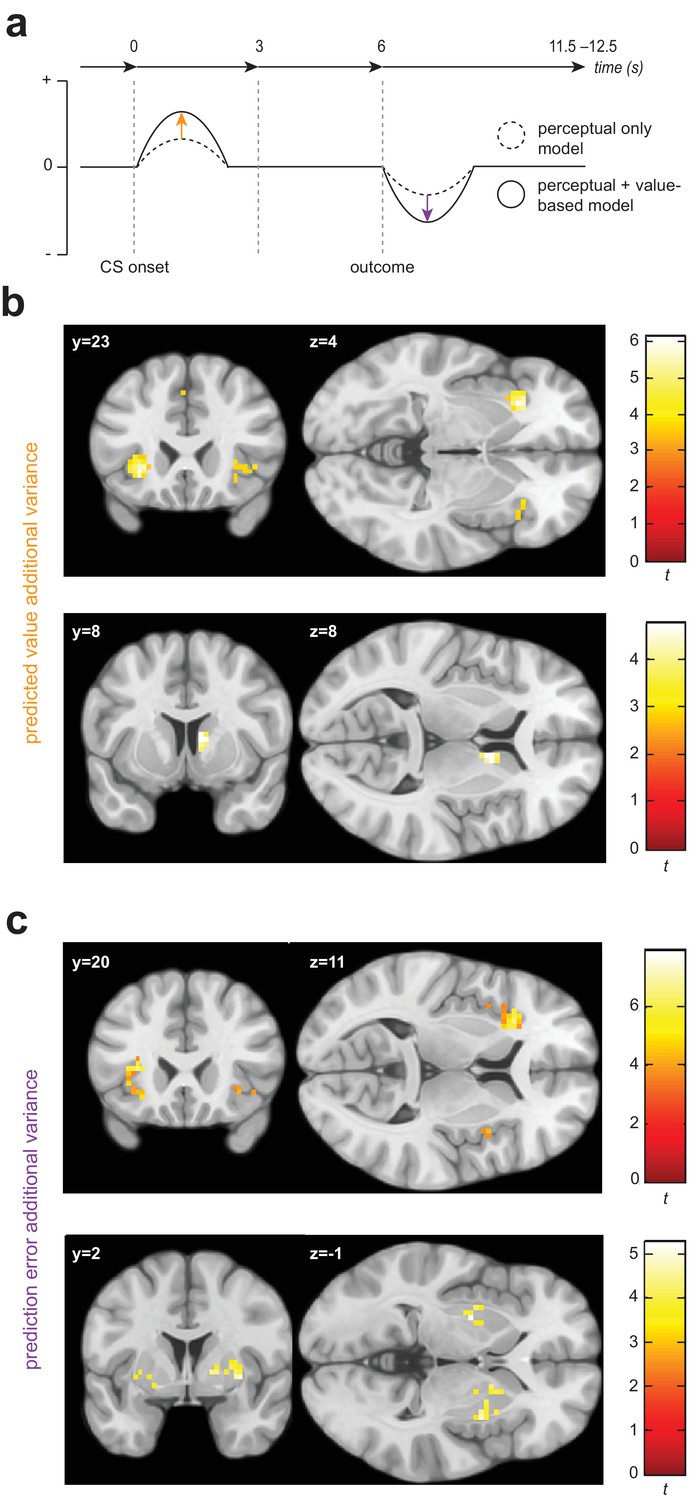
Univariate statistical maps highlight brain regions where changes in BOLD signal is significantly related to trial-by-trial variance in internal model quantities from the value-based generalization model, over and above that which can be explained by a purely perceptual account.
(a) Schematic of a single trial for the fMRI group, showing the difference in estimated probability of receiving a shock (if no avoidance response is made) and outcome prediction error, as derived from the perceptual only vs the perceptual + additional value-based generalization models. (b) Significant encoding of additional value-based generalization in the expected value of each stimulus (likelihood of receiving a painful shock if no avoidance response is made), at the time of stimulus onset in the anterior insula and right caudate. (c) Significant encoding of additional value-based generalization as expressed in prediction error magnitude at the time of outcome receipt in the anterior insula, putamen, and right pallidum. Colour map shading represents t values.
Figure 4 with 1 supplement
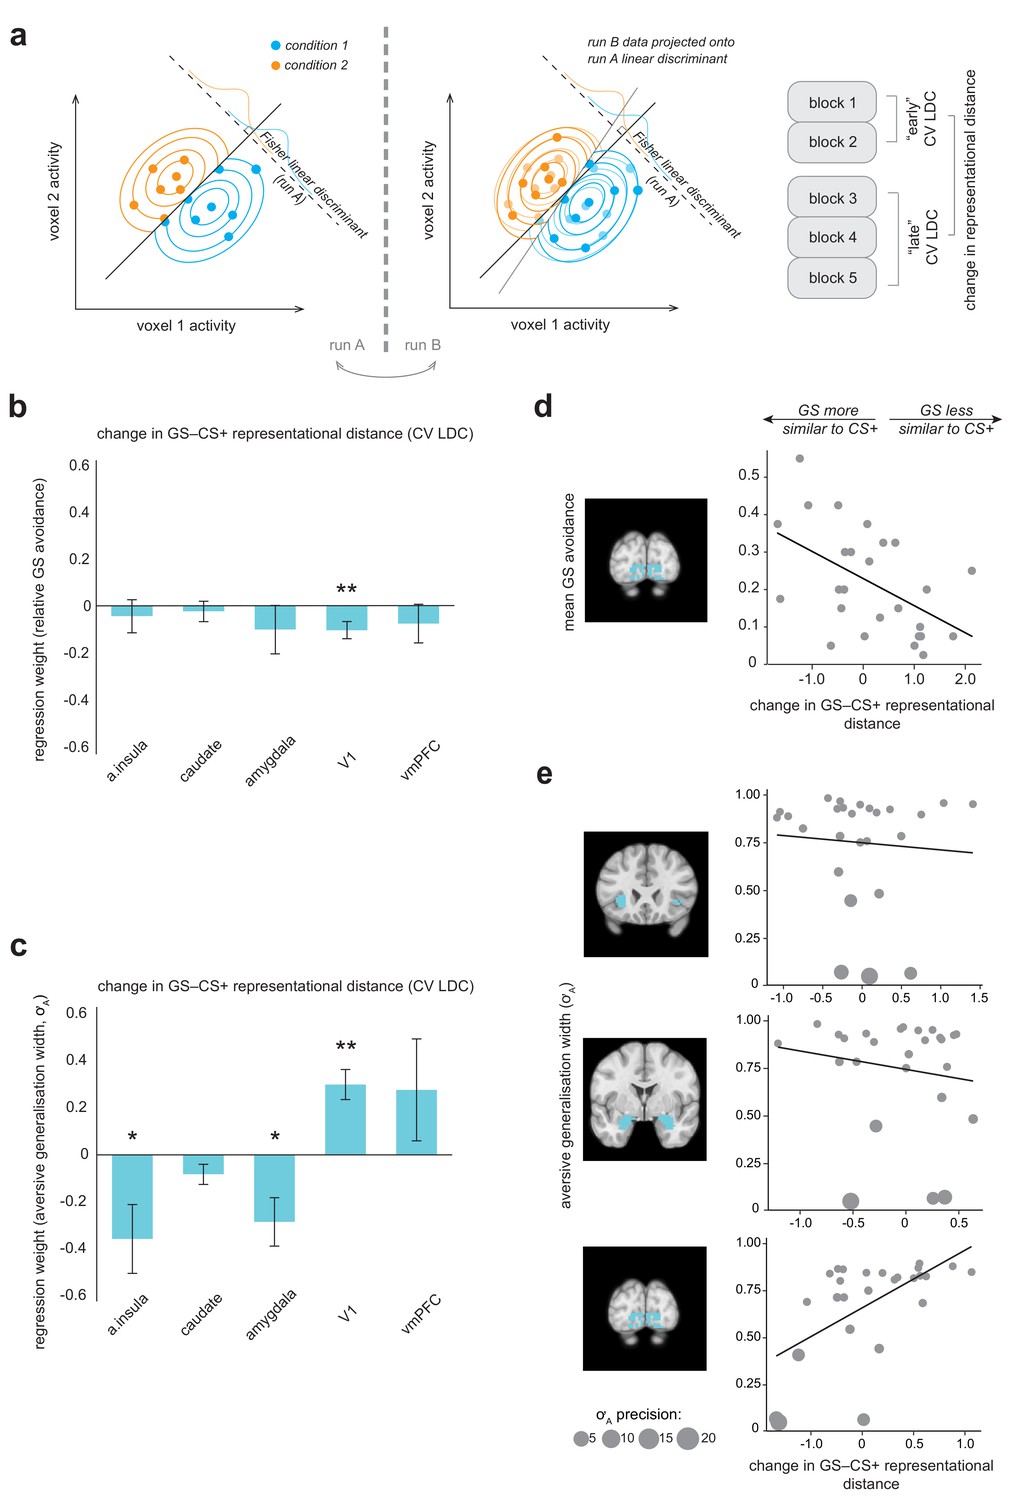
Multivariate fMRI results highlight regions where change in representational geometry over the course of the task between generalization stimuli (GSs) and pain-associated stimuli (CS+s) is related to individual differences in overall GS avoidance and the model parameter governing width of generalization from aversive feedback (σA).
(a) Schematic of linear discriminant contrast analysis (based on [Kriegeskorte et al., 2007]). Within cross-validation folds, data from one imaging run is projected onto the optimal decision boundary derived from other runs, in order to remove inflation by noise in the final distance estimate (obtained by averaging across folds). (b) Multiple regression models detailing how changes in representational (dis)similarity over the course of the task in each ROI relate to overall relative avoidance on generalization trials, and (c) to individual differences in the model parameter governing width of generalization from aversive feedback. Error bars represent standard error. (d) Visualisation of bivariate relationships between change in representational geometry and raw GS avoidance (in primary visual cortex), and (e) between change in representational geometry and individual σA values (in the anterior insula, amygdala, and V1), weighted by individual parameter estimate precision (1/posterior variance). Larger bubble size represents greater precision (and therefore higher regression weight). Light blue shading on structural images illustrates the ROI volumes data were extracted from in each case. CV LDC, leave-one-out cross-validated linear discriminant contrast; a insula, anterior insula; vmPFC, ventromedial prefontal cortex. *p<0.05, **p<0.01.
Figure 4—figure supplement 1
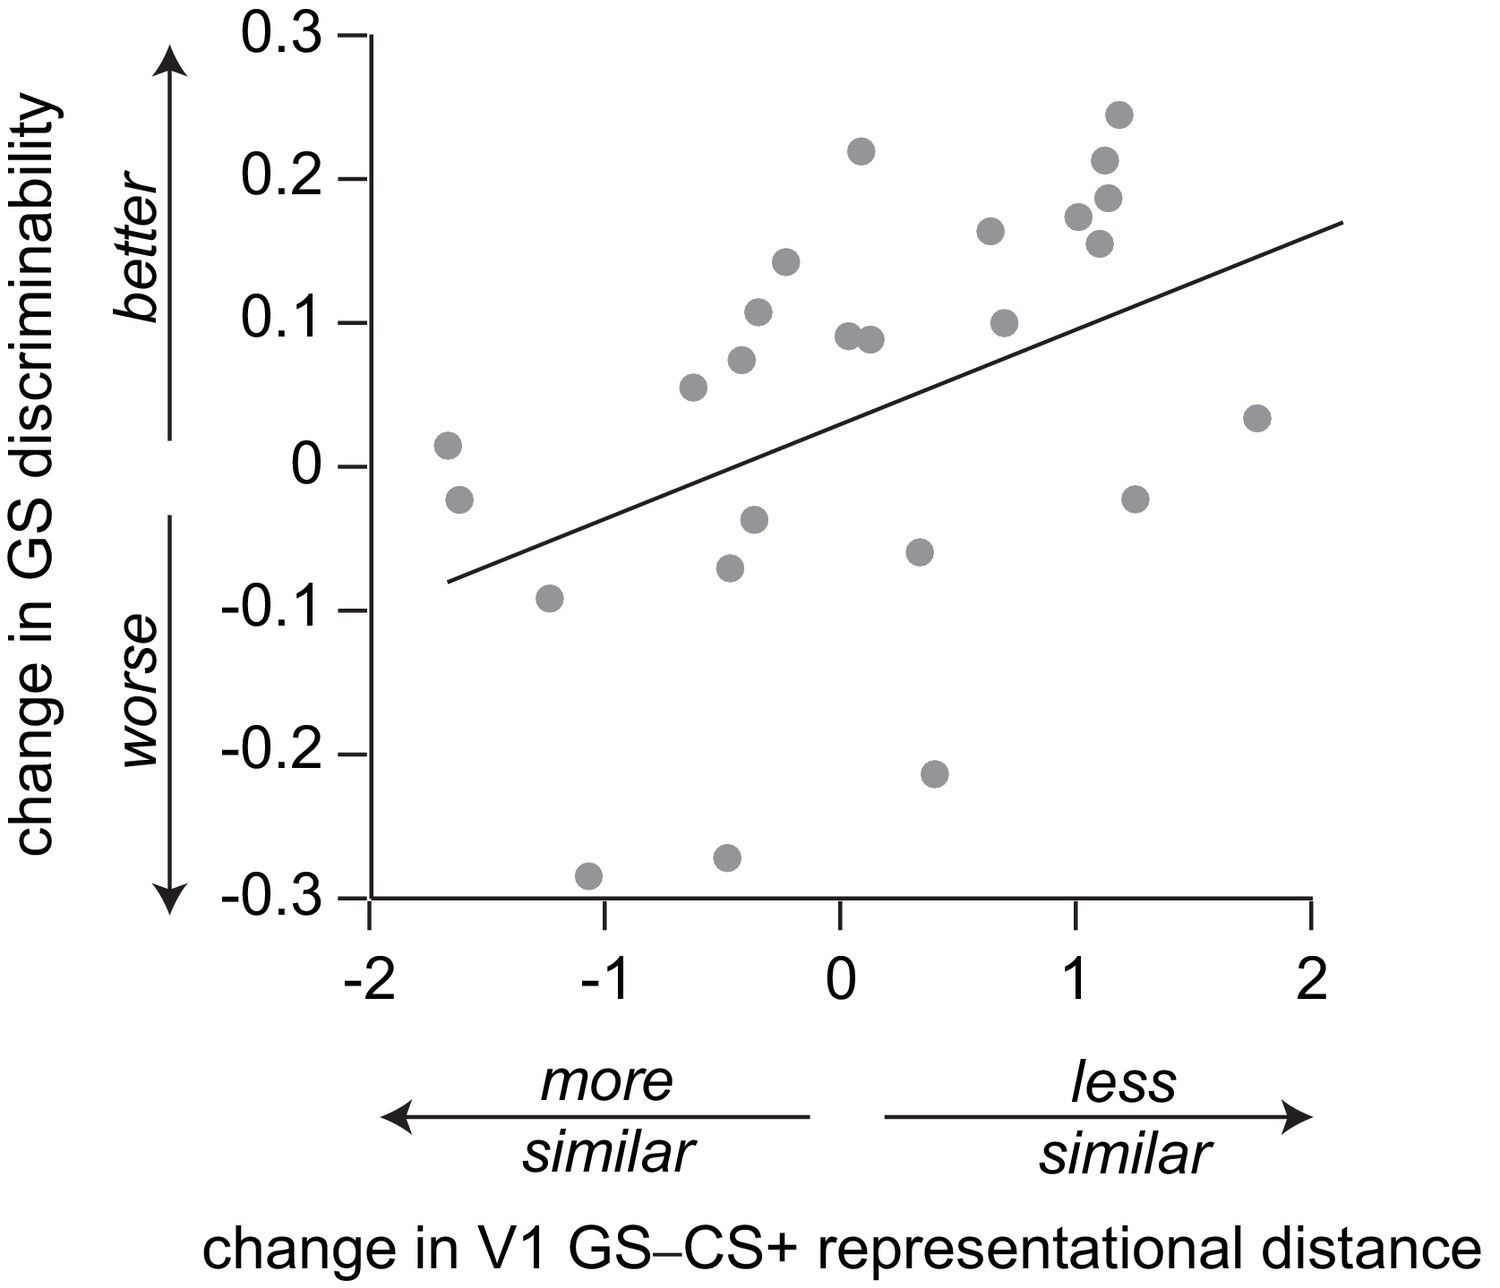
Relationship between change in stimulus discriminability, pre vs post-conditioning, and change in GS−CS+ representational distance (CV LDC) in the primary visual cortex (V1) over the course of the generalization task.
Pre-conditioning (day 1 testing), discriminability for target stimulus ± θ was 0.75 (75% correct difference judgments), by definition. Post-conditioning (day 3 testing), mean discriminability for target ± θ was 0.79 (SD 0.14).
Figure 5

Associations between individual differences in aversive generalization and psychological symptom scores.
(a) Percentage change in the model parameter governing width of generalization from aversive feedback (σA) with a one standard deviation increase in total score on each individual questionnaire measure used (individual regression models). (b) Scree plot indicating results of a factor analysis in which all response items from these measures (N = 142) were entered (inset, first 20 factors). A three-factor solution (lighter shaded bars) was indicated as the most parsimonious structure. (c) Percentage change in σA with an increase in 1 SD for each of the factor analysis-derived symptom scores (single regression model). The right hand panel shows the top three loading items for each factor, which were used to derive factor labels. Error bars represent standard error. **p≤0.009.
Tables
Table 1
Changes in representational distance (cross-validated LDC) with conditioning: relationship to overall generalization stimulus (GS) avoidance.
https://doi.org/10.7554/eLife.34779.011| Change in GS–CS+ representational distance | β | SE | t | p |
|---|---|---|---|---|
| a. insula | −0.04287 | 0.06798 | −0.631 | 0.535 |
| caudate | −0.02304 | 0.04173 | −0.552 | 0.587 |
| amygdala | −0.09792 | 0.09905 | −0.989 | 0.335 |
| V1 | −0.10072 | 0.03531 | −2.852 | 0.010* |
| vmPFC | −0.07407 | 0.07938 | −0.933 | 0.362 |
Table 2
Changes in representational distance (cross-validated LDC) with conditioning: relationship to model parameter governing width of generalization from aversive feedback (σA). a. insula, anterior insula; vmPFC, ventromedial prefrontal cortex; V1, primary visual cortex; SE, standard error. *p<0.05
https://doi.org/10.7554/eLife.34779.012| Change in GS–CS+ representational distance | β | SE | t | p |
|---|---|---|---|---|
| a. insula | −0.357 | 0.146 | −2.448 | 0.024* |
| caudate | −0.082 | 0.043 | −1.908 | 0.071 |
| amygdala | −0.285 | 0.103 | −2.761 | 0.012* |
| V1 | 0.299 | 0.064 | 4.684 | <0.001* |
| vmPFC | 0.277 | 0.217 | 1.277 | 0.216 |
Table 3
Relationship between width of generalisation from aversive feedback (σA value estimates) and questionnaire total scores.
Each line represents the results of a separate model, as questionnaire scores were significantly collinear. STAI, Spielberger State-Trait Anxiety Inventory (trait scale); AMI, Apathy Motivation Index; OCI-R, Obsessive-Compulsive Index (Revised); PHQ9, Physician’s Health Questionnaire 9 (a brief measure of mood disorder symptoms); BIS-11, Barratt Impulsivity Scale (version 11); CSQ global, Cognitive Style Questionnaire cognitive globalisation score. SE, standard error. *p<0.010 (Nyholt-Bonferroni corrected p value for multiple tests on non-independent data, alpha = 0.05).
| Questionnaire measure | β | SE | t | p |
|---|---|---|---|---|
| STAI total | 0.039 | 0.015 | 2.626 | 0.009* |
| AMI total | −0.051 | 0.014 | −3.687 | <0.001* |
| OCI-R total | 0.005 | 0.014 | 0.373 | 0.710 |
| PHQ9 total | 0.021 | 0.015 | 1.476 | 0.141 |
| BIS-11 total | −0.005 | 0.013 | −0.410 | 0.682 |
| CSQ global | −0.014 | 0.014 | −0.978 | 0.328 |
Table 4
Relationship between generalization width from aversive feedback (σA value estimates) and factor analysis-derived symptom scores.
All factor scores were included in the same model. SE, standard error. *p<0.05
| Factor analysis-derived symptom score | β | SE | t | p |
|---|---|---|---|---|
| ‘Intrusive anxiety’ | 0.043 | 0.016 | 2.677 | 0.008* |
| ‘Low self-worth’ | −0.019 | 0.015 | −1.255 | 0.210 |
| ‘Lack of self-control’ | −0.000 | 0.014 | −0.032 | 0.975 |
Additional files
-
Supplementary file 1
Demographic information for study participants.
Unless otherwise specified, figures represent mean (SD). STAI, Spielberger State-Trait Anxiety Inventory (trait score only); AMI, Apathy Motivation Index; OCI-R, Obsessive-Compulsive Index (Revised); PHQ9, Physician’s Health Questionnaire 9 (a brief measure of mood disorder symptoms); BIS-11, Barratt Impulsivity Scale (version 11); CSQ global, Cognitive Style Questionnaire (short-form) ‘cognitive globalisation’ subscale.
- https://doi.org/10.7554/eLife.34779.016
-
Supplementary file 2
Internal reliability of questionnaire scores in the AMT sample.
STAI, Spielberger State-Trait Anxiety Inventory (trait score only); AMI, Apathy Motivation Index; OCI-R, Obsessive-Compulsive Index (Revised); PHQ9, Physician’s Health Questionnaire 9 (a brief measure of mood disorder symptoms); BIS-11, Barratt Impulsivity Scale (version 11); CSQ, Cognitive Style Questionnaire (short-form).
- https://doi.org/10.7554/eLife.34779.017
-
Supplementary file 3
Individual item loadings derived from factor analysis of questionnaire data in the AMT sample.
Item loadings are only shown above a threshold of ±0.25). Text in square brackets is to aid interpretation of reverse-scored items.
- https://doi.org/10.7554/eLife.34779.018
-
Transparent reporting form
- https://doi.org/10.7554/eLife.34779.019
Download links
A two-part list of links to download the article, or parts of the article, in various formats.
Downloads (link to download the article as PDF)
Open citations (links to open the citations from this article in various online reference manager services)
Cite this article (links to download the citations from this article in formats compatible with various reference manager tools)
Value generalization in human avoidance learning
eLife 7:e34779.
https://doi.org/10.7554/eLife.34779


