CCR7 defines a precursor for murine iNKT cells in thymus and periphery
- University of Minnesota, United States
Figures
Figure 1 with 3 supplements
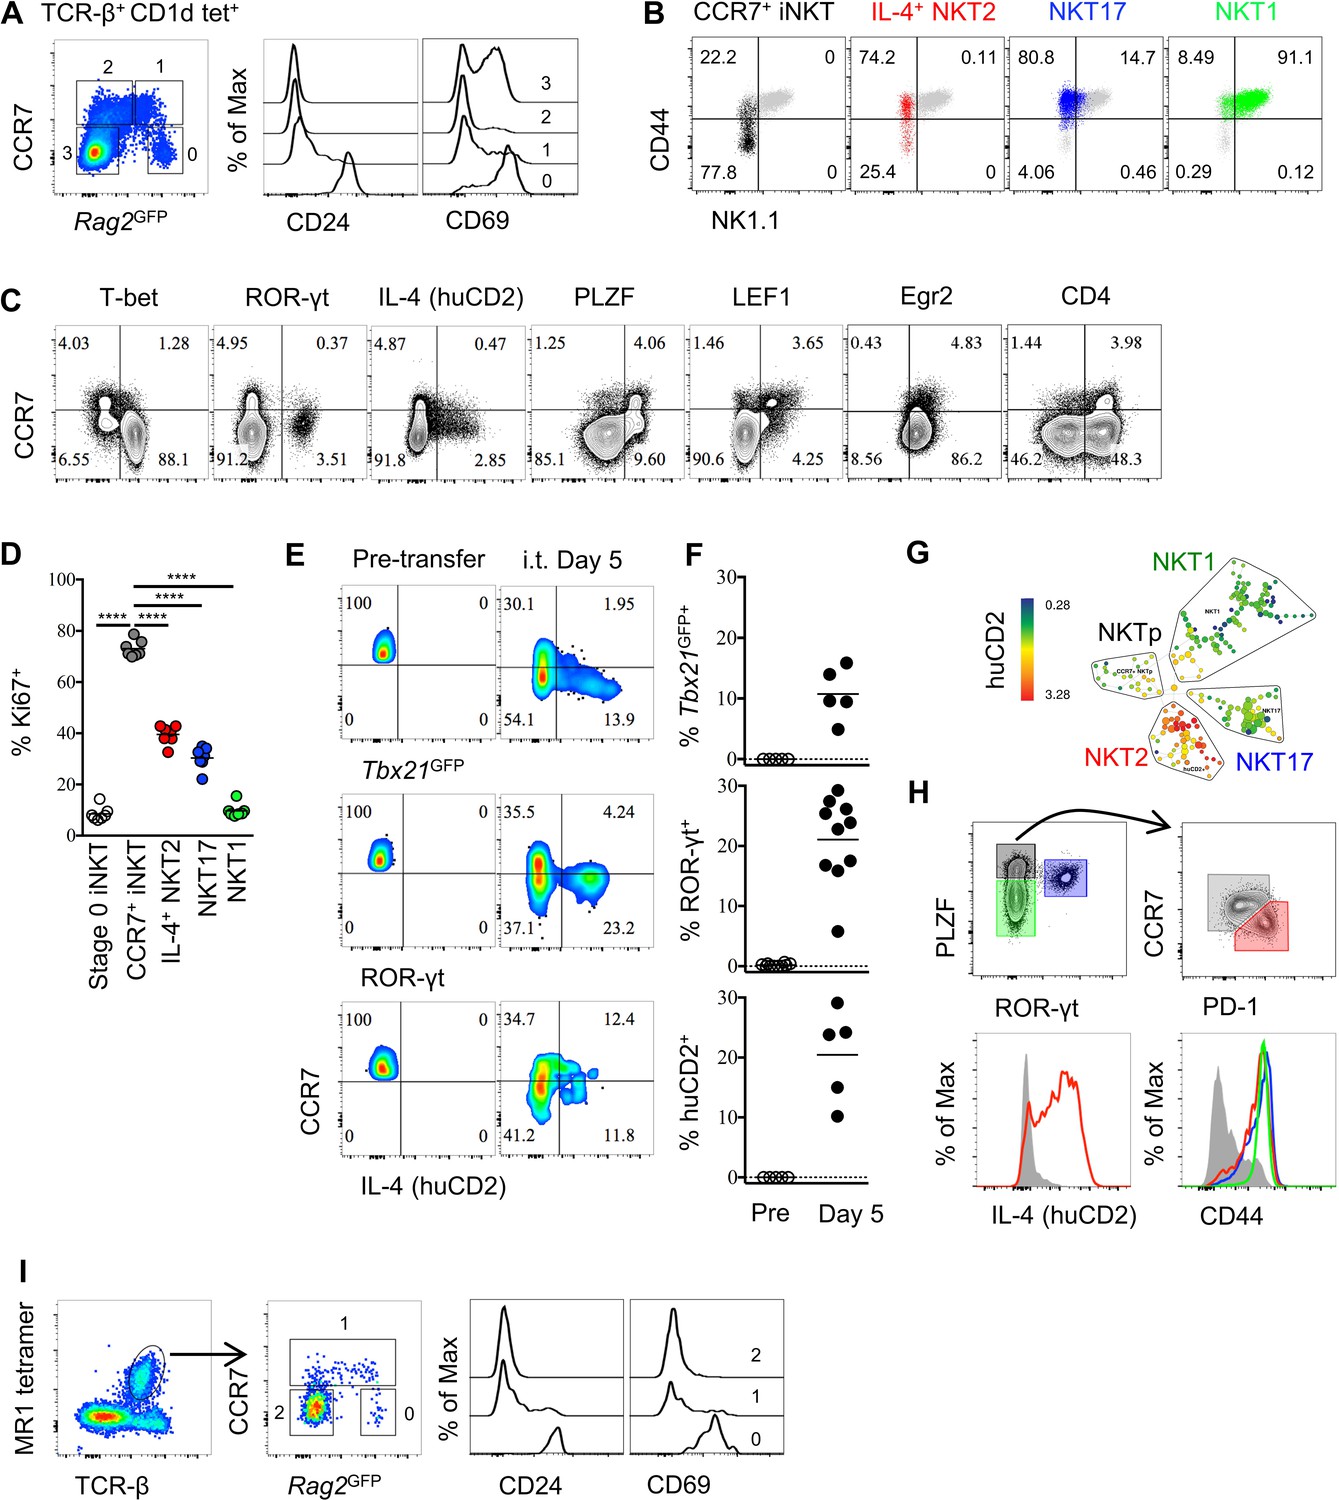
Thymic CCR7+ iNKT and MAIT cells are at an early developmental stage and give rise to distinct effector subsets in the thymus.
(A) Expression of Rag2GFP and CCR7 in thymic iNKT cells (TCR-β+ CD1d-PBS57+) (left column), and of CD24 (middle column) and CD69 (right column) on cells with different levels of Rag2GFP. Data are representative of 3 independent experiments with 3–4 mice in each. (B) Expression of NK1.1 and CD44 in thymic CCR7+ iNKT (black dots), IL-4+ (human CD2+) NKT2 (red dots), ROR-γt+ NKT17 (blue dots), T-bet+ NKT1 (green dots) cells together with total thymic iNKT cells (grey dots). Numbers in quadrants indicate percent cells in each for CCR7+ iNKT (black dots), IL-4+ (human CD2+) NKT2 (red dots), ROR-γt+ NKT17 (blue dots) and T-bet+ NKT1 (green dots) cells. Data are representative of 4 independent experiments with 2–3 mice in each. (C) Expression of T-bet, ROR-γt, huCD2, PLZF, LEF1, Egr2 and CD4 with CCR7 in thymic iNKT cells (TCR-β+ CD1d-PBS57+ CD24–). Data are representative of 3 independent experiments with 2–3 mice in each. Numbers in quadrants indicate percent cells in each (throughout). (D) Frequency of Ki67+ cells in each population of thymic iNKT cells. Data are pooled from three independent experiments with 2–3 mice in each. ****p<0.0001 (one-way ANOVA, Tukey’s multiple comparisons test) Each symbol represents an individual mouse; small horizontal lines indicate the mean. (E) Expression of Tbx21GFP, ROR-γt and human CD2 in CCR7+ iNKT cells sorted from BALB/c Tbx21GFP KN2 mice before intra-thymic transfer (left column) or 5 days after transfer in the thymus of congenic BALB/c recipient mice (right column). (F) Frequency of Tbx21GFP+, ROR-γt+ or human CD2+ cells in donor cells before or 5 days after intra-thymic transfer into the thymus of congenic BALB/c recipient mice. Each symbol represents an individual recipient mouse; small horizontal lines indicate the mean. (G) SPADE analysis of thymic iNKT cells from B6 KN2 mice supports that CCR7+ NKTp are a distinct lineage from the effector subsets, NKT1, NKT2 and NKT17. Representative figure shows differential expression of human CD2 in each population of iNKT cells. (H) CCR7 and PD-1 distinguish two cell populations (top row, right column) within PLZFhi iNKT cells (top row, left column), and expression of human CD2 and CD44 in CCR7+ NKTp (grey), NKT1 (green), NKT2 (red) and NKT17 (blue) are shown as overlays (bottom row). Data are representative of 3 independent experiments with 3 mice in each. (I) Expression of Rag2GFP together with CCR7 (middle column) in thymic MAIT cells (far left column), and expression of CD24 and CD69 in CCR7+ and CCR7– MAIT cells with different level of Rag2GFP (far right two columns). Data are representative of 2 independent experiments with 3 mice in each.
-
Figure 1—source data 1
High proliferative and precursor potential of CCR7+ iNKT cells.
- https://doi.org/10.7554/eLife.34793.006
-
Figure 1—source data 2
Thymic CCR7+ iNKT cells are distinguished from stage 0 iNKT cells and give rise to iNKT subsets in periphery.
- https://doi.org/10.7554/eLife.34793.007
-
Figure 1—source data 3
Consistent, robust and unbiased labeling of thymocytes by intra-thymic injection of biotin.
- https://doi.org/10.7554/eLife.34793.008
Figure 1—figure supplement 1
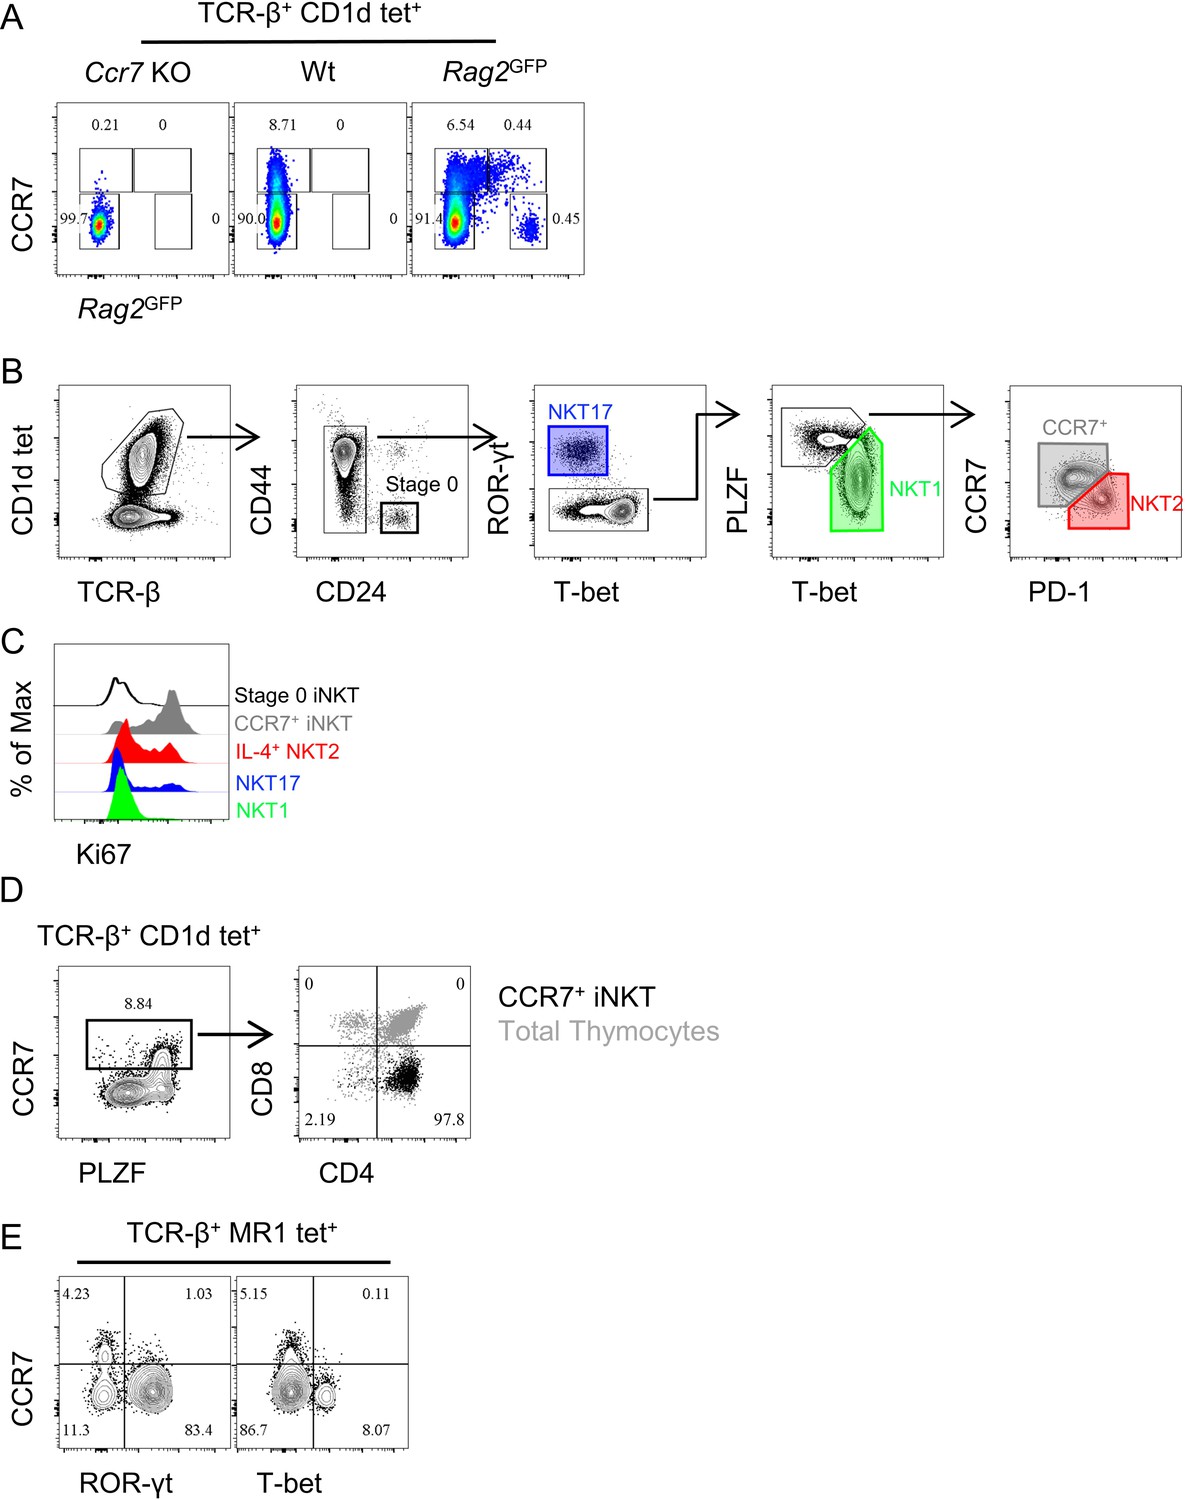
Specific CCR7 staining in iNKT cells and gating strategy of iNKT subsets and CD4/CD8 profile of CCR7+ iNKT and CCR7+ MAIT cells.
(A) Representative flowcytometry profile of CCR7 staining in thymic iNKT cells enriched from Ccr7−/−, Wt and Rag2GFP mouse. (B) Gating strategy to identify enriched thymic iNKT cells as well as various subpopulations of iNKT cells, stage 0 iNKT (heavy black line), CCR7+ iNKT (grey polygon), NKT1 (green polygon), NKT2 (red polygon) and NKT17 cells (purple rectangle). (C) Representative staining of Ki67 in various subpopulations of iNKT cells, stage 0 iNKT (black), CCR7+ iNKT (grey), NKT1 (green), NKT2 (red) and NKT17 cells (purple). Data are representative of three independent experiments with 2–3 mice in each. (D) CD4/CD8 profile of thymic CCR7+ iNKT cells. Identification of CCR7+ cells in enriched thymic iNKT cells (left column), and CD4/CD8 profile of CCR7+ iNKT cells (black dots) relative to the total thymocytes (grey dots) from the same mouse (right column). Number indicates percent cells in each gate. (E) Expression of T-bet and ROR-γt with CCR7 in thymic MAIT cells (TCR-β+ CD1d-PBS57+). Data are representative of 2 independent experiments with 2 mice in each.
Figure 1—figure supplement 2
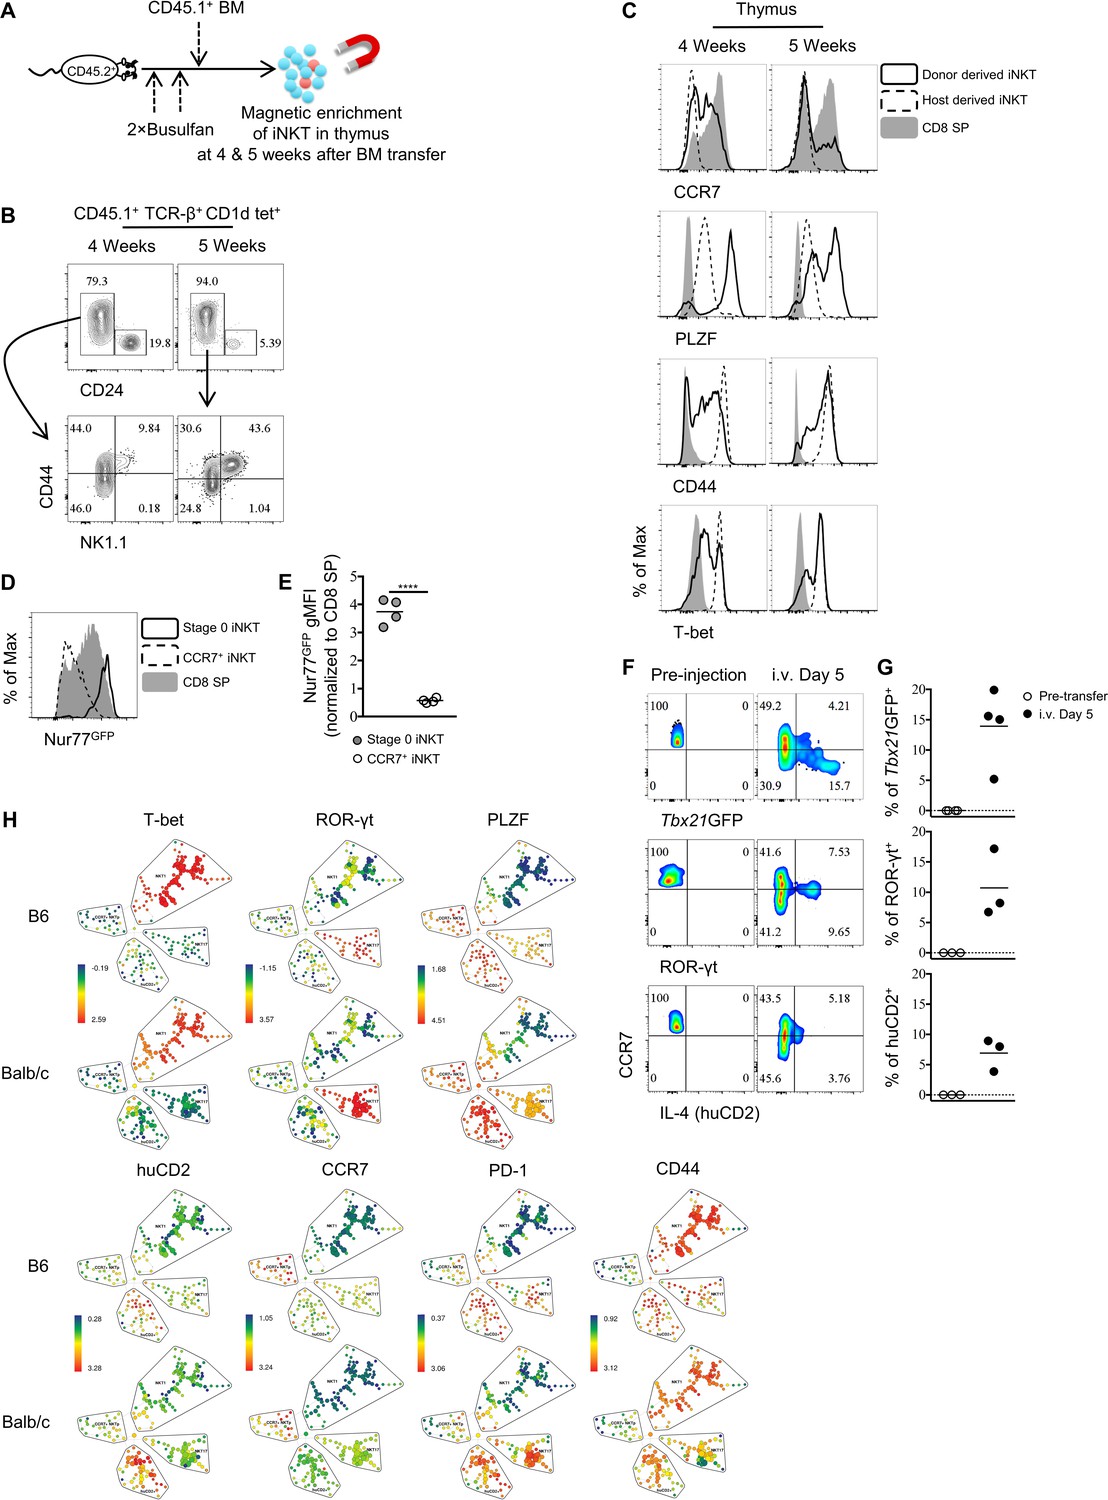
Thymic CCR7+ iNKT cells are enriched at an early timepoint in busulfan induced BM chimera.
(A) Experimental scheme to generate busulfan induced bone marrow chimeras and evaluate iNKT phenotype. (B) Frequency of CD24+ CD44− stage 0 iNKT cells among total iNKT cells (TCR-β+ CD1d tet+) (top row) and expression of NK1.1 and CD44 in the CD24− iNKT cells (bottom row) in the thymus at indicated time point after bone marrow chimera induction. (C) Expression of CCR7, PLZF, CD44 and T-bet in donor derived iNKT, host derived iNKT and total CD8 SP cells in the thymus at indicated time point after bone marrow chimera induction. (D) Expression of Nur77GFP in Stage 0 iNKT cells (TCR-β+ CD1d tet+ CD44– CD24+), CCR7+ iNKT cells and CD8 SP thymocytes. Data are representative of 2 independent experiments with two mice in each. (E) Normalized gMFI of Nur77GFP in stage 0 iNKT and CCR7+ iNKT cells. Data are pooled from two independent experiments with two mice in each. ****p<0.0001 (unpaired two tailed t test). Each symbol represents an individual mouse; small horizontal lines indicate the mean. (F) Expression of Tbx21GFP, ROR-γt and human CD2 in CCR7+ iNKT cells sorted from BALB/c Tbx21GFP or BALBc KN2 mice before intravenous injection (left column) or 5 days after injection of congenic BALB/c recipient mice, in the spleen (right column). (G) Frequency of Tbx21GFP+, ROR-γt+ or human CD2+ cells in donor derived iNKT cells before or 5 days after intravenous injection of congenic BALB/c recipient mice, in the spleen. Each symbol represents an individual recipient mouse; small horizontal lines indicate the mean. (H) SPADE analysis of thymic iNKT cells from B6 and BALB/c KN2 mice shows CCR7+ NKTp is a distinct lineage from the effector subsets, NKT1, NKT2 and NKT17. Representative figure shows differential expression of T-bet, ROR-γt, PLZF, huCD2, CCR7, PD-1 and CD44 in each population of iNKT cells.
Figure 1—figure supplement 3
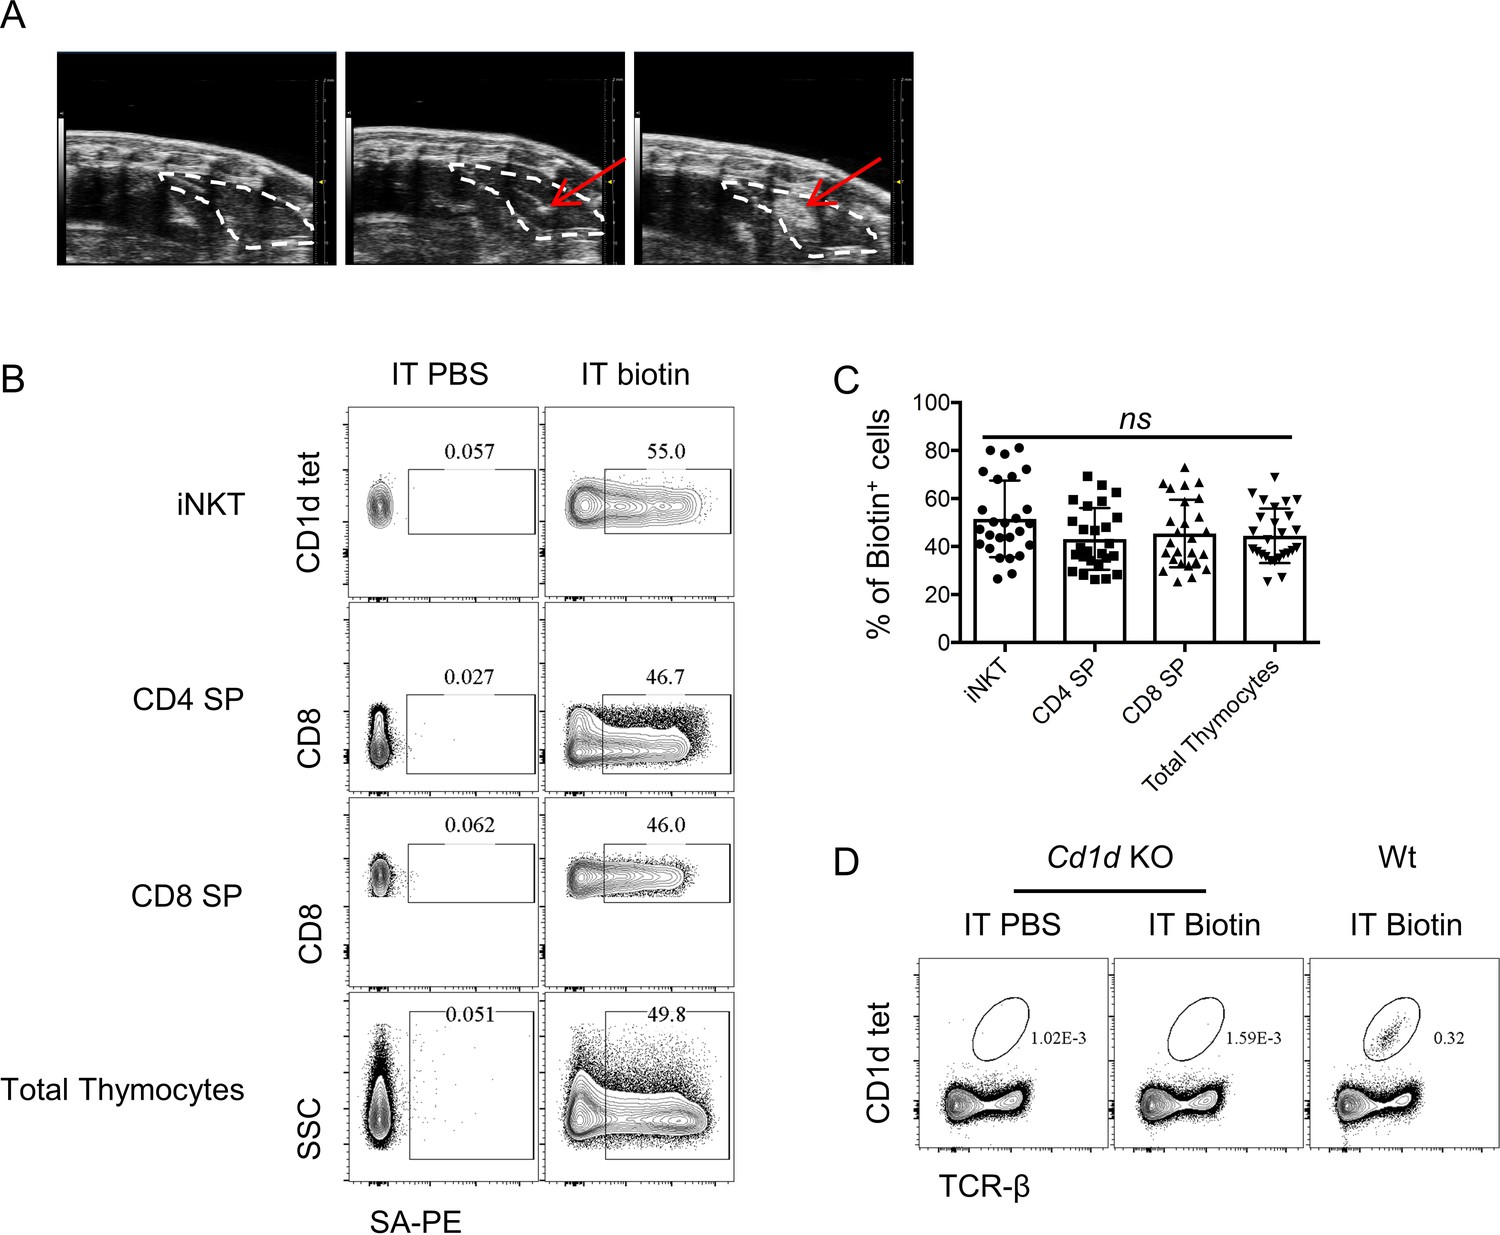
Ultrasound imaging guided intra-thymic injection.
(A) Representative ultrasound image of mouse chest area, the thymus is outlined by white dotted line (left column), the red arrow indicates the needle tip in thymus before injection (middle column), after injection the red arrow indicates the injected NHS-biotin contained in the thymus (right column). (B) Representative flowcytometry profile and (C) frequency of biotinylated cells revealed by streptavidin-PE staining in various cell populations (iNKT, CD4 SP, CD8 SP and total thymocytes) in the thymus 24 hr later after intra-thymic injection of PBS or NHS-biotin. Data are pooled from six independent experiments with 2–6 mice in each. ns, not significant, p>0.05 (one-way ANOVA). Each symbol represents an individual mouse; Mean ± SD. (D) Representative flowcytometry profile of CD1d tetramer staining in thymocytes of Cd1d KO or Wt mouse received intra-thymic injection of PBS or NHS-biotin.
Figure 2 with 2 supplements
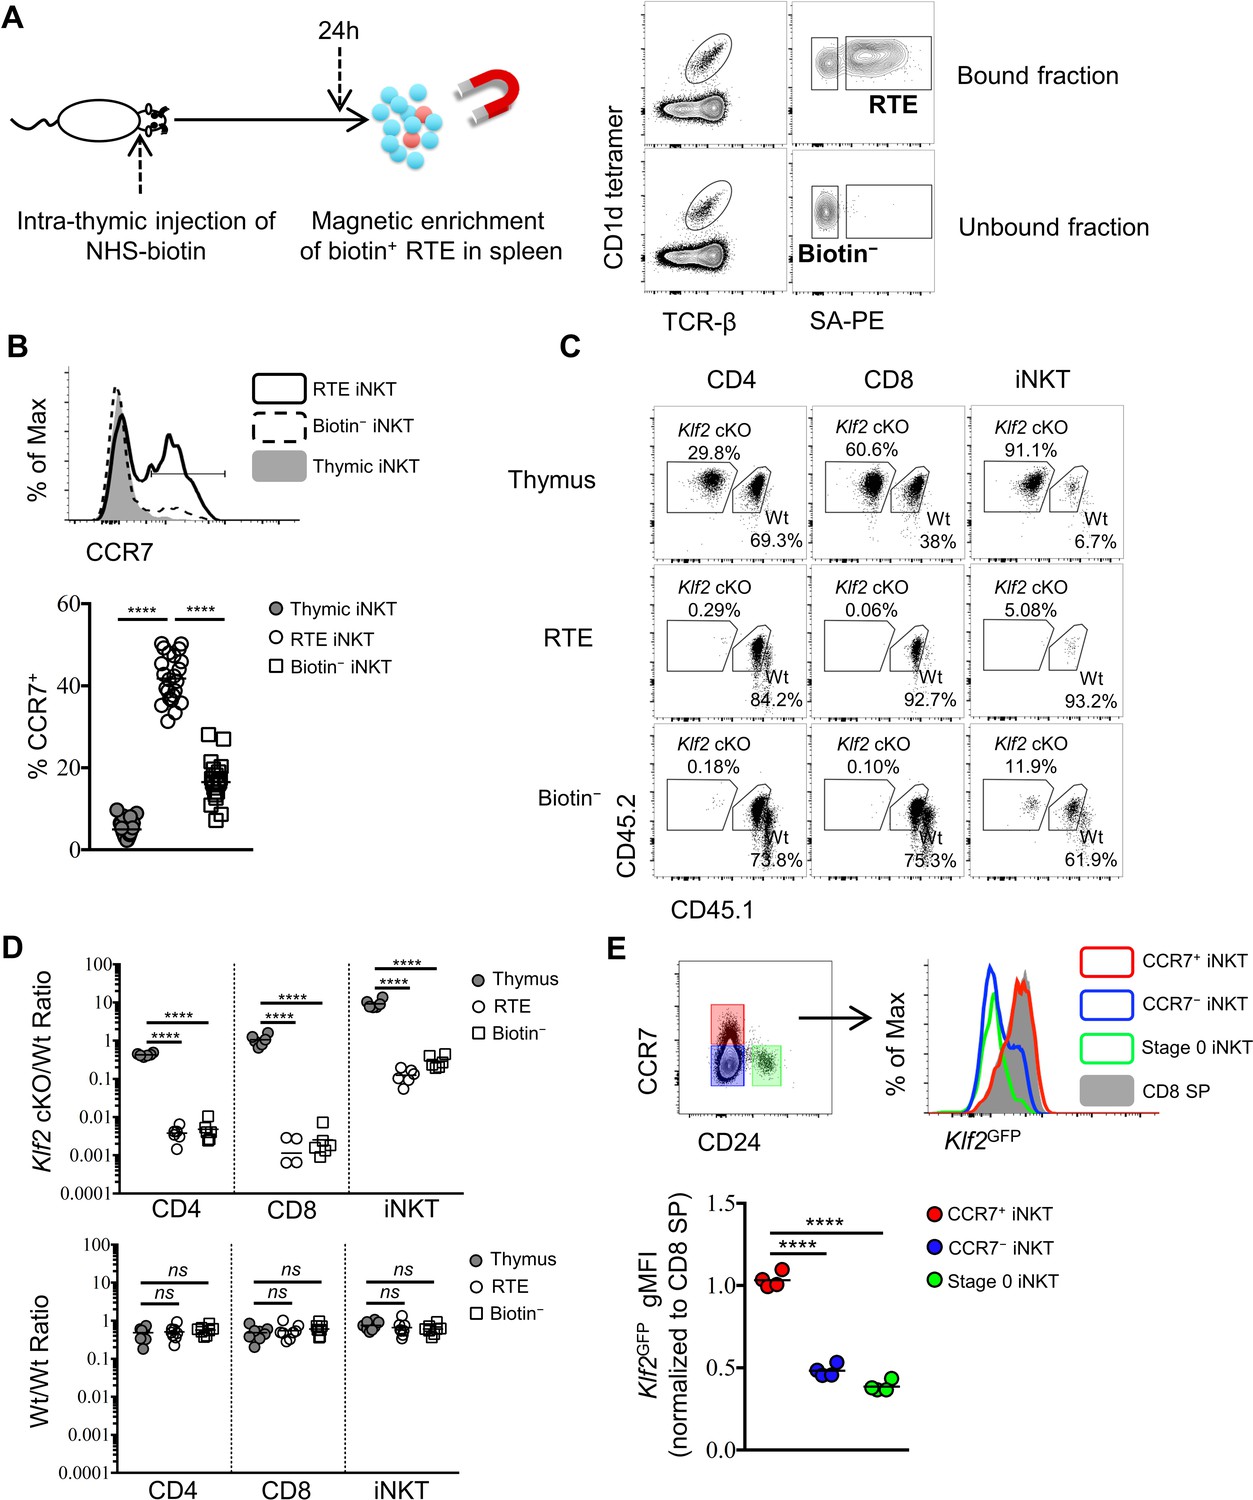
CCR7+ iNKT cells are enriched in the emigrating iNKT population and depend on Klf2.
(A) Experimental scheme to track recent thymic emigrants (RTE) through intra-thymic injection of NHS-biotin (left column) followed by enrichment of biotin+ splenic cells 24 hr after intra-thymic labeling, compared to ‘old’ cells (biotin– cells from spleen) (right column). (B) Expression of CCR7 in thymic, RTE and biotin− iNKT cells, the grey shade represents thymic iNKT cells, the solid black line represents RTE iNKT cells, the dashed black line represents biotin− iNKT cells (top row); frequency of CCR7+ cells in thymic, RTE and biotin− iNKT cells, the solid grey circle represents thymic iNKT cells, the open circle represents RTE iNKT cells, the open square represents biotin− iNKT cells (bottom row). Data are pooled from 5 independent experiments with 3–6 mice in each. ****p<0.0001 (one-way ANOVA) Each symbol represents an individual mouse; small horizontal lines indicate the mean. (C) Mixed bone marrow chimeras were generated with 25:75 ratio of donor bone marrow cells using CD45.2+ CD45.2+ B6 Klf2 cKO cells and CD45.1+ CD45.2+ B6 Wt cells, or with 50:50 ratio of donor bone marrow cells using CD45.2+ CD45.2+ B6 Wt cells and CD45.1+ CD45.2+ B6 Wt cells. Eight weeks later, chimeras received intra-thymic labeling with NHS-biotin to track RTE among CD4, CD8 and iNKT cells. Data are representative of 2 independent experiments with 4–8 mice in each. (D) Statistical analysis of thymic, RTE and biotin− CD4 T cells, CD8 T cells and iNKT cells in 8-week-old BM chimeras reconstituted with Klf2 cKO and Wt cells (top row) or with Wt and Wt cells (bottom row). Data are pooled form 2 independent experiments with 4–8 mice in each. Numbers indicate the ratio between the cells derived from each donor source. ****p<0.0001 (one-way ANOVA). ns, not significant, p>0.05 (one-way ANOVA). Each symbol represents an individual mouse; small horizontal lines indicate the mean. (E) Expression of Klf2GFP in CCR7+ iNKT, stage 0 iNKT, CCR7– iNKT cells and CD8 SP cells (top row). Normalized gMFI of Klf2GFP in CCR7+ iNKT, stage 0 iNKT, CCR7– iNKT cells (bottom row). Data are pooled from 2 independent experiments with 2 mice in each. ****p<0.0001 (one-way ANOVA). Each symbol represents an individual mouse; small horizontal lines indicate the mean.
-
Figure 2—source data 1
RTE iNKT cells are CCR7+ and depends on Klf2 for emigration.
- https://doi.org/10.7554/eLife.34793.012
-
Figure 2—source data 2
RTE iNKT and CCR7+ RTE iNKT cells are Rag2GFP+.
- https://doi.org/10.7554/eLife.34793.013
-
Figure 2—source data 3
High Klf2GFP in RTE iNKT cells.
- https://doi.org/10.7554/eLife.34793.014
Figure 2—figure supplement 1
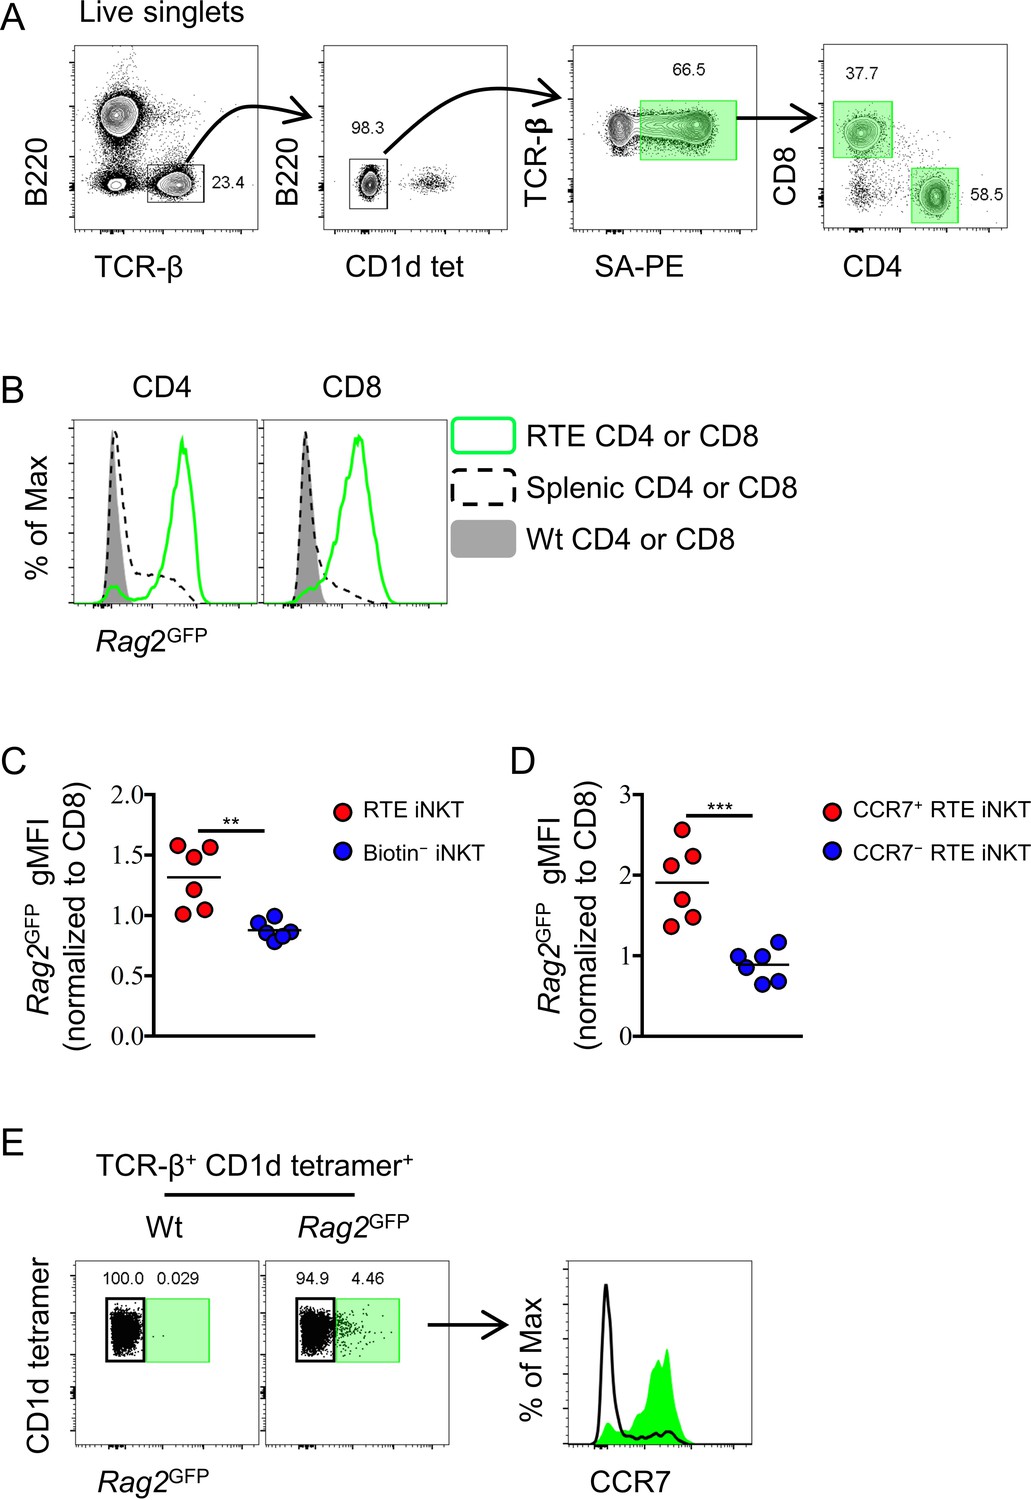
Intra-thymic labeling with NHS-biotin to identify RTEs in the periphery and Rag2GFP+ splenic iNKT cells are CCR7+.
(A) Gating strategy to identify RTEs of CD4 and CD8 T cells in spleen. (B) Expression of Rag2GFP in RTE CD4 or CD8 T cells, total splenic CD4 or CD8 T cells, and Wt total splenic CD4 or CD8 T cells. Data are representative of two independent experiments with three mice in each (C) Normalized Rag2GFP gMFI of RTE iNKT cells and biotin− iNKT cells in spleen. Data are pooled from two independent experiments with three mice in each. **p=0.0025 (unpaired two tailed t test). Each symbol represents an individual mouse; small horizontal lines indicate the mean. (D) Normalized Rag2GFP gMFI of CCR7+ RTE iNKT cells and CCR7− RTE iNKT cells in spleen. Data are pooled from two independent experiments with three mice in each ***p=0.0006 (unpaired two tailed t test). Each symbol represents an individual mouse; small horizontal lines indicate the mean. (E) Rag2GFP+ iNKT cells predominantly express CCR7 (right column) when identified in spleen from B6 Rag2GFP mice (left column), green shade indicates Rag2GFP+ iNKT cells and black line indicates Rag2GFP– iNKT cells.
Figure 2—figure supplement 2
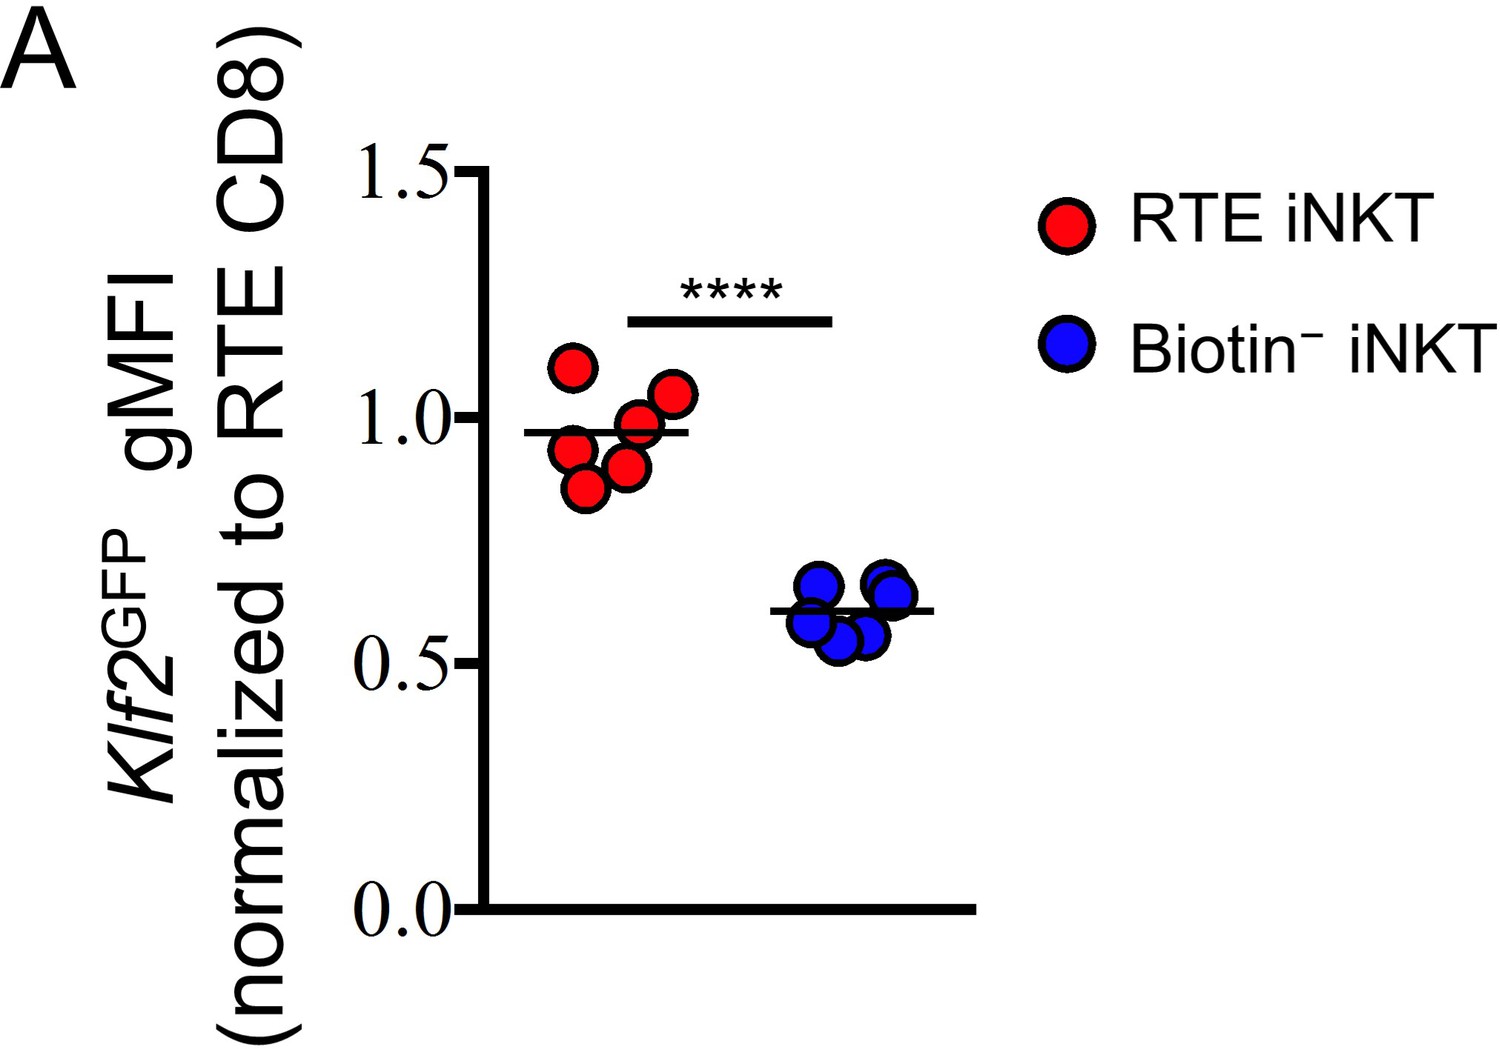
RTE iNKT cells express high level of Klf2GFP.
(A) Normalized Klf2GFP gMFI of RTE iNKT cells and biotin− iNKT cells. Data are pooled from two independent experiments with 2–4 mice in each. ****p<0.0001 (unpaired two tailed t test). Each symbol represents an individual mouse; small horizontal lines indicate the mean.
Figure 3 with 1 supplement

RTE iNKT cells are immature and undergo further differentiation after reaching periphery.
(A) Expression of T-bet and ROR-γt in thymic, RTE and splenic biotin− iNKT cells. Number in quadrants indicates percent cells in each (throughout). Data are representative of 3 independent experiments with 2–6 mice in each. (B) Frequency of T-bet+ NKT1, ROR-γt+ NKT17 cells and normalized gMFI of IL-4 (human CD2) in thymic, RTE and splenic biotin− iNKT cells. The solid grey circle represents thymic iNKT cell, the open circle represents RTE iNKT cells, the open square represents biotin− iNKT cells. **p=0.0048, ****p<0.0001 (one-way ANOVA). Data are pooled from 3 independent experiments with 2–6 mice in each. Each symbol represents an individual mouse; small horizontal lines indicate the mean. (C) Expression of Qa2 in thymic, 24 hr RTE, 72 hr RTE and splenic biotin− T-bet+ NKT1 cells. Data are representative of 3 independent experiments with 2–3 mice in each. (D) Normalized gMFI of Qa2 in thymic, 24 hr RTE, 72 hr RTE and biotin− T-bet+ NKT1 cells (left column). Normalized gMFI of PLZF in thymic, 24 hr RTE, 72 hr RTE and splenic biotin− T-bet+ NKT1 cells (right column). ****p<0.0001 (one-way ANOVA). Data are pooled from 3 independent experiments with 2–3 mice in each. Each symbol represents an individual mouse; small horizontal lines indicate the mean.
-
Figure 3—source data 1
RTE iNKT cells are immature and mature further in periphery.
- https://doi.org/10.7554/eLife.34793.017
-
Figure 3—source data 2
Thymic CCR7+ iNKT cells emigrate to periphery and differentiate into effector subsets.
- https://doi.org/10.7554/eLife.34793.018
Figure 3—figure supplement 1
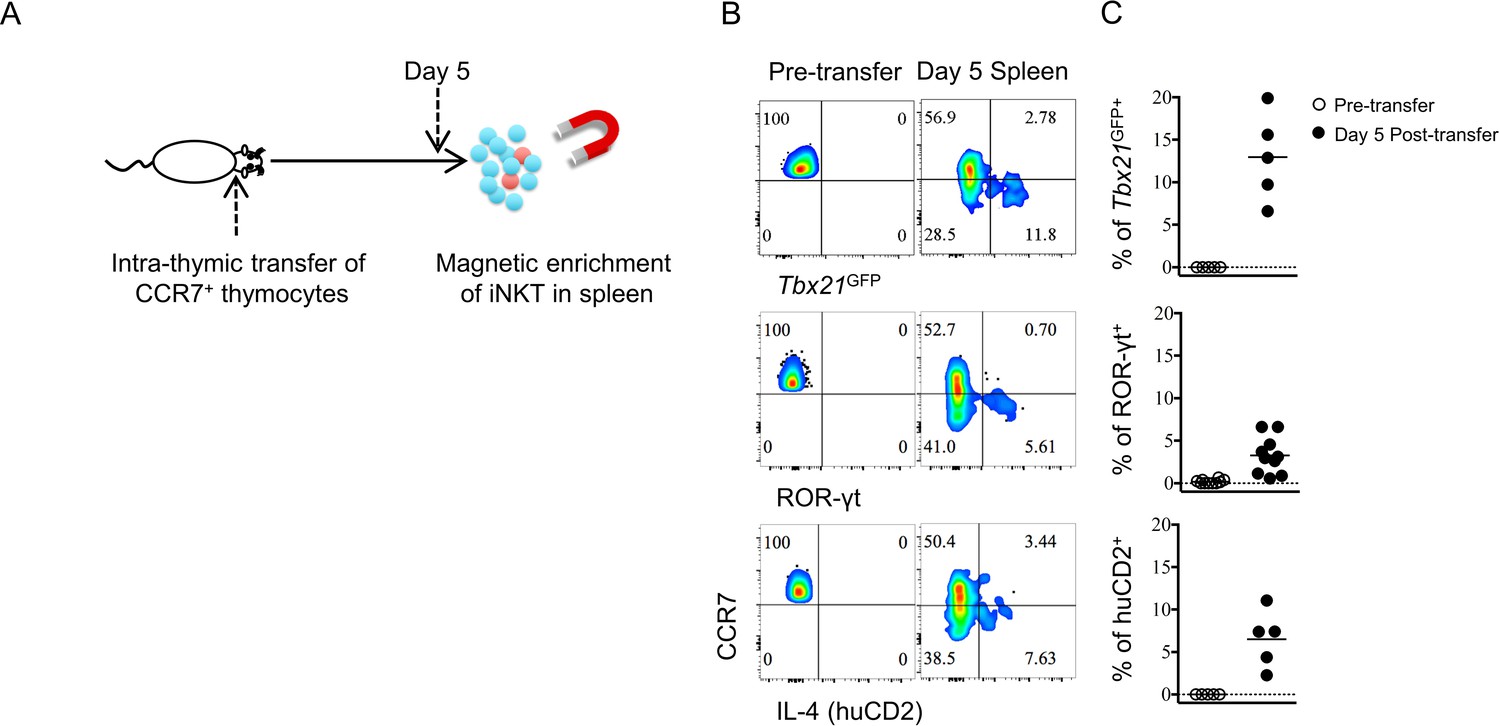
Thymic CCR7+ iNKT emigrate to the periphery and undergo further development into effector subsets.
(A) Experimental scheme for intra-thymic transfer of sorted CCR7+ thymocytes (CD4+ Tbx21GFP– huCD2– CD24– CD8–) from Tbx21GFP/KN2 mice into congenic hosts. The phenotype of donor derived iNKT cells was examined in the spleen after 5 days. (B) Expression of Tbx21GFP, ROR-γt and human CD2 in CCR7+ iNKT cells sorted from BALB/c Tbx21GFP KN2 mice before intra-thymic transfer (left column) or 5 days after transfer into congenic BALB/c recipient mice (right column). (C) Frequency of Tbx21GFP+, ROR-γt+ or human CD2+ cells in donor cells recovered in the spleen, before or 5 days after intra-thymic transfer into the thymus of congenic BALB/c recipient mice. Each symbol represents an individual recipient mouse; small horizontal lines indicate the mean.
Figure 4 with 1 supplement
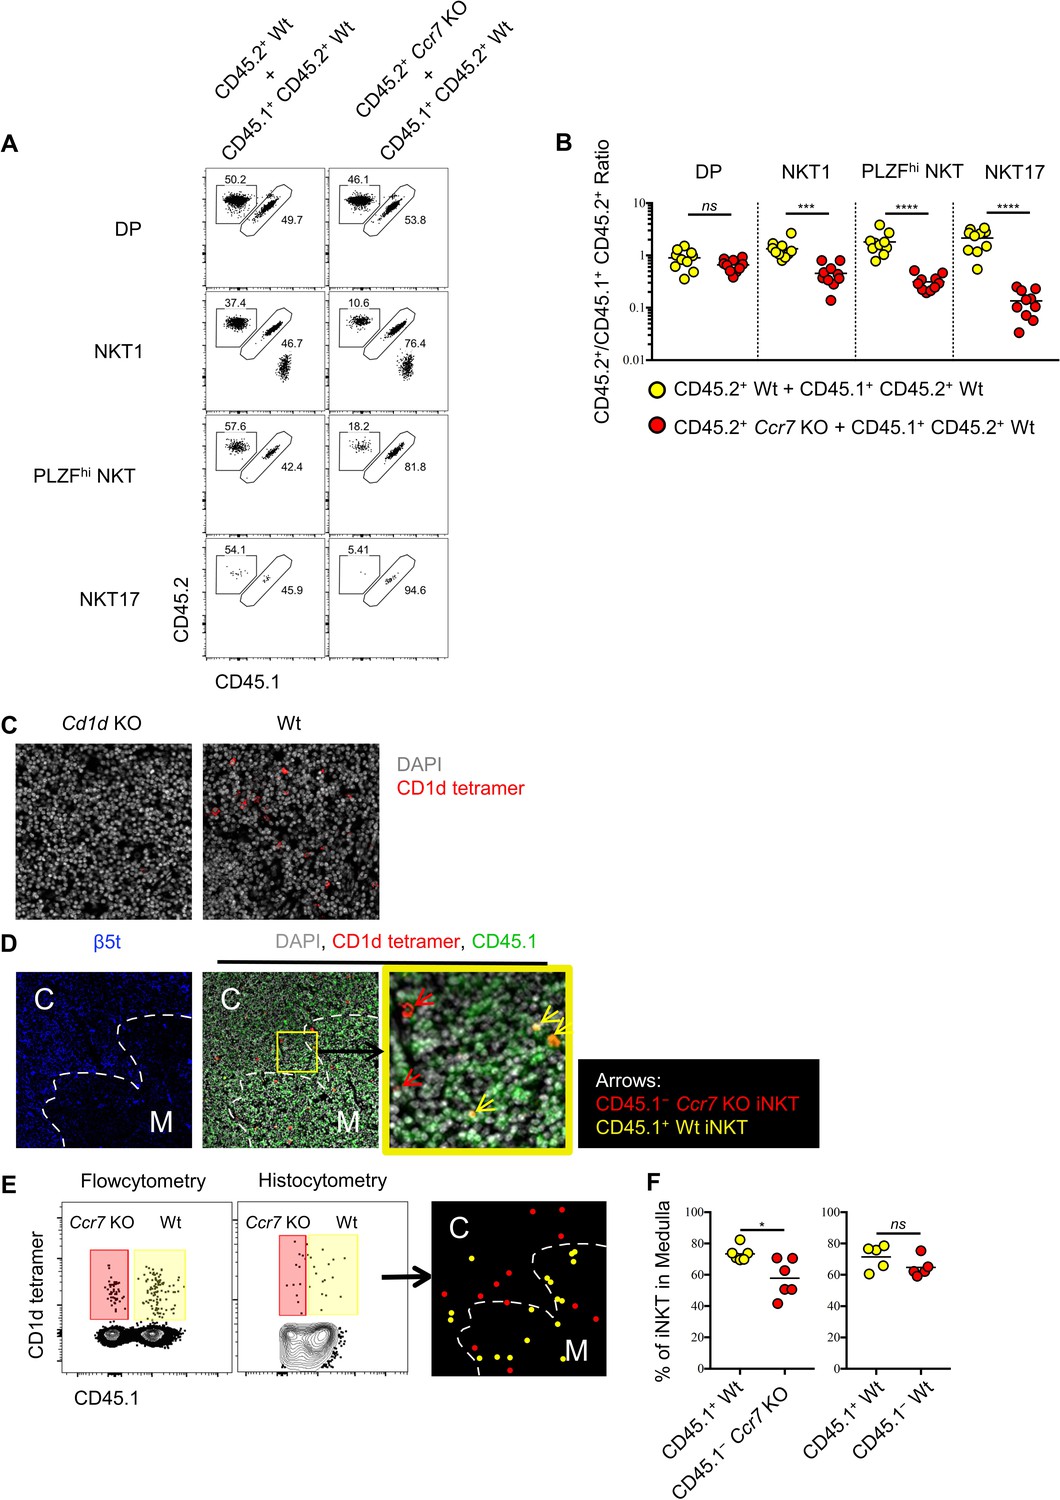
Ccr7 deficiency impairs iNKT subsets differentiation and medullary localization.
(A) Mixed bone marrow chimeras were generated with 50:50 ratio of donor bone marrow cells using CD45.2+ CD45.2+ B6 Ccr7 KO cells and CD45.1+ CD45.2+ B6 Wt cells, or with 50:50 ratio of donor bone marrow cells using CD45.2+ CD45.2+ B6 Wt cells and CD45.1+ CD45.2+ B6 Wt cells. Eight weeks later, the frequency of thymic iNKT effector subsets and thymocytes derived from different donor source were analyzed. Data are representative of 3 independent experiments with 4–10 mice in each. Numbers adjacent to outlined areas indicate percent cells in each, throughout. (B) Statistical analysis of thymic iNKT subsets and DP thymocytes in 8-week-old BM chimeras reconstituted with Ccr7 KO and Wt cells or with Wt and Wt cells. Numbers indicate the ratio between the cells derived from each donor source. ***p=0.0001 (unpaired two tailed t test). ****p<0.0001 (unpaired two tailed t test). ns, not significant, p>0.05 (unpaired two tailed t test). Data are pooled from 3 independent experiments with 4–10 mice in each. Each symbol represents an individual mouse; small horizontal lines indicate the mean. (C) Thymic sections of Cd1d KO (left column) and Wt (right column) B6 mice were stained with CD1d tetramer (red) and the DNA-binding dye DAPI (grey) to visualize iNKT cells in situ. (D) Thymic sections of BM chimeras 8 weeks after reconstituted with Ccr7 KO and Wt cells were stained for the cortical-thymic-epithelial-cell-associated proteasomal subunit β5t (blue), CD1d tetramer (red), CD45.1 (green) and the DNA-binding dye DAPI (grey) to visualize and distinguish cortex, medulla, CD45.1−Ccr7 KO iNKT and CD45.1+ Wt iNKT cells. Yellow outline (middle column) indicates magnified area (right column); Arrows indicate CD45.1−Ccr7 KO iNKT cells (red), CD45.1+ Wt iNKT cells (yellow). C: Cortex; M: Medulla. (E) Flowcytometry analysis of thymocytes (left column), histocytometry analysis of immunofluorescence image (middle column) and localization of CD45.1− Ccr7 KO iNKT cells (red dot), CD45.1+ Wt iNKT cells (yellow dot) as determined by histocytometry (right column). (F) Frequency of iNKT cells localized in thymic medulla from 8-week-old BM chimeras reconstituted with Ccr7 KO and Wt cells (left column) or with Wt and Wt cells (right column). *p=0.0141, ns, not significant, p=0.1775 (unpaired two tailed t test). Each symbol represents an individual mouse; small horizontal lines indicate the mean.
-
Figure 4—source data 1
CCR7 plays important role in iNKT cells differentiation and localization.
- https://doi.org/10.7554/eLife.34793.021
-
Figure 4—source data 2
CCR7 plays important role in MAIT cells differentiation.
- https://doi.org/10.7554/eLife.34793.022
Figure 4—figure supplement 1

Ccr7 deficiency impairs MAIT cells differentiation.
(A) Gating strategy to identify enriched thymic MAIT cells and mature ROR-γt+ and T-bet+ MAIT cells. (B) Mixed bone marrow chimeras were generated with a 50:50 ratio of donor bone marrow cells using CD45.2+ CD45.2+ B6 Ccr7 KO cells and CD45.1+ CD45.2+ B6 Wt cells, or with 50:50 ratio of donor bone marrow cells using CD45.2+ CD45.2+ B6 Wt cells and CD45.1+ CD45.2+ B6 Wt cells. Seven weeks later, the frequency of thymic MAIT mature subsets and thymocytes derived from different donor source were analyzed. Numbers adjacent to outlined areas indicate percent cells in each throughout. Data are representative of 3 independent experiments with 2–6 mice in each. (C) Statistical analysis of thymic MAIT mature subsets and DP thymocytes in 7-week-old BM chimeras reconstituted with Ccr7 KO and Wt cells or with Wt and Wt cells. Numbers indicate the ratio between the cells derived from each donor source. Data are pooled from 3 independent experiments with 2–6 mice in each. ***p=0.0009 (unpaired two tailed t test). ****p<0.0001 (unpaired two tailed t test). ns, not significant, p>0.05 (unpaired two tailed t test). Each symbol represents an individual mouse; small horizontal lines indicate the mean.
Figure 5 with 1 supplement

Thymic iNKT effector subsets are predominantly resident and may influence thymocytes maturation.
(A) Experimental scheme of parabiosis surgery. (B) Representative flowcytometry profile of spleen and thymus from the CD45.2+ host of a parabiotic pair after 30 days of parabiosis surgery, the number indicates the frequency of CD45.2+ (host) and CD45.1+ (parabiotic counterpart) cells in CD8 T cells and iNKT cells. Numbers adjacent to outlined areas indicate percent cells in each throughout. Data are representative of 2 independent experiments with 3 parabiotic pairs in each. (C) The frequency of cells derived from the host parabiont in splenic CD4+ T, CD8+ T and iNKT cells as well as thymic iNKT cells. Data are pooled from 2 independent experiments with 3 parabiotic pairs in each. ns, not significant, p=0.8722 (one-way ANOVA). ***p=0.0009, ****p<0.0001 (one-way ANOVA). Each symbol represents an individual mouse; small horizontal lines indicate the mean. (D) CCR7+ Tbx21GFP– and CCR7– Tbx21GFP+ thymocytes were sorted from BALB/c Tbx21GFP mice and intra-thymically transferred to congenic BALB/c recipients (left column). After 5 days, the donor derived iNKT cells were recovered in thymus and spleen from mice received CCR7+ Tbx21GFP– thymocytes or CCR7– Tbx21GFP+ thymocytes (right column). Numbers adjacent to outlined areas indicate percent cells in each throughout. Data are representative of 5 independent experiments. (E) Cell number of donor derived iNKT cells recovered in thymus and spleen from mice that received CCR7+ Tbx21GFP– thymocytes or CCR7– Tbx21GFP+ thymocytes. Data are pooled from 5 independent experiments with 2 mice in each. ns, not significant, p=0.1508 (unpaired two tailed t test). **p=0.0079 (unpaired two tailed t test). Each symbol represents an individual mouse; small horizontal lines indicate the mean. (F). Expression of YFP in DP thymocytes (left column) or thymic NKT1 cells (NK1.1+ CD44+) (right column), the grey shade represents cells from Wt mice, the solid green line represents cells from Ifn-γYFP mice; Numbers adjacent to solid black line indicate percent of Ifn-γYFP+ cells from Ifn-γYFP mice; Data are representative of 4 independent experiments with 3–5 mice in each. (G) Frequency of Ifn-γYFP+ cells within thymic NKT1 cells. Data are pooled from 4 independent experiments with 3–5 mice in each. Each symbol represents an individual mouse; small horizontal lines indicate the mean. (H) Expression of Qa2 in CD4 SP or CD8 SP thymocytes from Wt or Cd1d KO mice. Numbers adjacent to outlined areas indicate percent cells in each throughout. Data are representative of 5 independent experiments. (I) Frequency of Qa2+ cells in CD4 SP or CD8 SP thymocytes from Wt, Cd1d KO and Ifn-γRKO mice. Data are pooled from 5 independent experiments, n = 18 (Wt), n = 11 (Cd1d KO), n = 6 (Ifn-γRKO). *p=0.0426, **p=0.0023, ****p<0.0001 (one-way ANOVA). ns, not significant, p=0.2676 (CD4 SP), p=0.8848 (CD8 SP) (one-way ANOVA). Each symbol represents an individual mouse; small horizontal lines indicate the mean. (J) Expression of RankL in thymic NKT1, NKT2 and NKT17 cells (upper panel). Normalized gMFI of RANKL in thymic NKT1, NKT2 and NKT17 cells (bottom panel). Data are representative of 3 independent experiments with 2–3 mice in each. **p=0.0027 (NKT1 vs NKT2), *p=0.0391 (NKT1 vs NKT17) (one-way ANOVA). (K) Expression of Aire in TEC from Wt, Cd1d KO or Aire KO mice. Numbers adjacent to outlined areas indicate percent cells in each throughout. Data are representative of 4 independent experiments. (L) Frequency and number of Aire+ mTEC (left and middle column), number of total TEC (right column) from Wt and Cd1d KO mice. Data are representative of 4 independent experiments, n = 5 (Wt), n = 6 (Cd1d KO). ****p<0.0001, **p=0.0032, ns, not significant, p=0.5209 (unpaired two tailed t test). Each symbol represents an individual mouse; small horizontal lines indicate the mean.
-
Figure 5—source data 1
Thymic iNKT cells are resident and influence thymic microenvironment.
- https://doi.org/10.7554/eLife.34793.025
-
Figure 5—source data 2
CD69 and CD103 are dispensable for thymic retention of NKT1 and NKT17 cells.
- https://doi.org/10.7554/eLife.34793.026
Figure 5—figure supplement 1
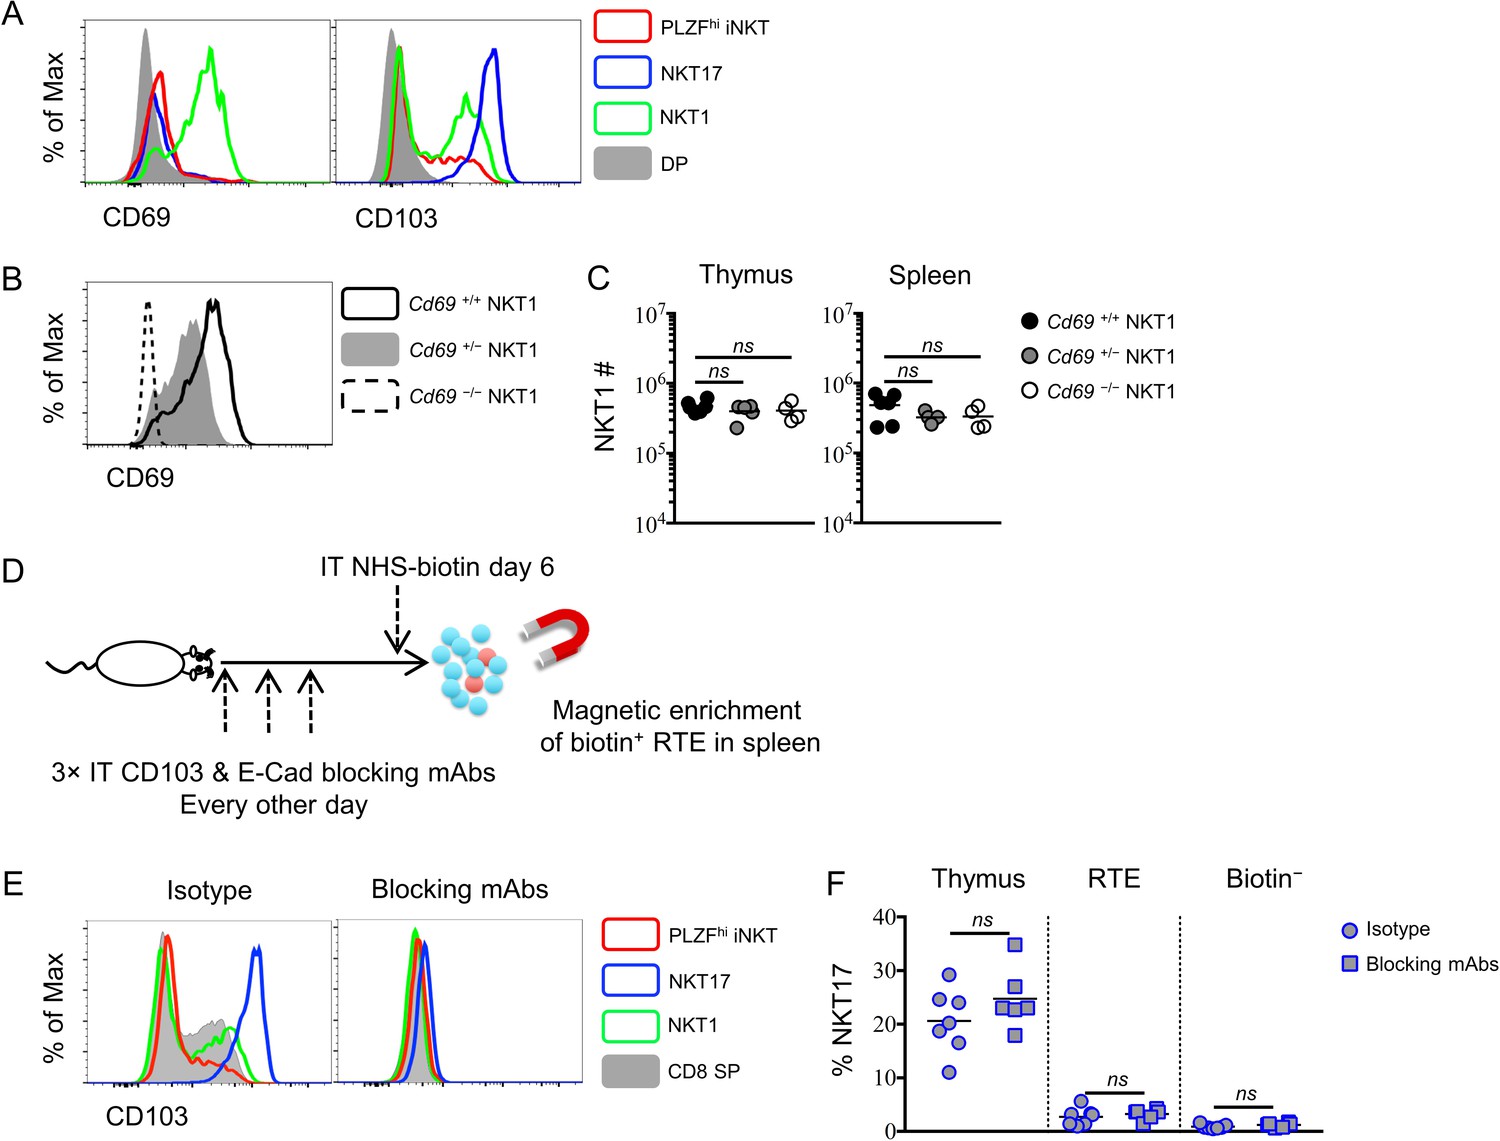
NKT1 and NKT17 cells do not rely exclusively on CD69 or CD103 for tissue residency.
(A) Expression of CD69 (left column) and CD103 (right column) in thymic PLZFhi iNKT cells, NKT17 cells, NKT1 cells and DP thymocytes. (B) Expression of CD69 in thymic NKT1 cells from Cd69+/+, Cd69+/– and Cd69–/– mice. (C) Number of NKT1 cells in thymus (left column) and spleen (right column) from Cd69+/+, Cd69+/– and Cd69–/– mice. Data are pooled from 3 independent experiments, n = 6 (Cd69+/+), n = 5 (Cd69+/–), n = 4 (Cd69–/–). ns, not significant, p>0.05 (one-way ANOVA). Each symbol represents an individual mouse; small horizontal lines indicate the mean. (D) Experimental scheme for blocking CD103 and E-cadherin interaction in thymus. BALB/c mice were intra-thymically injected with CD103 and E-cadherin blocking antibodies or isotype control antibody every other day (at day 0, day 2 and day 4), mice received intra-thymic labeling with NHS-biotin at day six and enrich biotin+ cells in spleen to track RTE 24 hr later. (E) CD103 staining in thymic PLZFhi iNKT cells, NKT17 cells, NKT1 cells and CD8 SP thymocytes from mice received isotype control antibody (left column) or blocking antibodies (right column). (F) Frequency of NKT17 cells among thymic, RTE and biotin− iNKT cells from mice received isotype control antibody (circle) or blocking antibodies (square). Data are pooled from 2 independent experiments, n = 7 (isotype), n = 6 (blocking mAbs). ns, not significant, p>0.05 (unpaired two tailed t test). Each symbol represents an individual mouse; small horizontal lines indicate the mean.
Tables
Key resources table
| Reagent type (species) or resource | Designation | Source or reference | Identifiers | Additional information |
|---|---|---|---|---|
| Antibody | anti-CCR7 | BD Biosciences | Cat # 562675 | (1:50) |
| Antibody | anti-CD4 | BD Biosciences | Cat # 563331 | (1:400) |
| Antibody | anti-CD8α | BD Biosciences | Cat # 563786 | (1:400) |
| Antibody | anti-CD24 | BioLegend | Cat # 101824 | (1:200) |
| Antibody | anti-NK1.1 | BioLegend | Cat # 108718 | (1:100) |
| Antibody | anti-CD44 | TONBO Biosciences | Cat # 80–0441 U025 | (1:200) |
| Antibody | anti-human CD2 | BioLegend | Cat # 309218 | (1:20) |
| Antibody | anti-TCRβ | BD Biosciences | Cat # 563221 | (1:200) |
| Antibody | anti-PD-1 | BioLegend | Cat # 135213 | (1:100) |
| Antibody | anti-CD45.1 | BioLegend | Cat # 110738 | (1:200) |
| Antibody | anti-CD45.2 | eBioscience | Cat # 11-0454-81 | (1:200) |
| Antibody | anti-Qa2 | BioLegend | Cat # 121710 | (1:200) |
| Antibody | anti-RANKL | eBioscience | Cat # 12-5952-82 | (1:100) |
| Antibody | anti-B220 | BioLegend | Cat # 103244 | (1:200) |
| Antibody | anti-CD11c | eBioscience | Cat # 47-0114-82 | (1:200) |
| Antibody | anti-CD11b | eBioscience | Cat # 47-0112-82 | (1:200) |
| Antibody | anti-F4/80 | eBioscience | Cat # 47-4801-82 | (1:200) |
| Antibody | anti-CD122 | BD Biosciences | Cat # 562960 | (1:100) |
| Antibody | anti-PLZF | BD Biosciences | Cat # 563490 | (1:200) |
| Antibody | anti-ROR-γt | BD Biosciences | Cat # 562684 | (1:200) |
| Antibody | anti-T-bet | BioLegend | Cat # 644824 | (1:200) |
| Antibody | anti-Egr2 | eBioscience | Cat # 17-6691-80 | (1:100) |
| Antibody | anti-Aire | eBioscience | Cat # 50-5934-82 | (1:100) |
| Antibody | anti-LEF1 | Cell Signaling Technology | Cat # 2230S | (1:100) |
| Antibody | anti-Rabbit IgG AF488 | Invitrogen | Cat # A11034 | (1:400) |
| Antibody | anti-IL-17RB | R and D Systems | Cat # FAB10402G | (1:20) |
| Antibody | Goat-anti-R Phycoerythrin (PE) | Abcam | Cat # ab34721 | (1:200) |
| Antibody | Donkey-anti- Goat AF555 | Abcam | Cat # ab150130 | (1:400) |
| Antibody | Rabbit-anti-β5t | MBL International | Cat # PD021 | (1:100) |
| Antibody | Goat-anti-Rabbit BV480 | BD biosciences | Cat # 564879 | (1:400) |
| Antibody | anti-EpCAM | BioLegend | Cat # 118214 | (1:200) |
| Other | streptavidin-PE | BD biosciences | Cat # 554061 | (1:400) |
| Other | streptavidin-BV421 | BioLegend | Cat # 405225 | (1:400) |
| Other | Ulex Europaeus Agglutinin I (UEA I) | VECTOR LOBORATORY | FL-1061 | (1:200) |
| Commercial assay or kit | Viability dye Ghost Dye Red 780 | TONBO Biosciences | Cat # 13–0865 T100 | (1:500) |
| Commercial assay or kit | anti-biotin MACS beads | Miltenyi | Cat # 130-105-637 | |
| Commercial assay or kit | anti-PE microbeads | Miltenyi | Cat # 130-048-801 | |
| Chemical compound, drug | Bulsulfan | MP Biomedicals | Cat # 154906 | |
| Chemical compound, drug | Streptavidin | Jackson Immuno Research | Cat # 016-000-113 | |
| Chemical compound, drug | DNase I | Roche | Cat # 10104159001 | |
| Chemical compound, drug | Liberase TH | Roche | Cat # 5401127001 | |
| Chemical compound, drug | sulfo-NHS-LC biotin | ThermoFisher Scientific | Cat # 21335 | |
| Software, algorithm | SPADE | CytoBank | https://www.cytobank.org/ | |
| Software, algorithm | Prism 7 | GraphPad | https://www.graphpad.com/ | |
| Software, algorithm | ImageJ | ImageJ | https://imagej.nih.gov/ij/ | |
| Software, algorithm | FlowJo v10 | TreeStar Flowjo | https://www.flowjo.com/solutions/flowjo |
Additional files
-
Transparent reporting form
- https://doi.org/10.7554/eLife.34793.027
Download links
A two-part list of links to download the article, or parts of the article, in various formats.
Downloads (link to download the article as PDF)
Open citations (links to open the citations from this article in various online reference manager services)
Cite this article (links to download the citations from this article in formats compatible with various reference manager tools)
CCR7 defines a precursor for murine iNKT cells in thymus and periphery
eLife 7:e34793.
https://doi.org/10.7554/eLife.34793


