A label-free approach to detect ligand binding to cell surface proteins in real time
- Center of Physiology and Pharmacology, Medical University of Vienna, Austria
Figures
Figure 1
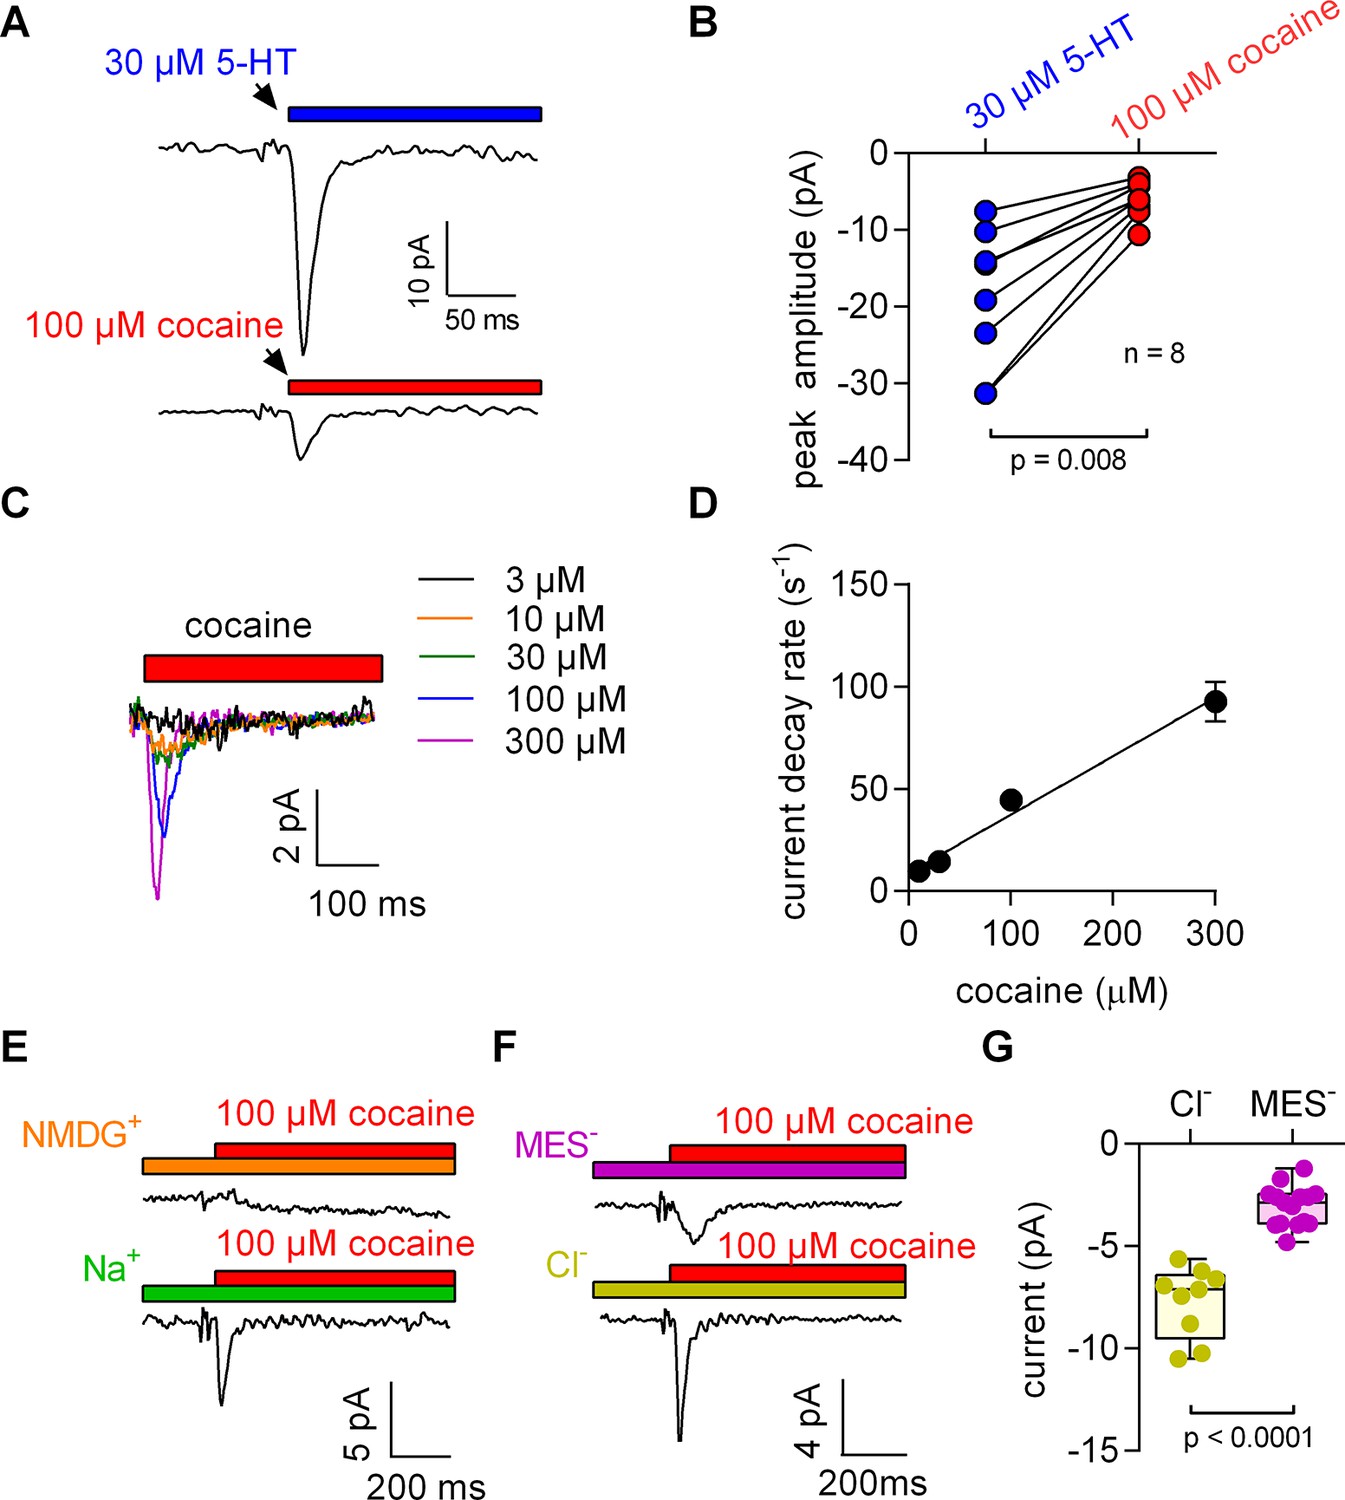
5-HT and cocaine give rise to inwardly directed peak currents when applied to HEK293 cells stably expressing SERT.
The amplitude and time constant of the decay of the cocaine-induced current are concentration dependent. (A) Representative currents from the same cell evoked by rapid application of 30 µM 5-HT (upper panel) or 100 µM cocaine (lower panel), respectively. The currents were recorded at 0 mV and in the presence of 152 mM intracellular Na+. (B) Comparison of the amplitudes of the 5-HT (blue circles) and the cocaine-induced peak current (red circles). The lines connect measurements from the same cell: 5-HT: −18.8 ± 9.1 pA; cocaine: −6.0 ± 2.4 pA; n = 8; p=0.008, Wilcoxon test. (C) Representative currents elicited by 3 µM (black), 10 µM (orange), 30 µM (green), 100 µM (blue) and 300 µM (magenta) cocaine, respectively. The depicted currents were recorded from the same cell. (D) Rate of current decay as a function of cocaine concentration. The line is a linear fit to the data points (slope: 2.9*105 ± 0.3*105 Mol−1s−1; n = 7). Data are mean ± SD. (E) In the absence of Na+, 100 µM cocaine failed to induce a peak current. Shown are representative traces in the presence of 150 mM extracellular NMDG+ (upper panel) and 150 mM extracellular Na+ (lower panel), respectively. The depicted traces were recorded from the same cell. The absence of the cocaine-induced current in the presence of NMDG+ was confirmed in seven independent experiments. (F) Representative currents in the presence of 150 mM extracellular MES- (upper panel) and 150 mM extracellular Cl- (lower panel), respectively. (G) The amplitude of the cocaine-induced current peak was −7.7 ± 1.7 pA (n = 9) and −3.1 ± 1.0 pA (n = 15) in the presence and absence of Cl-, respectively (p<0.0001; Mann-Whitney U-test). Source files are available in Figure 1—source data 1.
-
Figure 1—source data 1
Cocaine- or 5-HT-induced transient currents recorded from SERT-expressing cells for the panels indicated.
- https://doi.org/10.7554/eLife.34944.004
Figure 2
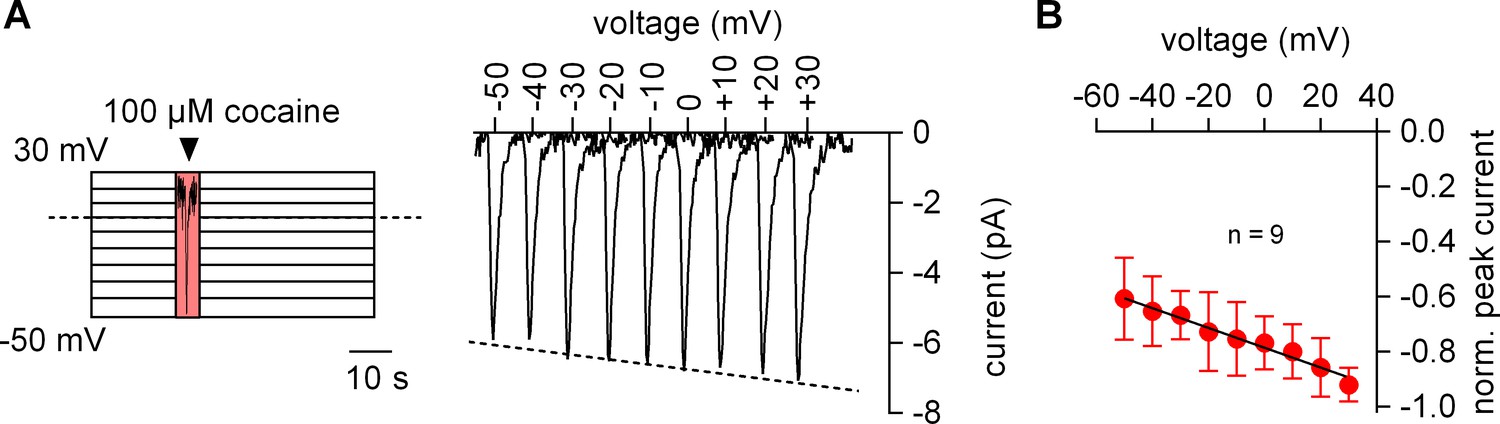
The amplitude of the cocaine peak increases at positive potentials.
(A) The scheme illustrates the protocol employed to measure the voltage dependence of the cocaine induced peak current: cells were clamped to voltages between −50 and +30 mV for 60 s, respectively. At each potential 100 µM cocaine was applied for 5 s and subsequently removed. Shown are representative currents elicited by the protocol. (B) Peak currents induced by 100 µM cocaine were normalized to the largest current (n = 9). Data are mean ±SD. The black line is a linear fit to the data points (slope = −3.5*10−3 ± 5.3*10−4/mV).
Figure 3
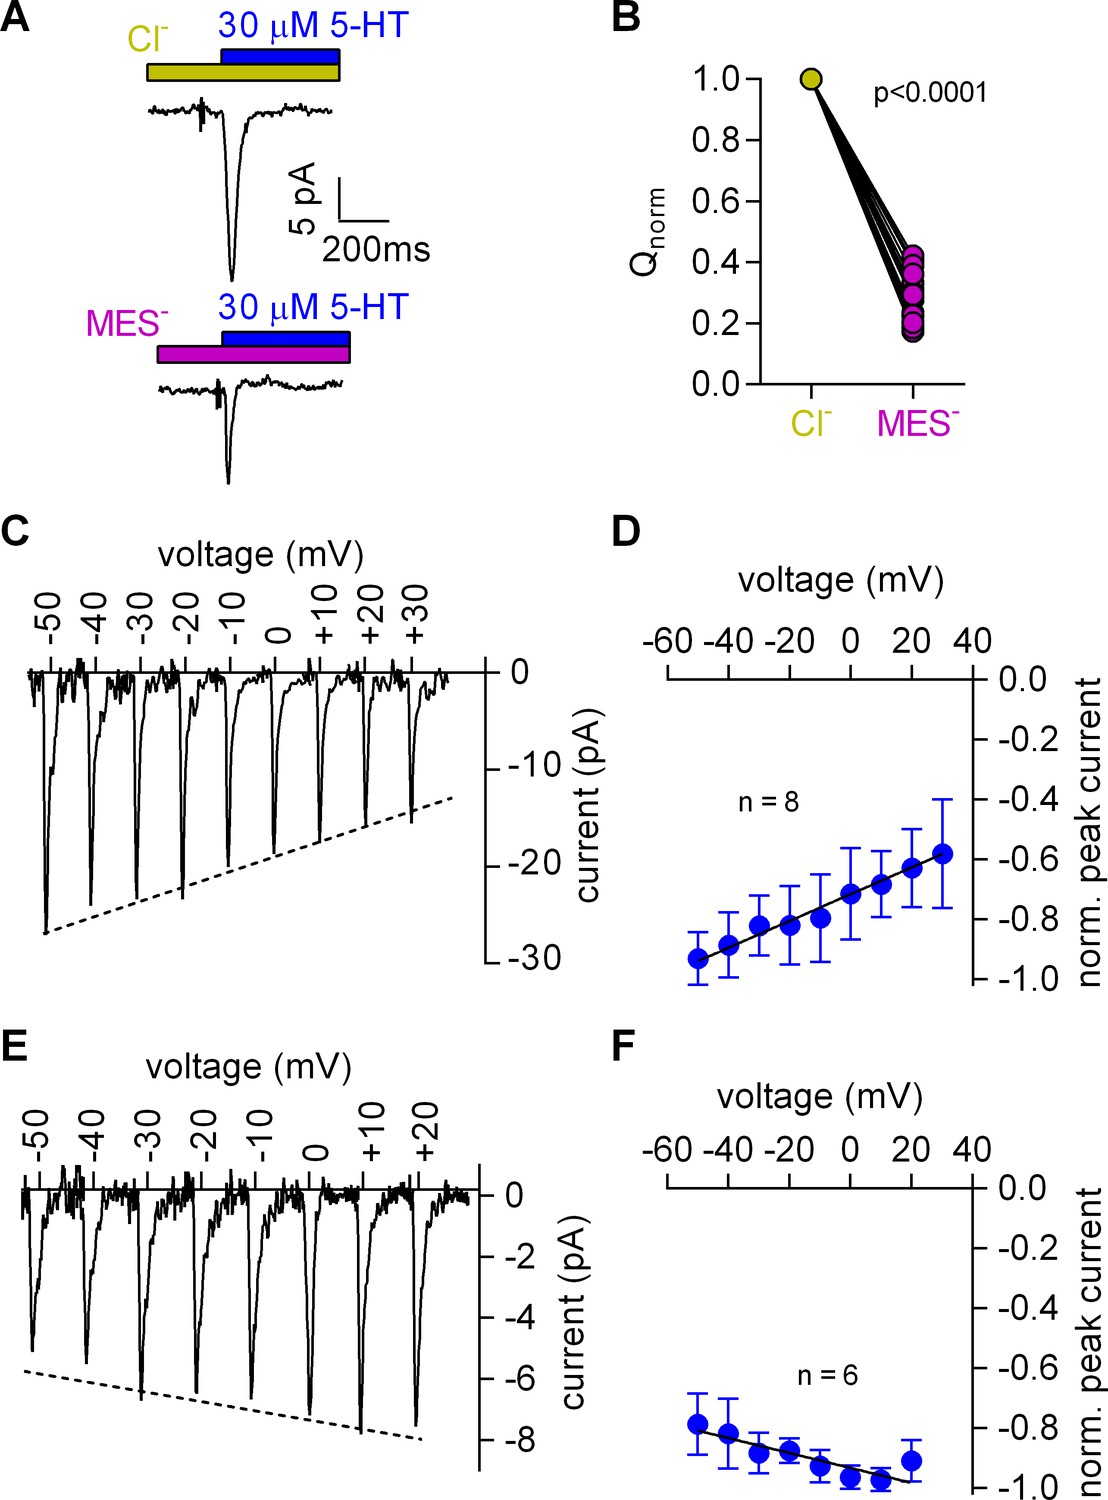
Cl- removal diminishes the amplitude of the 5-HT-induced current and reverts the slope of the voltage dependence of the peak current.
(A) Representative traces of currents evoked by 30 µM 5-HT in the presence of 150 mM extracellular Cl- (upper panel) or 150 mM MES- (lower panel) from the same cell. The cell was held at 0 mV. (B) Comparison of the normalized charge (Q) carried by the 5-HT-induced current in the presence and absence of Cl-. Connecting lines indicate measurements from the same cell. After removal of Cl- the remaining fraction of charge was 0.28 ± 0.075 (n = 20). The charge before and after Cl- removal was significantly different (p=0.0001; Wilcoxon test). (C) Representative peak currents induced by 30 µM 5-HT recorded at potentials ranging from −50 to +30 mV in the presence of 150 mM extracellular Cl-. (D) The amplitude of the 5-HT-induced peak current measured in the presence of Cl- as a function of voltage. The peak current amplitudes evoked by 30 µM 5-HT were normalized to the largest current (n = 8). Data are mean ±SD. The line is a linear fit to the data points (slope = 4.5*10−3 ± 5.4*10−4/mV). (E) Representative peak currents evoked by 30 µM 5-HT in the absence of Cl- recorded at potentials ranging from −50 to +20 mV. (F) Normalized 5-HT-induced peak currents recorded in the absence of Cl-. The peak current amplitudes were normalized to the largest current (n = 6). Data are mean ± SD. The line is a fit to the data points (slope = −2.5*10−3 ± 4.9*10−4/mV).
Figure 4 with 1 supplement
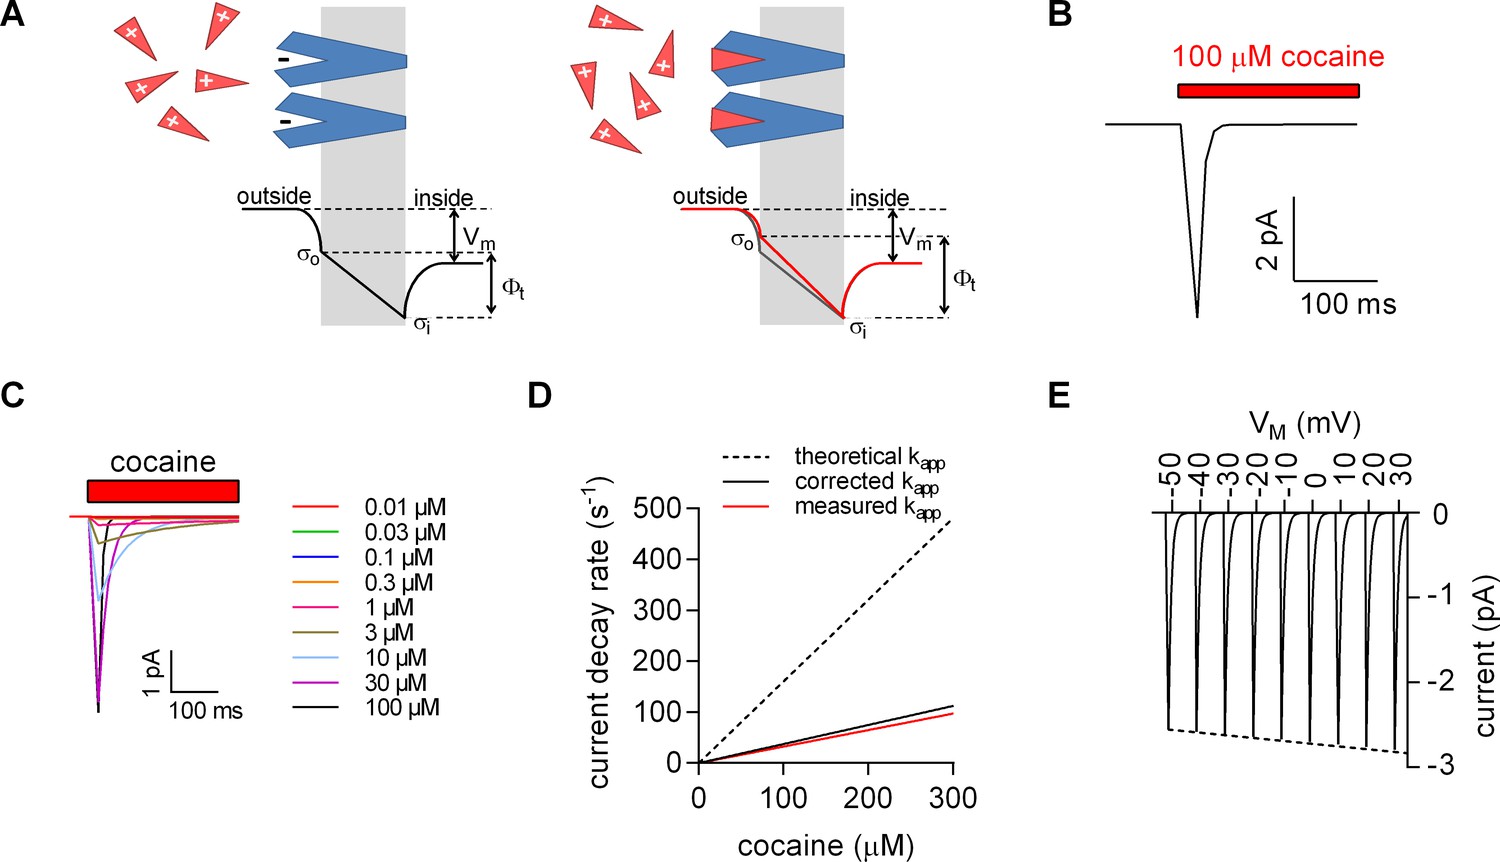
Model for ligand-induced surface charge elimination.
(A) Scheme of a membrane (grey slab) with embedded transporters (in blue) and ligands (red triangles). The ligand is positively charged and the binding site on the protein comprises a negative charge (left panel). Upon binding, the ligand neutralizes the charge on the protein (right panel). The lines in the left (in black) and right panels (in red) indicate voltage profiles across the membrane. Binding of the ligand to the negative surface charge on the protein renders the outer surface charge potential more positive. This produces a change in transmembrane voltage (∆). (B) Displacement current predicted by the Gouy-Chapman model. The instantaneous current is calculated as: i(t)=CM ∙ dv(t) ∙ d(t)−1, where CM is the capacitance of the membrane and v(t)= ∙ (1-e-kapp*t); kapp is the apparent rate of cocaine association (kapp=kon ∙ [cocaine]+koff). Shown is a simulated current evoked by application of 100 µM cocaine. (C) Simulated currents at the indicated cocaine concentrations. (D) Predicted rates of the current decays of the cocaine peaks as a function of the cocaine concentration (dashed line). The solid red line in the plot indicates measured rates from Figure 2B. The black solid line indicates the corrected rates (see Materials and methods, section ‘Modeled and measured apparent association rates (kapp) of cocaine’). (E) Simulated voltage dependence of the cocaine peak. The current-voltage relation has a negative slope (slope= -1.1*10−3 ± 1.4*10−5/mV).
Figure 4—figure supplement 1
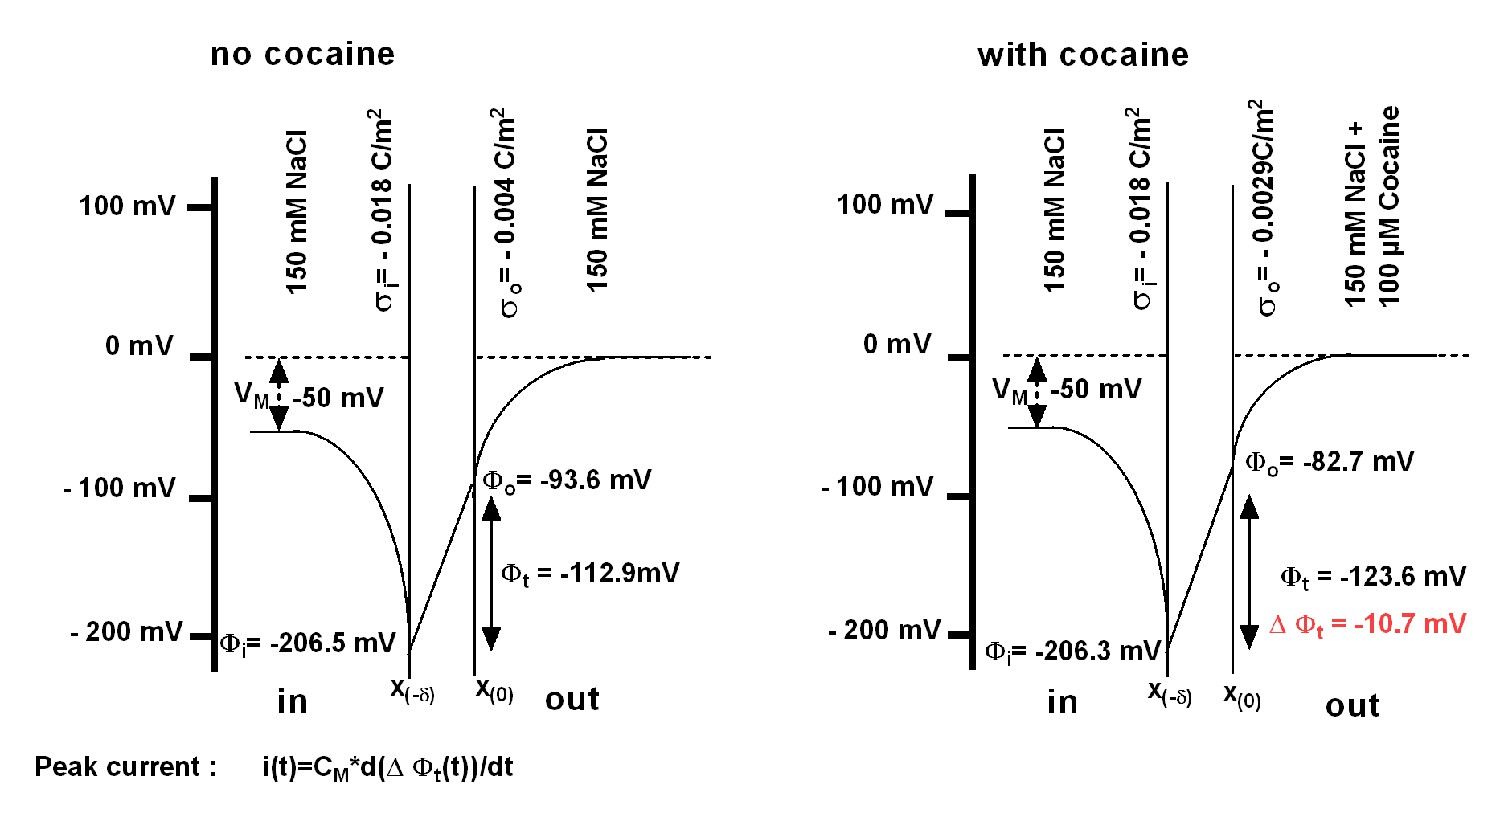
Schematic representation of the voltage across the membrane as predicted from the Gouy-Chapman model.
There is a steep increase in (negative) voltage when approaching the membrane from the bulk solution. This is seen on both sides of the membrane and results from the immobilized charges on the inner and outer surface. Ligand binding (i.e. binding of cocaine) induces a change in surface charge density, resulting in a change in the transmembrane voltage (), the magnitude of which is illustrated in the right-hand scheme. This gives rise to a transient current i(t) ("peak current"), which can be calculated from the corresponding equation. The parameters used for the model are provided in Supplementary file 1.
Figure 5 with 2 supplements
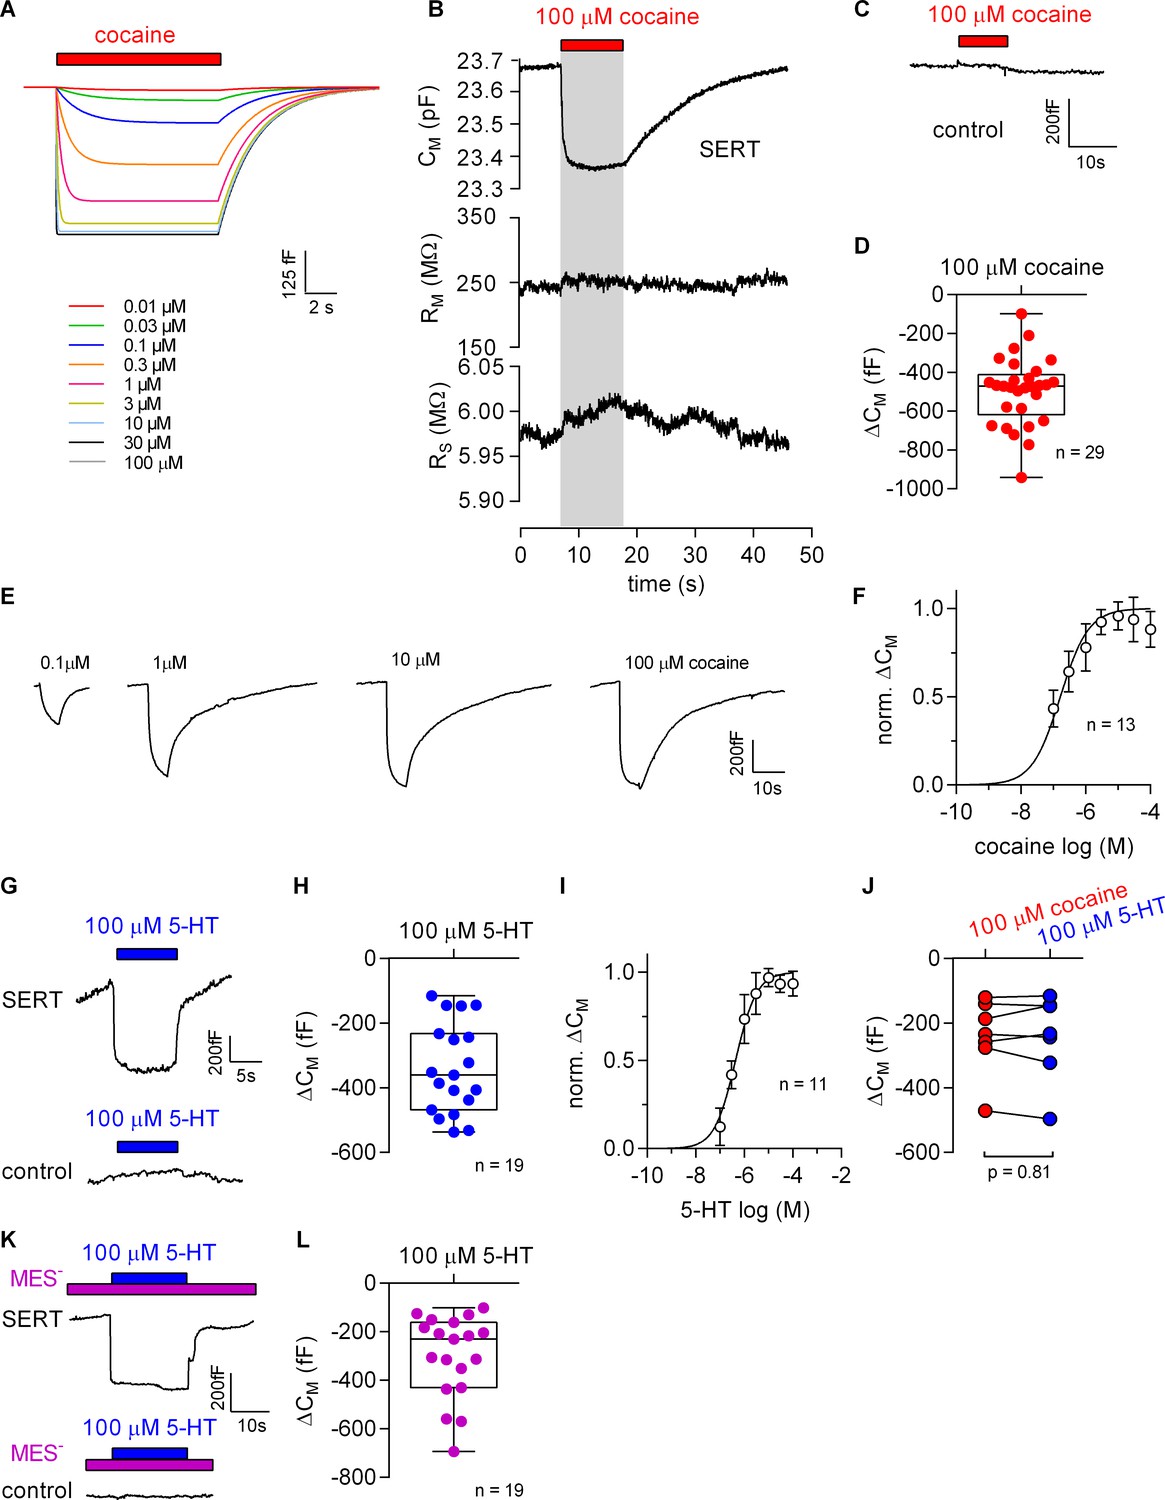
Cocaine and 5-HT binding to SERT results in a reduction of apparent membrane capacitance.
(A) Predicted change in CM by binding of cocaine by the Gouy-Chapman model. The traces are the simulated response to the indicated cocaine concentrations. (B) Representative change in capacitance recorded in the presence of 100 µM cocaine in a SERT-expressing cell. Also shown are the other circuit parameters, RM and RS derived from the same recording. (C) Cocaine did not change CM in control cells. (D) Plot of the change (ΔCM) induced by 100 µM cocaine (n = 29; ΔCM = −495 ± 175 fF). (E) Representative traces of the cocaine-induced apparent reduction in capacitance at the indicated concentrations. The recordings are from the same cell. (F) Concentration-response curve for the cocaine-induced change in membrane capacitance (n = 13), which was normalized to the maximal cocaine-induced ΔCM. Data are mean ± SD. The solid line was generated by fitting the data to a rectangular hyperbola yielding an EC50 = 164 ± 41 nM. (G) Representative change in capacitance elicited by 100 µM 5-HT in a SERT-expressing cell and in a control cell. (H) Plot of the change (ΔCM) induced by 100 µM 5-HT (n = 19, ΔCM = −340 ± 140 fF). (I) Concentration-response curve for the 5-HT-induced change in CM (n = 11), which was normalized to the largest change in capacitance. Data are mean ± SD. The solid line was generated by fitting the data to a rectangular hyperbola yielding an EC50 = 0.4 ± 0.1 µM. (J) Comparison of the response to 100 µM cocaine and 100 µM 5-HT, respectively (n = 8). The lines connect measured values from the same cell. The data are not significantly different (p=0.81; Wilcoxon test). (K) Representative change in capacitance elicited by 100 µM 5-HT in the absence of extracellular Cl- in SERT-expressing cells and control cells. (L) Plot of the change (ΔCM) induced by 100 µM 5-HT in the absence of extracellular Cl- (n = 19, ΔCM = −299 ± 170 fF). Two-group comparison of 5-HT-induced ΔCM in the presence and absence of extracellular Cl- revealed no significant difference (p=0.27, Mann-Whitney U-test). Source files are available in Figure 5—source data 1.
-
Figure 5—source data 1
Cocaine- or 5-HT-induced apparent changes in capacitance recorded from SERT-expressing cells for the panels indicated.
- https://doi.org/10.7554/eLife.34944.012
Figure 5—figure supplement 1
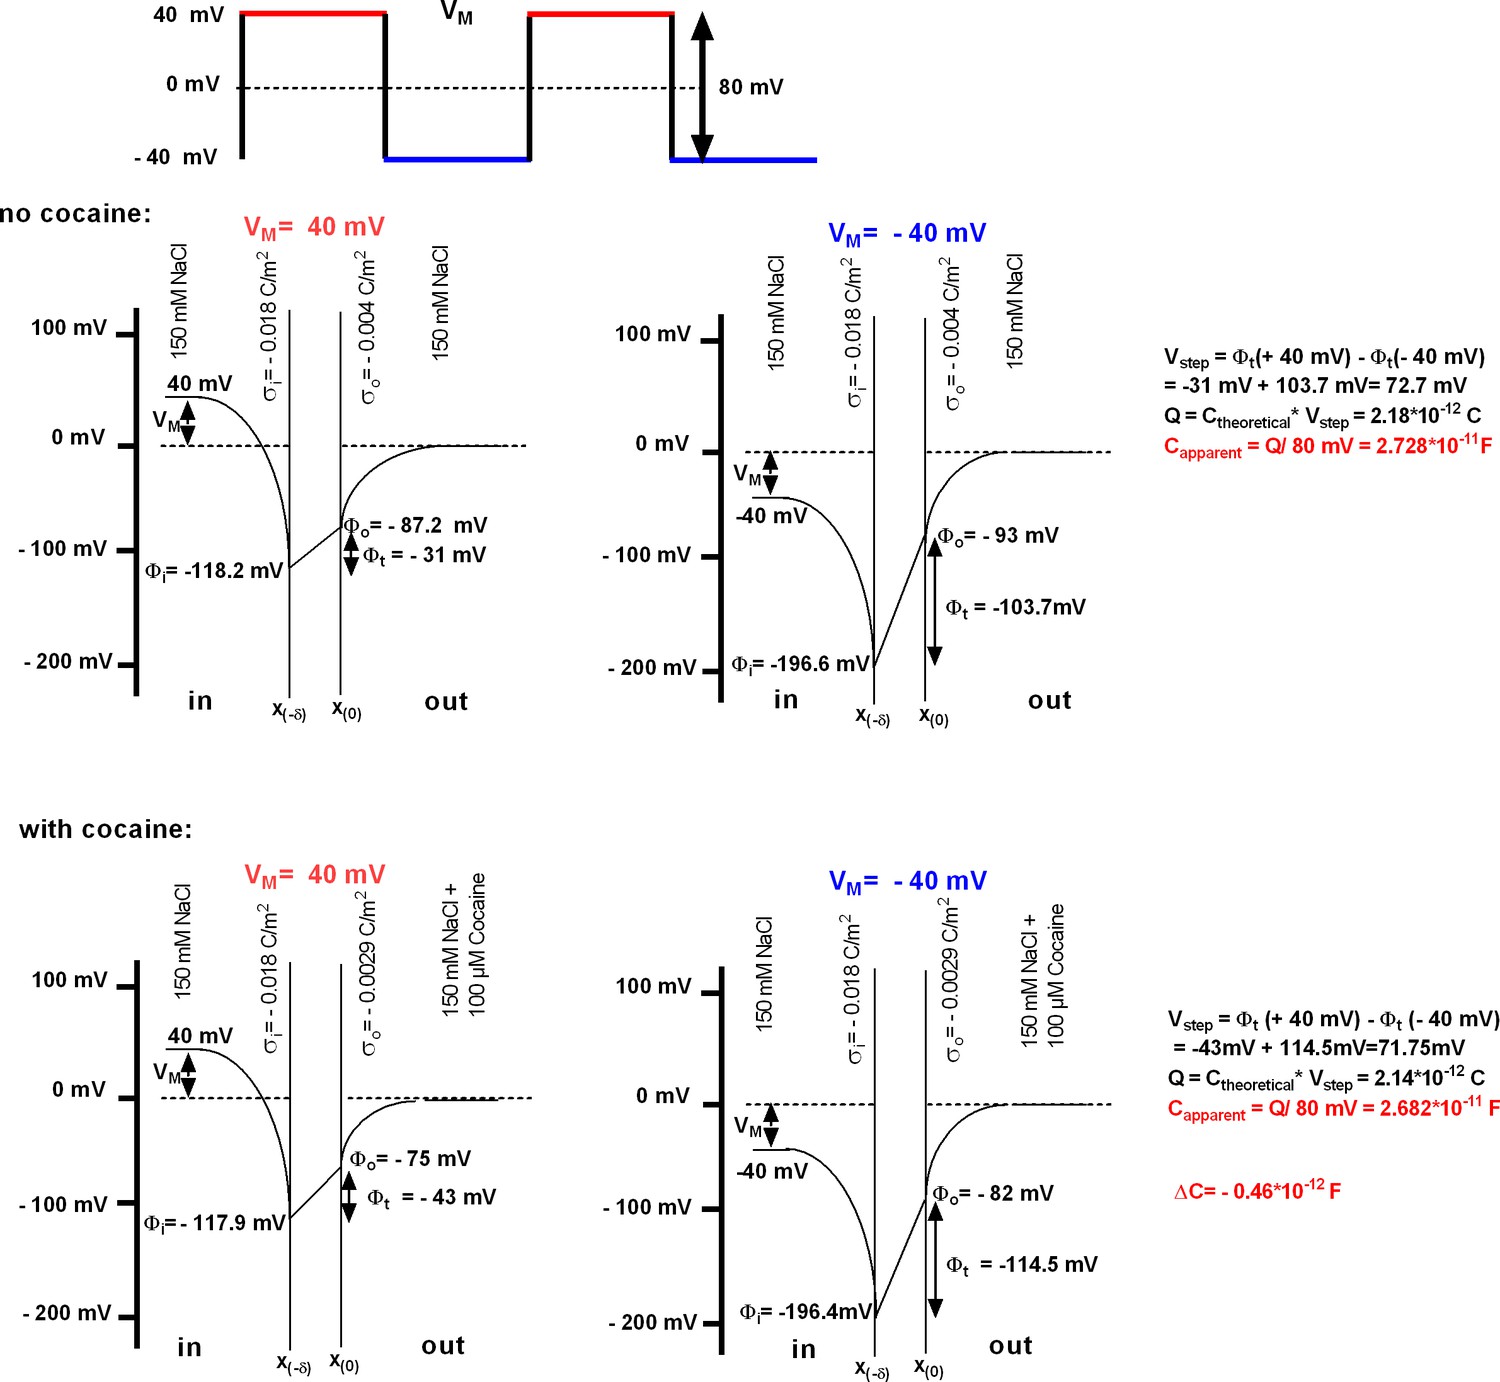
Modeling of the ligand-induced change in membrane capacitance.
The rectangular square pulses give rise to a current, which allows for estimating membrane capacitance by extracting the difference (Vstep) between the transmembrane voltages at the two holding voltages (here −40 and +40 mV). This voltage differs from the nominal voltage step. The associated charges (Q) can be calculated by multiplying the theoretical capacitance (Ctheoretical) with Vstep. The apparent membrane capacitance (Capparent) is derived from Q by a division with the nominal voltage step (applied by the patch-clamp amplifier, in this case 80 mV). The bottom panels illustrate how the cocaine-induced increase in positive charges on the outer surface translates into the change in capacitance. The parameters used are provided in Supplementary file 1.
Figure 5—figure supplement 2
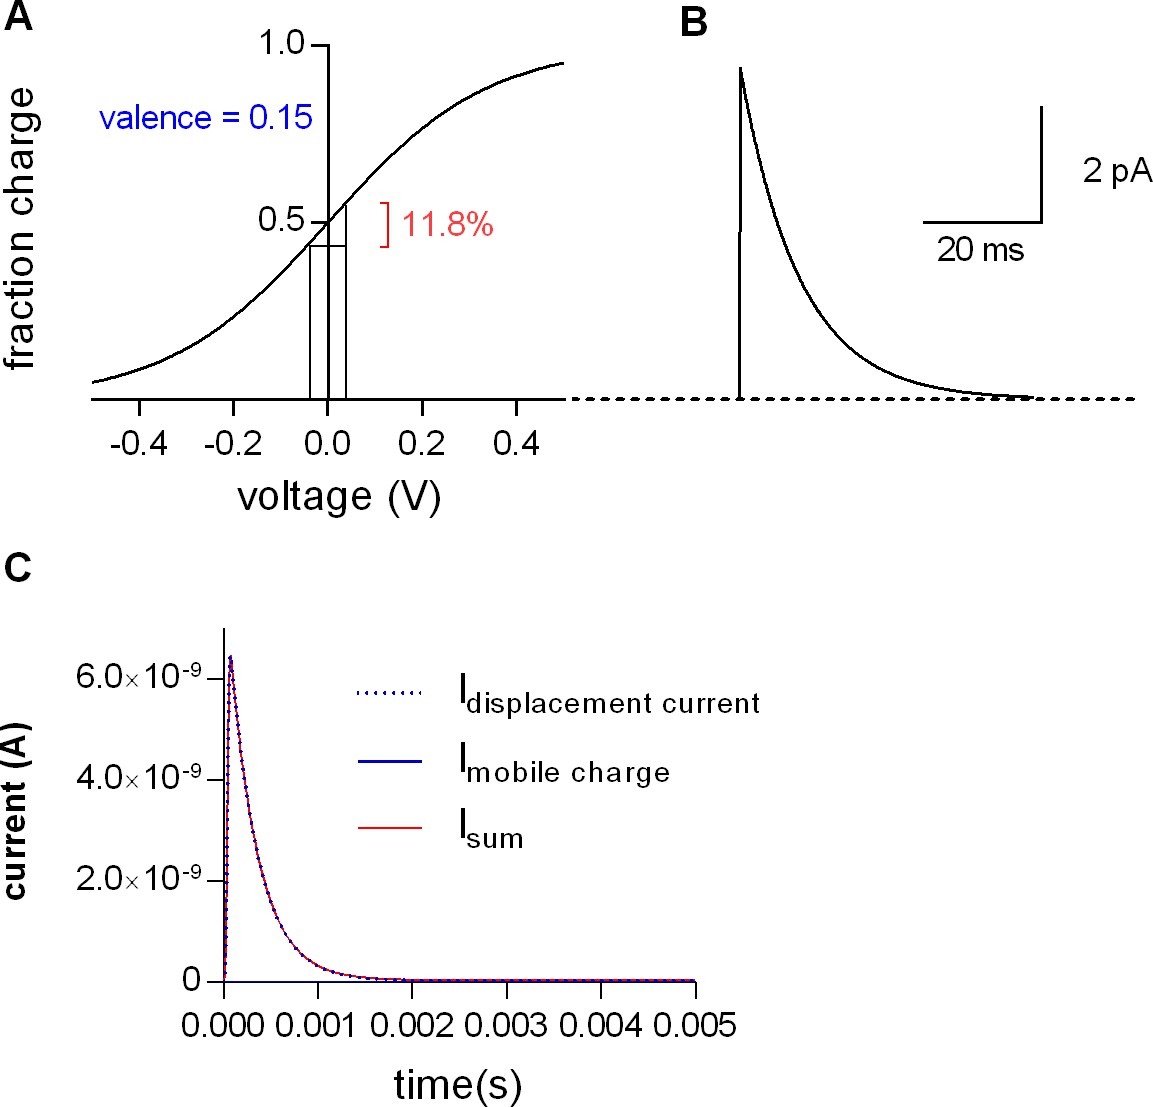
Mobile charges of SERT do not affect the measurements of membrane capacitance.
(A) Simulated voltage dependence of mobile charges in SERT, as predicted by a simple two-state model. The valence of the mobile charge is 0.15 (Hasenhuetl et al., 2016), V0.5 was set to 0 mV. Shown in red is the maximal percentage of the total charge (11.8%) moved by a 80 mV voltage step (=voltage step used in the protocol to measure the membrane capacitance). (B) Simulated charge movement upon an 80 mV voltage step, assuming 2.107 transporters/cell and a transition rate of 100 s−1 (Hasenhuetl et al., 2016). The displayed trace is a convolution of the simulated current with the measured impulse response function of the patch-clamp amplifier. The initial amplitude of the simulated current is around 5 pA. (C) The blue dotted line is the simulated current response (=displacement current) of the equivalent circuit shown in Figure 9 to a step pulse from - 40 to +40 mV. The following circuit parameters were chosen: CM = 30 pF, RS = 107 Ohm, RM = 109 Ohm. The current response shown is the convolution of the simulated displacement current with the impulse response function of the patch-clamp amplifier. The blue line shows the simulated current produced by mobile charges of SERT, which is not visible at this scaling. The red line is the sum of the displacement current and the current produced by the mobile charge. Because the latter is so small the current is not changed to any appreciable extent by mobile charges of SERT moving in response to a voltage change.
Figure 6 with 1 supplement
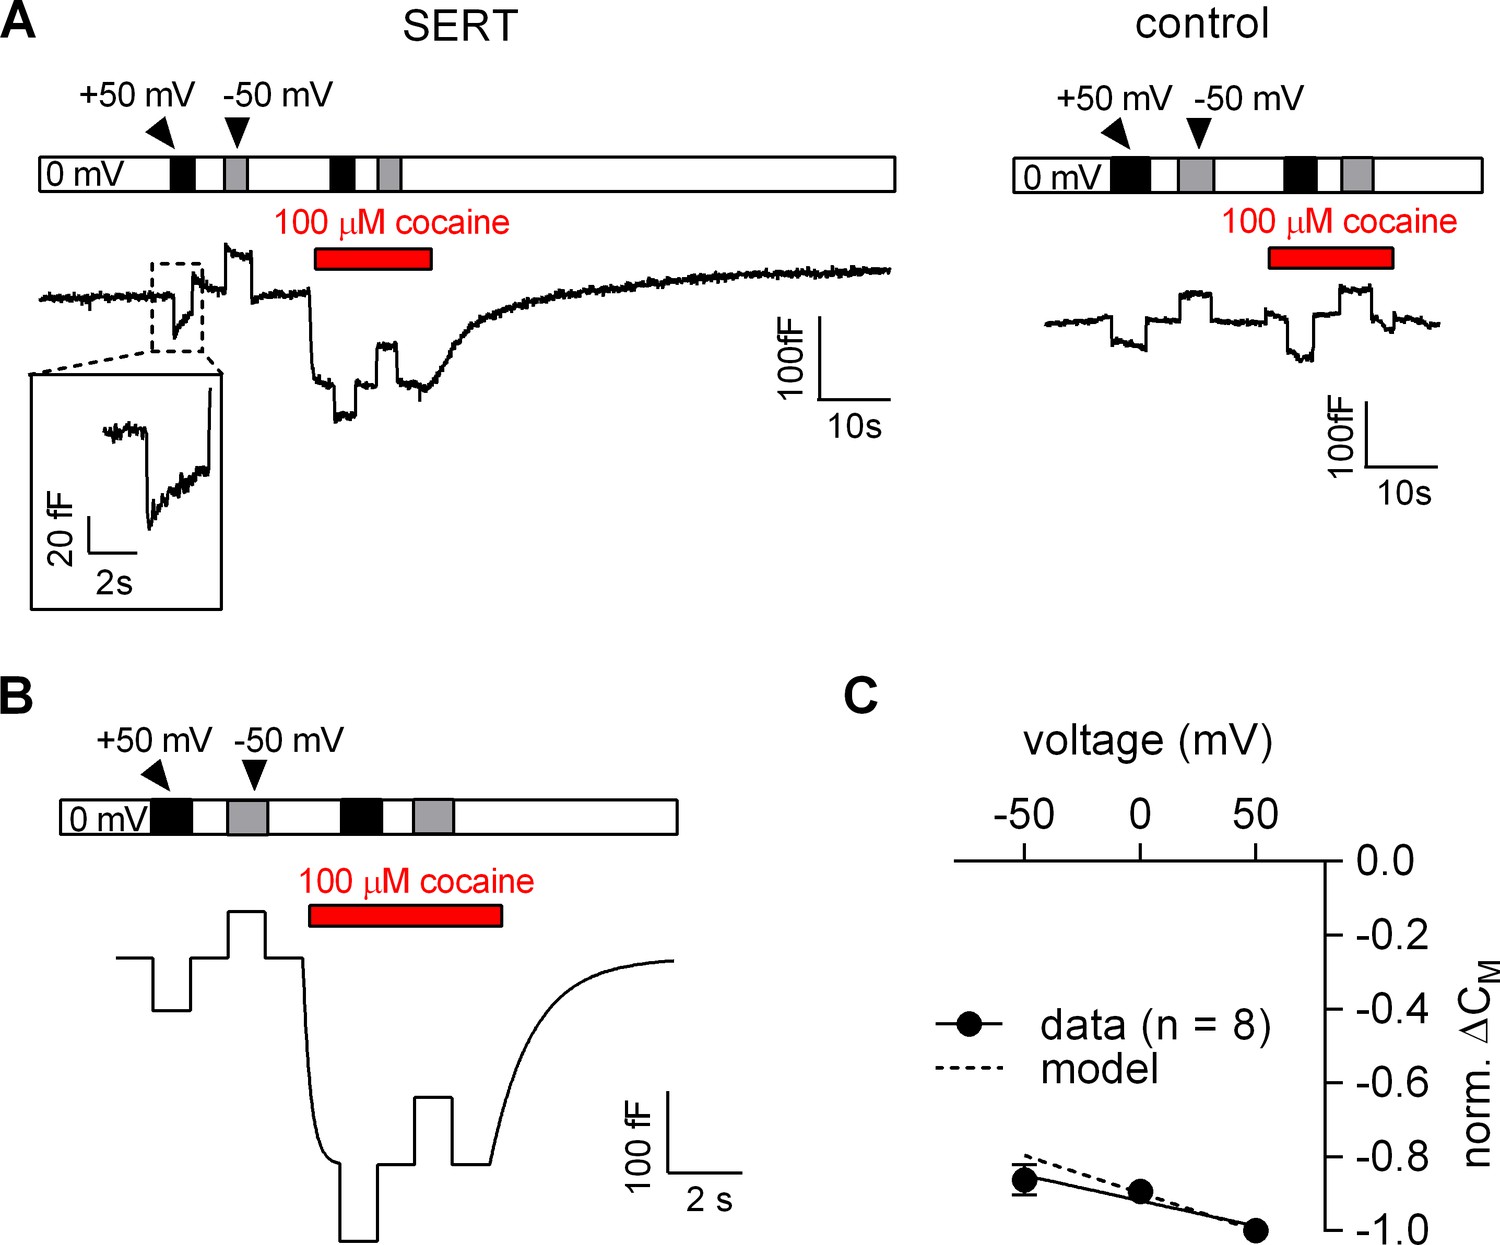
Voltage dependence of the reduction in apparent membrane capacitance by cocaine.
(A) The capacitance was recorded in a SERT-expressing cell (left panel) and in a control cell (right panel). The holding potential was changed to +50 or −50 mV as shown by the bar in the absence and presence of 100 µM cocaine. (B) The experiment in the left panel in Figure 6A was simulated by a model based on the Gouy-Chapman equation. (C) The capacitance was recorded as outlined in Figure 6B (-50 mV, 0 mV and 50 mV) and the cocaine-induced change was normalized by setting the amplitude of the capacitance change at +50 mV to −1. Data are means ± SD (n = 6). The solid line was drawn by linear regressions (slope = −1.4*10−3 ± 1.7*10−4/mV). The dashed line indicates the voltage dependence of the cocaine-induced capacitance change predicted by the Gouy-Chapman model.
Figure 6—figure supplement 1
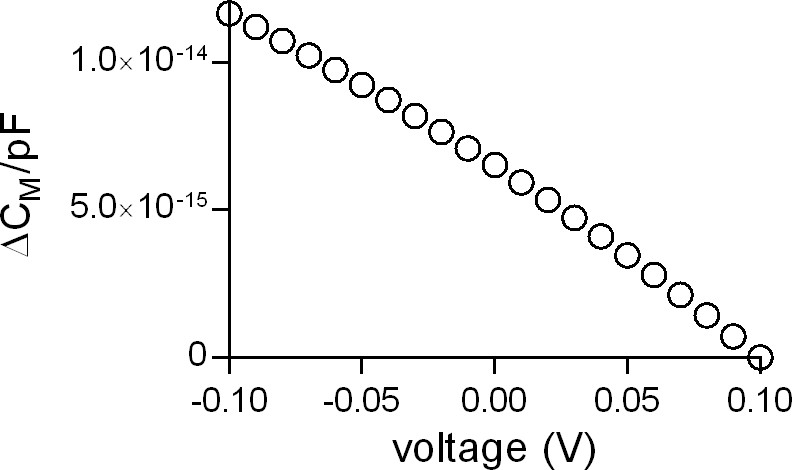
Voltage dependence of the apparent membrane capacitance as predicted by the Gouy-Chapman model.
The simulated data show the change in apparent membrane capacitance in the voltage range from −100 to +100 mV. The change is displayed as ∆CM/picoFarad (1pF corresponding to an area of ~10−10 m2). For the simulation we assumed the presence of 150 mM of a monovalent cation and 150 mM of a monovalent anion in the bulk solutions on both sites of the membrane. The charge densities at the inner and outer membrane surface were set to the values measured by Zhang and co-workers (2001) (−0.018 C/m2 and −0.005 C/m2, respectively). The cell membrane capacitance is composed of a voltage-independent component that reflects the lipid bilayer and a voltage-dependent component that originates primarily from voltage-dependent proteins in the plasma membrane (e.g. voltage-gated ion channels). The latter varies with the level of expression and the valence of the involved mobile charges. In excitable cells (e.g. cardiac myocytes) the voltage-dependent component accounts up to 10% of the total membrane capacitance (Novák and Zahradník, 2006). In contrast, in non-excitable cells (like HEK293 cells) the voltage-dependent component adds less than 1% to the total CM (Farrell et al., 2006). The membrane capacitance in HEK293 cells was shown to be of parabolic shape with higher values at more negative potentials and a minimal value around +50 mV (Farrell et al., 2006). Our data are in agreement with this report. According to Farrell et al. (Farrell et al., 2006), the voltage-dependent component in HEK293 cells originates from electromechanical coupling (i.e. electrostriction). Their analysis revealed a quadratic component (attributed to electrostriction) and a linear component, which was found to be the dominant component in 60% of the measured cells in the voltage range from −0.09 to +0.1 V. The Gouy-Chapman model predicts the linear voltage-dependence in this voltage range. Hence, we surmise that the Gouy-Chapman model explains the linear component observed by Farrell et al. (Farrell et al., 2006): the observed linear capacitance change with voltage is an apparent change, which arises because of the dependence of Фt (=voltage difference between the inner and outer membrane surface) on VM (voltage difference between inner and outer bulk solution). This is evident from an inspection of the equation of the Gouy-Chapman model (see Materials and methods).
Figure 7 with 1 supplement
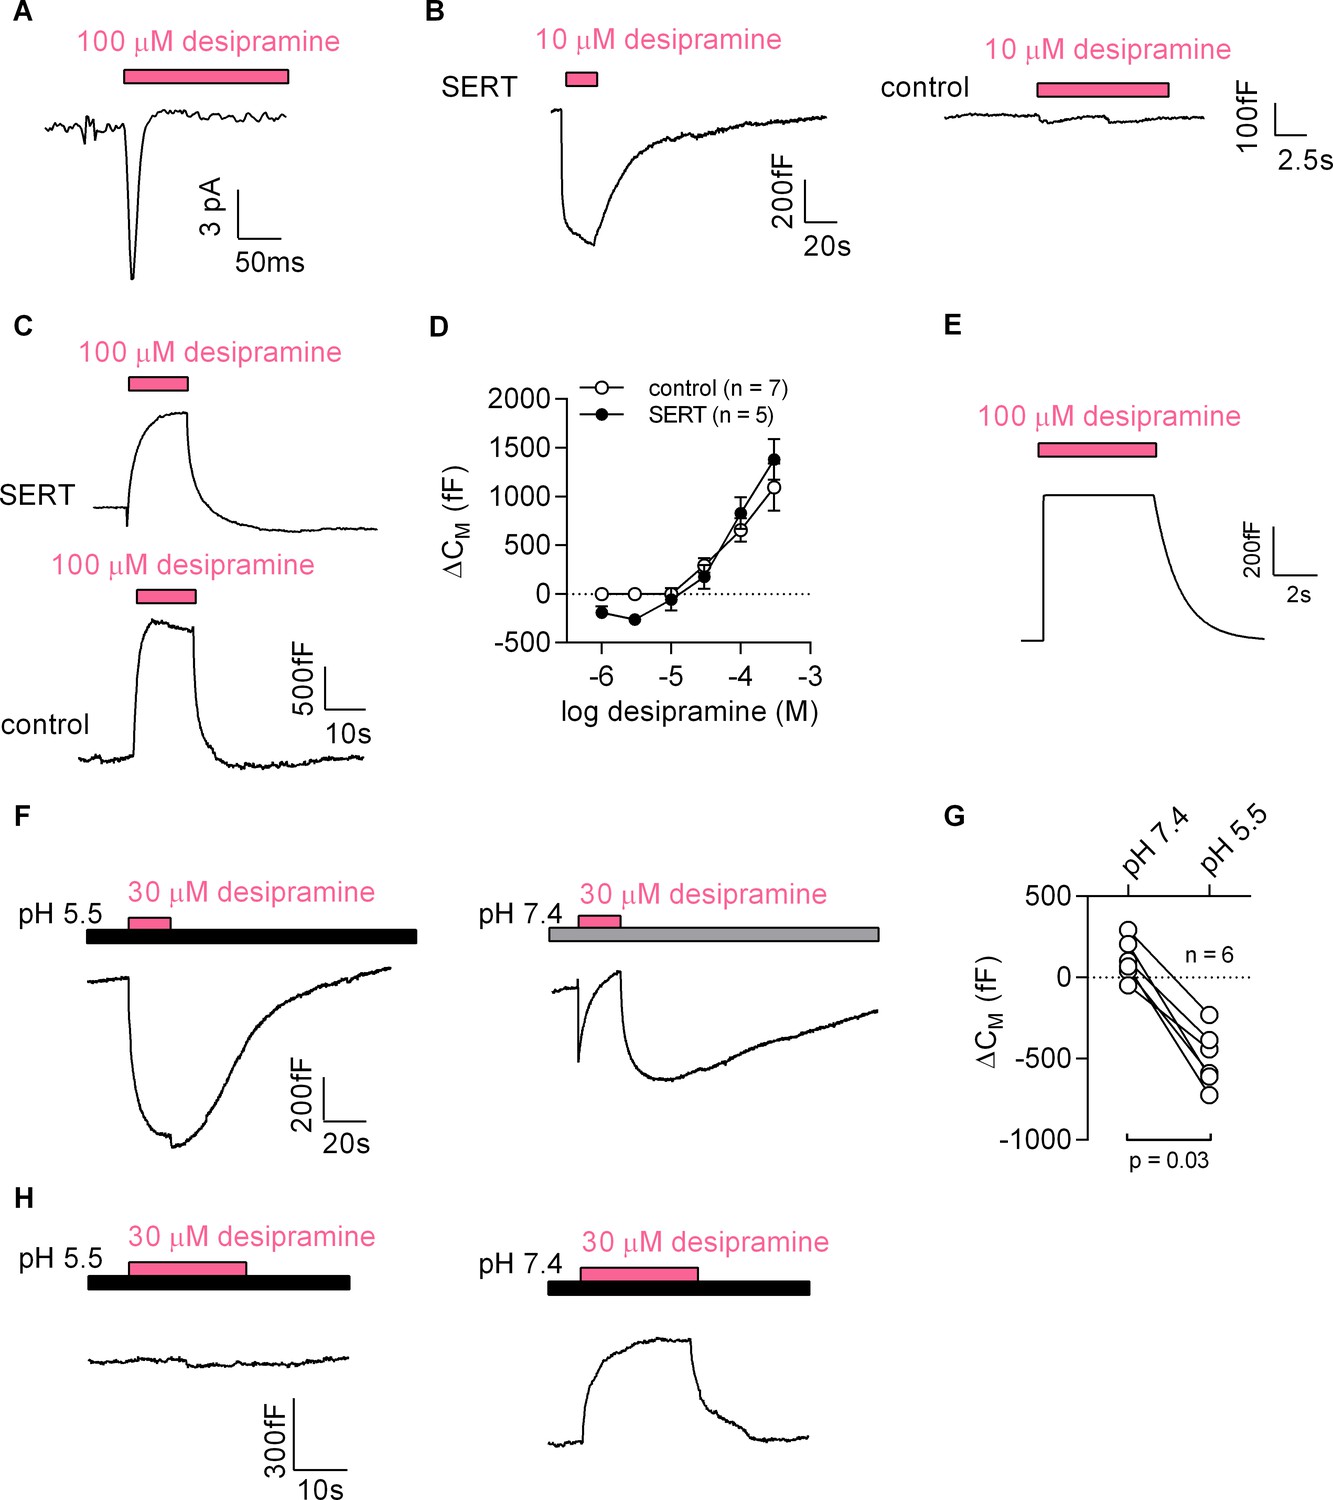
Desipramine binds to SERT at low concentrations and changes the surface charge density at the inner leaflet of the membrane at high concentrations.
(A) Representative displacement current evoked by the application of 100 µM desipramine to a SERT-expressing cell. (B) Application of 10 µM desipramine resulted in a reduction of CM in a cell overexpressing SERT (left panel) but not in control cells (right panel). (C) Application of 100 µM desipramine gave rise to an apparent increase in CM in both SERT-expressing cells and control cells. (D) Concentration-dependence of the desipramine-induced change in capacitance (ΔCM) in SERT-expressing cells and in control cells. Data are means ±SD (control: n = 7, SERT: n = 5). (E) Simulated change in capacitance upon ligand adsorption to the intracellular membrane surface. (F) Representative capacitance change in SERT-expressing cells in response to 30 µM desipramine at pH 5.5 (left panel) and at pH 7.4 (right panel). (G) Comparison of ΔCM upon application of 30 µM desipramine at pH 7.4 and pH 5.5. The lines connect data recorded in the same cell: pH 7.4: 111 ± 122 fF; pH 5.5: −496 ± 179 fF; n = 6; p=0.03, Wilcoxon test. (H) Representative capacitance change in response to 30 µM desipramine at pH 5.5 (left panel) and at pH 7.4 (right panel) in a control cell. Paired measurements in seven control cells showed no change upon application of 30 µM desipramine at pH 5.5, and a change of 332 ± 68 fF at pH 7.4 (data not shown).
Figure 7—figure supplement 1
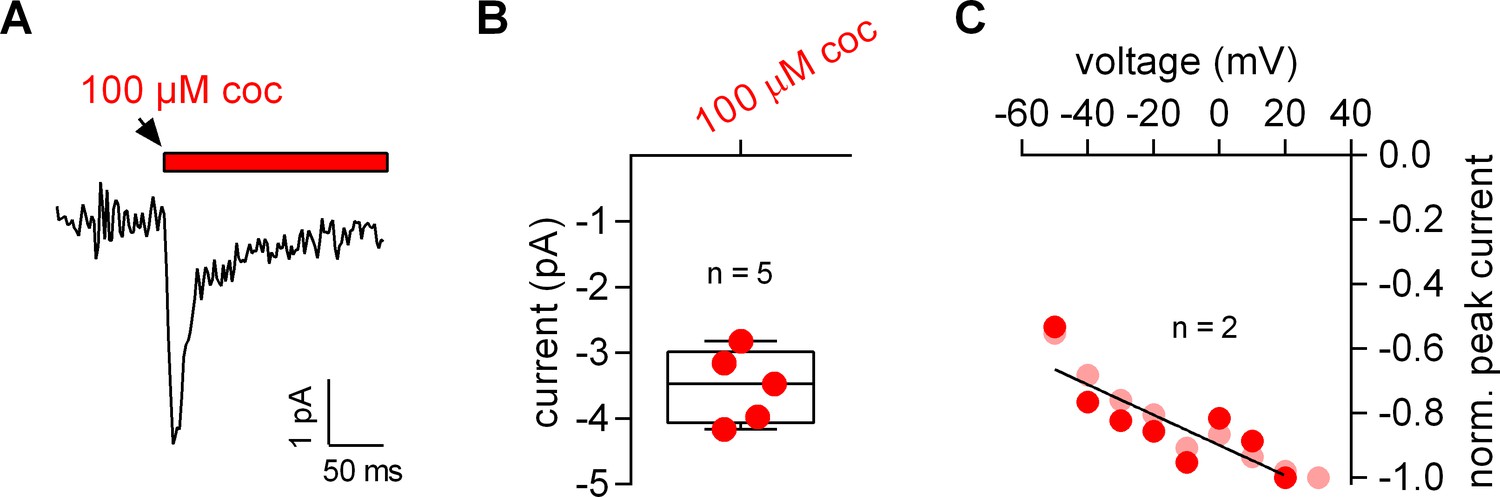
Cocaine-induced displacement currents recorded from HEK293 cells expressing the dopamine transporter.
(A) Representative current evoked by application of 100 μM cocaine. (B) Plot of the current amplitude (pA) induced by 100 µM cocaine (−3.5 ± 0.6 pA; n = 5). (C) Peak currents induced by 100 µM cocaine were normalized to the corresponding largest current and plotted as a function of voltage. Data of two individual cells are shown. The black line is a linear fit to the data points (slope = −4.7*10–3 ± 1.3*10–3/mV).
Figure 8
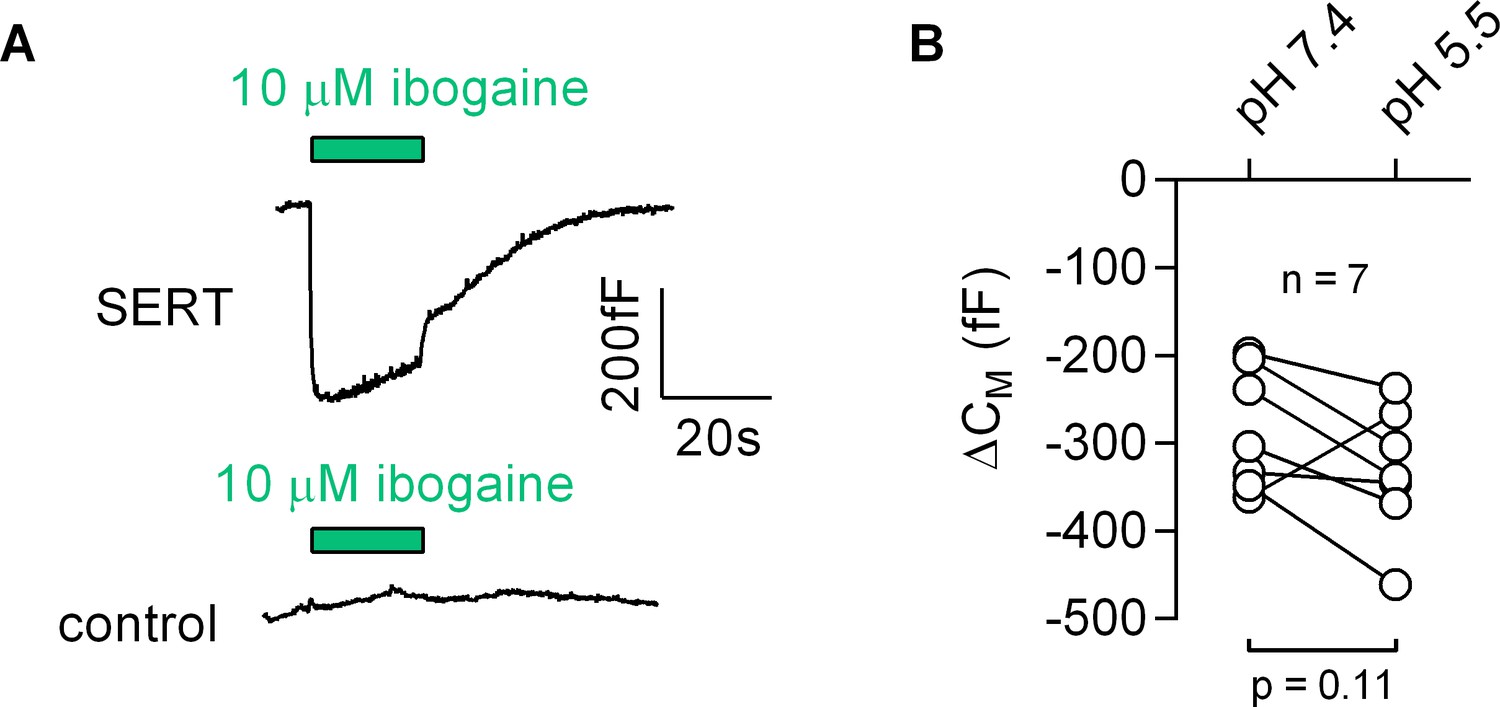
Ibogaine binds to an extracellular site of SERT.
(A) Representative capacitance change induced by 10 µM ibogaine in a SERT-expressing cell (upper panel) and a recording in a control cell (lower panel). (B) A comparison of the ibogaine-induced reduction in CM at pH 7.2 and 5.5. The lines connect data points measured in the same cell (n = 7). The capacitance changes were 283 ± 70 fF and 331 ± 73 fF at pH 7.4 and pH 5.5, respectively (means ±S.D.). These values were not significantly different (p=0.11; Wilcoxon test).
Figure 9
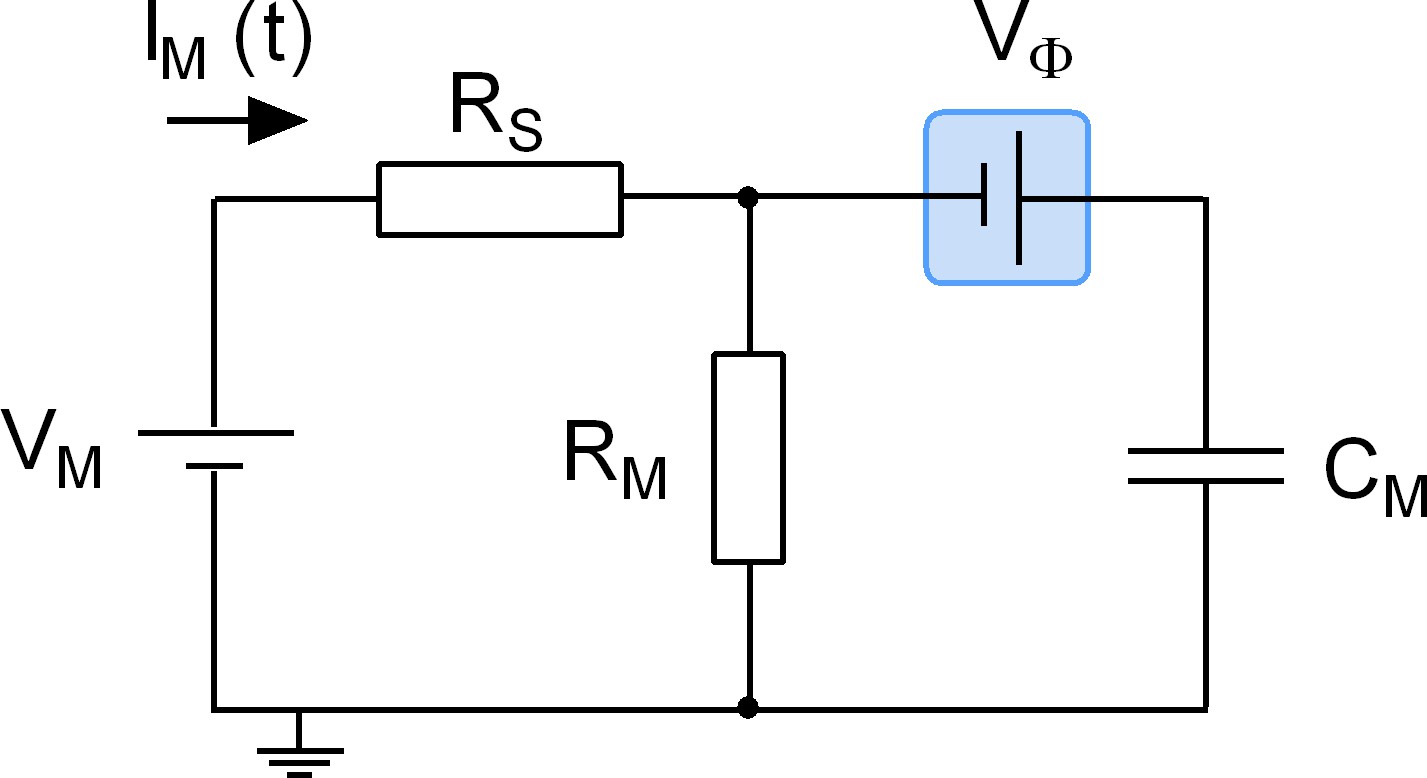
Equivalent circuit of the cell.
The battery denoted VM accounts for the difference in potential between the intra- and extracellular bulk solutions. RS is the access resistance of the patch electrode, RM is the electrical resistance of the membrane and CM is the electrical capacitance thereof. Highlighted in blue is a second battery denoted by VФ. This battery accounts for the potential difference created by the asymmetry in the intra- and extracellular surface charge densities and is the element in the circuit, which is affected by charged ligand adsorption.
Additional files
-
Supplementary file 1
Table of model parameters.
- https://doi.org/10.7554/eLife.34944.019
-
Transparent reporting form
- https://doi.org/10.7554/eLife.34944.020
Download links
A two-part list of links to download the article, or parts of the article, in various formats.
Downloads (link to download the article as PDF)
Open citations (links to open the citations from this article in various online reference manager services)
Cite this article (links to download the citations from this article in formats compatible with various reference manager tools)
A label-free approach to detect ligand binding to cell surface proteins in real time
eLife 7:e34944.
https://doi.org/10.7554/eLife.34944


