Endogenous opioids in the nucleus accumbens promote approach to high-fat food in the absence of caloric need
- Albert Einstein College of Medicine, United States
Figures
Figure 1 with 2 supplements
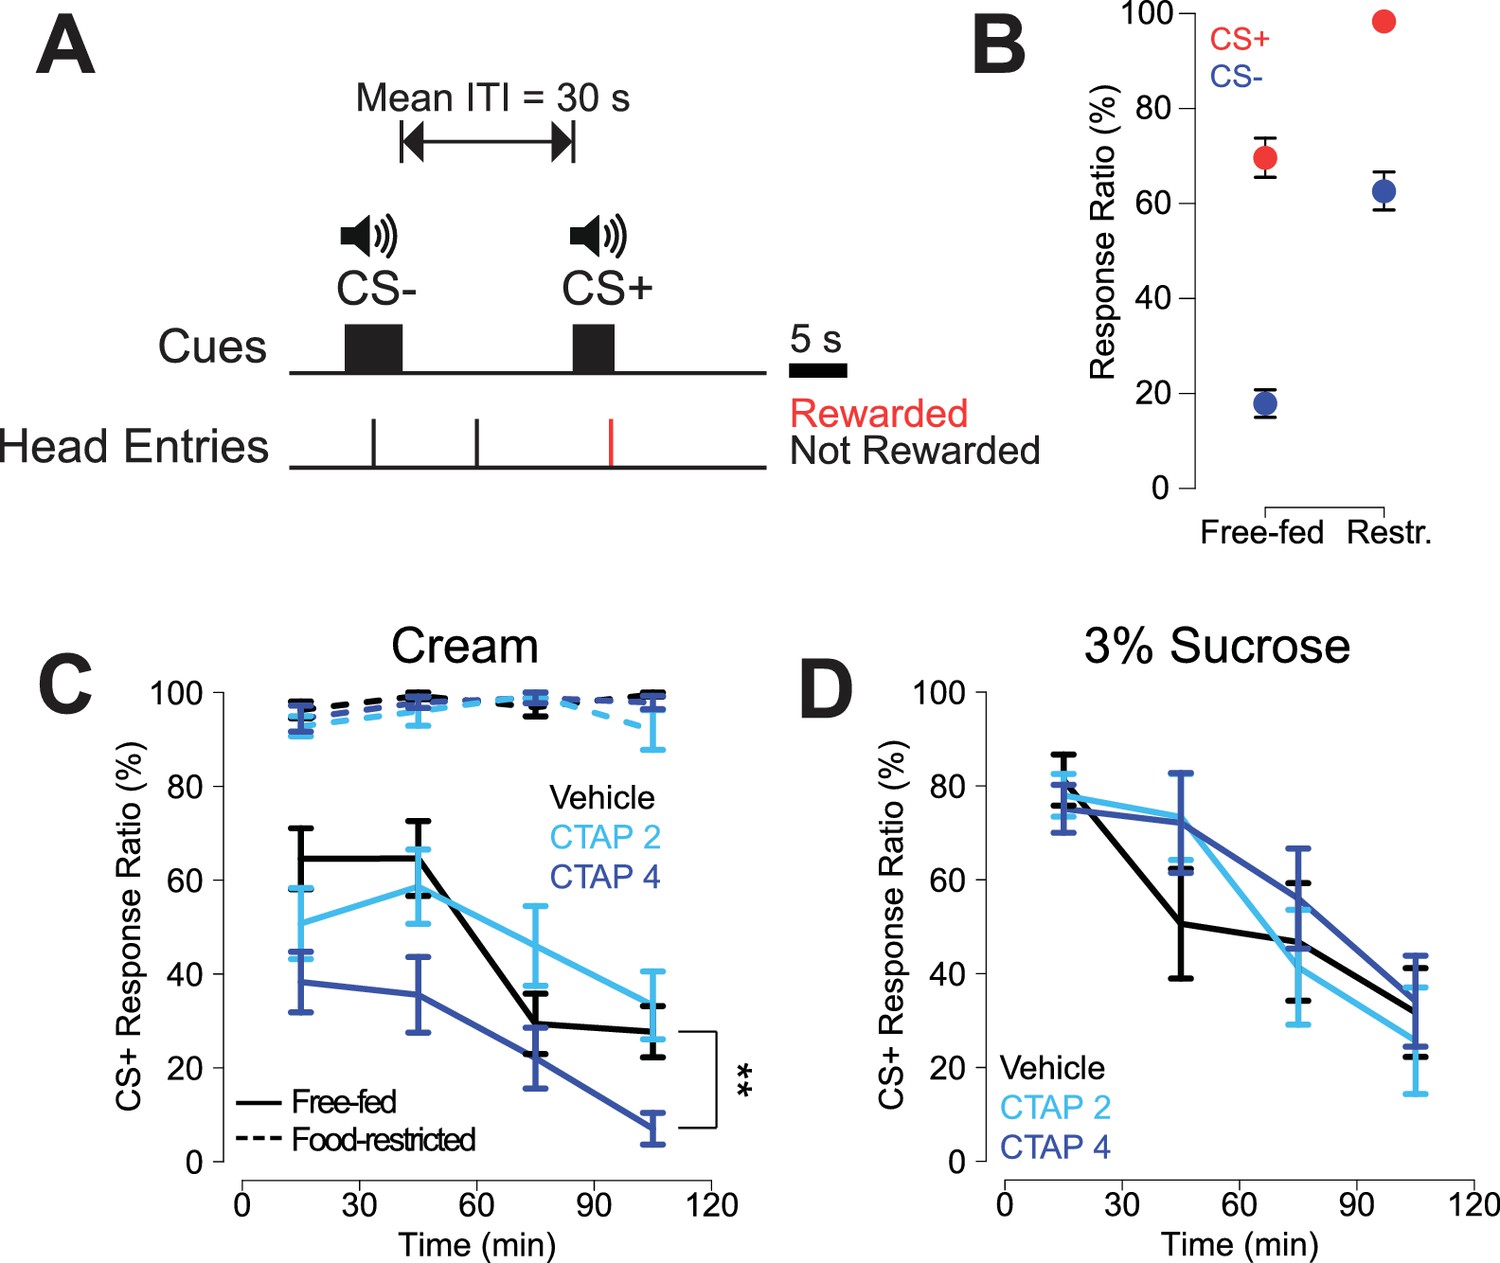
CTAP-induced impairment of cued approach behavior is observed in free-fed animals receiving cream reward, but not in food-restricted animals or those receiving sucrose reward.
(A) CS task diagram. Only head entries into the receptacle during CS+ presentation are rewarded, at which point the cue is terminated. (B) Response ratios for each cue type on the final day of retraining before the microinjection experiment began. For each cue type, response ratio is defined as the proportion of cues responded to out of the number of cues presented. Food-restricted rats (N = 7, right) responded more to both the CS+ (red dots) and the CS- (blue dots) than free-fed rats (N = 16, left); ***p<0.001, Wilcoxon. (C) Bilateral CTAP (4 µg/side) injection into the NAc reduced CS+ response ratio in free-fed (solid lines), but not food-restricted rats (dashed lines). A two-factor ANOVA (time x dose) performed on free-fed rats revealed significant main effects of dose (F2,180 = 12.28, p<0.001) and time (F3,180 = 12.28, p<0.001). The interaction between time x dose was not significant (F6,180 = 1.06, p=0.39). All points represent mean ± SEM. N = 16 for free-fed rats; N = 7 for food-restricted rats. **p<0.01 over the whole session for the 4 µg dose vs vehicle, Holm-Sidak adjusted. ANOVA revealed no significant effects in food-restricted rats (dose, F2,64 = 2.27, p=0.11; time, F3,64 = 2.11, p=0.11; dose x time F6,64 = 1.16, p=0.34). (D) When the reward was 3% sucrose instead of heavy cream, CTAP had no effect on CS+ responding in free-fed rats (N = 8). A two-factor ANOVA revealed a main effect of time (F3,84 = 13.54, p<0.001), but not dose (F2,84 = 0.51, p=0.605). The time x dose interaction was not significant (F6,84 = 0.70, p=0.66).
Figure 1—figure supplement 1
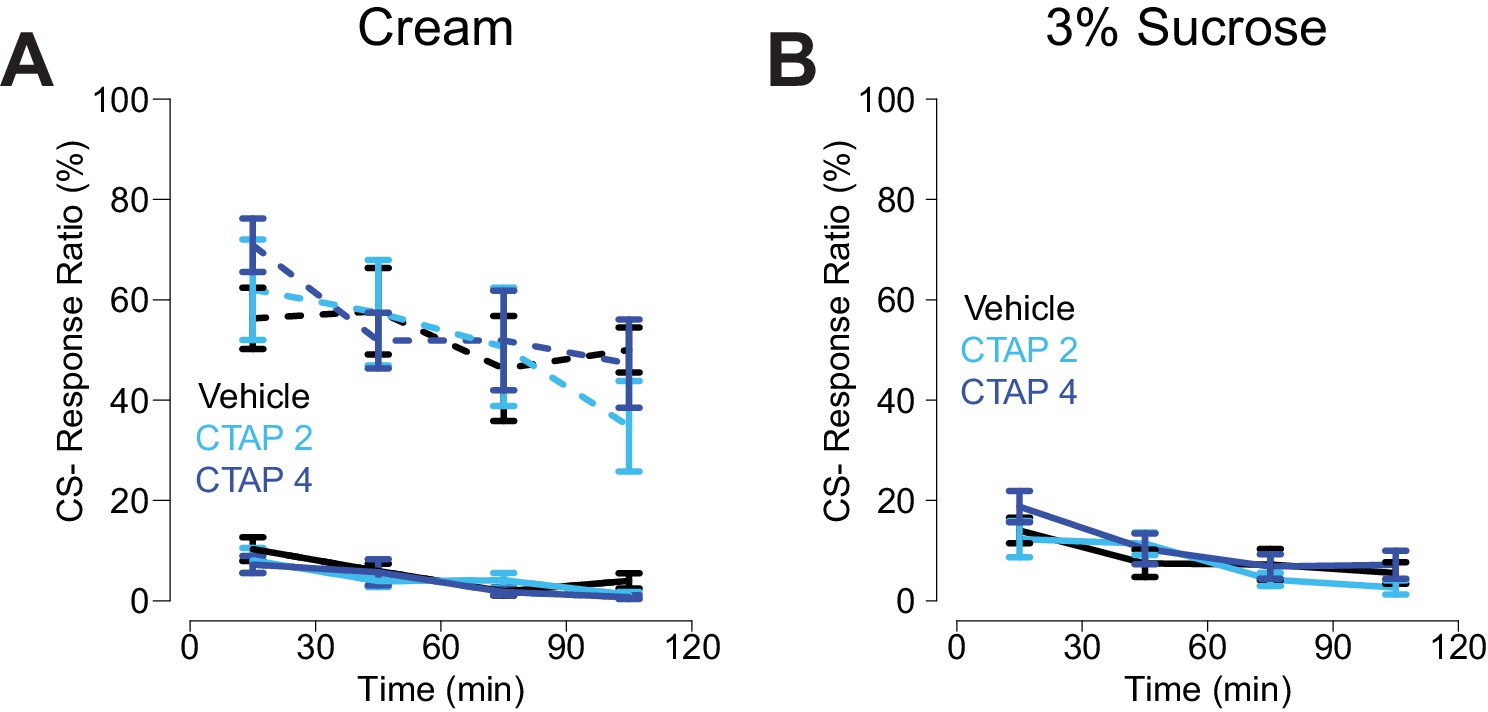
CS- response ratio for CTAP injections.
(A) CS- response ratio for free-fed rats (solid lines) and food-restricted rats (dashed lines) for sessions in which the reward was heavy cream. N = 16 for free-fed; N = 7 for food-restricted. (B) CS- response ratio for free-fed rats for sessions in which the reward was 3% sucrose solution. N = 8. All points represent mean ± SEM.
Figure 1—figure supplement 2
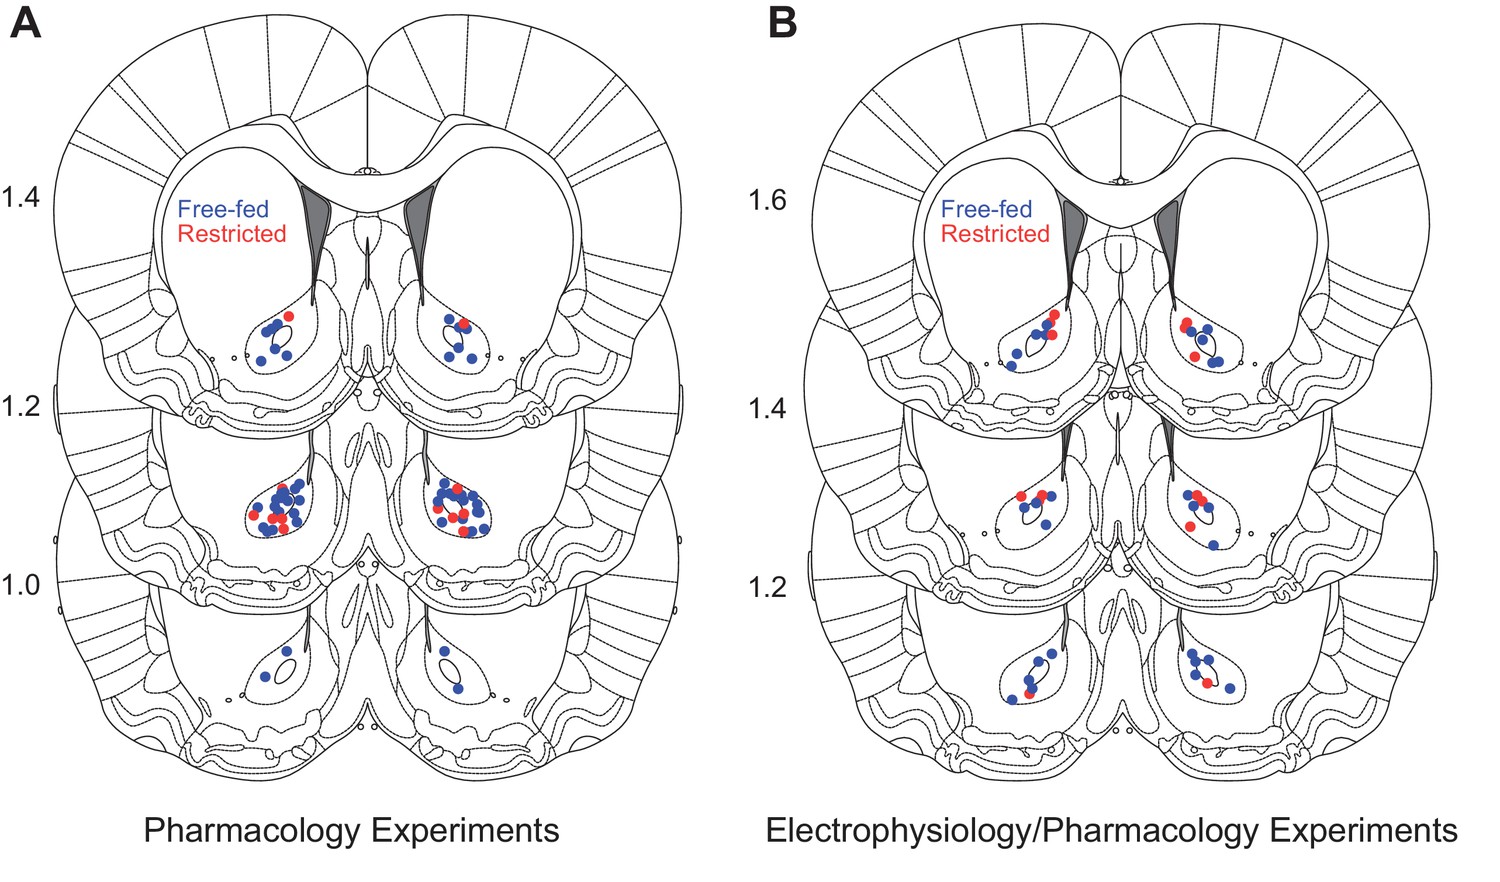
Histological examination of probe locations.
(A) Estimates of microinjection sites for the behavioral pharmacology experiments in Figure 1. Numbers to the left of each brain section indicate approximate AP coordinate relative to Bregma. (B) Estimates of microinjection sites for simultaneous electrophysiology/pharmacology experiments. For both panels, red dots indicate food-restricted rats and blue dots indicate free-fed rats. Section diagrams are adapted from The Rat Brain Atlas in Stereotaxic Coordinates (Paxinos and Watson, 2007).
Figure 2 with 2 supplements
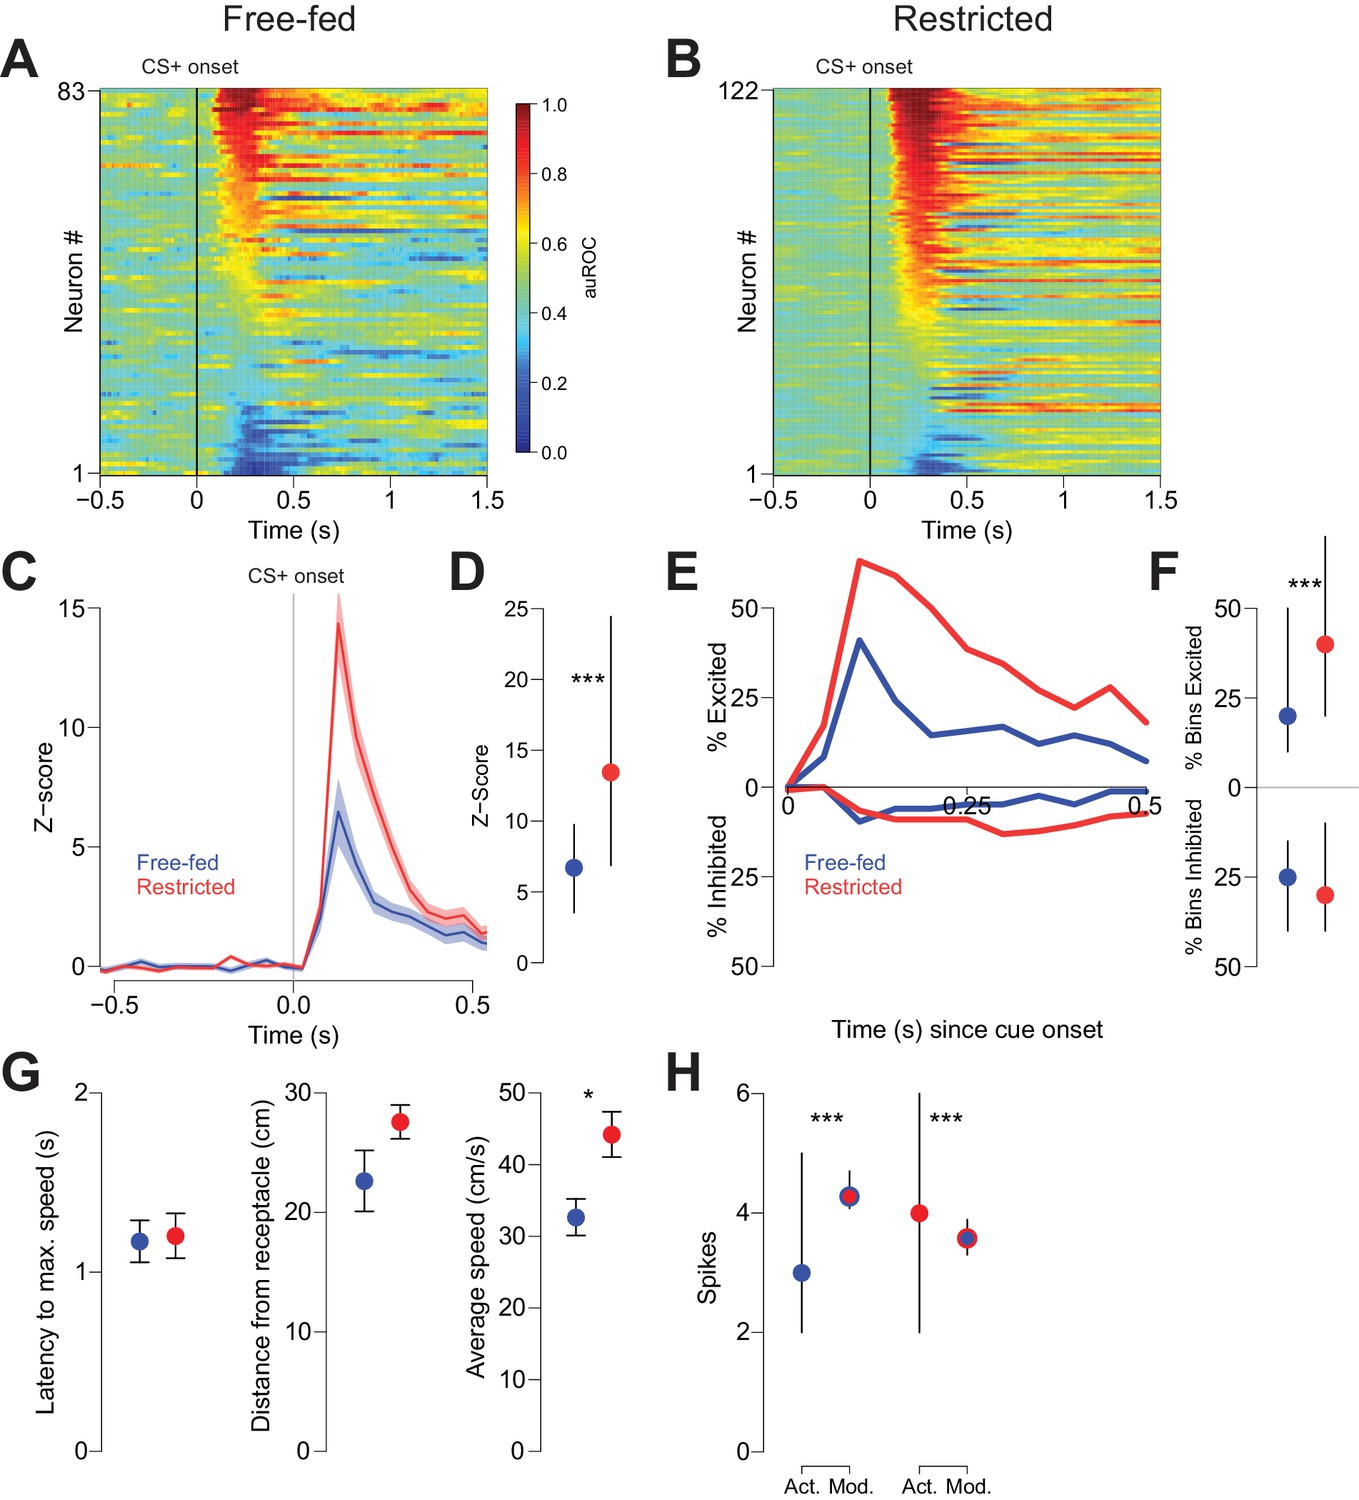
Cue-evoked excitations, but not inhibitions, are more robust in food-restricted than free-fed rats.
(A) Heat map showing CS+ evoked activity of all neurons recorded in free-fed rats. Each row represents an individual neuron’s response to the CS+ averaged across all rewarded trials during the session. Neurons are sorted by the intensity of the response between 100–300 ms post-cue. Colors indicate area under the ROC curve (auROC) comparing firing in the time bin to baseline; hotter colors represent excitation (auROC > 0.5), cooler colors represent inhibition (auROC < 0.5). Data are smoothed for display purposes. (B) Same as A), but for food-restricted rats. (C) Mean perievent time histogram for all neurons classified as cue-excited in A) and B). Only trials with a behavioral response were included. Lines represent the mean response; shaded regions represent ± SEM. (D) The population response of neurons from food-restricted rats (red) is significantly greater than the response in free-fed rats (blue) in the window between 100–300 ms post-cue. Dots indicate the median response, lines indicate inter-quartile range; ***p<0.001, Wilcoxon. (E) Percentage of significantly excited (upper traces) or inhibited (lower traces) neurons in each 50 ms bin compared to pre-cue baseline from the entire free-fed (blue) or restricted (red) populations. (F) Proportion of post-cue bins with significant excitation or inhibition for each cue-excited or cue-inhibited neuron in the 500 ms after cue onset. Dots indicate median proportion of excited bins, lines indicate inter-quartile range; ***p<0.001, Wilcoxon. Only neurons classified as either cue-excited or -inhibited were included (see ‘Analysis of neural data’ section of Materials and methods for the criteria used for neuronal classification). (G) For the subset of sessions with video tracking available (N = 4 rats over five sessions for free-fed, N = 3 rats over five sessions for restricted), mean ± SEM of latency to maximum speed after CS+ onset (left), distance from the receptacle at CS+ onset (center), and average speed after CS+ onset (right) for free-fed (blue) and restricted (red) sessions; *p<0.05, Wilcoxon. (H) Left, using the same sessions as in G), the median and inter-quartile range of the actual spike count from sated sessions (blue dot) on trials in which the rat responded to the CS+ compared to the modeled spike count computed using regression coefficients from the food-restricted sessions and the behavioral parameters from free-fed sessions (red dot with blue outline). Right, the spike counts from food-restricted sessions (red dot) compared to the modeled spike count computed using regression coefficients from the free-fed population and behavioral parameters from the food-restricted population (blue dot with red outline); ***p<0.001, Wilcoxon.
Figure 2—figure supplement 1

GLM Validation.
(A) PSTH for cue-excited neurons in free-fed rats time-locked to CS+ onset comparing trials in which the rat responded (blue trace) to trials in which the rat did not respond (red trace). (B) The population response of the same neurons in the window between 100–300 ms post-cue. Dots indicate the median response, lines indicate inter-quartile range; ***p<0.001, Wilcoxon. (C) and (D) To assess GLM fit, we employed a within-population bootstrapping approach. We reasoned that, if we computed a GLM using half of the trials within a population (food-restricted or free-fed), then, if the GLM accurately models spike count, the spike counts it predicts for the other half of the trials (using the behavioral parameters for the other half as inputs) should be close to the actually observed spike counts in the other half. Therefore, for each neural population, we computed a GLM using a randomly-sampled selection of 50% of CS+ trials on which animals responded to the cue. We then used the resulting regression coefficients to model the spike counts of the other half of the trials and computed the mean difference between modeled spike counts and actual spike counts of that half of the data. We repeated this analysis 1000 times. The resulting distributions of spike differences cluster around 0 for both free-fed (C) and restricted (D) populations. The differences were narrowly distributed and did not exceed ± 0.5, indicating that the model predicted spike counts with high accuracy. We used these distributions to confirm the statistical significance of the results shown in Figure 2H, which show that (a) the spike counts predicted for free-fed trials by the GLM constructed using all food-restricted trials are higher than the actual spike counts on free-fed trials; and (b) the spike counts predicted for food-restricted trials by the GLM constructed using all free-fed trials are lower than the actual spike counts on food-restricted trials. If these results are correct, then the mean difference between model-predicted and actual spike counts should exceed the 95% confidence interval of bootstrapped differences obtained from randomly selected data within each distribution. Bootstrapped datapoints that exceed this confidence interval are shaded in (C and D). The red arrows indicate the mean difference between food restricted model-predicted and actual free-fed spike counts (C) and between free-fed model-predicted and actual food-restricted spike counts (D) – i.e., the mean difference between the actual and modeled spike counts in Figure 2H. These values exceed the 95% confidence interval established by bootstrapping, confirming the differences between modeled and actual spike counts. (E) and (F) Validation of the approach for determining whether two GLMs model the same or different populations (Equation 2, see Materials and methods). For each neural population, we fitted a GLM to a randomly sampled half of the trials, and then fitted a separate GLM to the remaining half of trials. Using Equation 2, we then asked whether each half of trials were modeling the same overall population of neurons. If p>0.05, then the two ‘separate’ populations can be said to model the same overall population. We then repeated this computation 1000 times, reasoning that if the approach is valid and the model fits are good, then p would be > 0.05 on at least 95% of the simulations. The shaded bars represent trials on which p<0.05, and the red arrows indicate the 50th cumulative simulation (i.e., 5% of the simulations), starting from the left. The fact that the red arrows occur even with or to the right of the shaded regions indicates successful validation. (G) Table of the regression coefficients and their corresponding p-values for each regressor of the two population GLMs (free-fed and food-restricted).
Figure 2—figure supplement 2
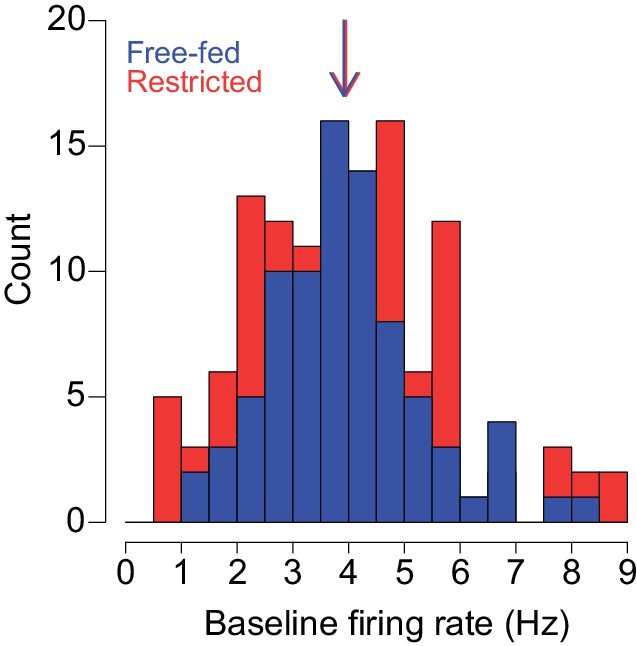
Distributions of baseline firing rates of neurons recorded from free-fed (blue bars) and food-restricted rats (red bars).
The colored arrows represent median baseline firing rates of each population. The difference between the two populations was not statistically significant (p=0.83, Wilcoxon). Bin width is 0.5 Hz.
Figure 3
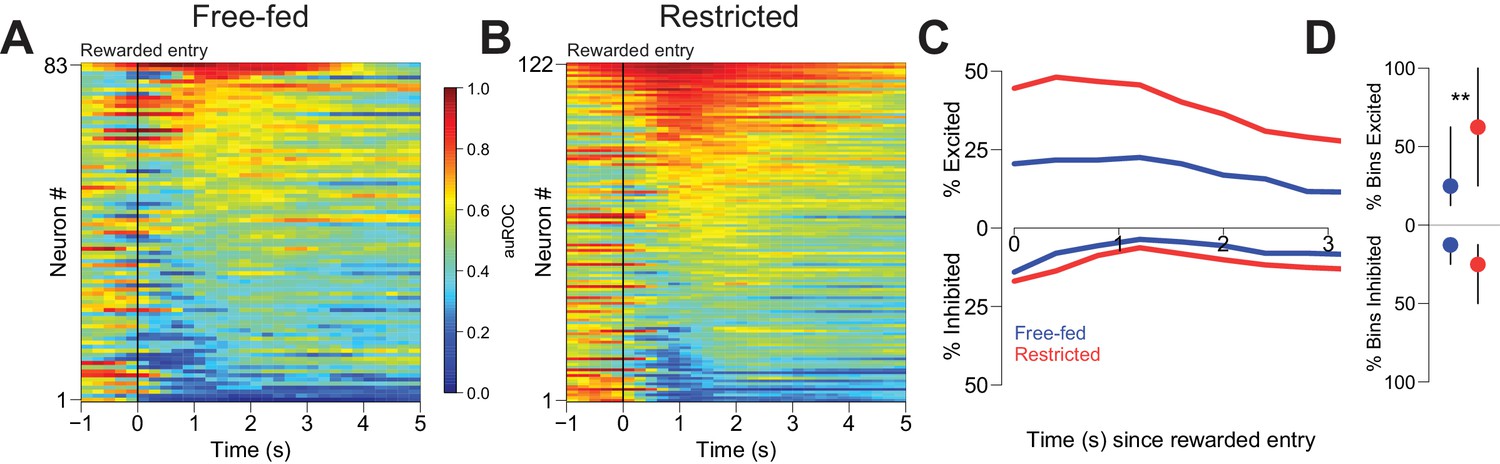
Reward-associated excitations, but not inhibitions, are different in free-fed and restricted populations.
(A) Heat map time-locked to the receptacle entry that triggers reward delivery in free-fed rats. The baseline period is the pre-cue epoch for each rewarded trial. auROC values are computed in an identical fashion as in Figure 2, except here the bin size is 200 ms. Neurons are sorted by the magnitude of their response between 1–3 s after rewarded-entry. (B) Same as A), but for food-restricted rats. (C) Proportion of significantly excited (upper traces) and inhibited (lower traces) neurons for each population in each 400 ms bin during the 3 s epoch after rewarded entry compared to pre-cue baseline. (D) For each significantly excited (upper dots) or inhibited (lower dots) neuron, the percentage of bins with significant excitation or inhibition. Dots represent the median proportion of excited or inhibited bins, lines represent the inter-quartile range; **p<0.01, Wilcoxon.
Figure 4 with 1 supplement
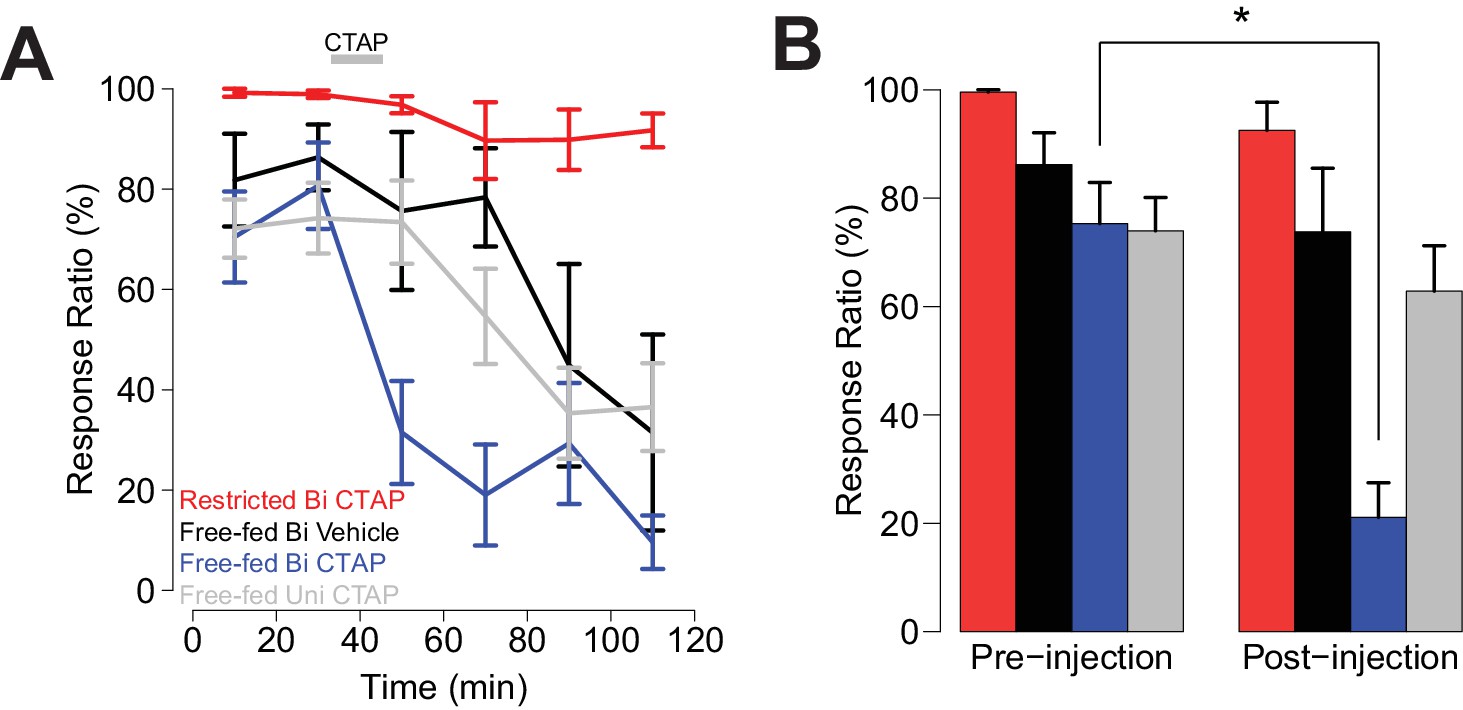
Bilateral, but not unilateral CTAP injections delivered mid-session impair cued approach behavior.
Colors represent the same groups in both panels. (A) Crunch plot showing mean CS+ response ratio in four different groups of animals. Vehicle: N = 5 rats over five sessions; free-fed bilateral CTAP: N = 5 rats over eight sessions; restricted bilateral CTAP: N = 5 rats over nine sessions; free-fed unilateral CTAP: N = 6 rats over 11 sessions. Bin size = 20 min. Gray bar indicates time course of CTAP (or vehicle) injection. A three-factor ANOVA (drug x time x satiety state) revealed significant main effects of drug (F1,130 = 23.06, p<0.001), time (F5,126 = 10.20, p<0.001), and satiety state (F1,130 = 112.13, p<0.001), as well as significant interactions between drug x time (F5,126 = 2.43, p=0.039) and satiety state x time (F5,126 = 4.21, p=0.002). (B) Direct comparison of pre- vs. post-injection epochs for CS+ response ratio. Colors are the same as in A). Only free-fed rats receiving bilateral CTAP injections demonstrated a significant decrease in responding post-injection (*p<0.05, Wilcoxon, Holm-Sidak corrected).
Figure 4—figure supplement 1
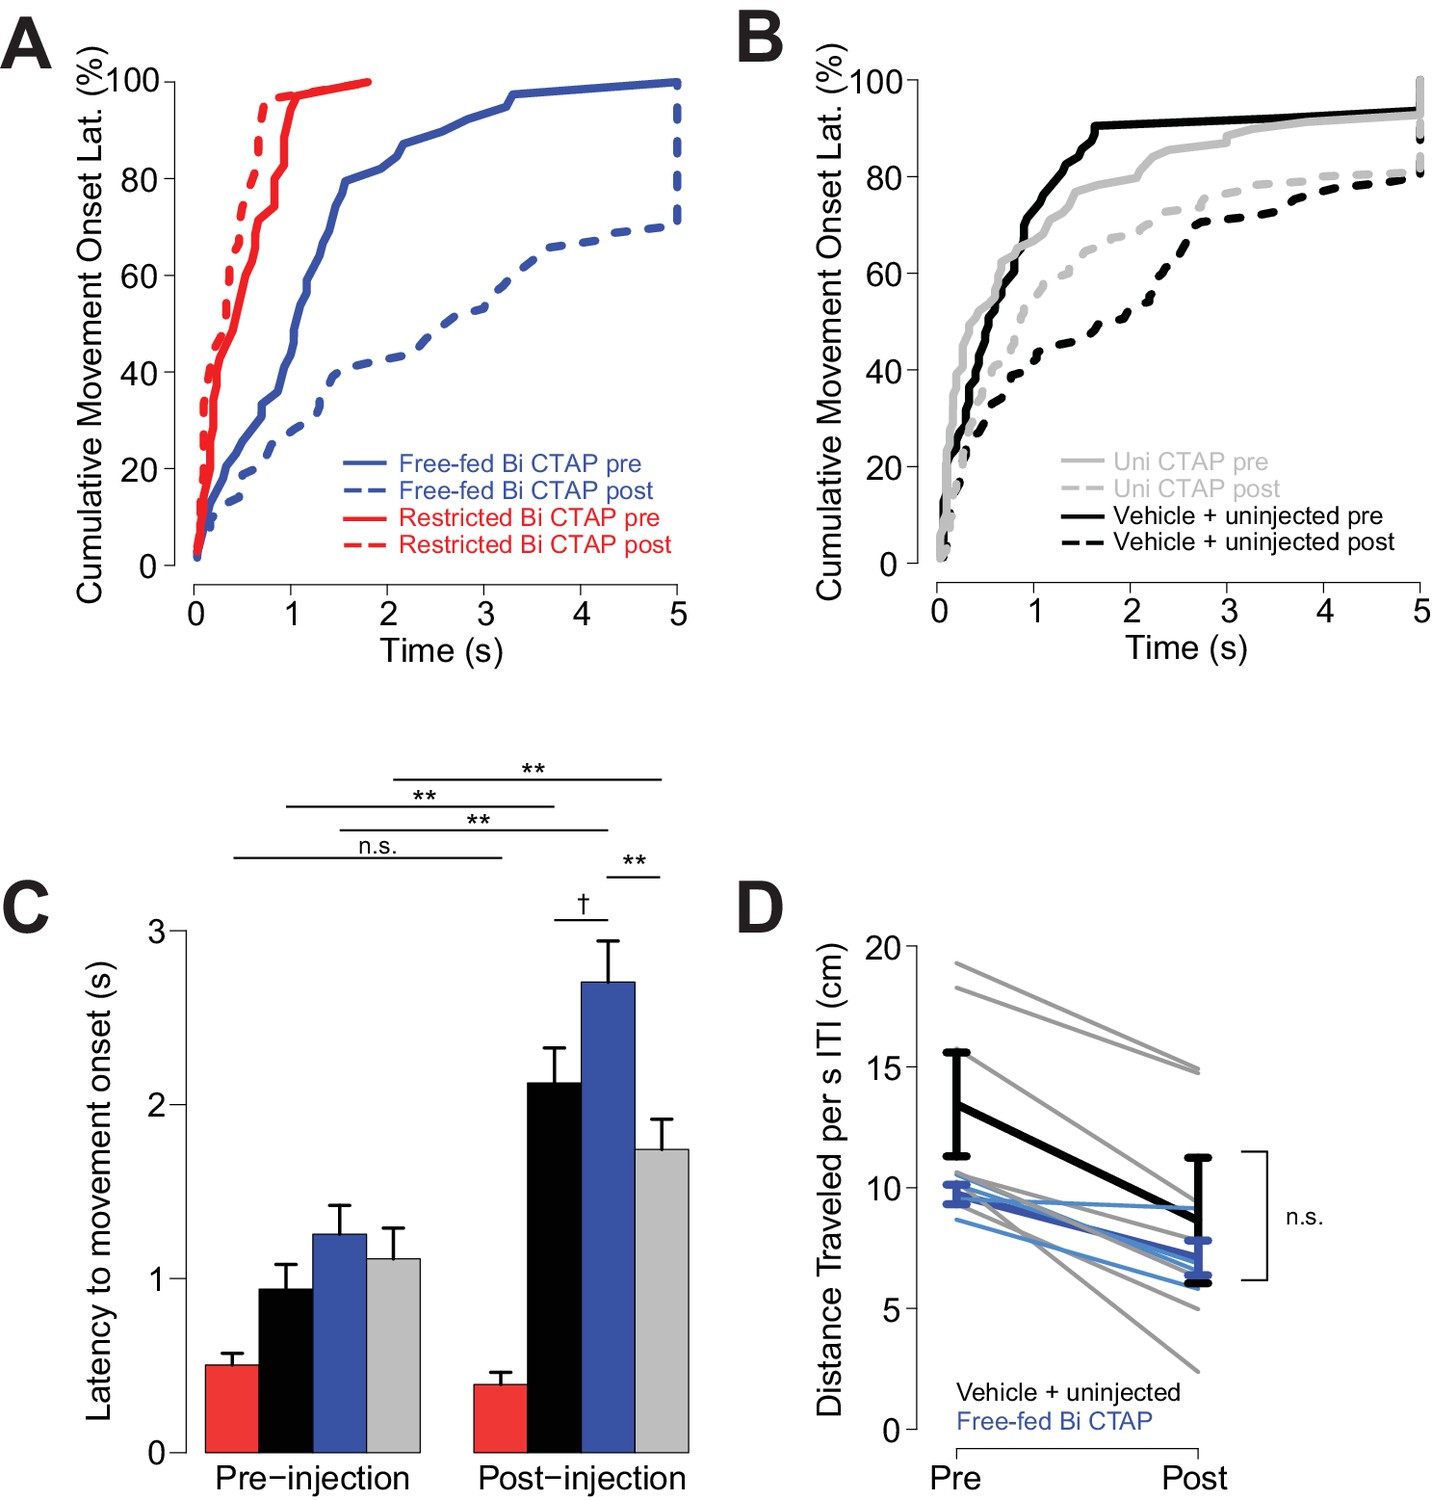
CTAP increases the latency to initiate locomotion following cue onset.
To assess whether bilateral CTAP injection reduced the vigor of behavioral responding, we asked whether the injections affected the animals’ latency to initiate movement after cue onset. (We were unable to determine whether speed of approach to the receptacle was affected because bilateral CTAP injection greatly reduced the likelihood of such a response to the cue.) Only sessions with available video tracking data were used in these analyses, and to boost statistical power, free-fed saline-injected and uninjected sessions were pooled, as rats’ behavior during these sessions was statistically indistinguishable (N = 4 sessions for restricted bilateral; N = 4 sessions for free fed bilateral; N = 9 sessions for free-fed unilateral; N = 7 sessions for free fed saline + uninjected). (A–C) The declines in cue responding in free-fed rats were accompanied by increases in latency to initiate movement, which were observed in the control condition (uninjected and saline injected), bilateral CTAP-injected and unilateral CTAP-injected free-fed rats. In contrast, food-restricted rats exhibited no change in latency to initiate locomotion. A three-factor ANOVA (drug x time x satiety state) revealed significant main effects on latency of time (F1,311 = 45.28, p<0.001) and satiety state (F1,311 = 40.66, p<0.001), but not drug (F1,311 = 0.405, p=0.53). As with response ratio, there was a significant interaction between time x satiety state (F1,311 = 10.77, p<0.01). Latencies to move were greater overall in free-fed than restricted animals; although this result contrasts with the absence of a difference in latency to maximum speed in free-fed vs restricted animals (Figure 2G), the effect in C) is due to inclusion of trials in which animals did not respond (but still eventually moved) as the effect was not observed when we limited the dataset to trials on which the animal responded. Notably, there was a trend towards greater latency after CTAP injection than after either control or unilateral CTAP injection, which was not apparent in the pre-injection window. Thus, although all free-fed groups showed a gradual decline in response ratio that was accompanied by increased latency to initiate movement, only bilateral CTAP injection caused a sharp decline in response ratio, which was observed only in free-fed (and not food-restricted) rats. †, p<0.10; **p<0.01, Wilcoxon, Holm-Sidak corrected. We then asked whether the decline in response ratio observed in bilateral CTAP-injected free-fed rats could have been caused by an overall reduction in locomotor activity, which we assessed by measuring locomotion during the ITI. However, although locomotion was reduced in the post-injection window compared with the pre-injection window in CTAP-injected, saline-injected and non-injected free-fed rats, there was no difference in this measure between CTAP and control (combined saline and non-injected) groups (D). Therefore, the sharp attenuation of cue-responding in bilateral CTAP-injected rats cannot be attributed to a generalized motor impairment. Thick darker lines represent mean ± SEM for each group; thin lighter lines represent individual sessions of bilateral injections (blue) or vehicle + uninjected (gray).
Figure 5 with 2 supplements
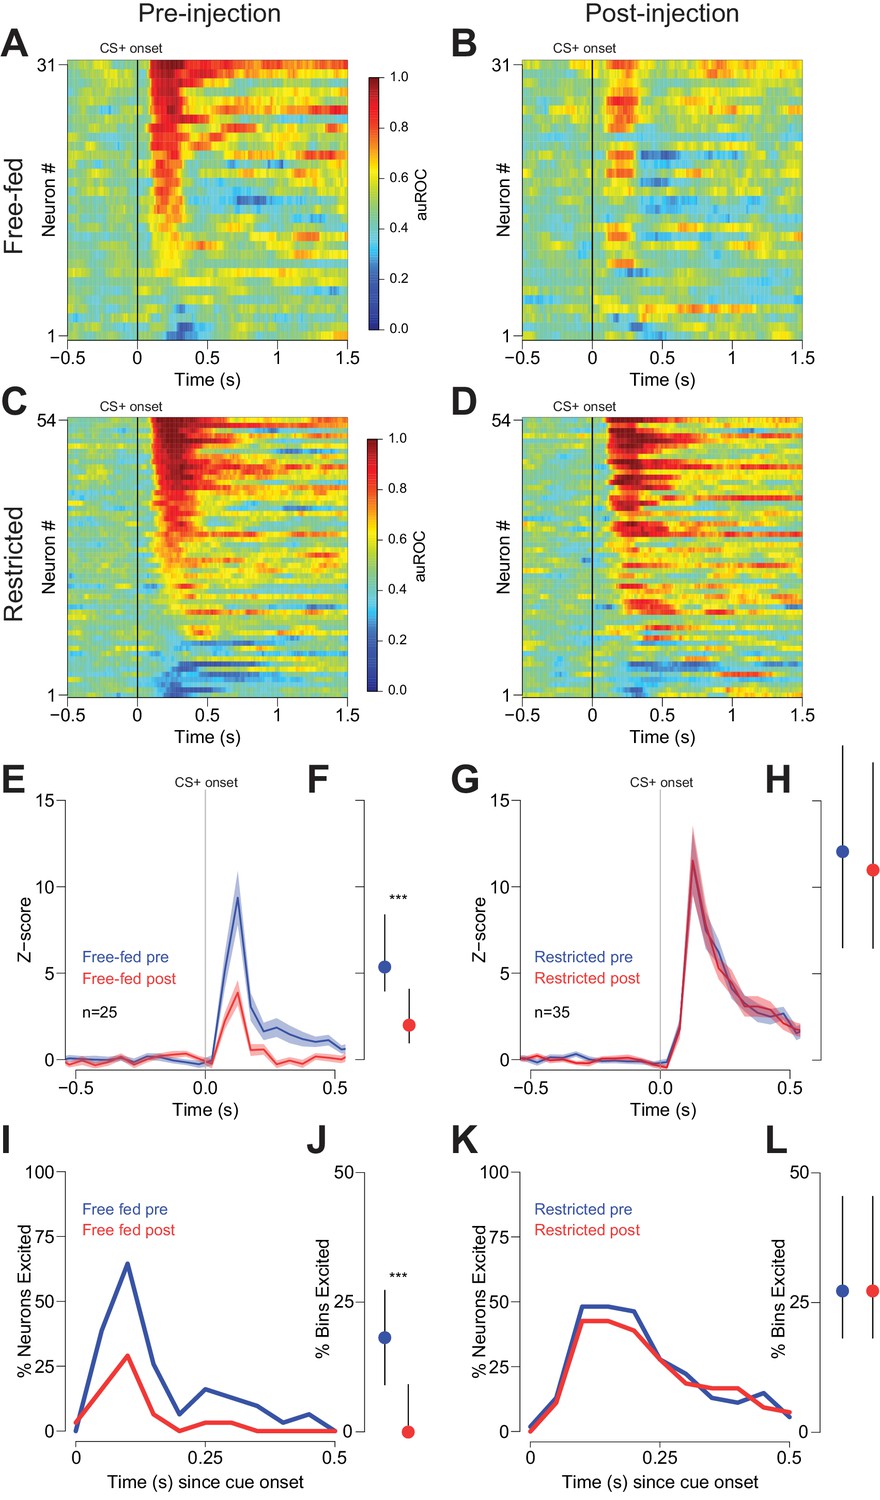
Cue-evoked excitations are reduced after bilateral CTAP injection in free-fed but not restricted rats.
(A) and (B) Population heat maps for all neurons recorded from free-fed rats pre-injection (A) vs. post-injection (B). The sort order is the same for each pair of heat maps. (C) and (D) Same as (A and B), except for food-restricted rats. (E) Peri-stimulus time histogram (PSTH) of neurons classified as cue-excited for from the free-fed population. The blue trace represents mean z-score ± SEM for the pre-injection epoch; the red trace represents the post-injection epoch. (F) Dot plot indicating median and interquartile range of the response in each epoch of cue-excited neurons between 100–300 ms following cue onset. Colors are the same as in E). ***p<0.001, Wilcoxon. (G) and (H) Same as (E and F), but for food-restricted rats. (I) Proportions of cue-excited neurons in each 50 ms bin following cue onset for free-fed rats pre-injection (blue trace) vs post-injection (red trace). (J) Neurons from free-fed rats exhibited a significant post-injection decrease in the proportion of significantly excited bins. Only neurons with significant post-cue excitation were included in this analysis. ***p<0.001, Wilcoxon. (K) and (L) Same as I) and J), except for food-restricted rats, which did not exhibit a difference in the proportion of significantly excited bins pre- vs post-injection, p=0.55, Wilcoxon.
Figure 5—figure supplement 1

Raster plots of two representative cue-excited neurons.
(A) and (B) Representative neurons from each group pre- vs. post-injection. Raster plots are aligned to CS+ onset; each row is a single CS+ presentation from the session. Histograms were converted to firing rate using 20 ms bins.
Figure 5—figure supplement 2
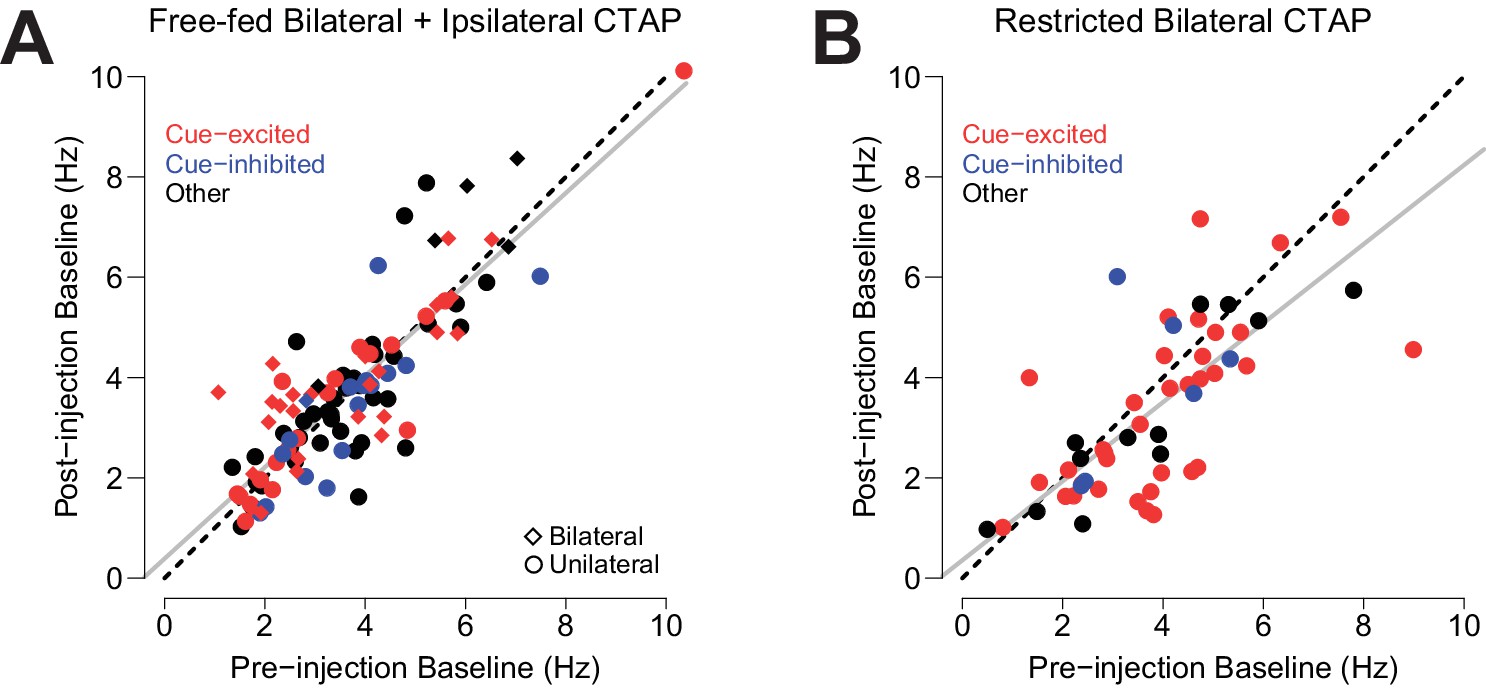
Effect of CTAP on baseline firing rate.
Each neuron’s pre-injection baseline is plotted against its post-injection baseline. (A) Neurons from free-fed rats that were exposed to CTAP (i.e., neurons from the free-fed bilateral and free-fed ipsilateral populations were pooled, as they did not statistically differ). The slope of the resulting regression line (gray) is not significantly different from the slope of the unity line (dotted black). Circles represent neurons from unilateral injections; diamonds represent neurons from bilateral injections. (B) Neurons from food-restricted rats that were injected bilaterally with CTAP. While the slope of the plotted regression line (gray) is statistically lower than the slope of the unity line (i.e., the 95% confidence interval for the slope of the regression line ranges from 0.61 to 0.96; it does not contain 1), the removal of the three neurons whose Cook’s distance exceeds three times the mean Cook’s distance yields a regression slope whose confidence interval does contain 1 (0.66 to 1.07).
Figure 6
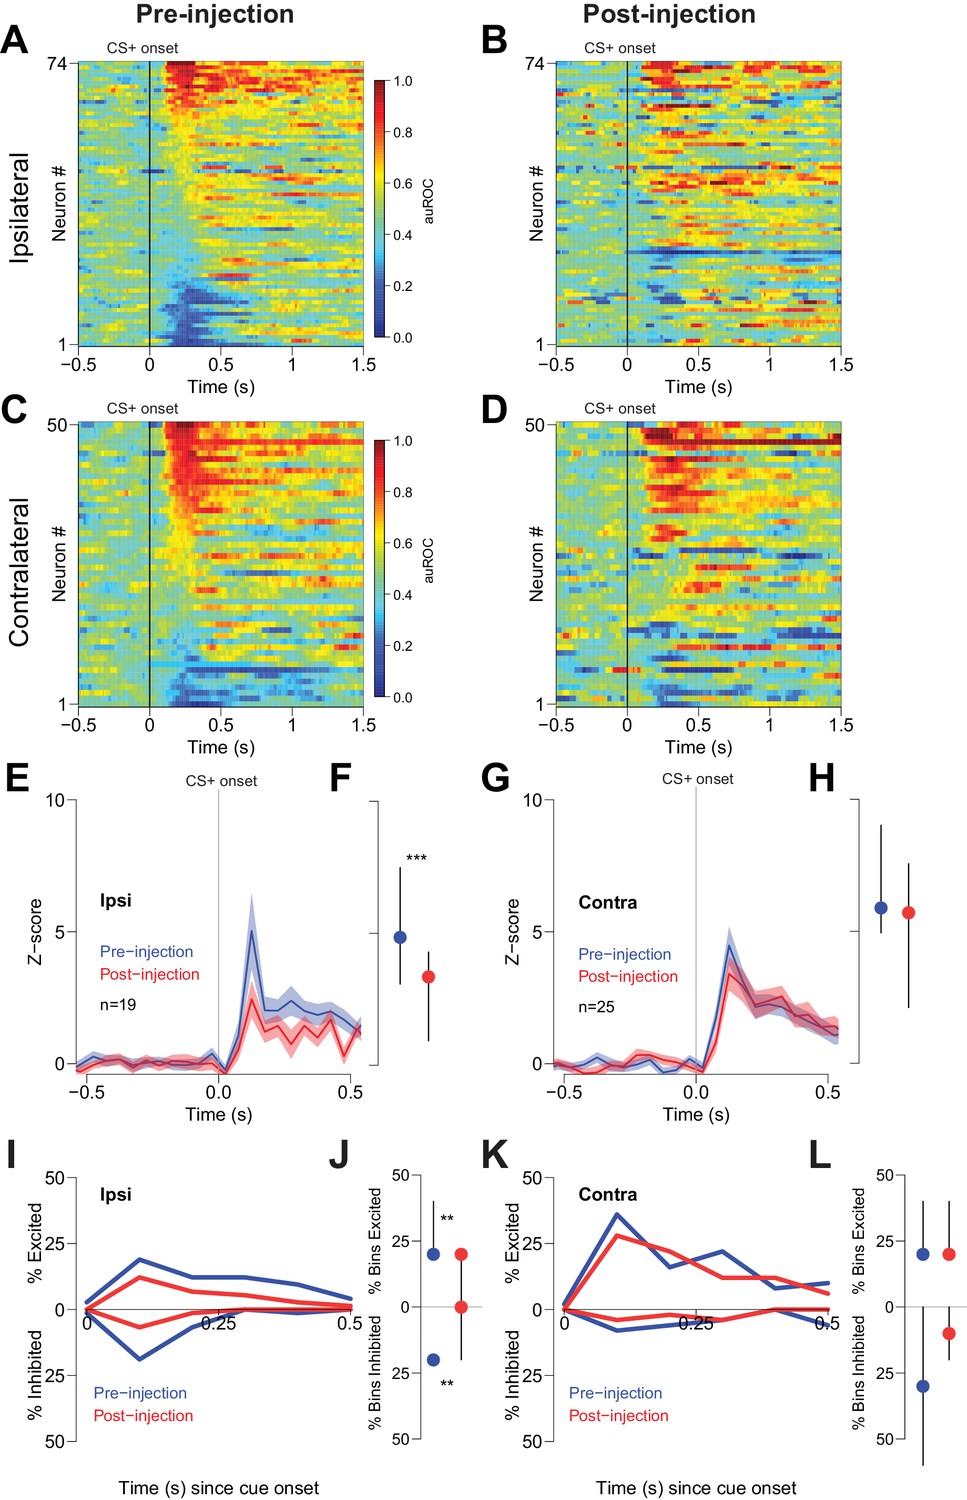
Cue-evoked excitations and inhibitions ipsilateral, but not contralateral, to CTAP injection are reduced.
(A) Pre-injection population heat maps for neurons recorded ipsilateral to the site of CTAP injection. (B) Post-injection heat map corresponding to A); the sort order is the same for each heat map. (C) and (D) Same as (A and B), but for neurons recorded contralateral to the site of CTAP injection. (E) PSTH of neurons classified as cue-excited for the ipsilateral population. Blue trace represents mean z-score ± SEM for the pre-injection epoch; red trace represents the post-injection epoch. (F) Dot plot indicating median and interquartile range of the response in each epoch of cue-excited neurons between 100–300 ms following cue onset. ***p<0.001, Wilcoxon. (G) and (H) Same as (E and F), except for neurons contralateral to the injection. There was no significant change in the magnitude of the response pre- vs post-injection. p=0.19, Wilcoxon. (I) Proportions of cue-excited (upper traces) and cue-inhibited (lower traces) neurons in each 50 ms bin following cue onset pre-injection (blue traces) vs post-injection (red traces) out of all ipsilateral neurons. (J) Proportion of bins with significant excitation (upper) or inhibition (lower) for each excited or inhibited neuron. Dots represent the median proportion of significantly excited or inhibited bins; lines represent the inter-quartile range. **p<0.01, Wilcoxon. (K) and (L) Same as (I and J), but for neurons contralateral to the injected hemisphere. There was no significant change in the proportion of excited or inhibited bins (p=0.20 and p=0.17, respectively, Wilcoxon).
Figure 7
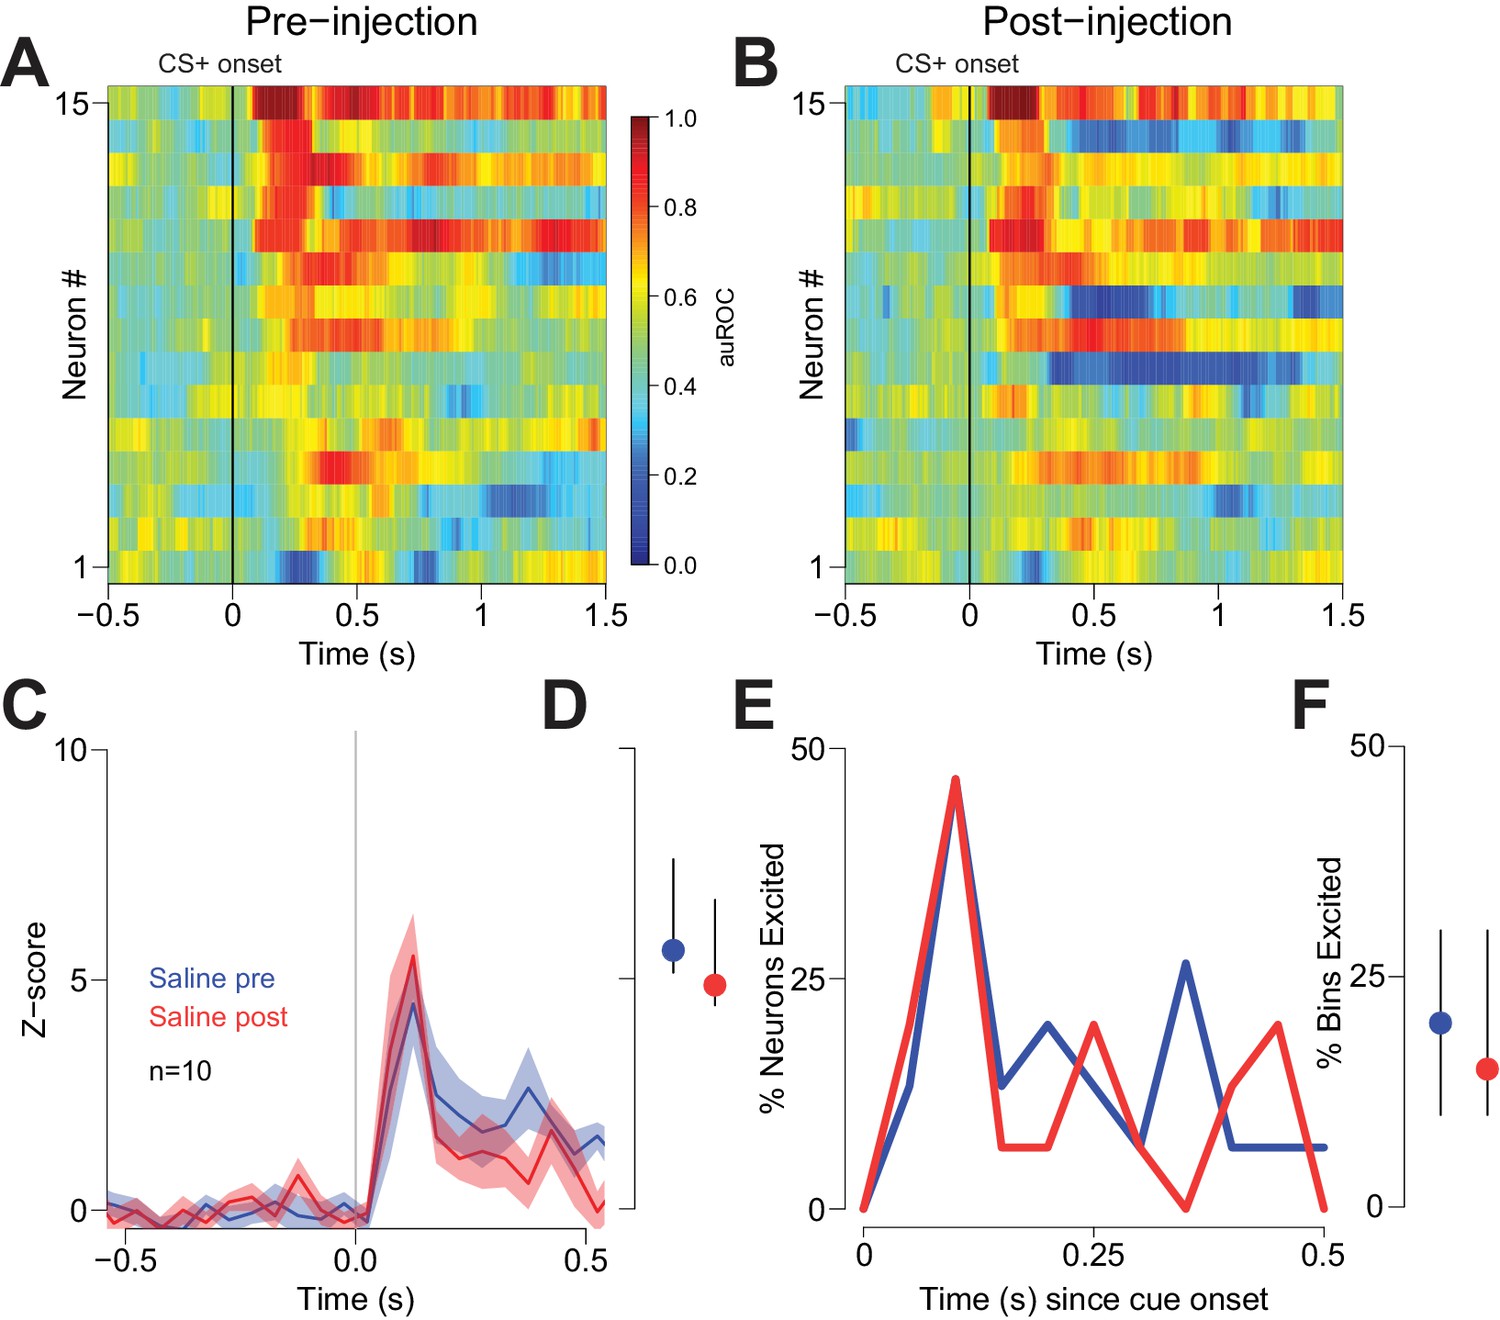
Vehicle injection does not affect cue-evoked excitations.
(A) and (B) Population heat maps for neurons recorded from free-fed rats pre-vehicle injection and post-vehicle injection. (C) PSTH of neurons classified as cue-excited for pre- vs. post- injection epochs. (D) Dot plot indicating median and interquartile range of the response in each epoch (pre- vs post-injection) of cue-excited neurons between 100–300 ms following cue onset. (E) Proportions of cue-excited neurons in each 50 ms bin following cue onset pre-injection (blue trace) vs post-injection (red trace). (F) The proportion of bins with significant excitation for each cue-excited neuron pre- (blue trace) vs post-injection (red trace).
Figure 8 with 2 supplements
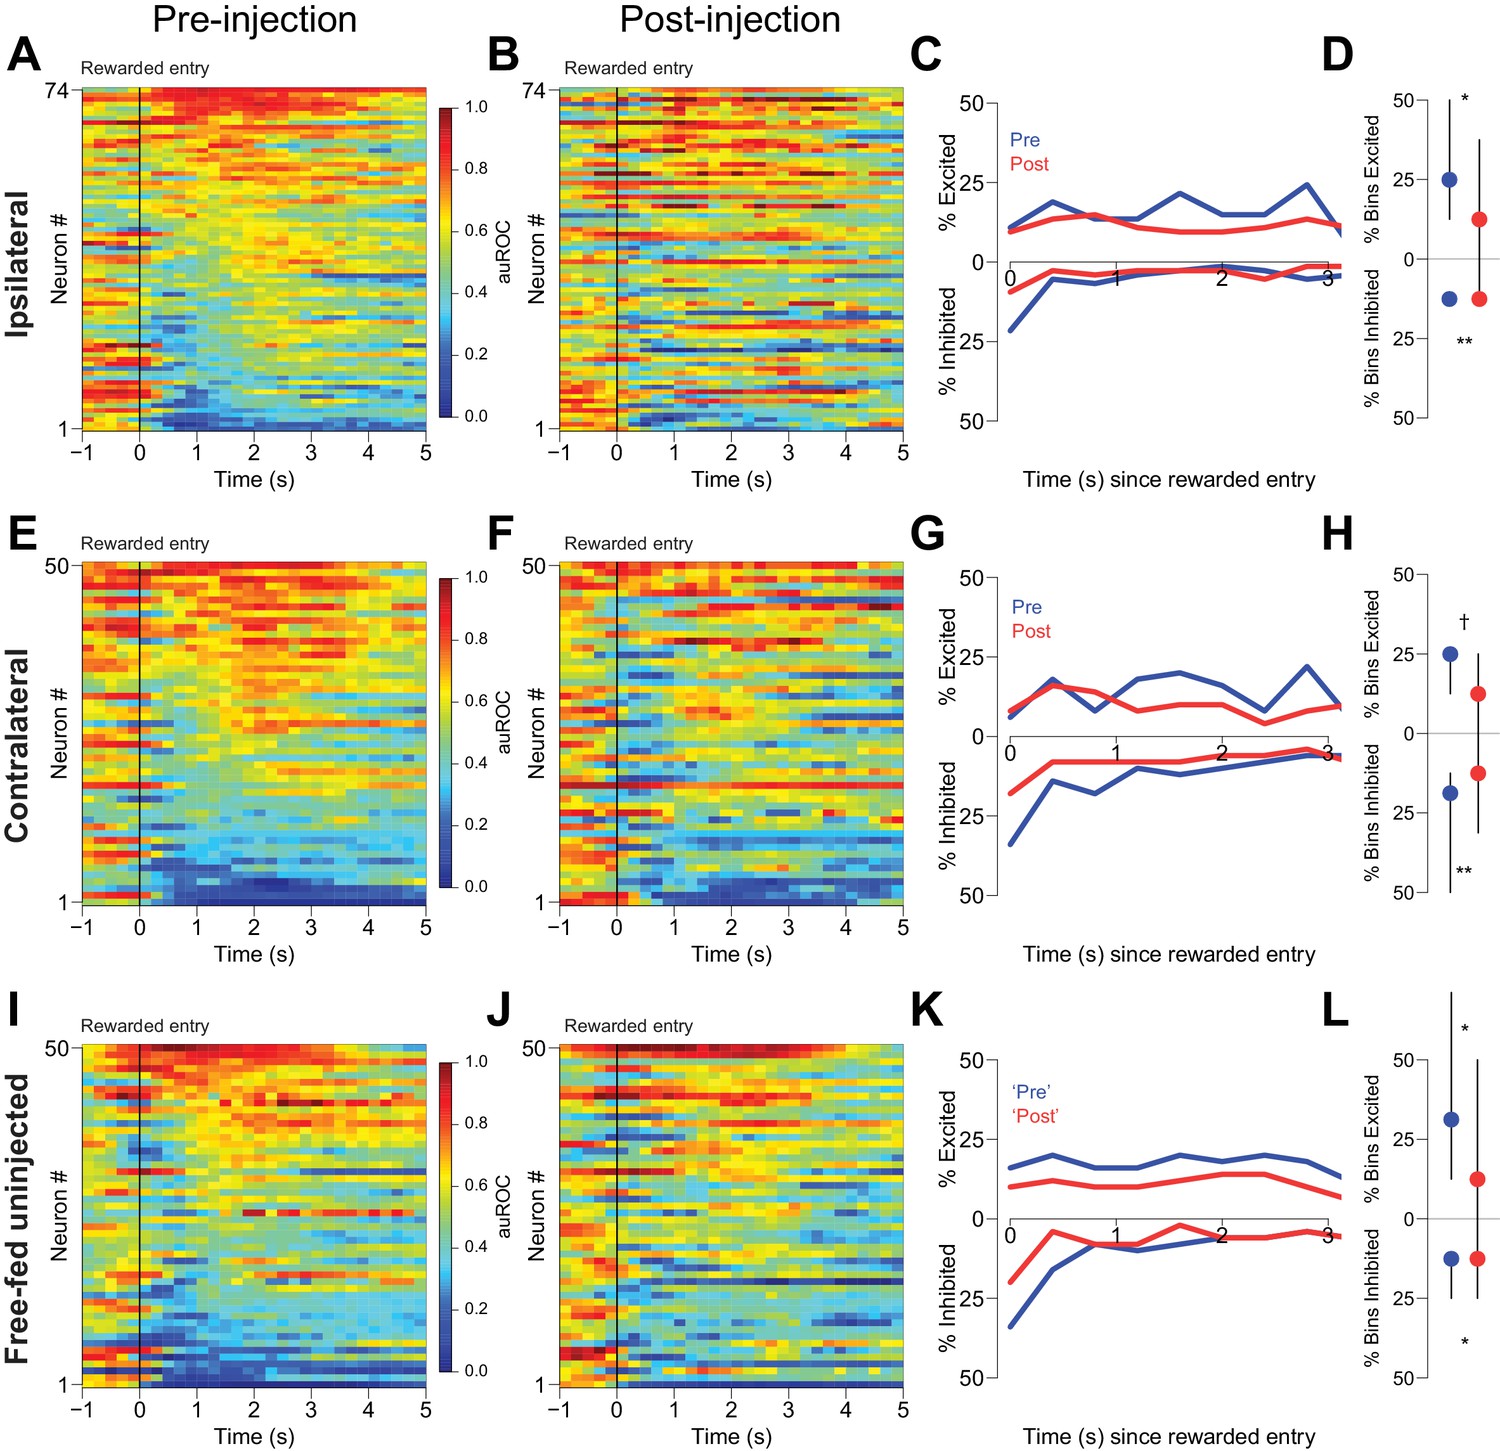
CTAP does not affect reward-associated firing.
(A, E, I) Pre-injection neural activity aligned to the onset of rewarded receptacle entries. The baseline period is the pre-cue baseline for each rewarded trial in the respective epoch; each bin is 200 ms. Neuronal populations were recorded ipsilateral to CTAP injection (A), contralateral to CTAP (E) and in uninjected animals (I). (B, F, J) Post-injection neural activity for the same three populations. (C) Proportions of significantly excited (upper traces) and inhibited (lower traces) neurons in each 400 ms bin following rewarded receptacle entry pre-injection (blue traces) vs post-injection (red traces) for ipsilateral neurons. (D) The proportion of bins with significant excitation (upper) or inhibition (lower) for each significantly excited or inhibited neuron (see ‘Analysis of neural data’ in Materials and methods for inclusion criteria). Dots represent the median proportion of excited or inhibited bins; lines represent the inter-quartile range. (G, H) and (K, L) are the same as (C and D), except for contralateral neurons and free-fed non-injected neurons, respectively. For (I, J and K), only sessions for which there were at least six responded trials in each epoch were included in this analysis, as that was the minimum number of responded trials in either epoch of the unilateral sessions. †, p<0.10; *p<0.05; **p<0.01, Wilcoxon.
Figure 8—figure supplement 1
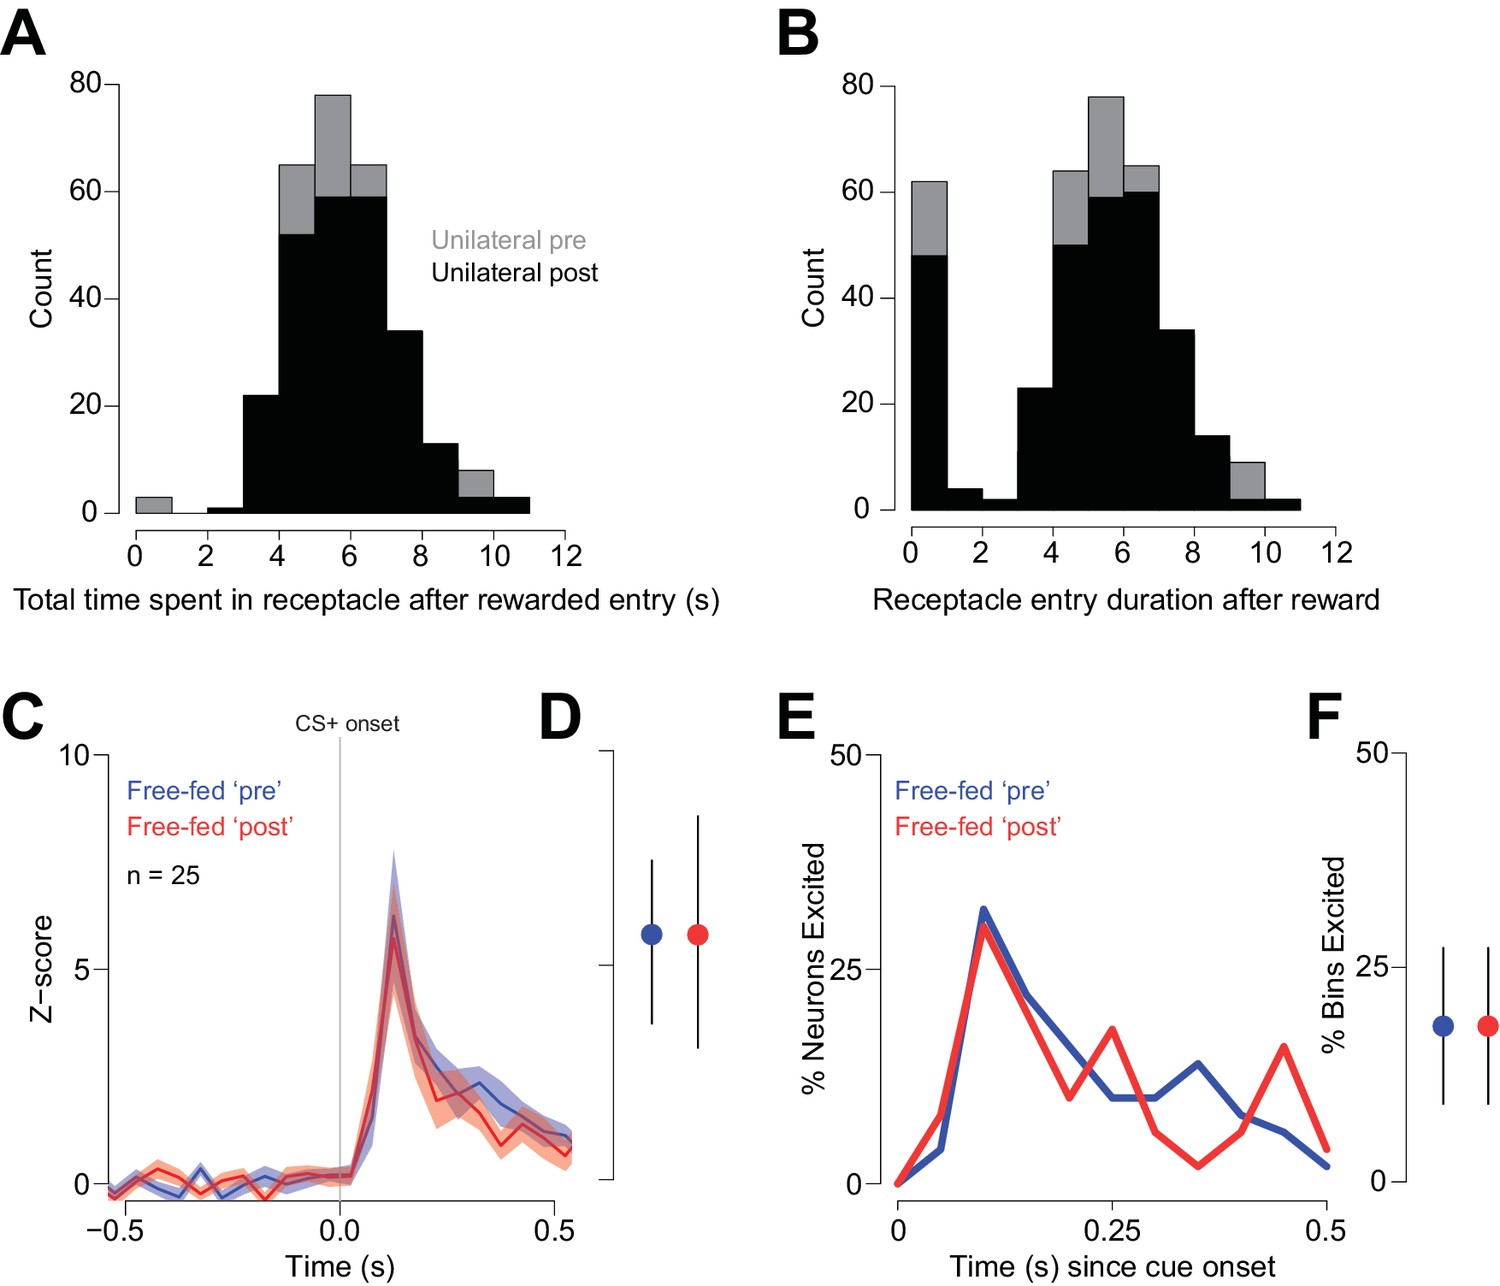
Receptacle visit histograms following rewarded entries during unilateral injection sessions.
(A) Histogram of the total time spent in the receptacle following a rewarded head entry during the pre-injection epoch (gray bars) and the post-injection epoch (black bars). The total time spent in the receptacle was computed by summing the duration of all receptacle entries up to 12 s after the initial rewarded entry. (B) Histogram showing the duration of each individual receptacle entry following the initial rewarded entry pre-injection (white bars) and post-injection (black bars). Because of the nature of the infrared photobeam detector, rats occasionally allow the beam to re-form without actually leaving the receptacle, causing the recording of a number of transient receptacle visits (represented by the short-duration bars during the 0–1 s bin). We suspect that these transient visits are spurious, in that they are always followed immediately by longer-duration visits. In any case, this pattern of behavior is unaffected by unilateral CTAP injection, as the histograms overlap closely. The fact that CTAP failed to change either of these measures indicates that the observed change in reward-associated firing observed during unilateral injections (Figure 8) cannot be attributed to a change in receptacle-related behavior. (C–F) While consumption-related firing is decreased in uninjected free-fed rats when comparing the ‘Post-injection’ epoch to the ‘Pre-injection’ epoch (Figure 8I–L), the same is not true of cue-evoked excitations, which are consistent in their magnitude over time. To demonstrate this, we examined cue-evoked excitations for the same trials we examined in Figure 8I–L. The blue traces in (C and E) represent cue-evoked excitations in the Pre-injection epoch, while the red traces are the same neural population in the Post-injection epoch. (D) There was no difference in the magnitude of cue-evoked excitation; p=0.87, Wilcoxon. Moreover, there is no change in the percentage of cue-excited neurons (E) or in the fraction of bins with significant excitation (F); p=0.75, Wilcoxon.
Figure 8—figure supplement 2
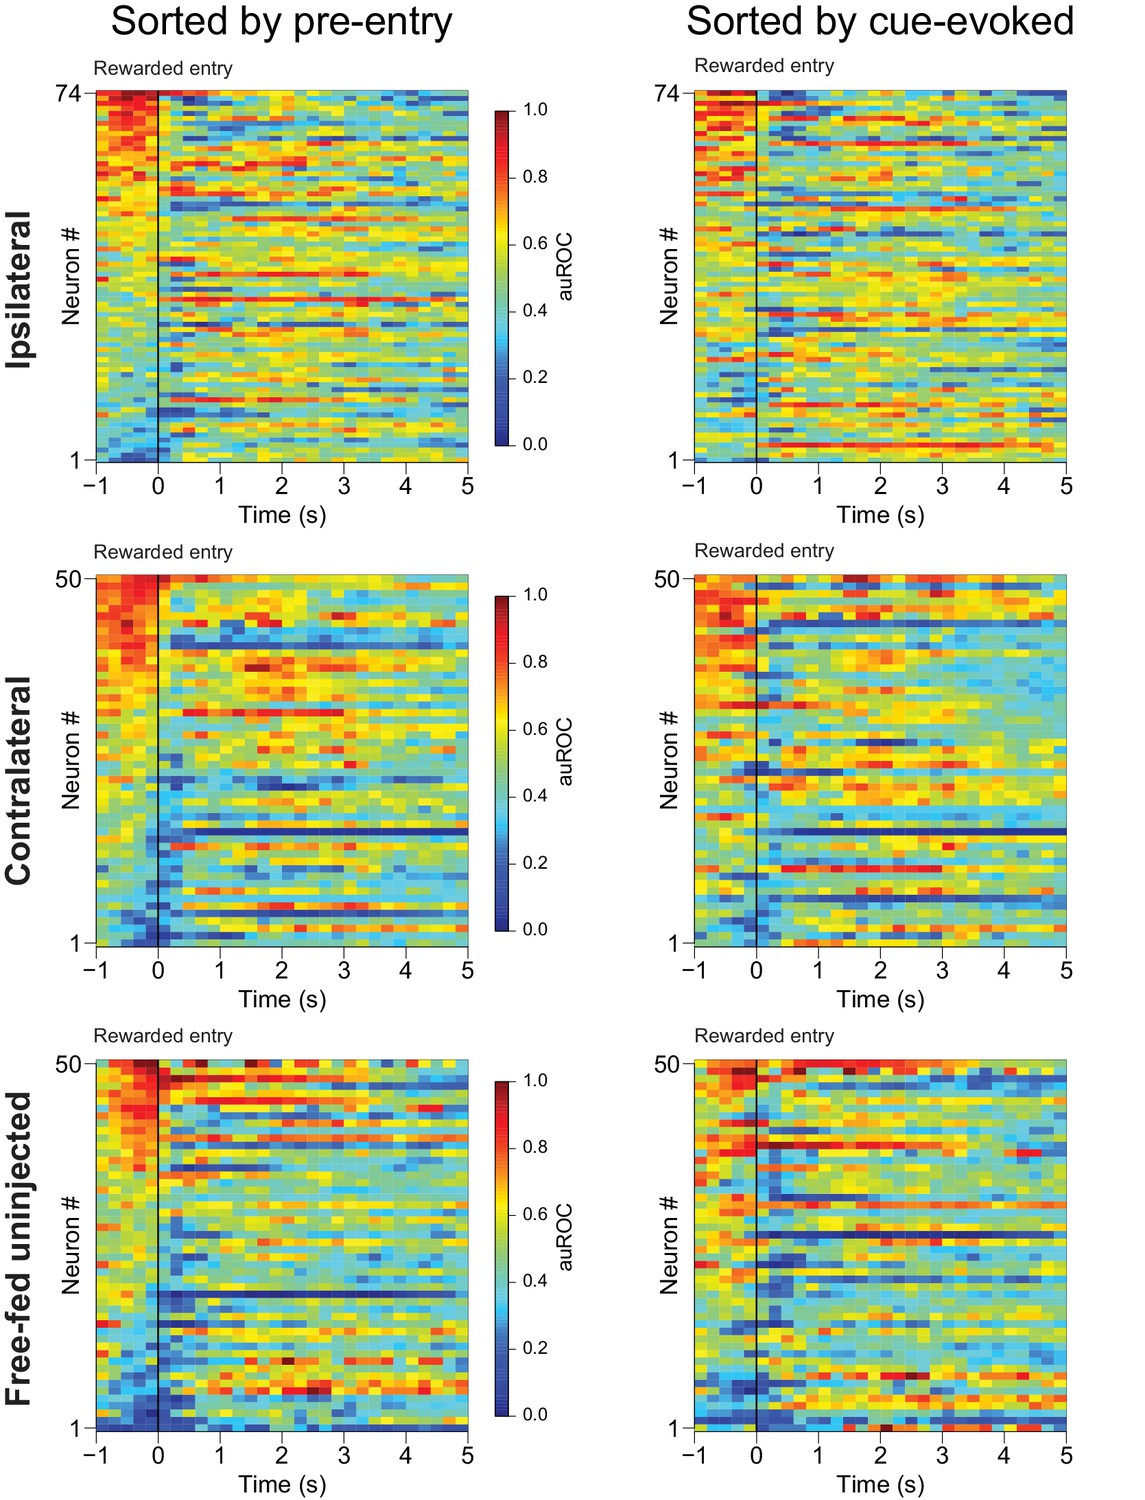
Excitations prior to rewarded receptacle entries mostly consist of sustained cue-evoked excitations that terminate upon receptacle entry.
Left, the same three populations of neurons shown in Figure 8A,E and I), except here they are sorted by the magnitude of their responses in the 1 s period prior to rewarded receptacle entry. Right, the same neural populations sorted by the magnitude of their cue-evoked activity between 100–300 ms after cue onset. Note that in all three populations, most of the neurons excited in the pre-rewarded entry epoch (from −1 to 0 s) are also the same neurons with the greatest cue-evoked excitation, and that these excitations tend to terminate prior to or immediately following the rewarded receptacle entry. They are thus unlikely to represent consumption-related excitation. For these heat maps, the smoothing kernel was decreased to 400 ms (as opposed to 800 ms in Figure 8) to allow for better temporal precision regarding the duration of evoked responses.
Additional files
-
Transparent reporting form
- https://doi.org/10.7554/eLife.34955.020
Download links
A two-part list of links to download the article, or parts of the article, in various formats.
Downloads (link to download the article as PDF)
Open citations (links to open the citations from this article in various online reference manager services)
Cite this article (links to download the citations from this article in formats compatible with various reference manager tools)
Endogenous opioids in the nucleus accumbens promote approach to high-fat food in the absence of caloric need
eLife 7:e34955.
https://doi.org/10.7554/eLife.34955


