Variations in HLA-B cell surface expression, half-life and extracellular antigen receptivity
- University of Michigan, United States
- Walter Reed Army Institute of Research, United States
- Henry M. Jackson Foundation for the Advancement of Military Medicine, United States
- Sirona Genomics, Immucor, Inc, United States
- Mayo Clinic, United States
Figures
Figure 1 with 5 supplements
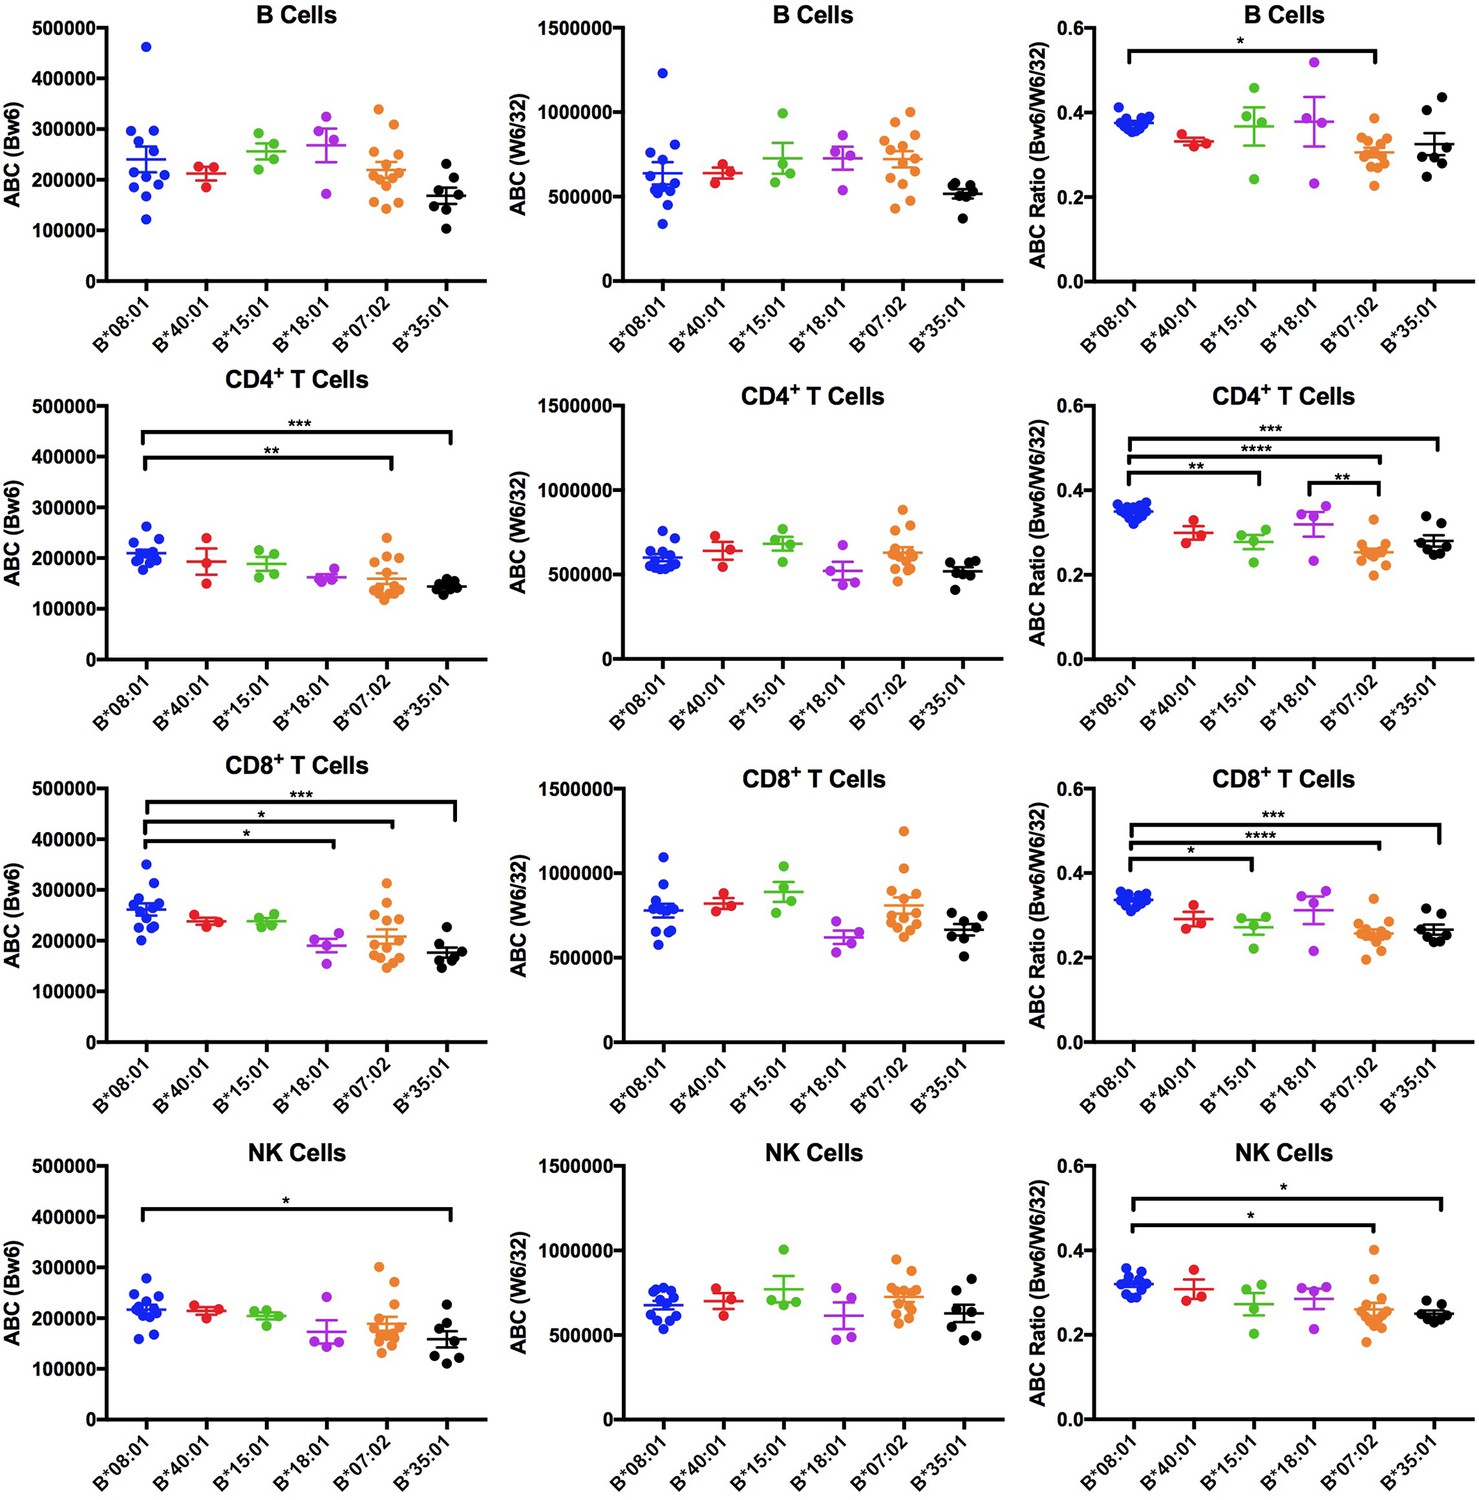
Expression variations among HLA-Bw6 alleles.
Forty-three healthy donors (Figure 1—source data 1) with either heterozygosity for HLA-Bw4/Bw6 or homozygosity for HLA-Bw6 alleles were sorted into six groups based on their Bw6 alleles. ABC values were calculated by flow cytometry based on staining freshly isolated PBMCs with anti-Bw6 or W6/32 and normalizing the resulting geometric MFI values against beads with known amounts of Fc receptors. Averaged ABC values for each donor are shown, grouped by the donor’s HLA-Bw6 alleles and lymphocyte subset analyzed (B cells (top row), CD4+ T cells (second row), CD8+ T cells (third row), and NK cells (last row)). For homozygous donors, 50% of the derived ABC values are plotted. Bw6 ABC values alone (column 1), W6/32 ABC values alone, (column 2) and the Bw6/W6/32 ABC ratios (column 3) are shown. The number of replicate measurements for each donor and standard errors of the mean are shown in Figure 1—source data 1. Statistically significant differences between alleles were analyzed by one-way ANOVA analysis for each cell type. Each dot represents averaged Bw6, W6/32, or Bw6/W6/32 ABC measurements (n > 3) from a single donor. p *<0.05; **<0.01; ***<0.001; ****<0.0001. This figure has five supplementary figures and one source data table.
-
Figure 1—source data 1
Expression variations among HLA-Bw6 alleles.
HLA class I genotypes of donors used for Bw6 measurements, and mean of ABC values measured with anti-Bw6 and W6/32 for each lymphocyte subset. The HLA-B-Bw6 allele of each donor is highlighted in bold. Standard errors of the mean (SEM) values and the number of replicate measurements (N; with separate blood collections) are indicated.
- https://doi.org/10.7554/eLife.34961.009
Figure 1—figure supplement 1
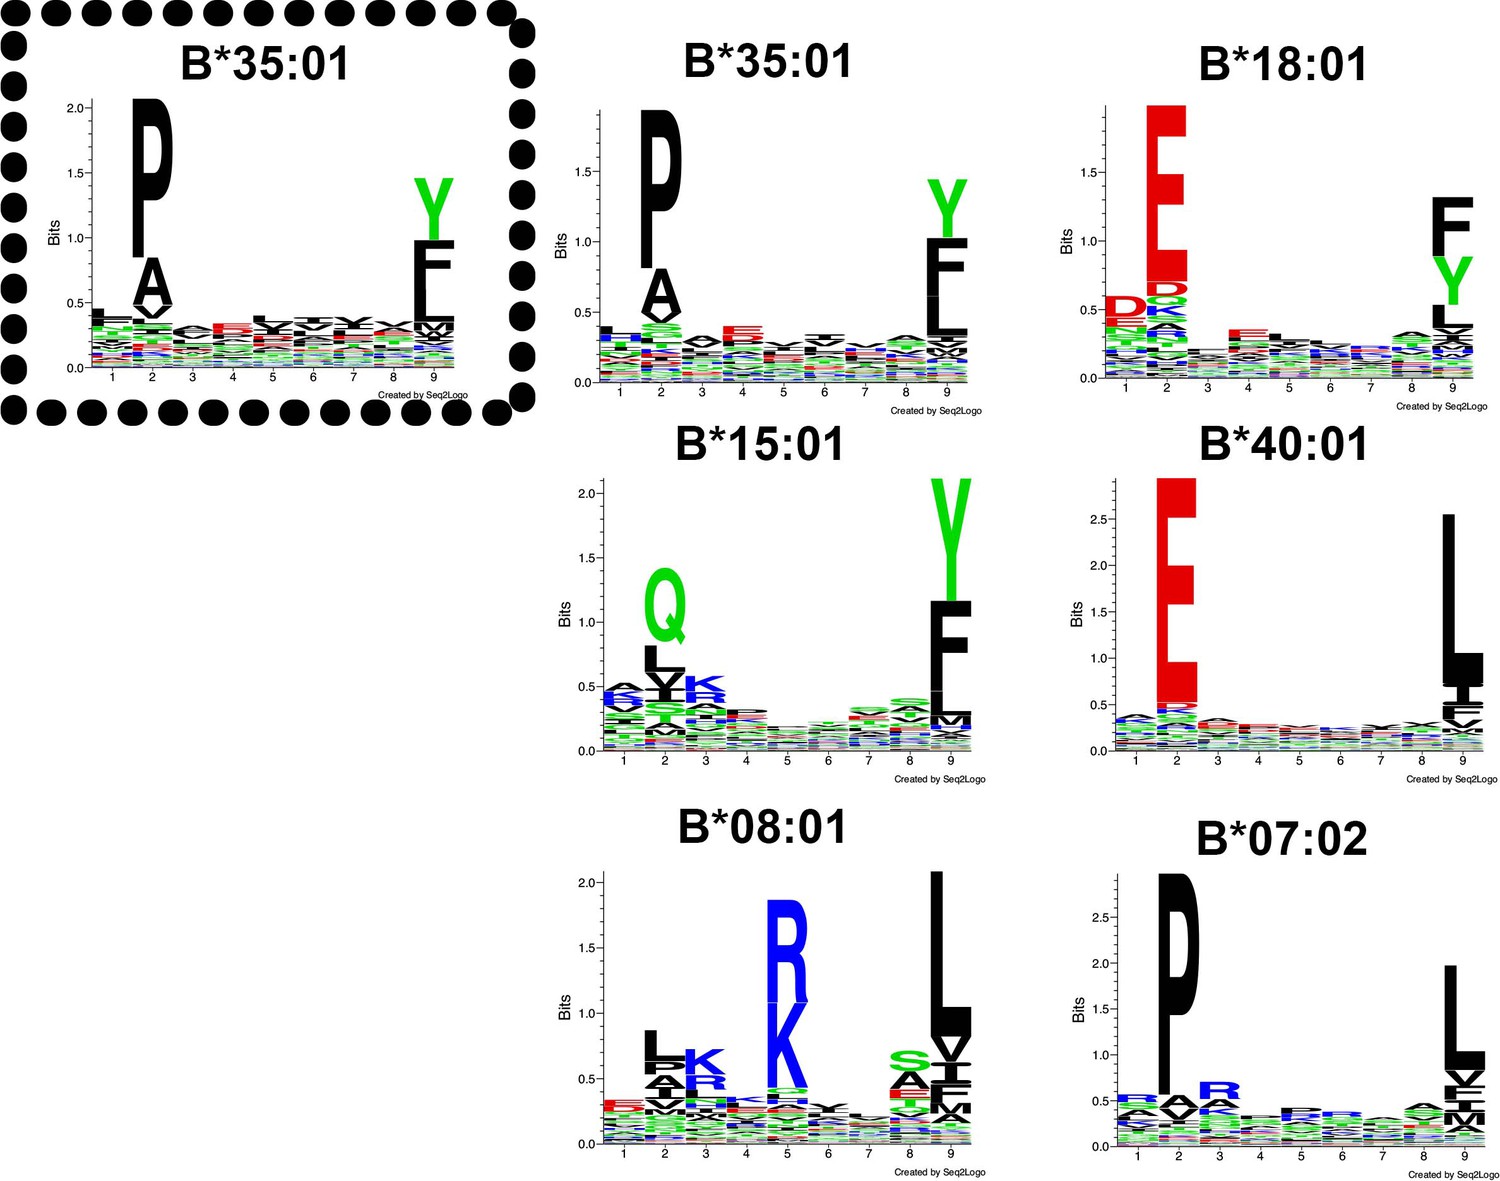
Peptide-binding motifs of several HLA-Bw6 allotypes relevant to this study.
Peptides were analyzed using seq2logo: http://www.cbs.dtu.dk/biotools/Seq2Logo/ (Thomsen and Nielsen, 2012). Peptides for the boxed allele (left panel) were derived from a published dataset based on the immunoaffinity method (Abelin et al., 2017) and others were obtained from a published dataset based on acid elution of cells and epitope predictions (Pearson et al., 2016).
Figure 1—figure supplement 2
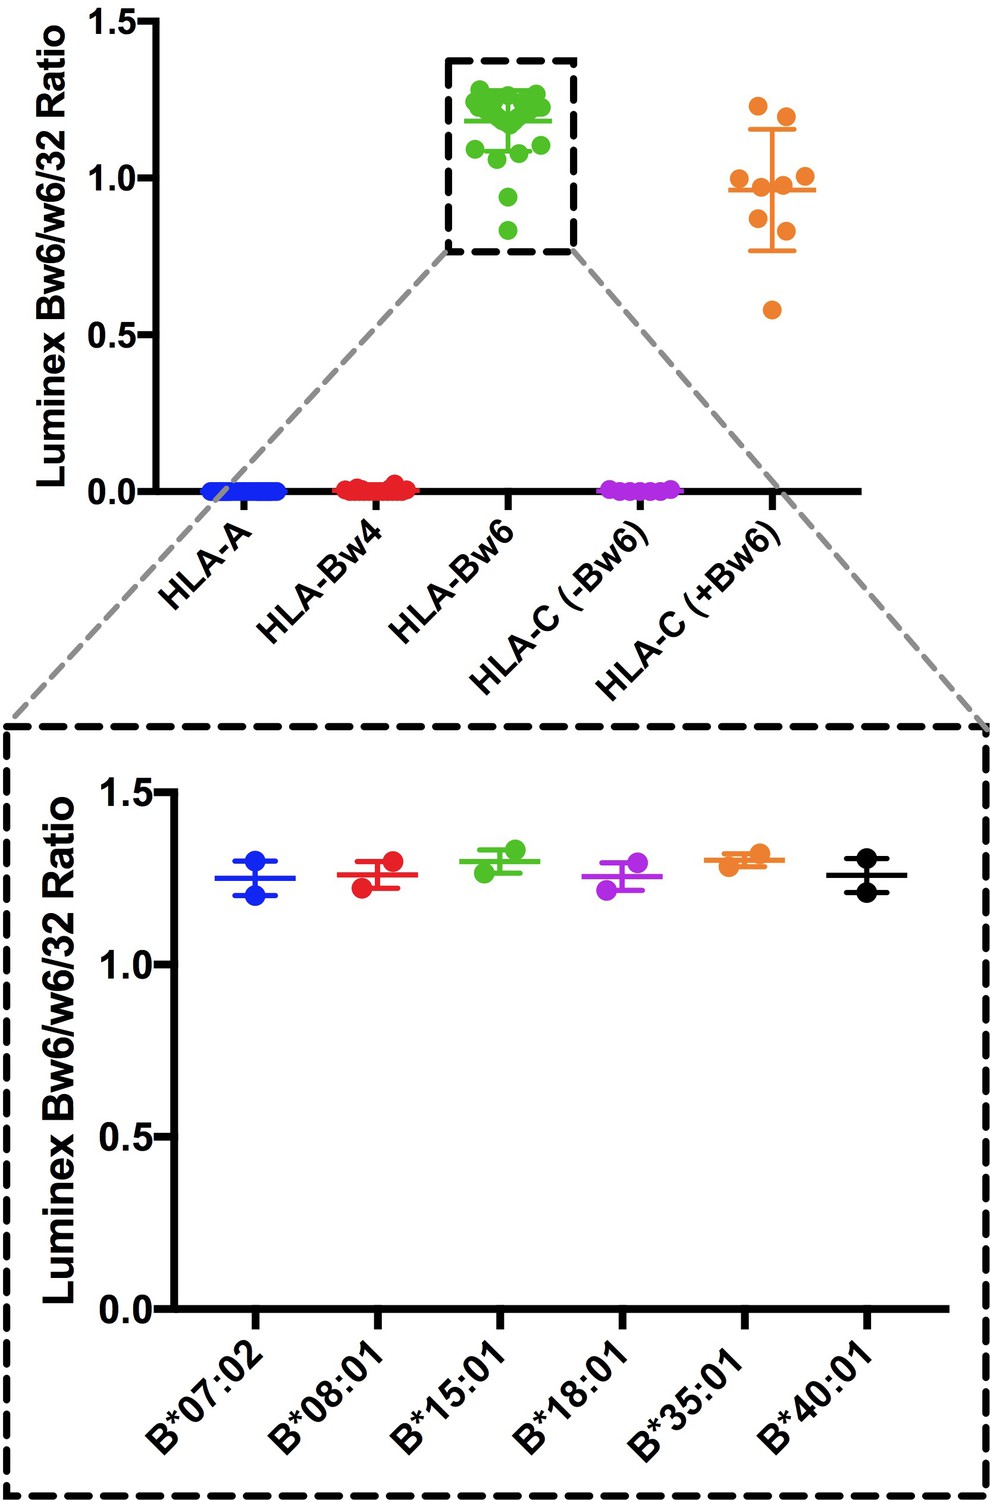
Validations of anti-Bw6.
Top panel: Anti-Bw6 (One Lambda BiH0038) was assessed for binding to different HLA class I conjugated to Luminex beads (Class I-LS1A04NC. LABScreen, One Lambda Inc.). Signals are plotted as ratios relative to those obtained with W6/32, a pan HLA class I antibody. Bottom panels: Relative binding of anti-Bw6 to HLA-B allotypes relevant to this study. Binding was similar across the Bw6 allotypes for which expression and stability measurements are reported here. Data are based on two independent binding measurements.
Figure 1—figure supplement 3
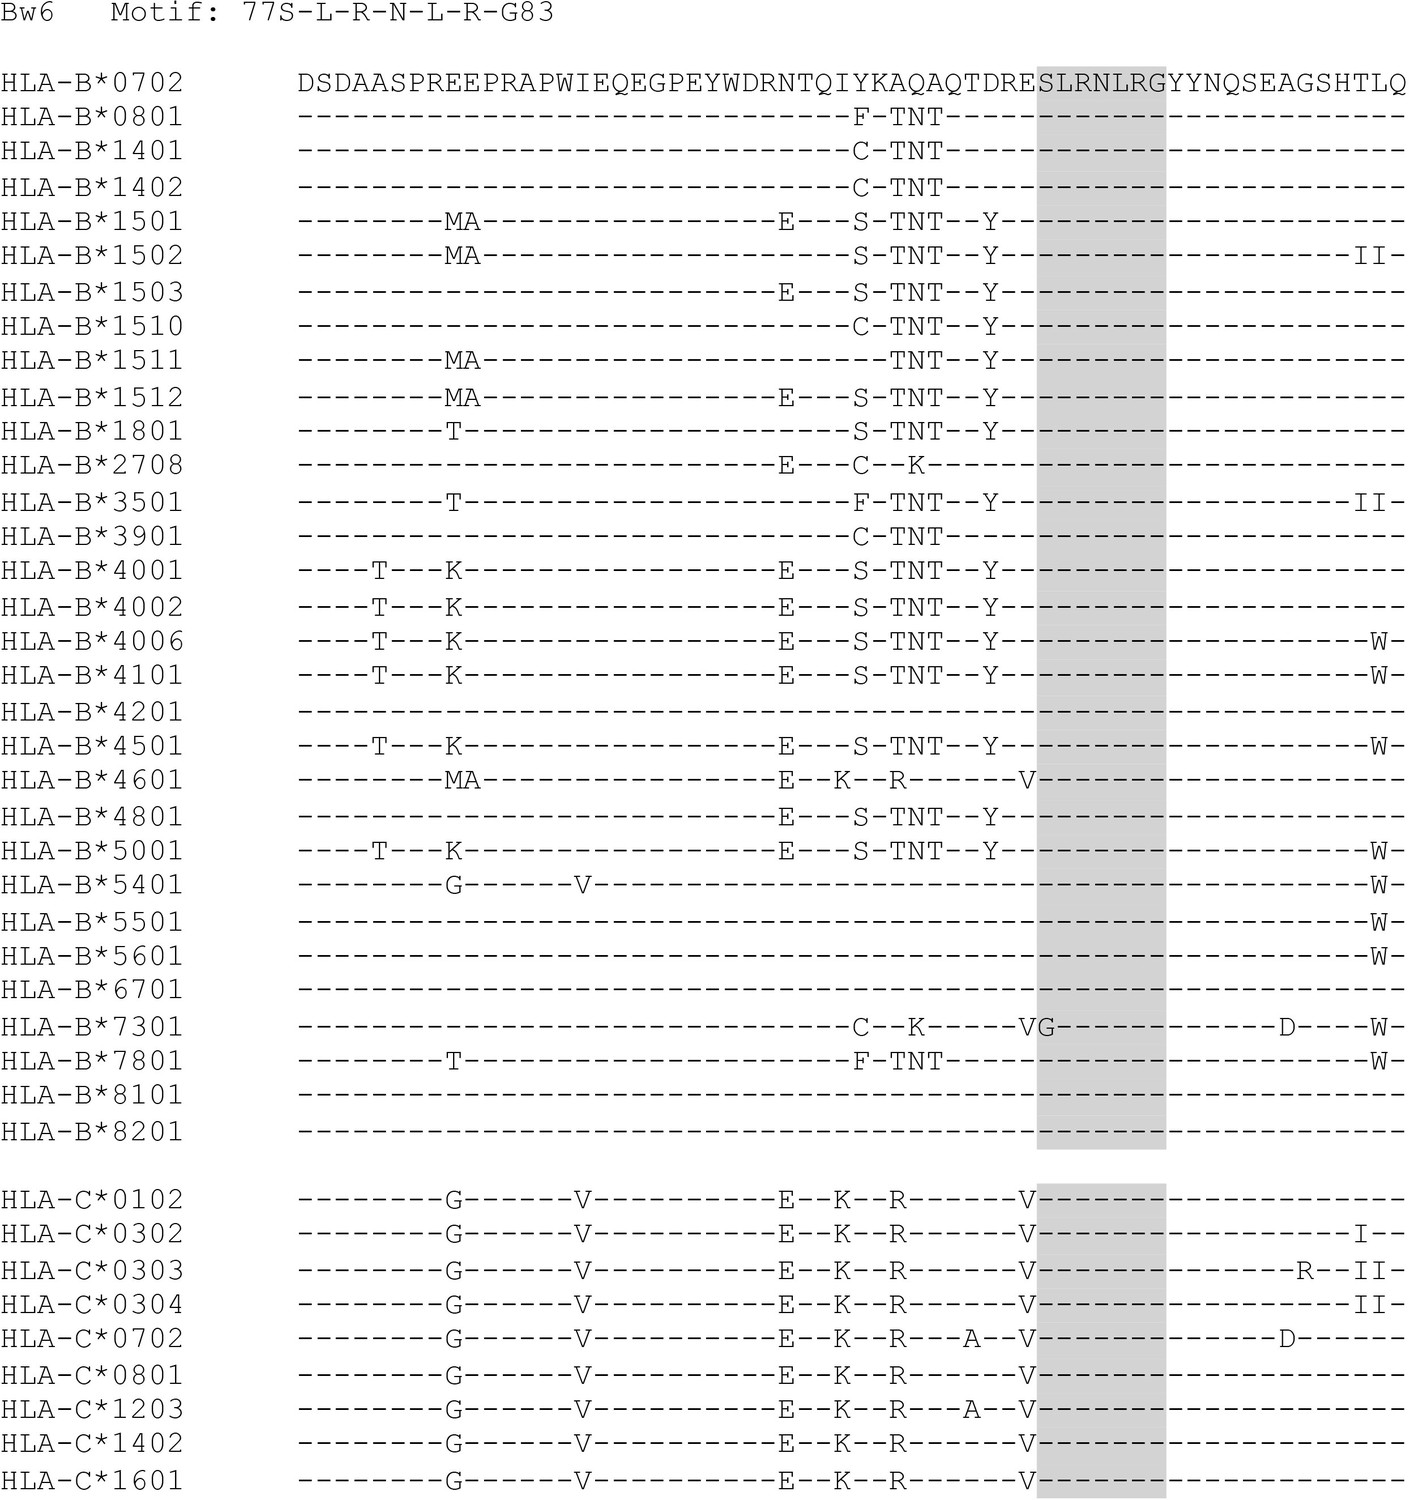
Sequences of HLA-B and HLA-C alleles with a Bw6 motif.
Relevant HLA-B and HLA-C alleles are aligned at the Bw4/6 region.
Figure 1—figure supplement 4
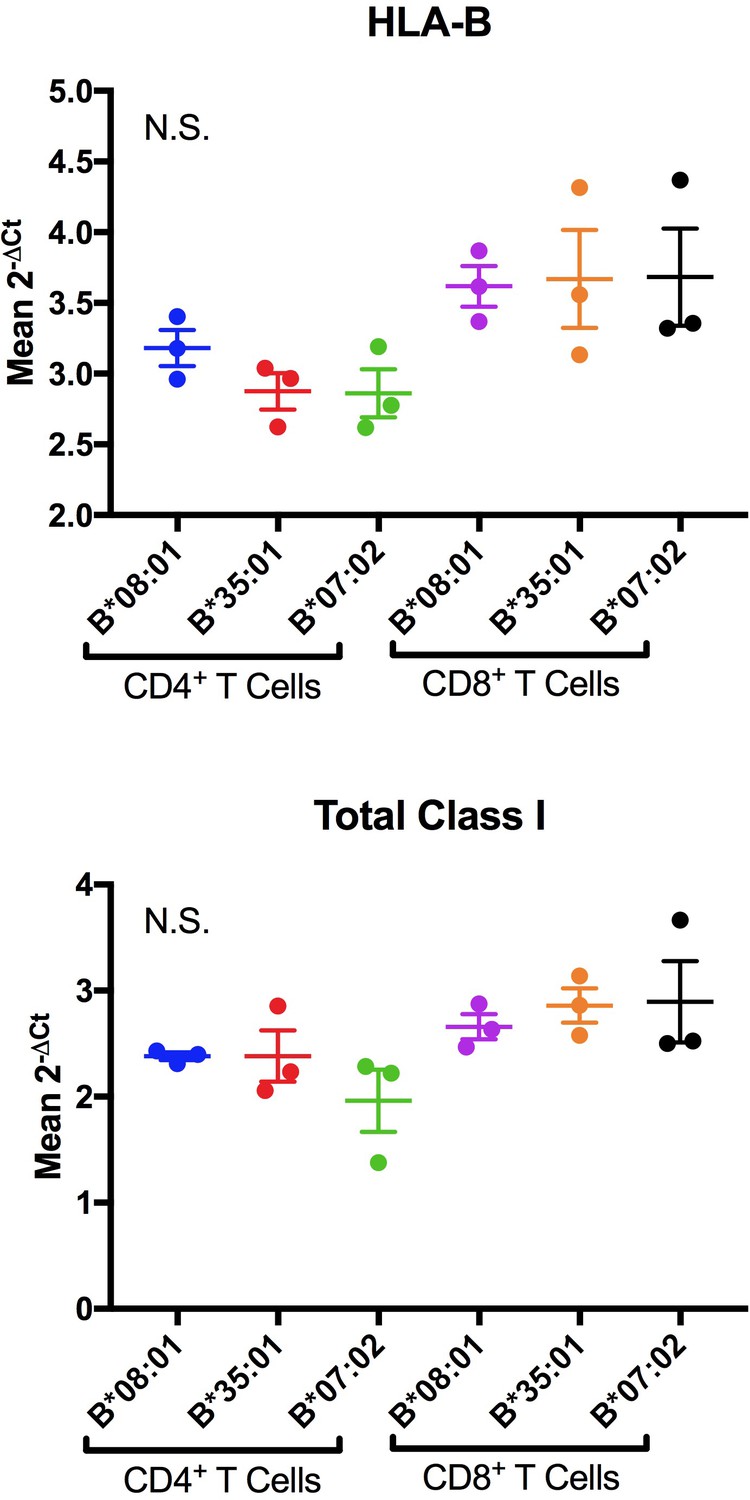
Representative RT-PCR measurements of HLA-B and total class I RNA levels for donors expressing indicated Bw6 alleles.
Three technical replicates with the same cDNA samples were conducted and a one-way ANOVA analysis of the 2-ΔCt values was used to determine significance. Each dot represents the mean 2-ΔCt values across three technical replicates from isolated cells from individual donors expressing the indicated HLA-B allele. Neither the HLA-B specific primer (top panels) nor the total Class I primer (lower panels) showed significant differences in mRNA levels. There was a trend of higher expression in CD8+ T cells but it did not rise to significance. This result was consistent across two biological replicates comparing alleles that showed differences in ABC measurements.
Figure 1—figure supplement 5
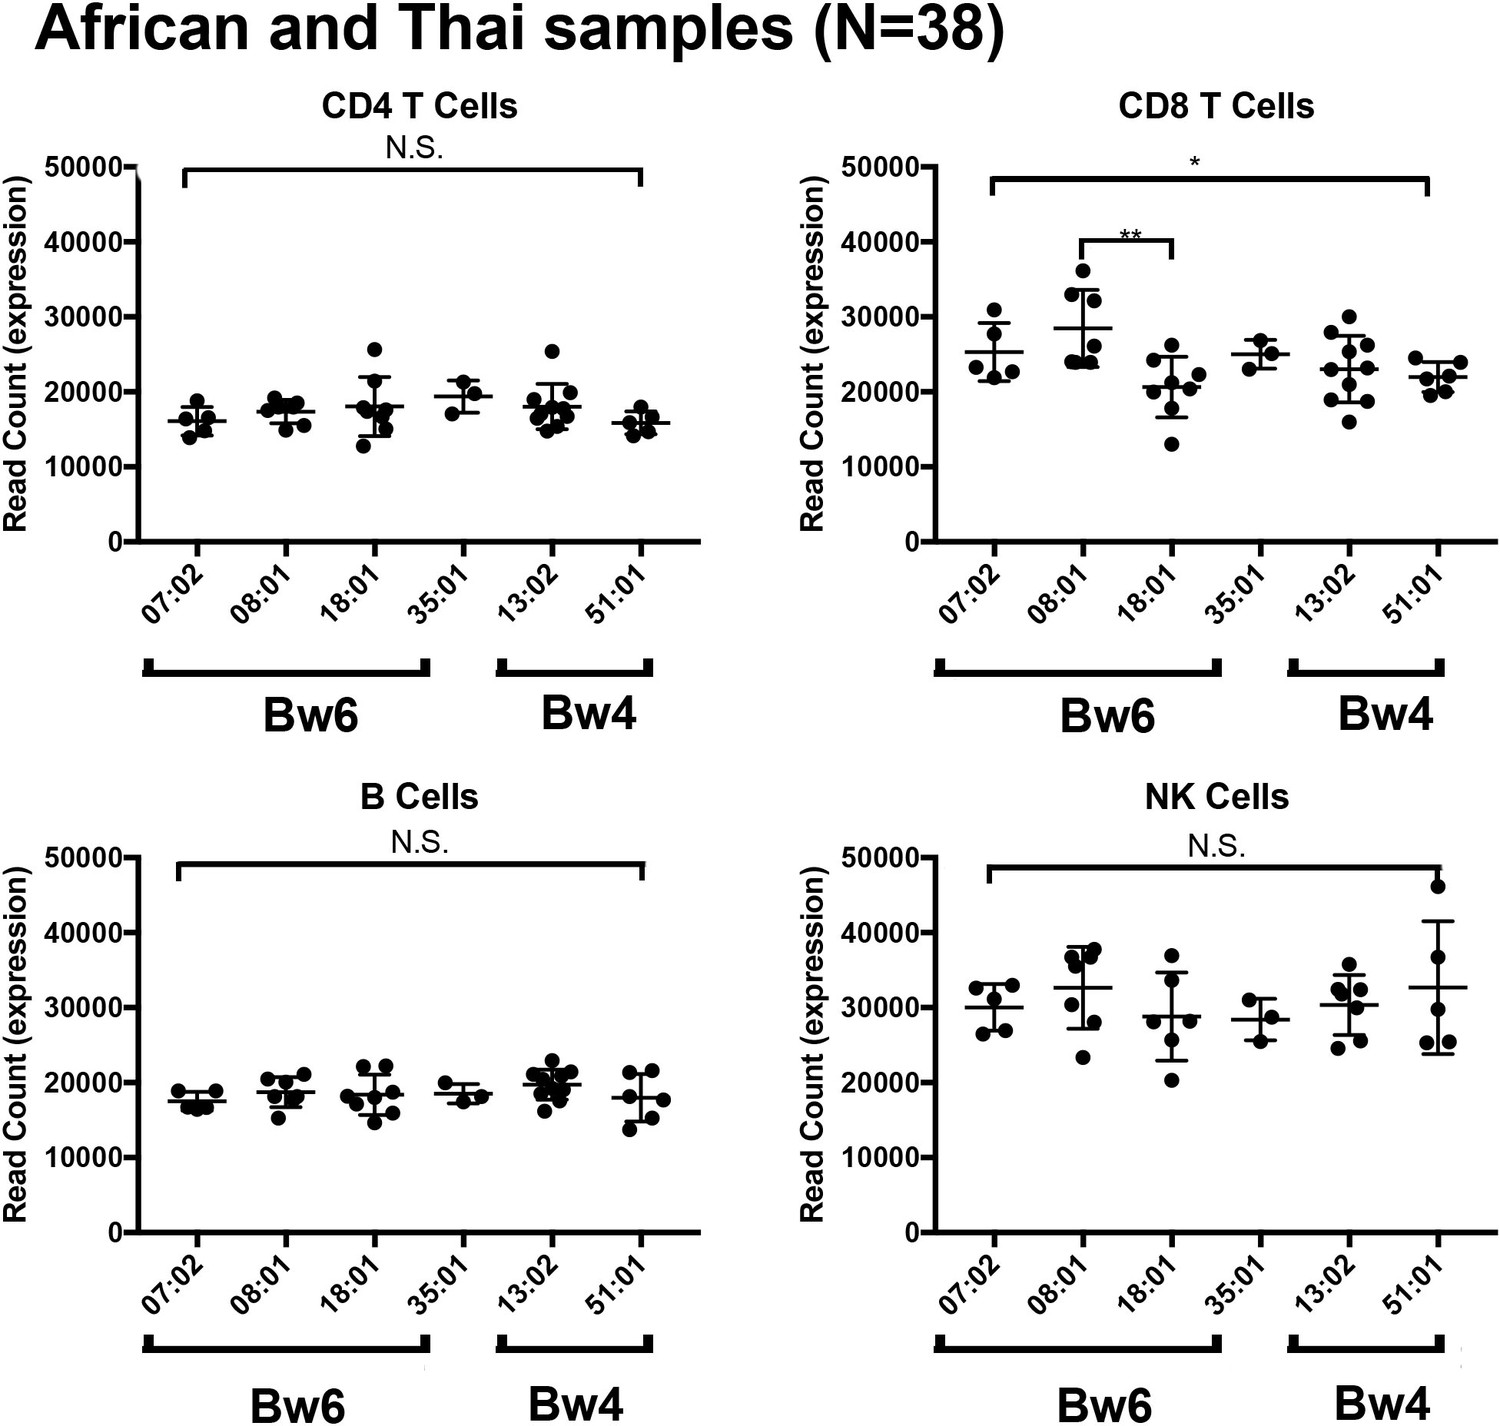
HLA-B mRNA expression within four lymphocyte populations in donors from Africa and Thailand.
Total HLA-B expression of each individual was plotted for the HLA-B allele of interest and averaged expression was compared between alleles for each cell subset. There were no significant differences observed between HLA-B allele mRNA expression in CD4 T cells, B cells and NK cells in all donors consisting of samples from Africa and Thailand. A significant association was observed in the CD8 T cells.
Figure 2
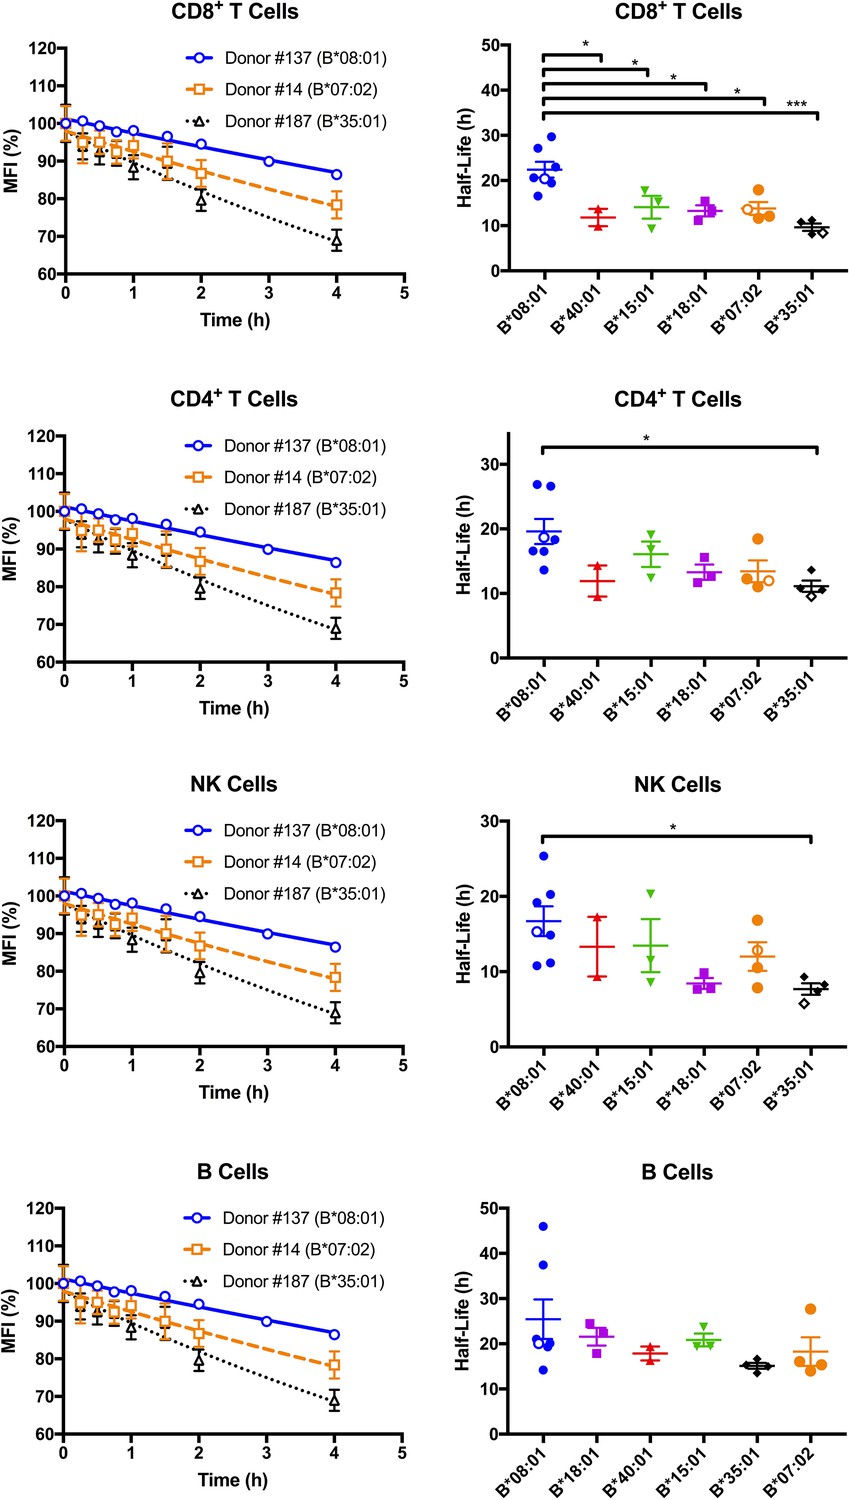
Cell surface stabilities of HLA-Bw6 allotypes are allele-dependent.
Left column: Representative cell surface stability measurements of Bw6 epitopes on freshly isolated lymphocytes derived from Bw4/Bw6 heterozygous donors expressing HLA-B*08:01, HLA-B*35:01 or HLA-B*07:02 as the Bw6 allotype. Right column: Bw6 half-lives from Figure 2—source data 1 are grouped by Bw6 allele. Each data point represents data derived from an individual donor, with the open data points representing donors shown in the left panel. Mean half-life values are shown for each donor, measured using freshly isolated cells from at least two independent blood collections for each donor. The number of replicate measurements for each donor and standard errors of the mean are shown in Figure 2—source data 1. Statistical significance is based on one-way ANOVA analysis. p *<0.05, **<0.01, ***<0.001, and ****<0.0001 This figure has one source data table.
-
Figure 2—source data 1
HLA-Bw6 stability on lymphocytes.
Calculated HLA-Bw6 half-lives on lymphocytes from donors with relevant HLA-B genotypes indicated. The complete HLA class I genotypes of the donors are specified in Figure 1—source data 1. Mean half-life values are shown along with standard errors of mean half-life values (SEM) and the number of measurements (N; from separate blood collections) used for calculating the mean values.
- https://doi.org/10.7554/eLife.34961.011
Figure 3
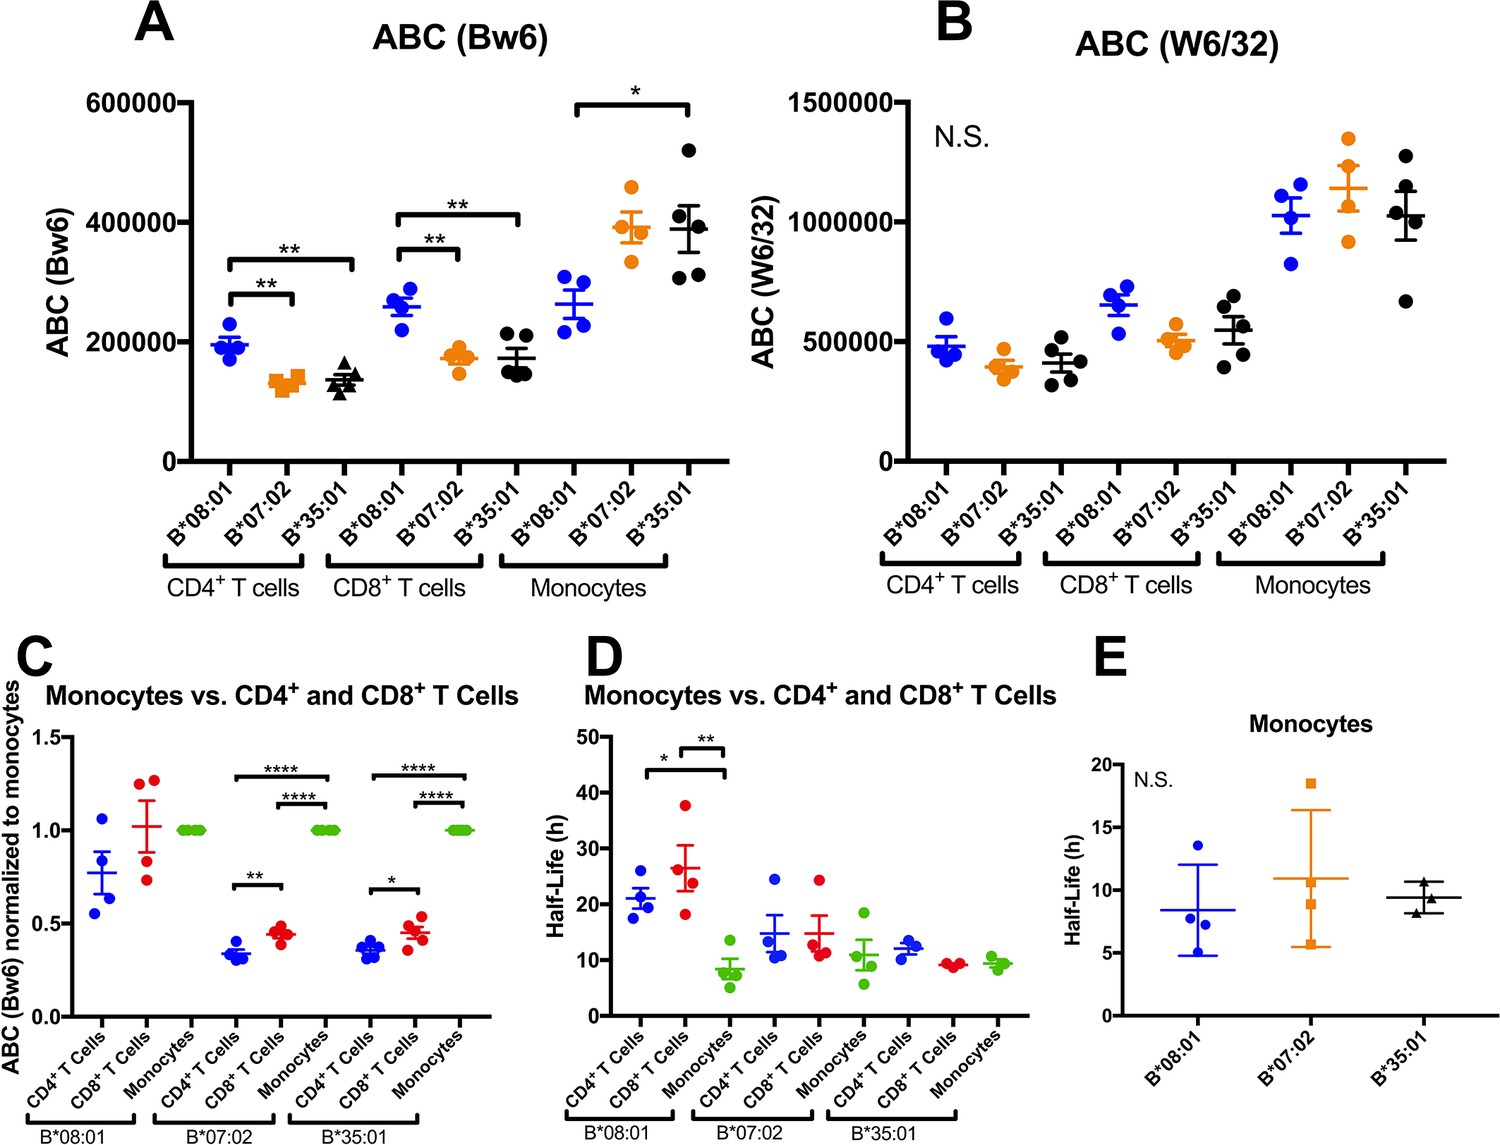
Altered patterns of HLA-Bw6 surface expression and stability in monocytes compared with lymphocytes.
A and B: Blood donations were again obtained from a subset of donors represented in the Figure 1 measurements. Averaged ABC values measured with anti-Bw6 (A) or W6/32 (B) for each donor are shown, grouped by the donor’s HLA-Bw6 alleles and cell subsets. C: For each donor represented in A and B, Bw6 ABC values in lymphocytes are normalized relative to the monocyte values from the same donor, and grouped by the donor’s HLA-Bw6 alleles and cell subsets. Averaged ABC values and data replicates obtained for plots in A-C are shown in Figure 3—source data 1. D: Cell surface stability measurements (obtained as described in Figure 2) of CD4+ and CD8+ T cells in comparison to monocytes. E: Cell surface stability measurements in monocytes of indicated HLA-Bw6 allotype. Half-life values and data replicates obtained for the plots in D and E are shown as Figure 3—source data 2. A-E: Each point represents data from a single donor. Statistical significance is based on one-way ANOVA analysis. p *<0.05, **<0.01, ***<0.001, and ****<0.0001 This figure has two source data tables.
-
Figure 3—source data 1
T Cell and Monocyte Bw6 ABC Values.
Relevant HLA class I genotypes of donors and mean of ABC values measured with anti-Bw6 and W6/32 are shown for each lymphocyte or monocyte subset. The complete HLA class I genotypes of the donors are specified in Figure 1—source data 1. Standard errors of the mean (SEM) values and the number of replicate measurements (N; with separate blood collections) are indicated.
- https://doi.org/10.7554/eLife.34961.013
-
Figure 3—source data 2
HLA-Bw6 stability on monocyte, CD4+ T cell and CD8+ T cell.
Calculated HLA-Bw6 half-lives on leukocytes from donors with relevant HLA-B genotypes indicated. The complete HLA class I genotypes of the donors are specified in Figure 1—source data 1. Mean half-life values are shown along with standard errors of mean half-life values (SEM) and the number of measurements (N; from separate blood collections) used for calculating the mean values.
- https://doi.org/10.7554/eLife.34961.014
Figure 4 with 5 supplements
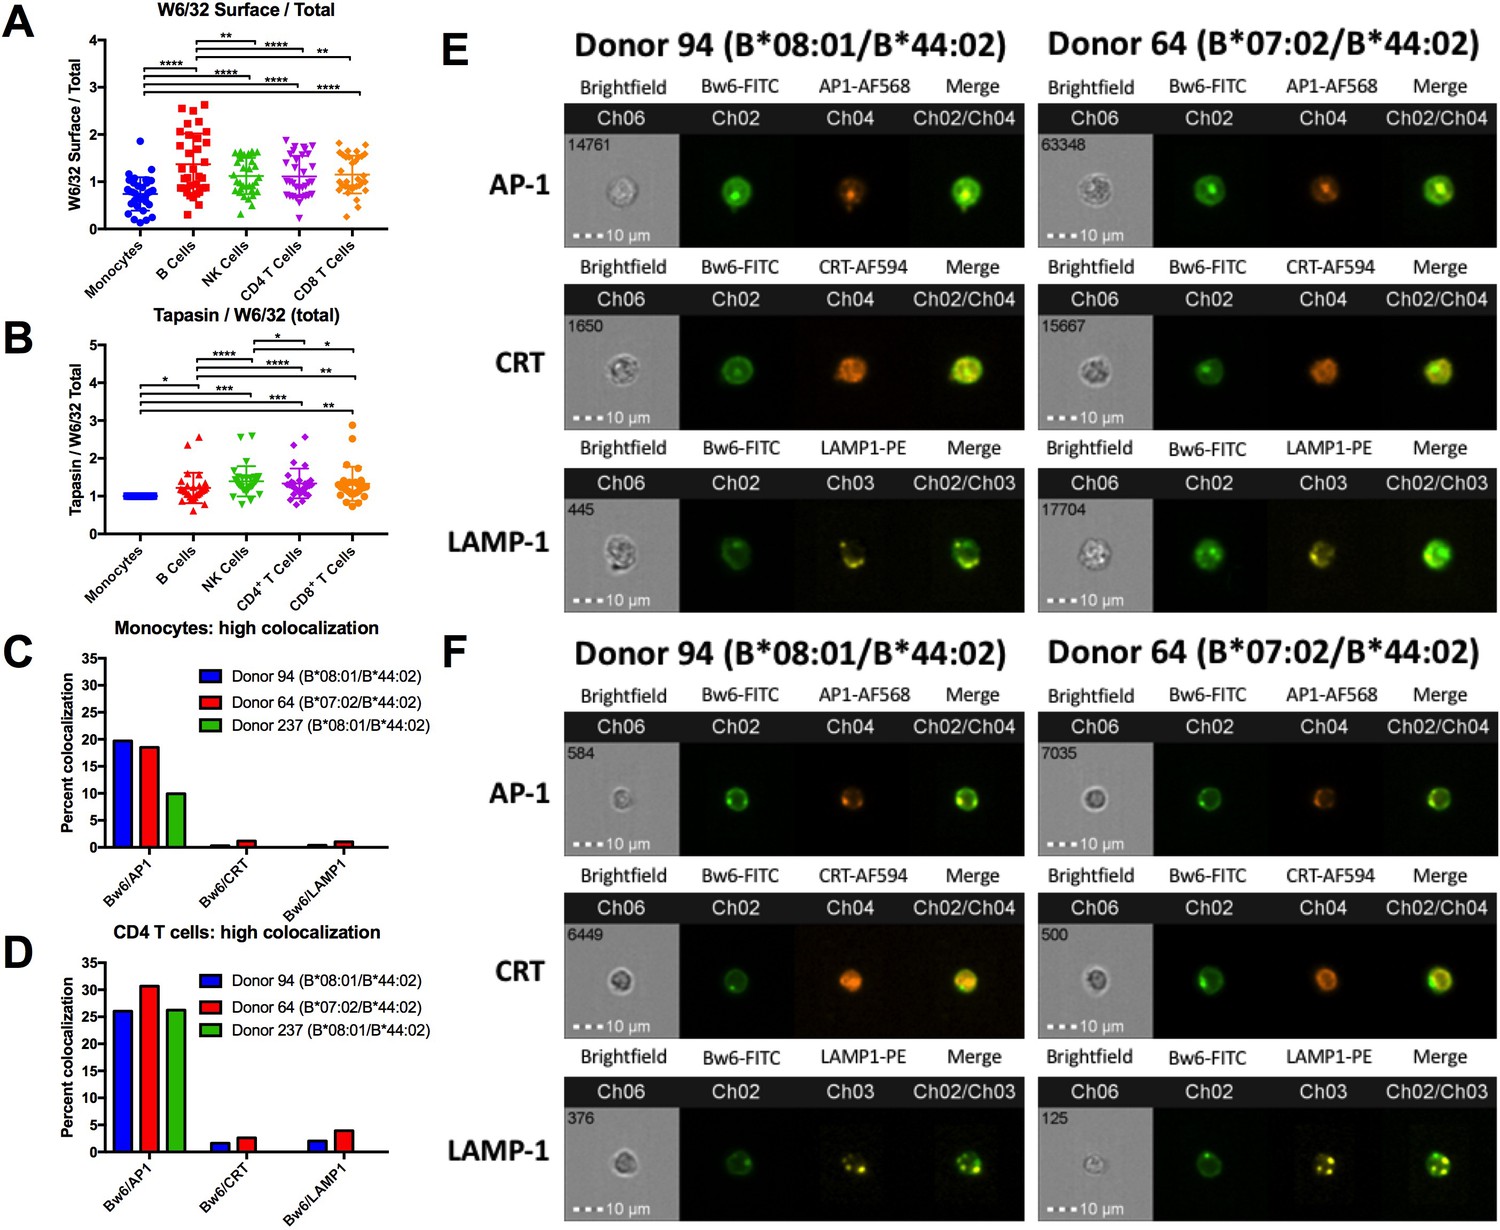
HLA class I assembly differences between monocytes and lymphocytes.
A: Flow cytometry experiments measuring W6/32-based staining of cell surface HLA class I (fixed PBMCs) expressed as a ratio relative to W6/32-based staining of total HLA class I (fixed and permeabilized PBMCs). Each point represents an individual donor measurement, and a total of 33 donor samples were tested. B: PBMCs were fixed and permeabilized, then stained with either anti-tapasin or W6/32 antibodies. The ratio of tapasin MFI relative to the W6/32 MFI was calculated for each cell type, then normalized to the corresponding monocyte ratios. Each point represents an individual donor measurement, and a total of 29 donor samples were tested. C and D: Summary statistics from two ImageStream experiments with three donors in monocytes (C) or CD4+ T cells (D). Bw6 and AP-1 co-localization, Bw6 and CRT co-localization, and Bw6 and LAMP-1 co-localization were quantified for donors 94 and 64. Only Bw6 and AP-1 co-localization was measured for donor 237. E and F: Representative monocyte (E) or CD4+ T cell (F) images for the experiments summarized in Panels C and D. This figure has five supplementary figures and one source data table.
-
Figure 4—source data 1
Imaging cytometry co-localization source data.
The data represents one imaging cytometry experiment performed on two donors: 94 and 64. Genotypes for donors 94 and 64 are indicated in Figure 1—source data 1. In monocytes and CD4+ T cells, Bw6 colocalization is quantified with three different intracellular markers: AP-1 (top), calreticulin (middle), and LAMP-1 (bottom). In imaging cytometry experiments, co-localization is quantified as Bright Detail Similarity (BDS), which is the degree of overlap between the two markers of interest. The red columns represent cell population gates with a high degree of co-localization, yellow columns represent cells with intermediate co-localization, and blue columns represent cells with low co-localization. Intermediate co-localization was calculated only for Bw6/AP-1 co-localization. The first row for each donor is the quantification of the cell count within each gate, the second row is the percentage of cells within a gate, relative to the total number of cells in the previous gate, and the final row is the median BDS for each population. In each cell population, the Bw6+ M2+ column represents cells that are double positive for Bw6 and the second co-localization marker (Marker 2; M2). M2 is AP-1 for the top table, calreticulin for the middle table, and LAMP-1 for the bottom table.
- https://doi.org/10.7554/eLife.34961.021
Figure 4—figure supplement 1
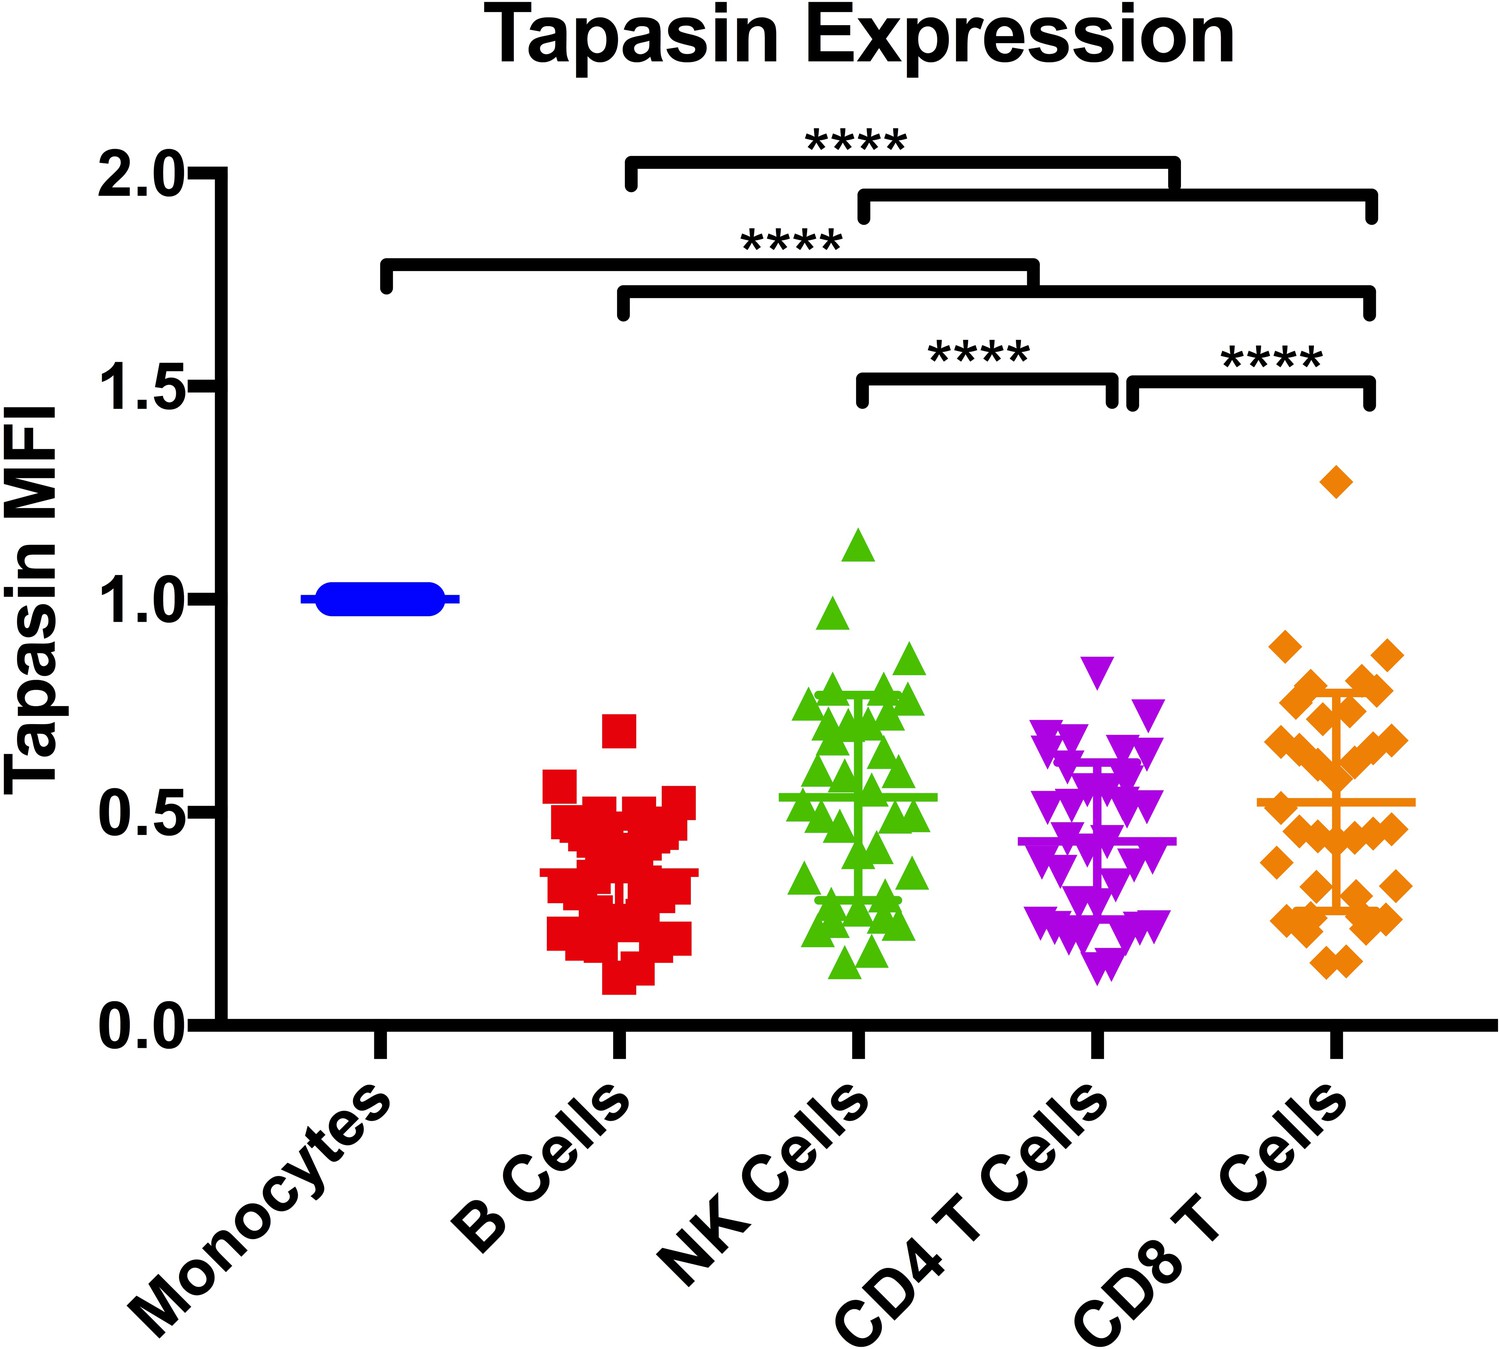
Tapasin expression.
Intracellular tapasin expression measured by flow cytometry with the monoclonal PaSta-1 antibody, and the data were normalized to monocyte expression levels. Each point represents a single measurement on 33 donors. One-way ANOVA analysis was performed, with p ****<0.0001.
Figure 4—figure supplement 2
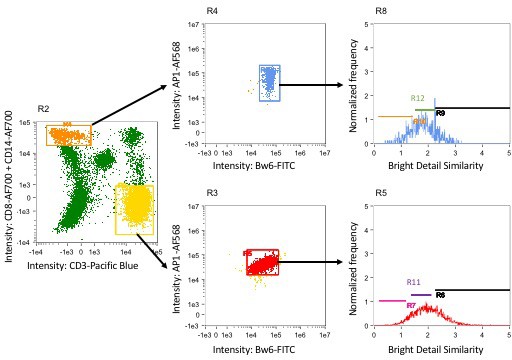
Gating strategy for imaging cytometry experiments.
PBMCs were analyzed on the Amnis ImageStreamX imaging cytometer and gated for cell populations. These populations were then analyzed for colocalization of Bw6 with either AP-1, calreticulin (CRT), or LAMP-1. Gating strategies for monocytes and CD4+ T cells are shown in panel R2. In this panel, CD3-Pacific Blue is plotted on the X axis, and CD8-Alexa Fluor 700 and CD14-Alexa Fluor 700 are plotted on the Y axis. CD4+ T cells were identified by gating on the CD3+, CD8- cells (gate R3), and monocytes were identified by gating CD3-, CD14+ cells (gate R4). These populations were then gated on cells that were double positive for the two co-localization markers of interest, and these double positive cells were analyzed for Bright Detail Similarity (BDS) in panels R5 and R8. BDS is a quantification of the degree of overlap between two markers. Thus, cells with a high BDS score have a high degree of co-localization between the two markers analyzed. Panels R5 and R8 show the gates used to quantify cells with high, intermediate, and low co-localization.
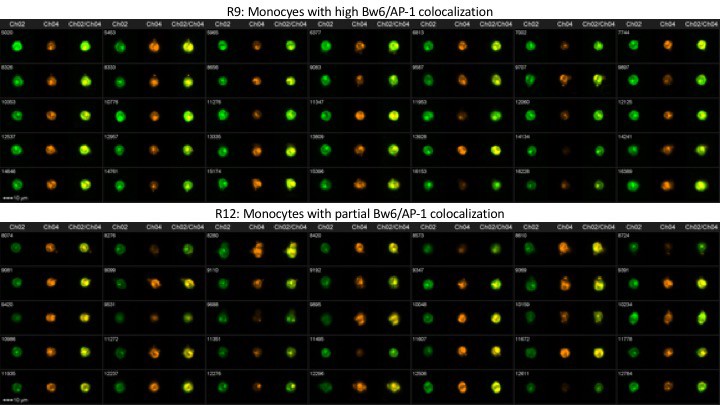
Figure 4—figure supplement 3
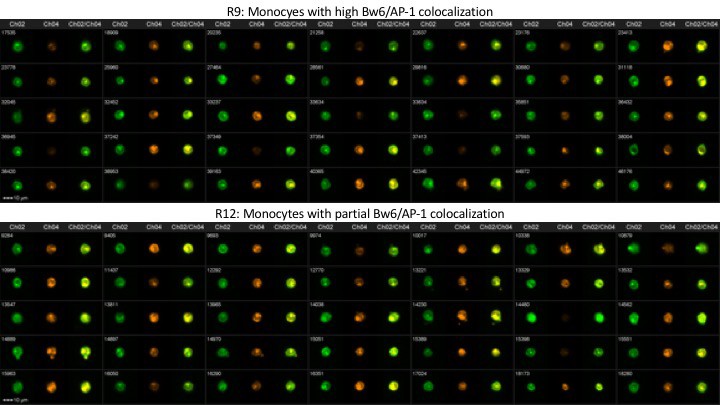
Representative image gallery for Donor 64 monocytes.
PBMCs from donor 64 were analyzed by imaging cytometry for Bw6/AP-1 co-localization. The top panel represents gate R9—monocytes with high Bw6/AP-1 co-localization—while the bottom panel represents gate R12—monocytes with an intermediate degree of Bw6/AP-1 co-localization (defined as in Figure 4—figure supplement 2).
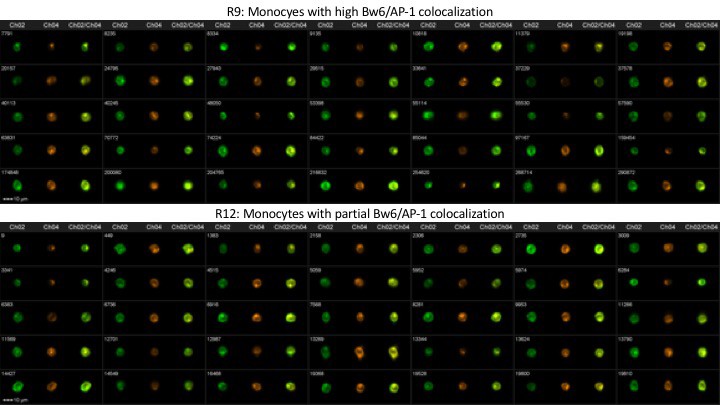
Figure 4—figure supplement 4
Representative image gallery for Donor 94 monocytes.
PBMCs from donor 94 were analyzed by imaging cytometry for Bw6/AP-1 colocalization. The top panel represents gate R9—monocytes with high Bw6/AP-1 colocalization—while the bottom panel represents gate R12—monocytes with intermediate Bw6/AP-1 colocalization (defined as in Figure 4—figure supplement 2).
Figure 4—figure supplement 5
Representative image gallery for Donor 237 monocytes.
PBMCs from donor 237 were analyzed by imaging cytometry for Bw6/AP-1 colocalization. The top panel represents gate R9—monocytes with high Bw6/AP-1 colocalization—while the bottom panel represents gate R12—monocytes with intermediate Bw6/AP-1 colocalization (defined as in Figure 4—figure supplement 2).
Figure 5
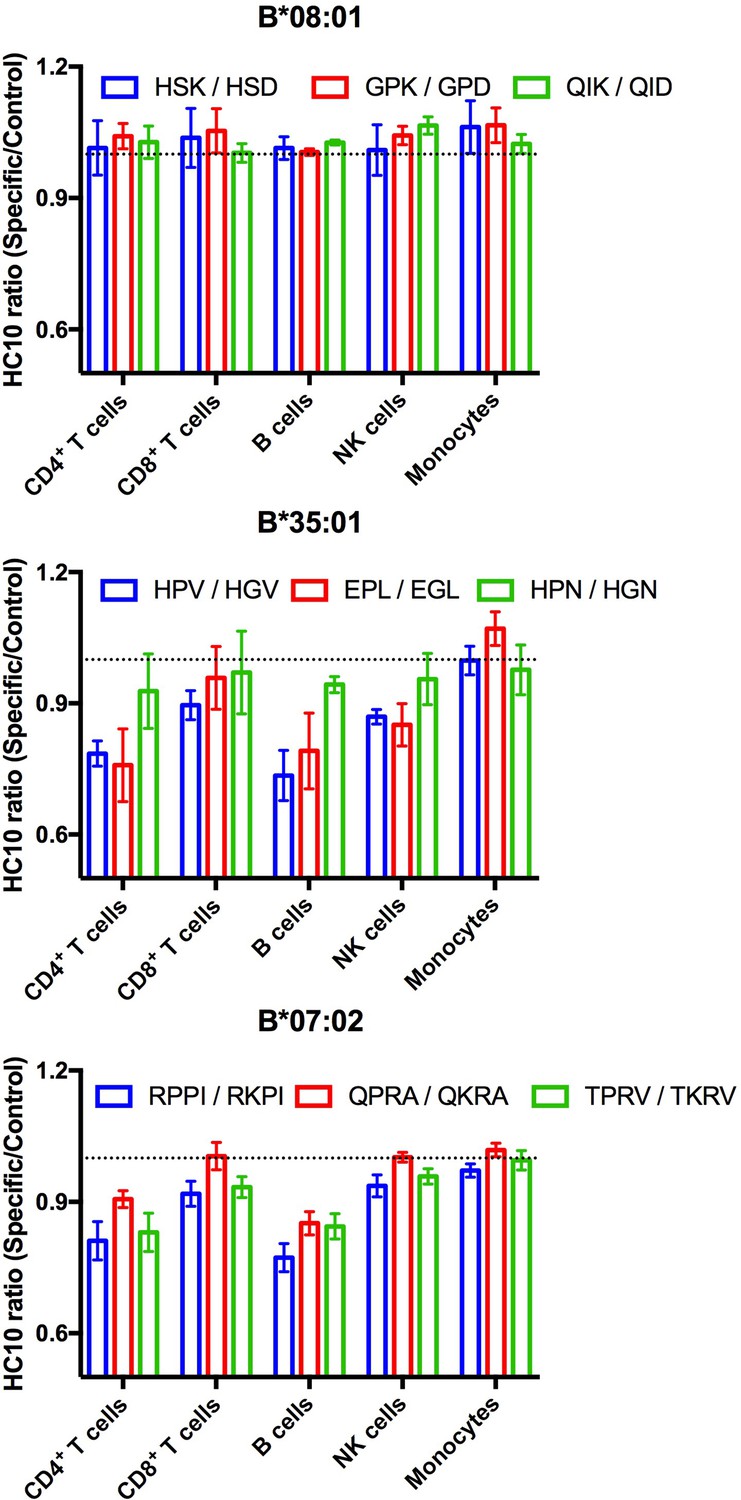
Lymphocyte HLA-B*35:01 and HLA-B*07:02 are receptive to exogenous peptides.
PBMCs were freshly isolated from healthy donors expressing one copy of the indicated HLA-B allele and incubated with 100 μM of specific or matched control peptides for each allotype for four hours at 37°C. The cells were then stained with an antibody cocktail containing antibodies to differentiate lymphocyte subsets, as well as HC10, a monoclonal antibody that recognizes peptide-deficient HLA class I molecules. The data are shown for CD4+ and CD8+ T cells, B cells, NK cells, and monocytes. Data are representative of 1-2 separate measurements for each donor, with 3-5 donors per allele, as specified in Figure 5—source data 1. This figure has one source data table.
-
Figure 5—source data 1
PBMC peptide receptivity source data.
Peptide receptivity (HC10 ratios (binding/control peptide)) in lymphocytes and monocytes. Full donor genotypes are indicated in Figure 1—source data 1.
- https://doi.org/10.7554/eLife.34961.023
Figure 6 with 4 supplements
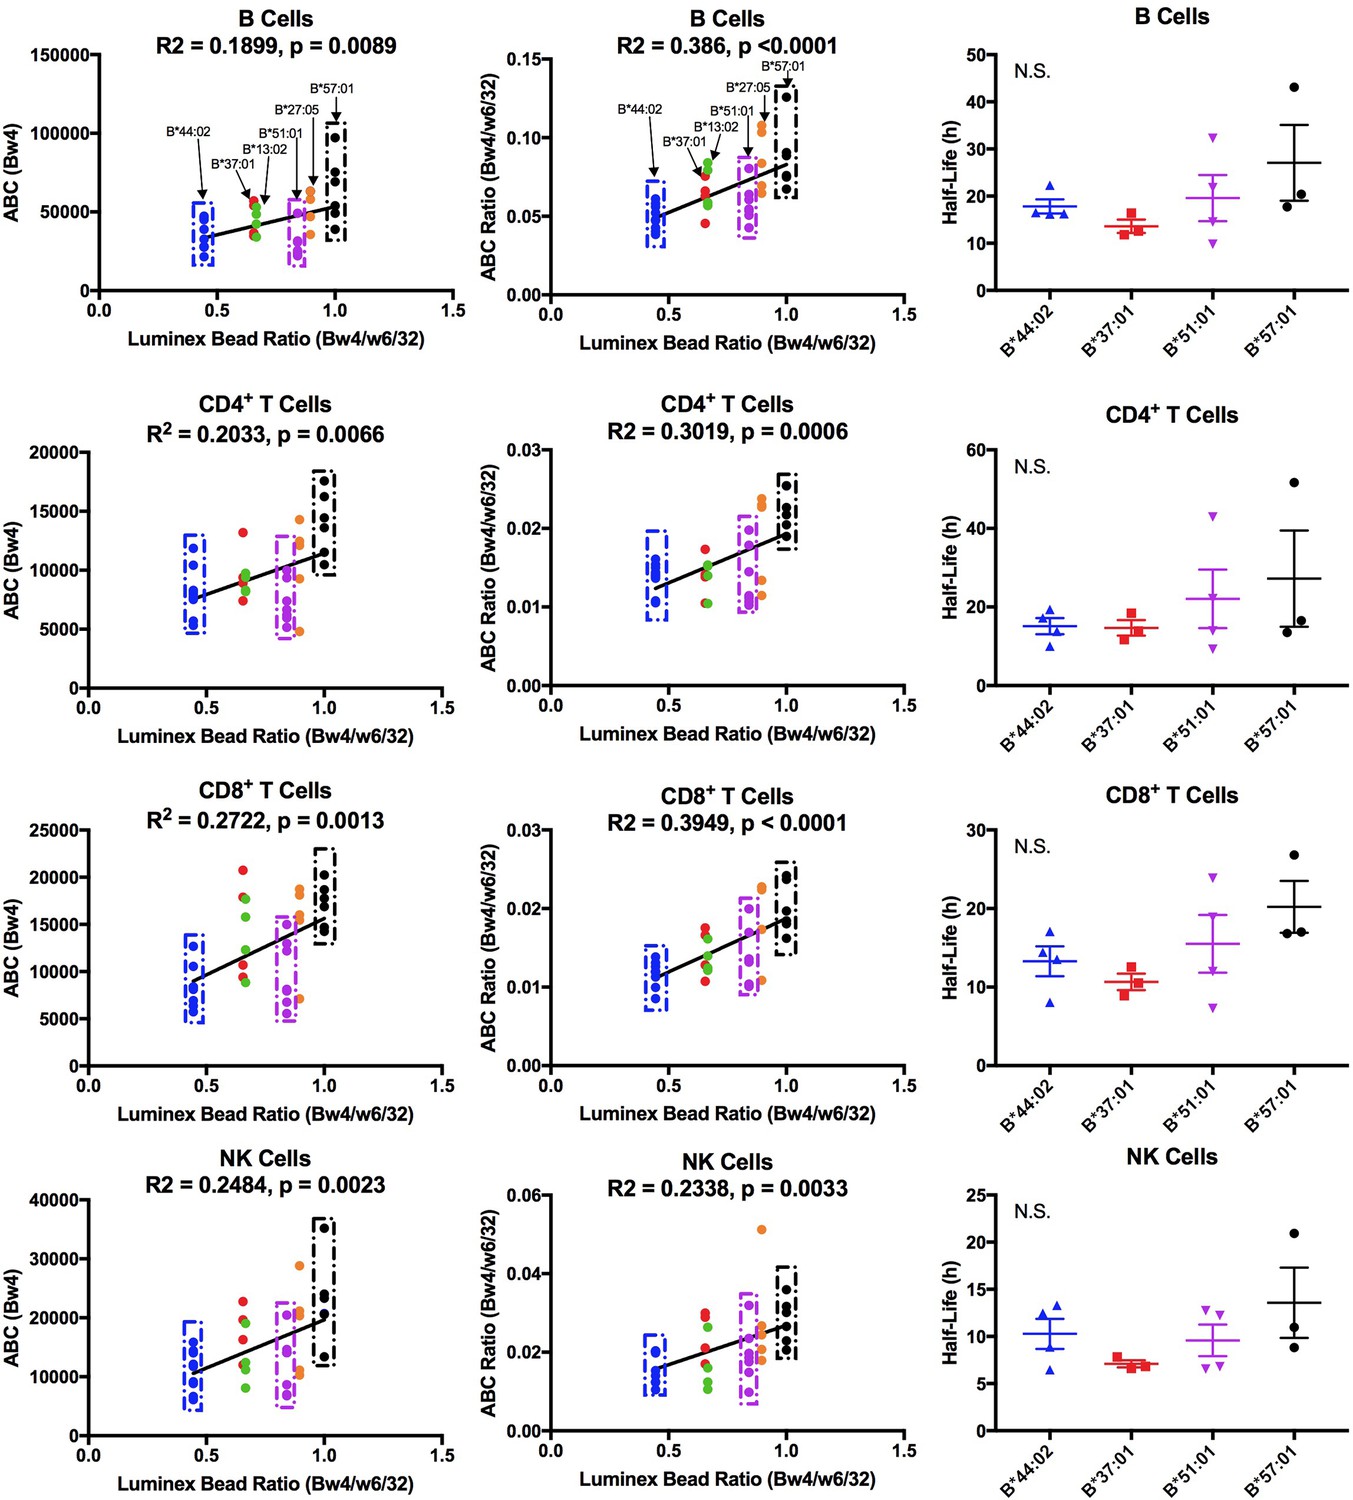
Cell-derived Bw4 ABC values correlate with anti-Bw4 binding preferences (with the exception of B*51:01) and similar cell surface stabilities are measured for the indicated Bw4 allotypes.
Columns 1 and 2: Lymphocyte ABC values for Bw4/Bw6 heterozygous donors expressing indicated Bw4 genotypes (and lacking cross-reactive HLA-A) were measured using anti-Bw4 and W6/32 (all donor information is specified in Figure 6—source data 1). Resulting Bw4 ABC data (column 1) or Bw4/W6/32 ABC ratios (column 2) are grouped for donors based on their Bw4 genotypes, and plotted against the corresponding Luminex Bw4/W6/32 signals obtained from Figure 6—figure supplement 1). Column 3: Averaged cell surface stability measurements of Bw4 epitopes on freshly isolated lymphocytes derived from Bw4/Bw6 heterozygous donors expressing indicated Bw4 allotypes. Half-life statistical significance is based on one-way ANOVA analysis using data in Figure 6—source data 2. This figure has four supplementary figures and two source data tables.
-
Figure 6—source data 1
Bw4 ABC Values.
HLA class I genotypes of donors used for Bw4 measurements, and mean of ABC values measured with anti-Bw4 and W6/32 are shown for each lymphocyte subset. The HLA-B-Bw4 allele of each donor is highlighted in bold. Standard errors of the mean (SEM) values and the number of replicate measurements (N; with separate blood collections) are indicated.
- https://doi.org/10.7554/eLife.34961.029
-
Figure 6—source data 2
HLA-Bw4 stability on lymphocytes.
Calculated HLA-Bw4 half-lives on lymphocytes from donors with relevant HLA-B genotypes indicated. The complete HLA class I genotypes of the donors are specified in Figure 6—source data 1. Mean half-life values are shown along with standard errors of mean half-life values (SEM) and the number of measurements (N; from separate blood collections) used for calculating the mean values.
- https://doi.org/10.7554/eLife.34961.030
Figure 6—figure supplement 1
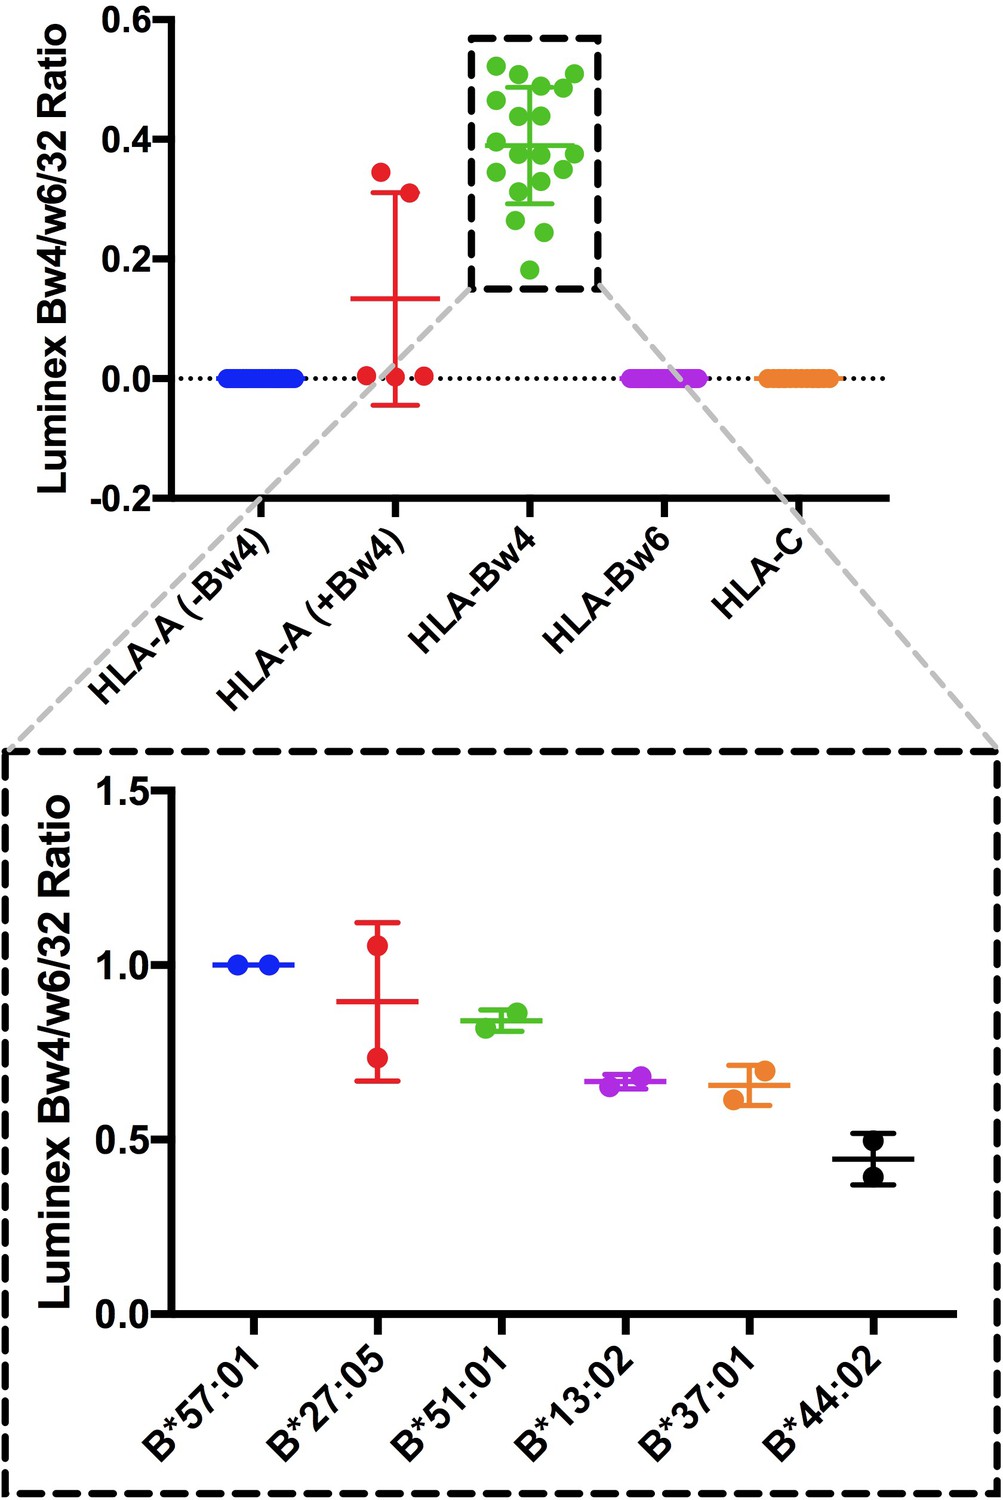
Specificity and relative binding propensity of anti-Bw4.
Top panel: Anti-Bw4 (One Lambda BiH0007) was assessed for binding to different HLA class I conjugated to Luminex beads (Class I-LS1A04NC. LABScreen, One Lambda Inc.). Signals are plotted as ratios relative to those obtained with W6/32, a pan HLA class I antibody. Bottom panels: Relative binding of anti-Bw4 to HLA-B allotypes relevant to this study. Differences are measured in the binding of anti-Bw4 across the Bw4 allotypes for which expression and stability measurements are reported here. Data are based on two independent binding measurements.
Figure 6—figure supplement 2
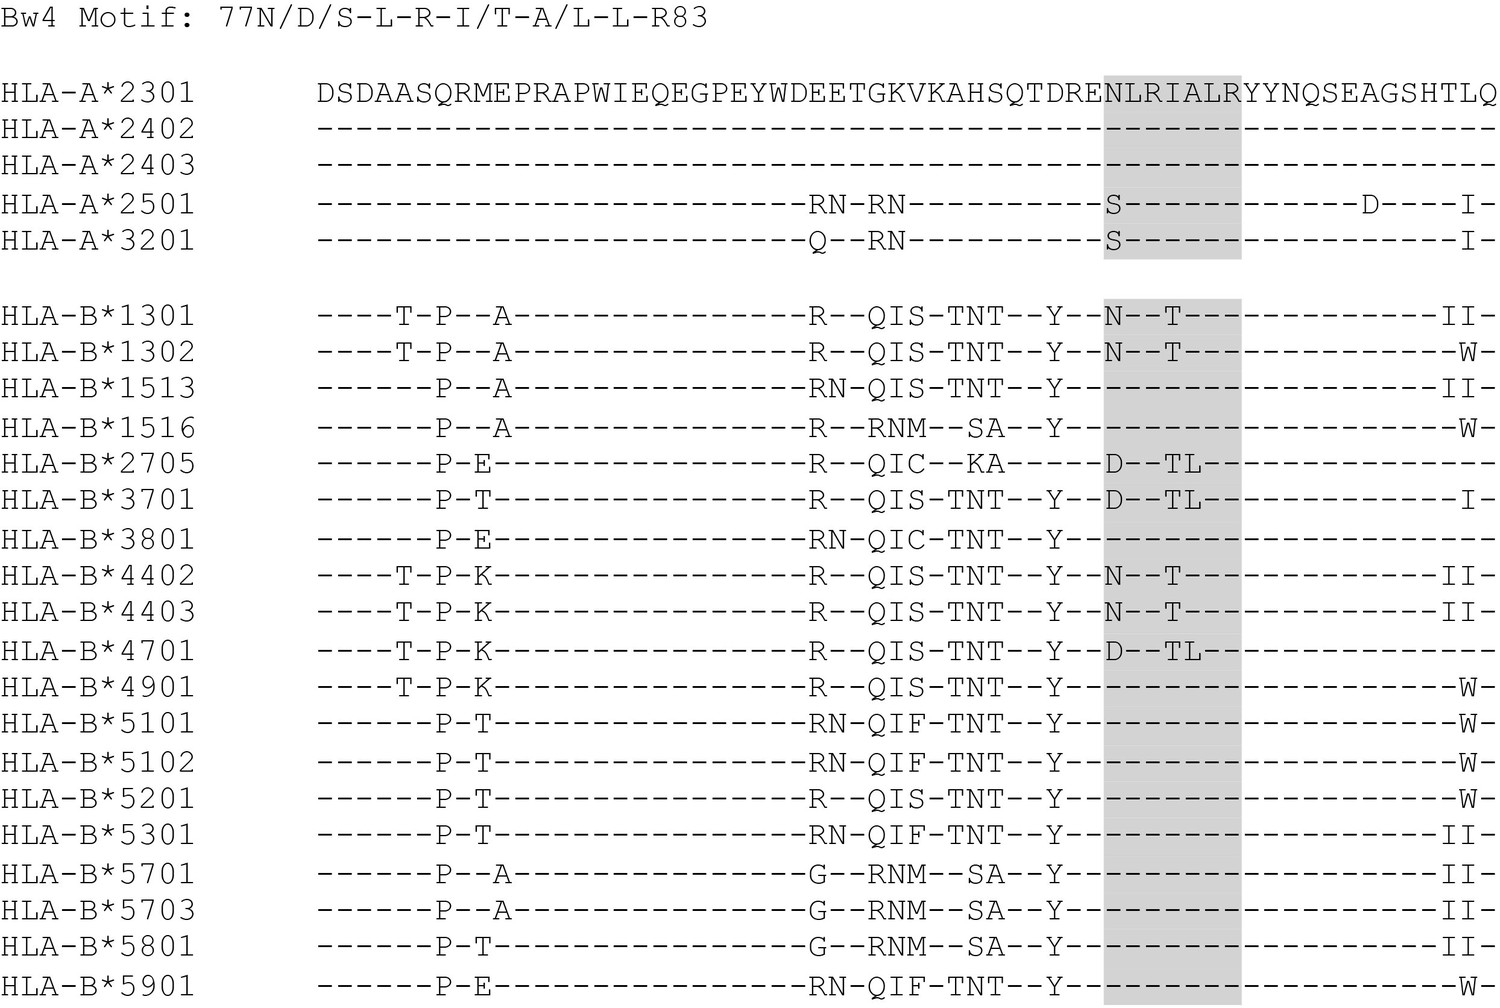
Sequences of HLA-B and HLA-A alleles with a Bw4 motif.
Relevant HLA-B and HLA-A alleles are aligned at the Bw4/6 region.
Figure 6—figure supplement 3
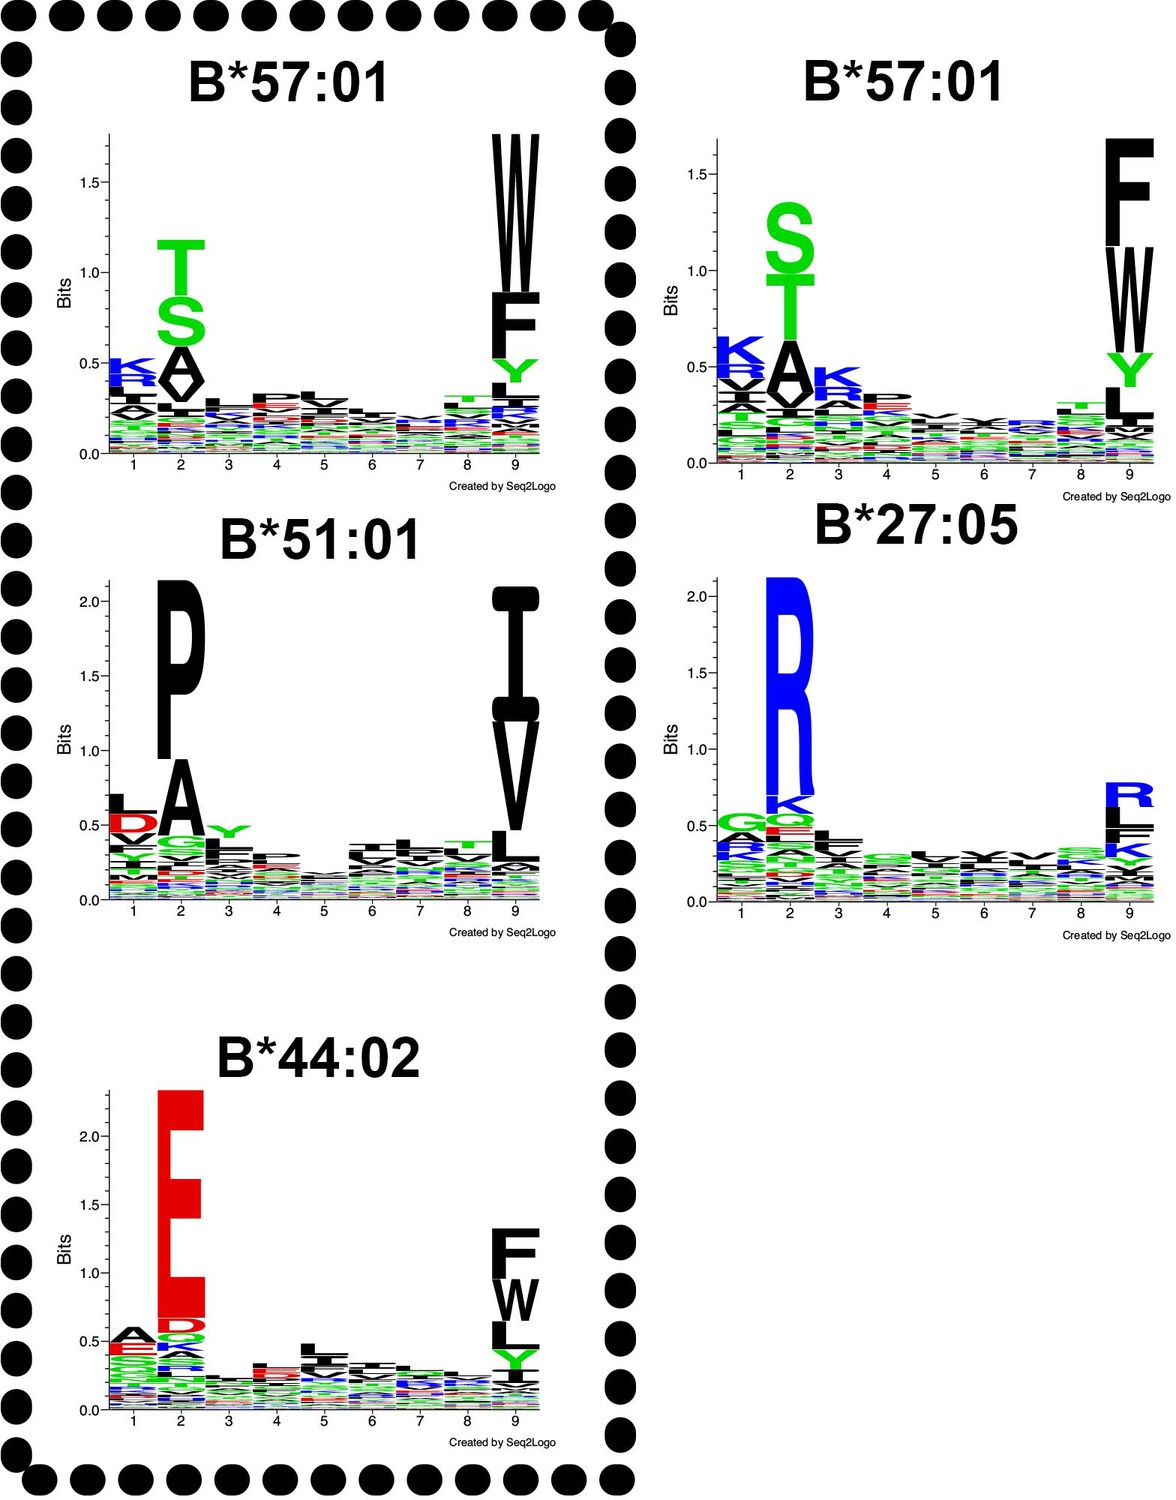
Peptide-binding motifs of several HLA-Bw4 allotypes relevant to this study.
Peptides were analyzed using seq2logo: http://www.cbs.dtu.dk/biotools/Seq2Logo/ (Thomsen and Nielsen, 2012). Peptides for the boxed alleles (left panel) were derived from a published dataset based on the immunoaffinity method (Abelin et al., 2017) and peptides for the right panels were obtained from a published dataset based on acid elution of cells and epitope predictions (Pearson et al., 2016). Neither study included HLA-B*37:01, which belongs to the B44 supertype, and thus is expected to have a motif similar to B*44:02. B*13:02 was described in Pearson et al. (2016), but epitope prediction tools are not well-developed for this allotype.
Figure 6—figure supplement 4
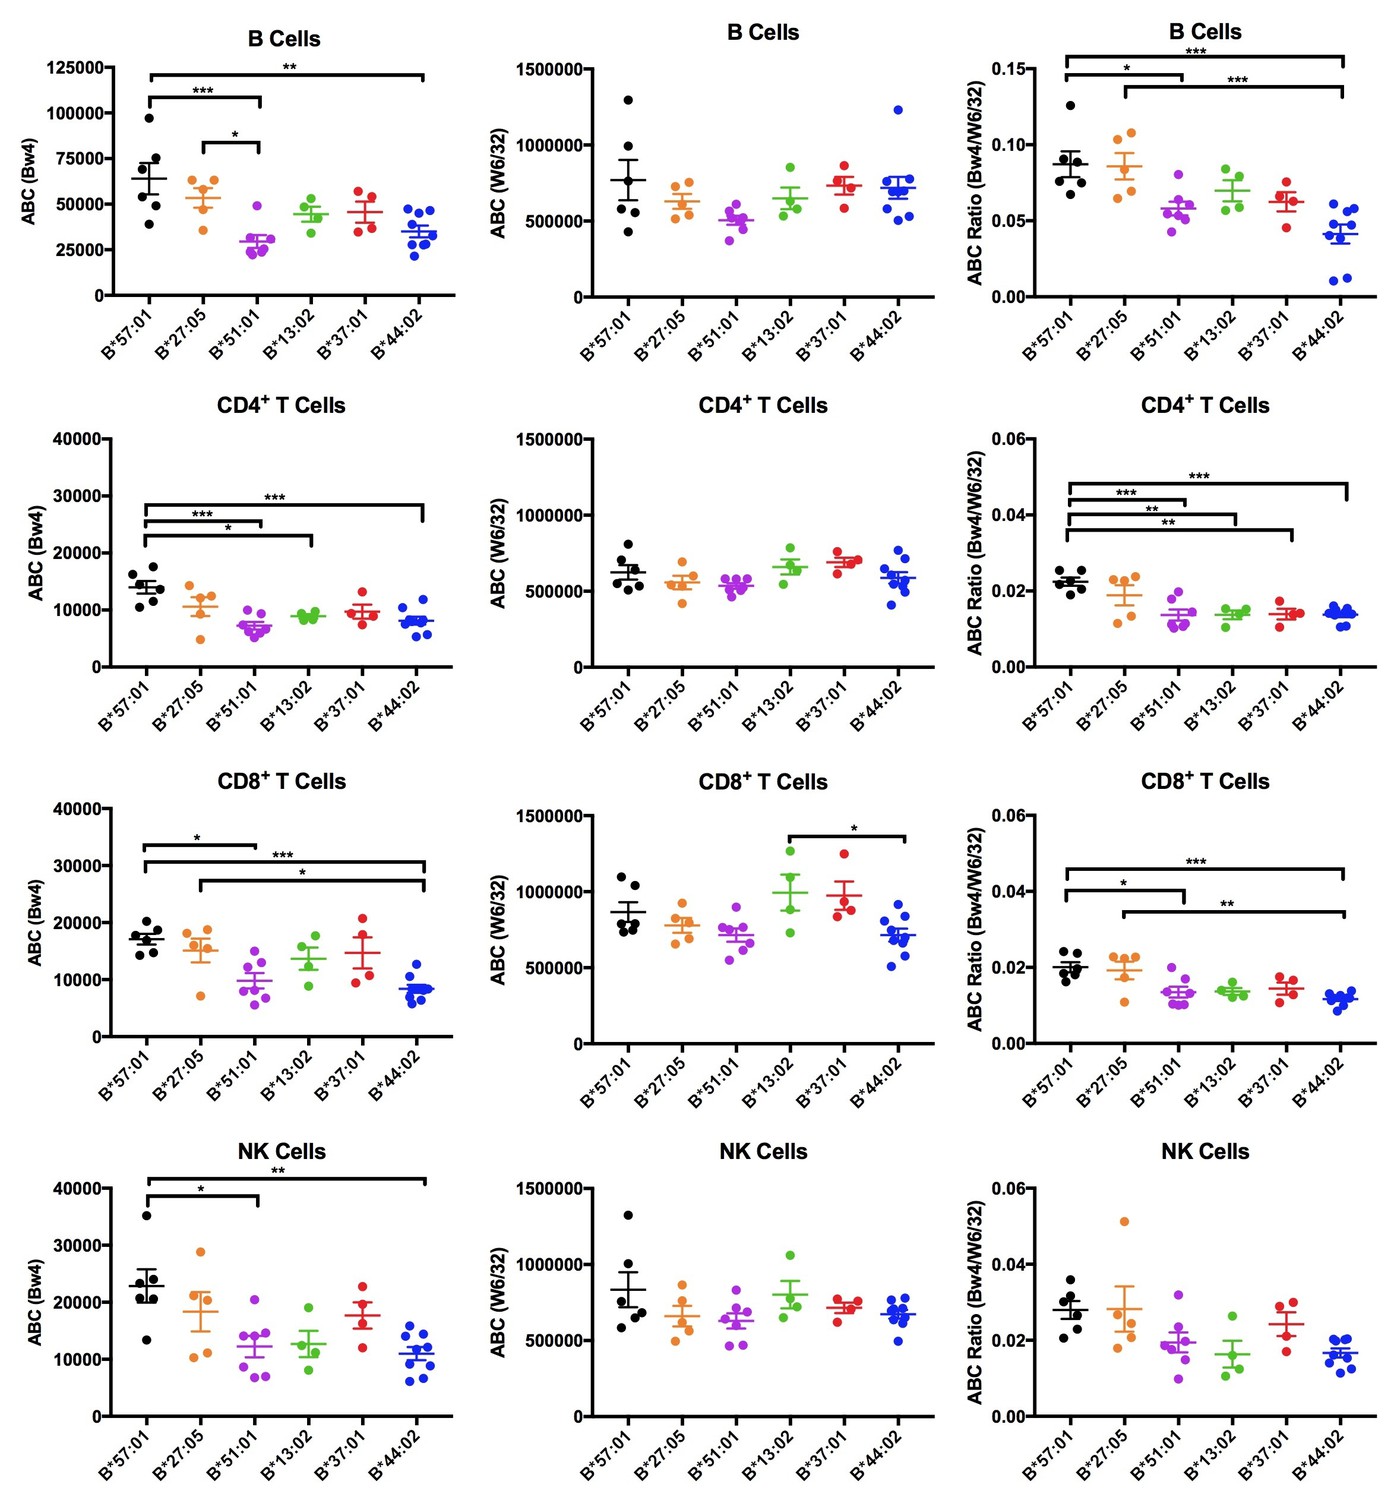
Expression measurements of HLA-Bw4 alleles.
Donors with heterozygosity for HLA-Bw4/Bw6 and lacking HLA-A allotypes cross-reactive with anti-Bw4 were sorted into six groups based on their Bw4 alleles. ABC values were calculated by flow cytometry based on staining freshly isolated PBMCs with anti-Bw4 and W6/32 and normalizing the resulting geometric MFI values against beads with known amounts of Fc receptors. Averaged ABC values for each donor are shown, grouped by the donor’s HLA-Bw4 alleles and lymphocyte subset analyzed (B cells (top row), CD4+ T cells (2nd row), CD8+ T cells (3rd row), and NK cells (last row)). Bw4 ABC values alone (left column), W6/32 ABC values alone, (middle column) and the Bw4/W6/32 ABC ratios (right column) are shown. The number of replicate measurements for each donor and standard errors of the mean are shown in Figure 6—source data 1. Statistically significant differences between alleles were analyzed by one-way ANOVA analysis for each cell type. Each dot represents averaged Bw4, W6/32, or Bw4/W6/32 ABC measurements (n > 3) from a single donor. *p<0.05; **p<0.01; ***p<0.001; ****p<0.0001.
Figure 7
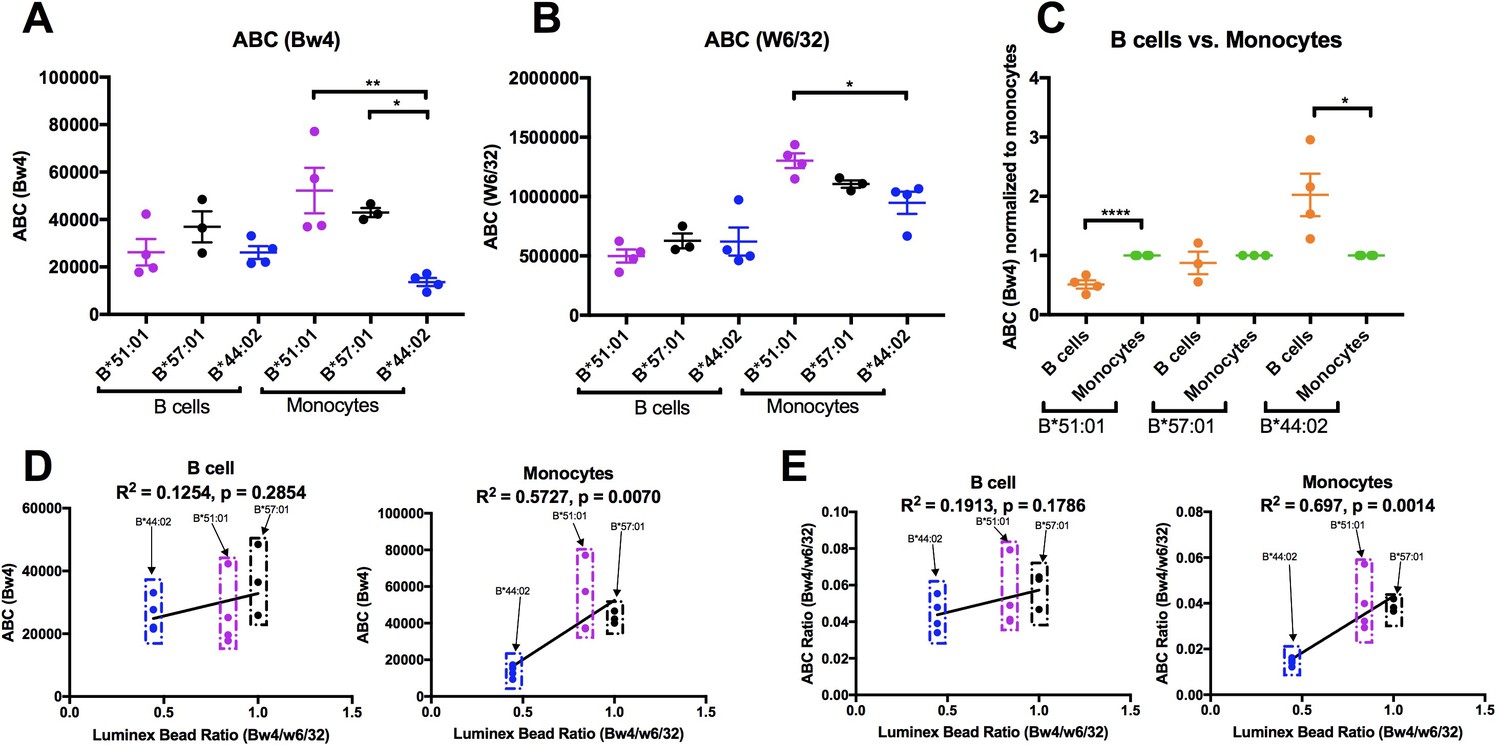
Altered patterns of HLA-Bw4 surface expression in monocytes compared with lymphocytes.
(A and B) Blood donations were again obtained from a subset of donors represented in the Figure 6 measurements. Averaged ABC values measured with anti-Bw4 (A) or w6/32 (B) for each donor are shown, grouped by the donor’s HLA-Bw4 alleles and cell subsets. Donor information and ABC values are shown in Figure 7—source data 1. (C) For each donor represented in A and B, Bw4 ABC values in lymphocytes are normalized relative to the monocyte values from the same donor, and grouped by the donor’s HLA-Bw4 alleles and cell subsets. (D and E) The averaged Bw4 ABC values (D) or Bw4/W6/32 ABC ratios (E) from data in A and B are plotted against the corresponding Luminex Bw4/W6/32 signals obtained from Figure 6—figure supplement 1 to account for differences in antibody binding. Each point represents data from a single donor. Statistical significance is based on one-way ANOVA analysis. p *<0.05, **<0.01, ***<0.001, and ****<0.0001. This figure has one source data table.
-
Figure 7—source data 1
B Cell and Monocyte Bw4 ABC Values.
HLA Bw4 genotypes of donors (full genotype in Figure 6—source data 1) and mean of ABC values measured with anti-Bw4 and W6/32 are shown for each lymphocyte or monocyte subset. Standard errors of the mean (SEM) values and the number of replicate measurements (N; with separate blood collections) are indicated.
- https://doi.org/10.7554/eLife.34961.032
Figure 8 with 2 supplements
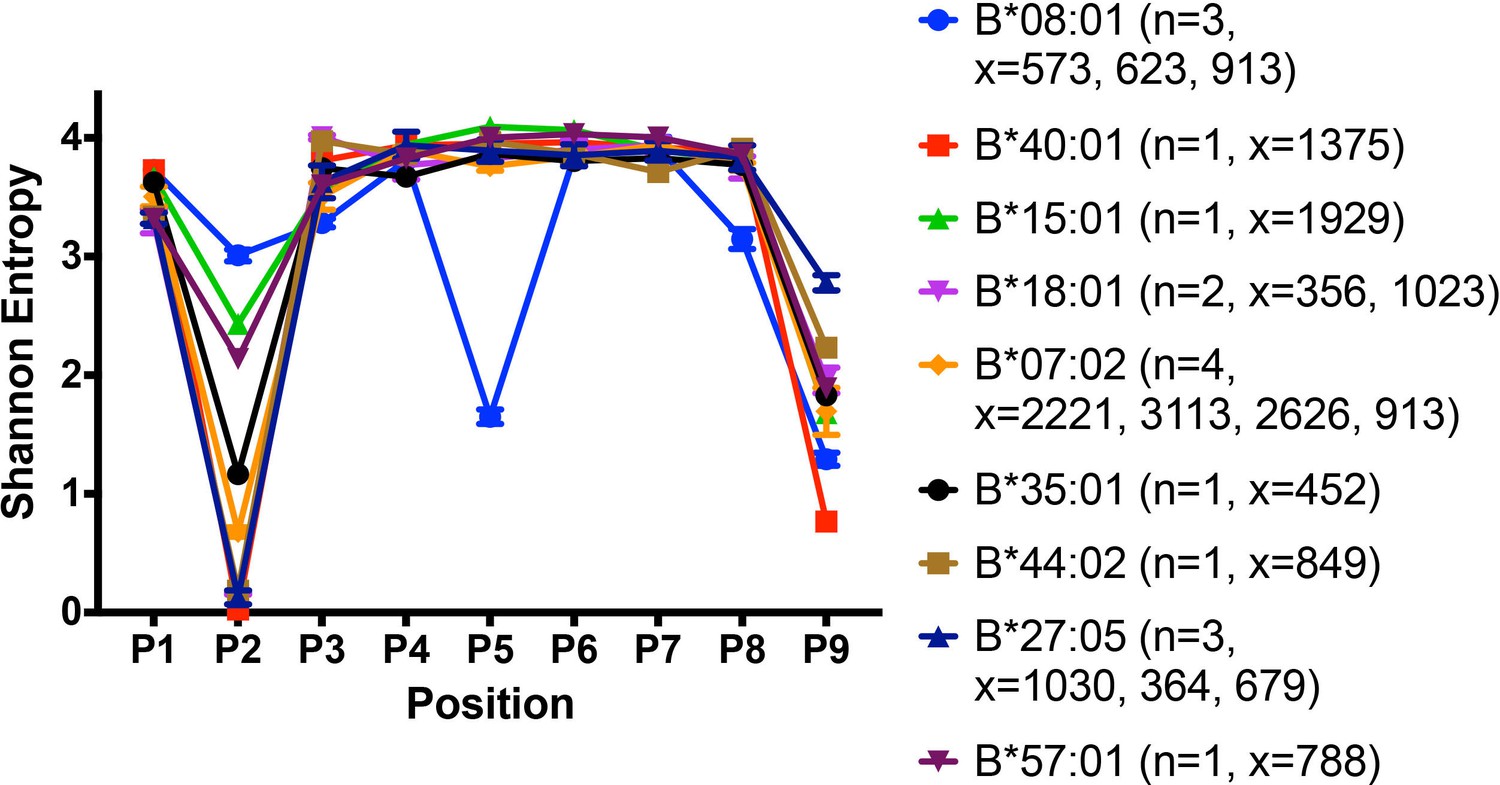
Peptidome and peptide-binding characteristics of HLA-B.
Shannon entropy plots of B lymphoblastic cell-derived 9-mer peptides for the indicated allotypes, based on mass spectrometry datasets obtained from (Pearson et al., 2016). Plots are based on 9-mer peptides assigned to each allele based on IEDB predictions (iedb.org). n values represent the total number of independent datasets used for the plots. x values represent the number of peptides in the independent datasets used for the plots. This figure has two supplementary figures.
Figure 8—figure supplement 1

Crystal structures of HLA-B allotypes illustrate that the D9 polymorphism of B*08:01, absent among other HLA-B allotypes, accounts for the unique P5 amino acid anchor of B*08:01.
Residues highlighted blue on the heavy chain interact with the peptide at P2, whereas residues highlighted yellow on the heavy chain interact with the peptide at PC. Protein data bank (PDB) numbers corresponding to each structure are indicated.
Figure 8—figure supplement 2
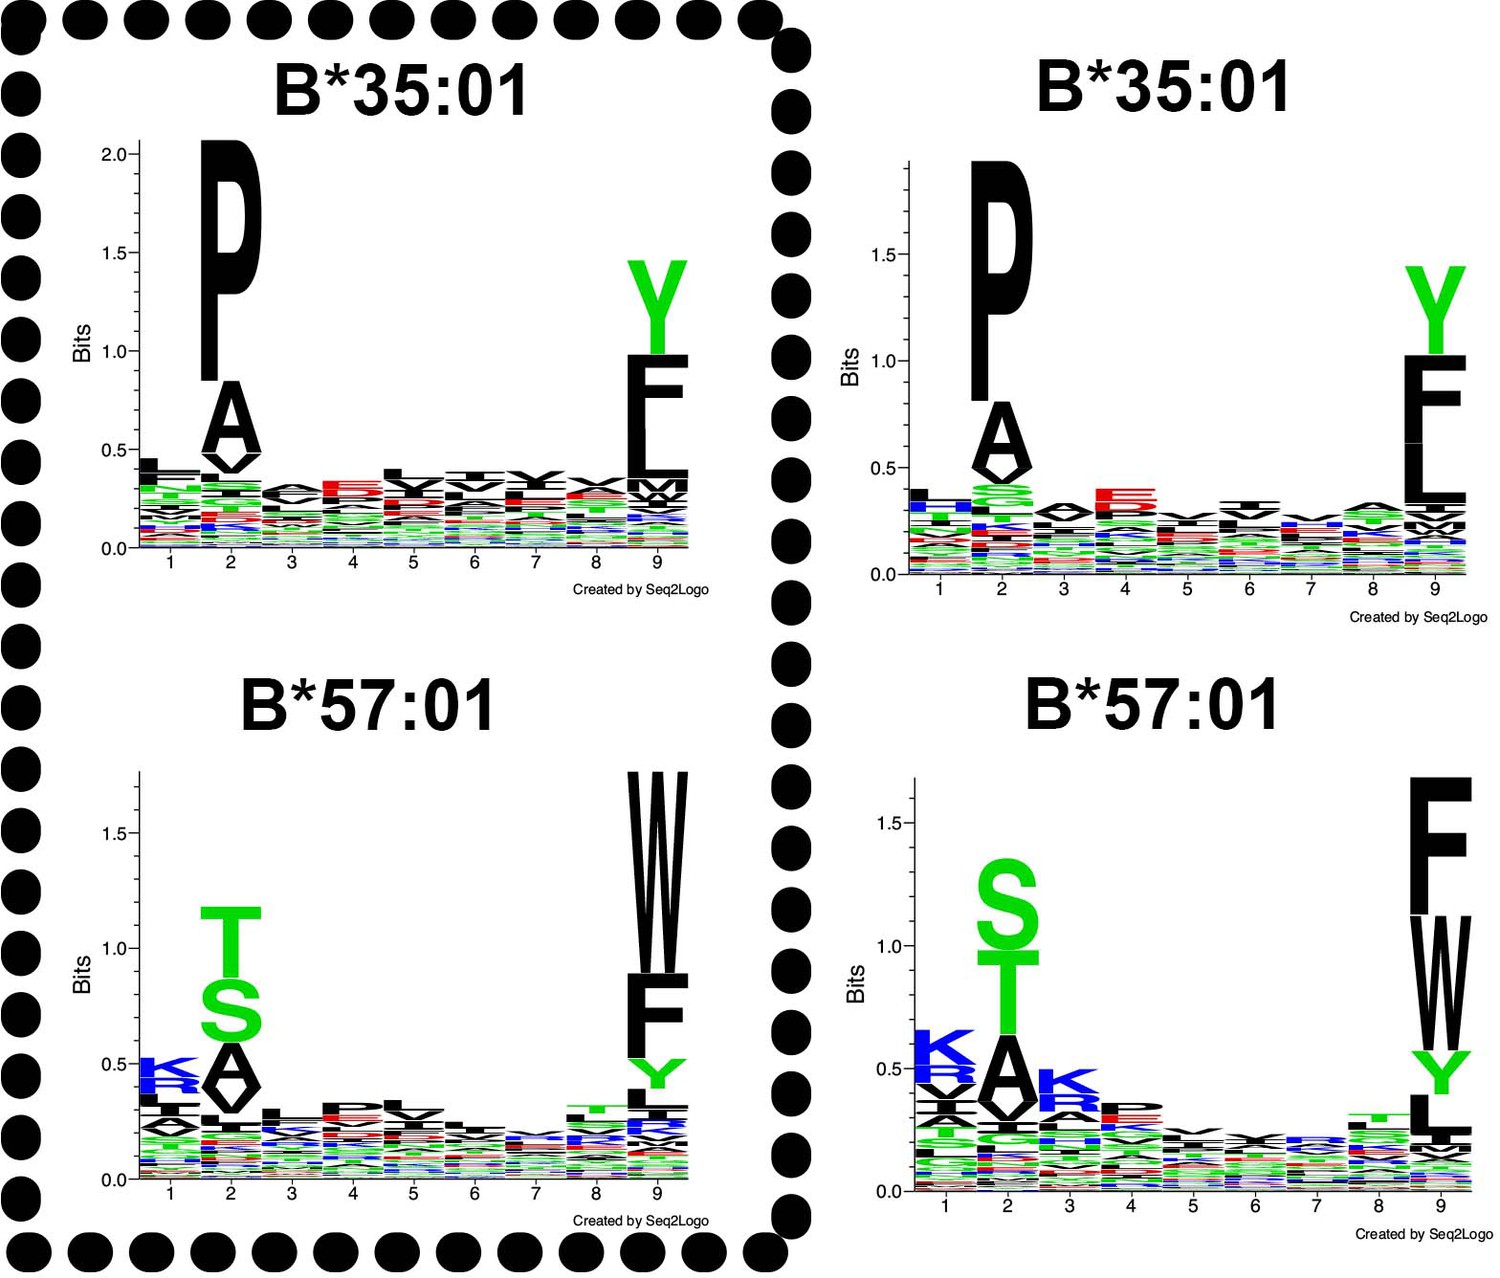
Peptide-binding motifs of B*35:01 compared to HLA-B*57:01.
Peptides were analyzed using seq2logo: http://www.cbs.dtu.dk/biotools/Seq2Logo/ (Thomsen and Nielsen, 2012). Peptides for the boxed alleles (left panels) were derived from a published dataset based on the immunoaffinity method (Abelin et al., 2017) and peptides for the right panel were obtained from a published dataset based on acid elution of cells and epitope predictions (Pearson et al., 2016).
Figure 9
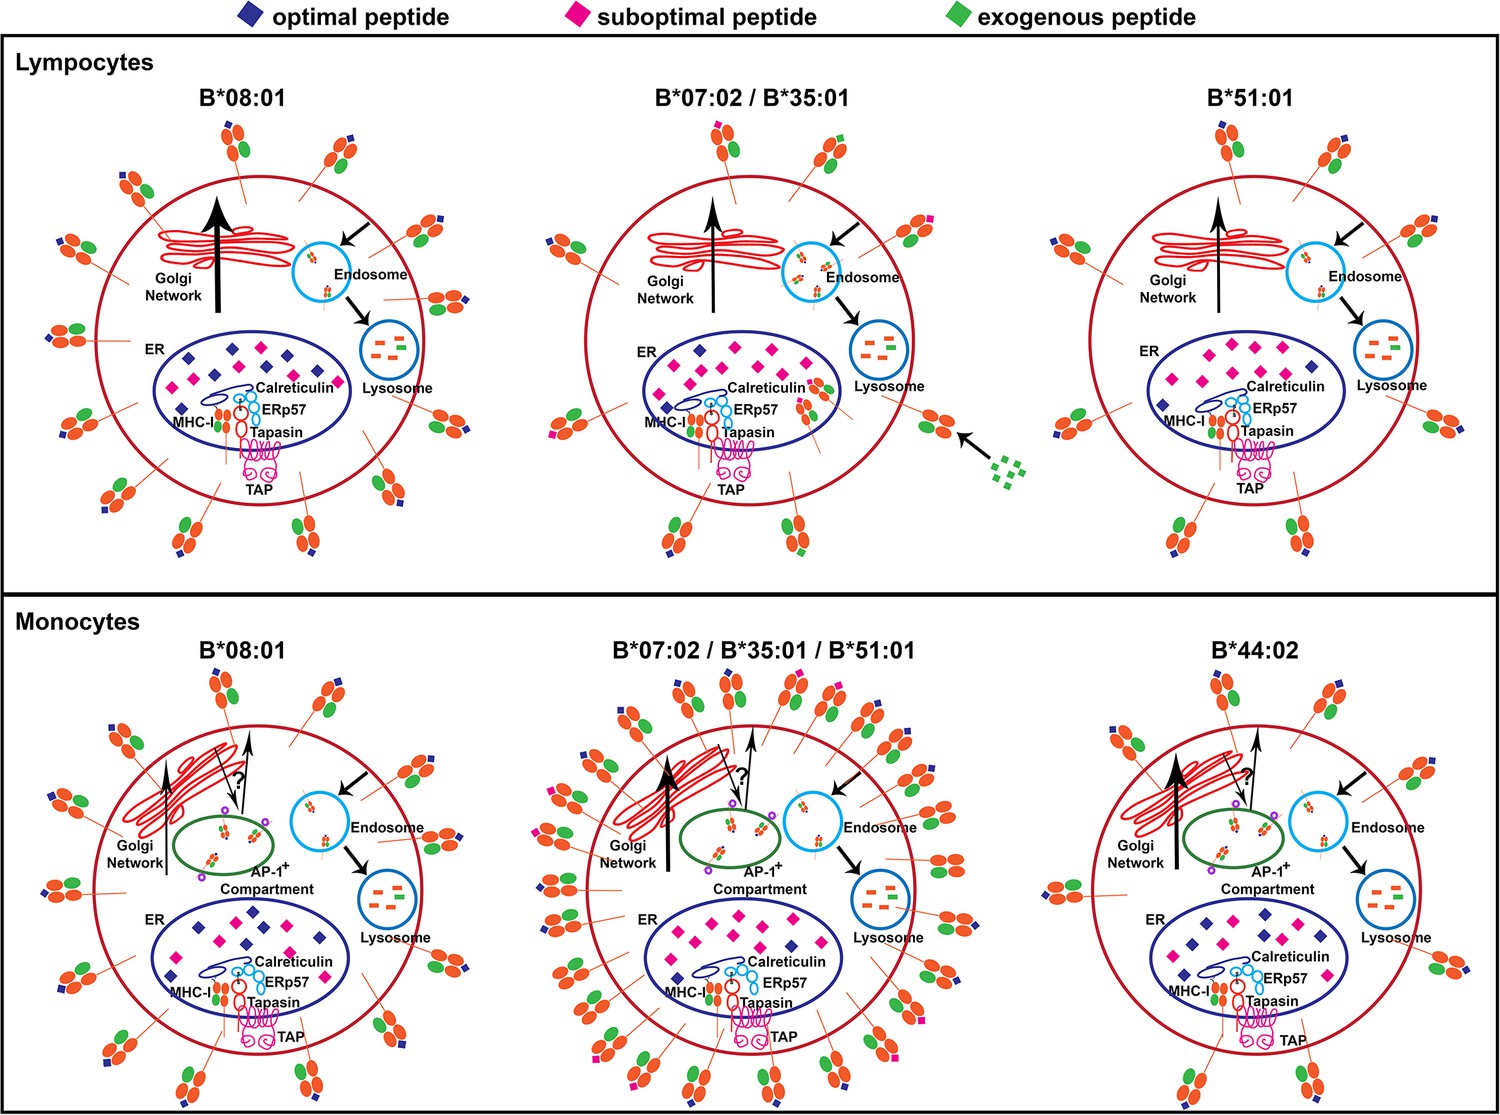
Models for allele-dependent variations in HLA-B cell surface expression, stability and exogenous antigen receptivity in lymphocytes and monocytes.
HLA class I molecules are assembled in the ER and traffic to the cell surface via the Golgi network. Cell surface HLA class I is internalized into the lysosome for degradation. Steady state surface expression is determined by the net rates of intracellular assembly, trafficking and loss from the cell surface. Top: In lymphocytes, optimal peptides are assembled with tapasin-dependent alleles such as HLA-B*08:01, for which the ER peptide pool is not limiting. Additionally, HLA-B*08:01-peptide complexes have a more buried peptide, due to ionic interactions mediated by D9 of B*08:01 with peptide residue 5, which is predicted to confer high stability to the complexes. In contrast, the ER peptide pool is limiting for HLA-B*35:01 and HLA-B*07:02 (due to mismatch between their peptide-binding specificities and TAP transport specificity), but their high intrinsic stabilities and tapasin-independent assembly characteristics allow escape from the ER to the cell surface. These sub-optimally loaded complexes have higher receptivity to exogenous peptides. The ER peptide pool is limiting for HLA-B*51:01 (due to mismatch between its peptide-binding specificities and TAP transport specificity). The requirement for tapasin-dependent assembly (related to low intrinsic stability of the peptide-deficient form) may result in low cell surface accrual and expression. Bottom: The B7 supertype members (B*07:02, B*35:01 and B*51:01) have induced expression in monocytes relative to lymphocytes, despite the mismatch between their peptide binding preferences and TAP transport specificity, suggesting an alternative source of peptides, such as those that may be found in the AP-1+ compartments. In contrast, the highly tapasin dependent HLA-B*08:01 and HLA-B*44:02 have lower surface expression or induction and stability relative to lymphocytes, possibly due to slow assembly in the same AP-1+ compartment, compounded by a reduced ratio of tapasin relative to HLA class I in the ER. This figure has one source data table reflecting all blood donor demographics.
-
Figure 9—source data 1
Blood Donor demographics.
- https://doi.org/10.7554/eLife.34961.037
Tables
Key resources table
| Reagent type (species) or resource | Designation | Source or reference | Identifiers | Additional information |
|---|---|---|---|---|
| Biological sample (human) | human peripheral blood mononuclear cells | human | donor # 1–237 | |
| Antibody | W6/32 (anti-HLA-A,B,C) | mouse hybridoma, UMICH Hybridoma PMID: 667938 | W6/32 | mouse hybridoma purified with Protein G column and labeled with FITC |
| Antibody | HC10 (anti-HLA-heavy chain) | mouse hybridoma UMICH Hybridoma PMID: 2088481 | HC10 | mouse hybridoma purified with Protein G column and labeled with FITC |
| Antibody | PaSta-1 (anti-tapasin antibody) | Received from Dr. Peter Cresswell Yale University PMID: 11825568 | PaSta-1 | anti-tapasin antibody (received purified) and labeled with FITC |
| Antibody | anti-Bw4 FITC | One Lambda | Fisher:FH0007 | (1:20) (1:10) |
| Antibody | anti-Bw6 FITC | One Lambda | Fisher:FH0038 | (1:20) (1:10) |
| Antibody | IgG3 mouse isotype control FITC | Abcam | ab91539 | (1:10) |
| Antibody | IgG2a mouse isotype control FITC | Abcam | ab91362 | (1:10) |
| Antibody | anti-CD3 UCHT1 pacific blue | Biolegend | RRID:AB_2562048 (BioLegend Cat. No. 300442) | (1:50) |
| Antibody | anti-CD4 RPA-T4 PE/Cy7 | Biolegend | RRID:AB_314086 (BioLegend Cat. No. 300518) | (1:50) |
| Antibody | anti-CD8 SK1 Alexa Fluor 700 | Biolegend | RRID:AB_2562790 (BioLegend Cat. No. 344724) | (1:50) |
| Antibody | anti-CD14 63D3 Alexa Fluor 700 | Biolegend | RRID:AB_2566716 (BioLegend Cat. No. 367114) | (1:50) |
| Antibody | anti-CD19 HIB19 APC | Biolegend | RRID:AB_314242 (BioLegend Cat. No. 302212) | (1:20) |
| Antibody | anti-CD33 P67.6 PE/Cy7 | Biolegend | RRID:AB_2566416 (BioLegend Cat. No. 366614) | (1:50) |
| Antibody | anti-CD56 5.1H11 APC/Cy7 | Biolegend | RRID:AB_2563927 (BioLegend Cat. No. 362510) | (1:50) |
| Antibody | anti-HLA-DR L243 BV650 | Biolegend | RRID:AB_2563828 (BioLegend Cat. No. 307650) | (1:50) |
| Antibody | mouse anti-AP-1 | Sigma Aldrich | RRID:AB_476720 (Sigma-Aldrich Cat# A4200) | (1:500) |
| Antibody | goat anti-mouse IgG2b -Alexa Fluor 568 | Thermo Fisher | RRID:AB_2535780 (Thermo Fisher Scientific Cat# A-21144) | (1:500) |
| Antibody | anti-calreticulin (CRT) | Thermo Fisher | RRID:AB_325990 (Thermo Fisher Scientific Cat# PA3-900) | (1:500) |
| Antibody | goat anti-rabbit IgG-Alexa Fluor 594 | Cell Signaling Technology | RRID:AB_2716249 (Cell Signaling Technology Cat# 8889) | (1:500) |
| Antibody | PE mouse anti-human CD107a (LAMP-1) | BD Biosciences | RRID:AB_396135 (BD Biosciences Cat# 555801) | (1:20) |
| Sequence-based reagent | HLA-B reverse primer 5’ TCAAGCTGTGAGAGACACAT 3’ | PMID: 20842357 | ||
| Sequence-based reagent | HLA-B forward primer 5’ TCCTAGCAGTTGTGGTCATC 3’ | PMID: 20842357 | ||
| Sequence-based reagent | pan-Class I forward primer 5’ GAGATCACACTGACCTGGCA 3’, | This paper | Primer chosen by sequence alignment | |
| Sequence-based reagent | pan-Class I reverse primer 5’ GAACCTTCCAGAAGTGGG 3’ | This paper | Primer chosen by sequence alignment | |
| Sequence-based reagent | ACTB forward primer 5' GGACTTCGAGCAAGAGATGG 3' | RealTime Primers.com | VHPS-110 | |
| Sequence-based reagent | ACTB reverse primer 5' AGCACTGTGTTGGCGTACAG 3' | RealTime Primers.com | VHPS-110 | |
| Sequence-based reagent | GAPDH forward primer 5' GAGTCAACGGATTTGGTCGT 3' | RealTime Primers.com | VHPS-3541 | |
| Sequence-based reagent | GAPDH reverse primer 5' TTGATTTTGGAGGGATCTCG 3' | RealTime Primers.com | VHPS-3541 | |
| Sequence-based reagent | HPRT1 forward primer 5' TGACACTGGCAAAACAATGCA 3' | RealTime Primers.com | VHPS-4263 | |
| Sequence-based reagent | HPRT1 reverse primer 5' GGTCCTTTTCACCAGCAAGCT 3' | RealTime Primers.com | VHPS-4263 | |
| Peptide, recombinant protein | HSKKKCDEL | Synthetic Biomolecules (A and A labs LLC) | HSK | Peptide chosen from IEDB |
| Peptide, recombinant protein | HSDYECDE | Synthetic Biomolecules (A and A labs LLC) | HSD | Peptide modified from HSK |
| Peptide, recombinant protein | GPKVKRPPI | Synthetic Biomolecules (A and A labs LLC) | GPK | Peptide chosen from IEDB |
| Peptide, recombinant protein | GPDVERPP | Synthetic Biomolecules (A and A labs LLC) | GPD | Peptide modified from GPD |
| Peptide, recombinant protein | QIKVRVDMV | Synthetic Biomolecules (A and A labs LLC) | QIK | Peptide chosen from IEDB |
| Peptide, recombinant protein | QIDVEVDM | Synthetic Biomolecules (A and A labs LLC) | QID | Peptide modified from QID |
| Peptide, recombinant protein | HPVGEADYFEY | Synthetic Biomolecules (A and A labs LLC) | HPV | Peptide chosen from IEDB |
| Peptide, recombinant protein | HGVGEADYFE | Synthetic Biomolecules (A and A labs LLC) | HGV | Peptide modified from HPV |
| Peptide, recombinant protein | EPLPQGQLTAY | Synthetic Biomolecules (A and A labs LLC) | EPL | Peptide chosen from IEDB |
| Peptide, recombinant protein | EGLPQGQLTA | Synthetic Biomolecules (A and A labs LLC) | EGL | Peptide modified from EPL |
| Peptide, recombinant protein | HPNIEEVAL | Synthetic Biomolecules (A and A labs LLC) | HPN | Peptide chosen from IEDB |
| Peptide, recombinant protein | HGNIEEVA | Synthetic Biomolecules (A and A labs LLC) | HGN | Peptide modified from HGN |
| Peptide, recombinant protein | RPPIFIRRL | Synthetic Biomolecules (A and A labs LLC) | RPPI | Peptide chosen from IEDB |
| Peptide, recombinant protein | RKPIFIRR | Synthetic Biomolecules (A and A labs LLC) | RKPI | Peptide modified from RKPI |
| Peptide, recombinant protein | QPRAPIRPI | Synthetic Biomolecules (A and A labs LLC) | QPRA | Peptide chosen from IEDB |
| Peptide, recombinant protein | QKRAPIRP | Synthetic Biomolecules (A and A labs LLC) | QKRA | Peptide modified from QKRA |
| Peptide, recombinant protein | TPRVTGGGAM | Synthetic Biomolecules (A and A labs LLC) | TPRV | Peptide chosen from IEDB |
| Peptide, recombinant protein | TKRVTGGGA | Synthetic Biomolecules (A and A labs LLC) | TKRV | Peptide modified from TKRV |
| Commercial assay or kit | DNeasy Blood and Tissue Kit | Qiagen | Qiagen:69504 | |
| Commercial assay or kit | RNeasy Mini Kit | Qiagen | Qiagen:74104 | |
| Commercial assay or kit | Quantum™ Simply Cellular anti-Mouse IgG | Bangs Lab | Bangs Lab:815A | |
| Chemical compound, drug | Brefeldin A | Sigma Aldrich | Sigma-Aldrich:B7651 | |
| Chemical compound, drug | FITC | Thermo Fisher | Fisher:46424 | |
| Software, algorithm | FlowJo Version 10 | FlowJo, LLC | RRID:SCR_008520 | |
| Software, algorithm | Prism 7 | GraphPad Software | RRID:SCR_002798 |
Additional files
-
Transparent reporting form
- https://doi.org/10.7554/eLife.34961.038
Download links
A two-part list of links to download the article, or parts of the article, in various formats.
Downloads (link to download the article as PDF)
Open citations (links to open the citations from this article in various online reference manager services)
Cite this article (links to download the citations from this article in formats compatible with various reference manager tools)
Variations in HLA-B cell surface expression, half-life and extracellular antigen receptivity
eLife 7:e34961.
https://doi.org/10.7554/eLife.34961


