Opposite regulation of inhibition by adult-born granule cells during implicit versus explicit olfactory learning
- CNRS UMR 5292, INSERM U1028, Université de Lyon, France
- Cornell University, United States
Figures
Figure 1 with 5 supplements
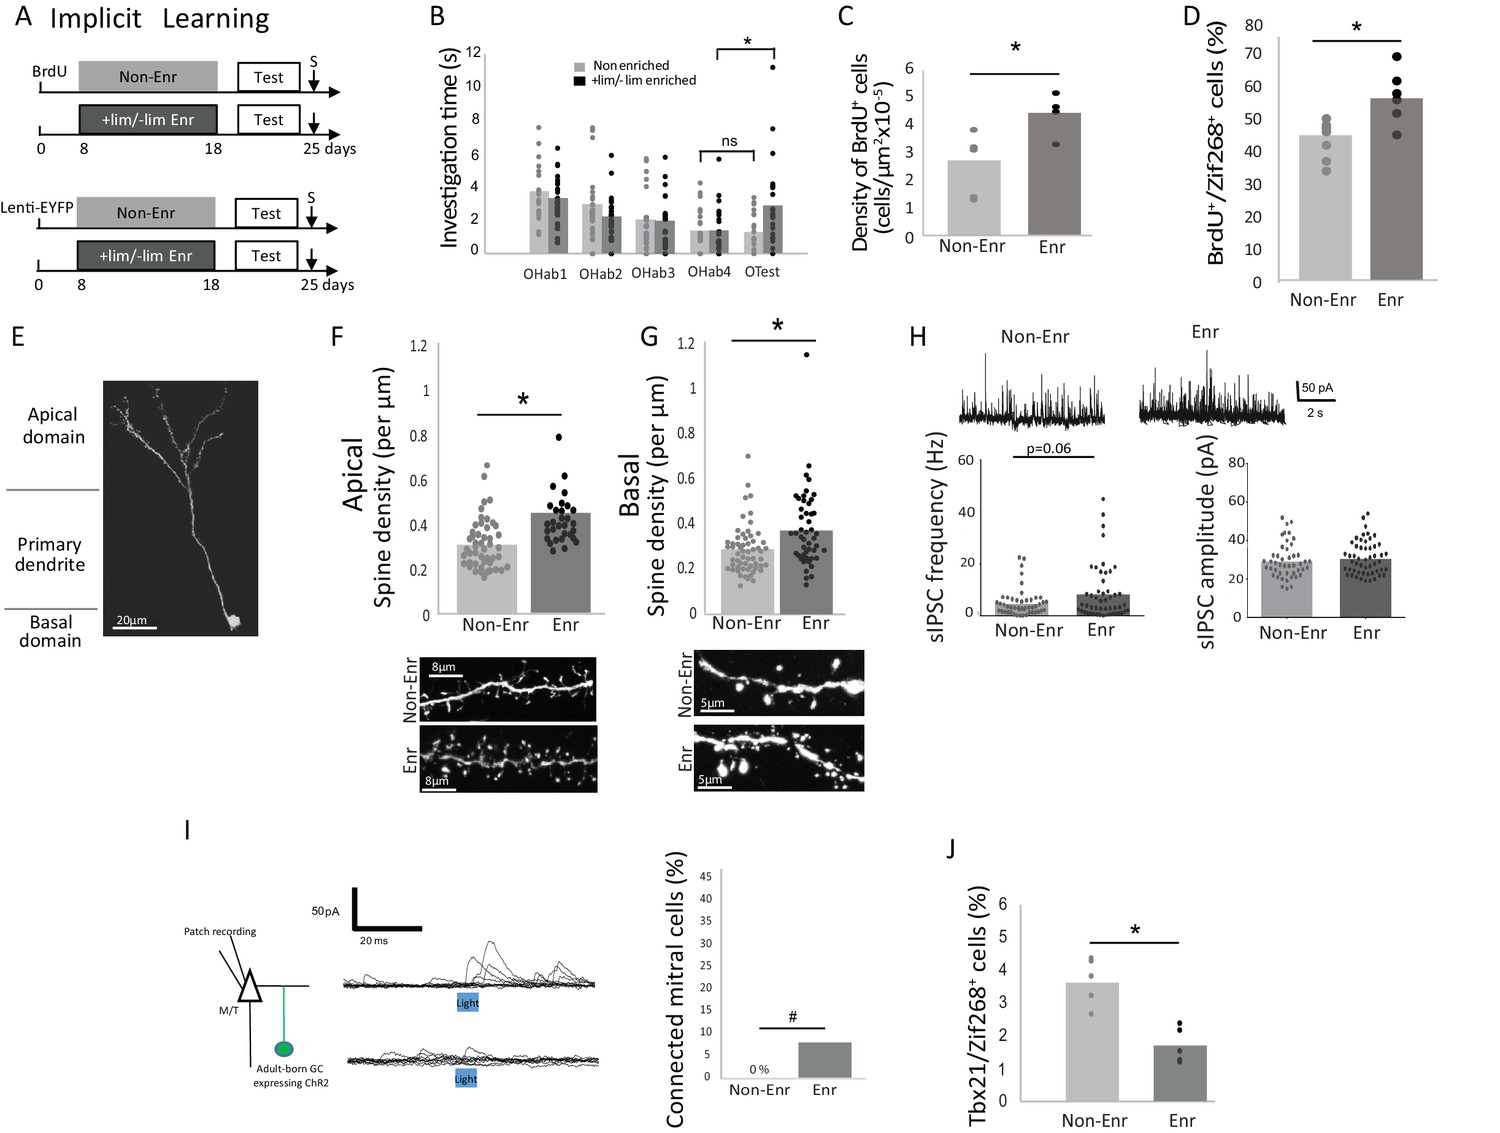
Behavioral and neural effects of implicit learning.
(A) Experimental design for implicit learning (S: Sacrifice; Test: Habituation/Cross Habituation task). (B) Behavior. Habituation/cross habituation task indicated that +lim and -lim are not discriminated in control non-enriched group. In contrast, enrichment allows discrimination as observed by the significant increase of investigation time between the last habituation trial (OHab4) and the presentation of the second odorant of the pair (Otest). (C) Adult-born cell (BrdU-positive cell) density is increased after implicit learning. (D) The percentage of odor-responsive adult-born cells (expressing Zif268) is increased after implicit learning. (E) Spine density of adult-born neuron transduced by Lenti hSyn ChR2EYFP is analyzed in the apical and basal domains. (F) Spine density in the apical domain is increased after implicit learning. (G) Spine density in the basal domain is increased after implicit learning. (H) Representative traces of sIPSC recorded on mitral cells for Enr and Non-Enr animals (up). sIPSC frequency is increased after implicit learning while no modification is observed for sIPSC amplitude (down). (I) Left, experimental design for studying the connectivity of adult-born neurons on M/T cells. Middle, example of the effect of optogenic stimulation of adult-born neurons on M/T cells IPSC (top connected M/T cell, bottom unconnected M/T cell, superposition of 10 traces). Right, percentage of M/T cells exhibiting a significant response to light stimulation of adult-born neurons. (J) The percentage of M/T cells (Tbx21positive) expressing Zif268 is decreased after implicit learning. *:p<0.05; #p=0.07.
-
Figure 1—source data 1
Raw Data Figure 1
- https://doi.org/10.7554/eLife.34976.009
Figure 1—figure supplement 1
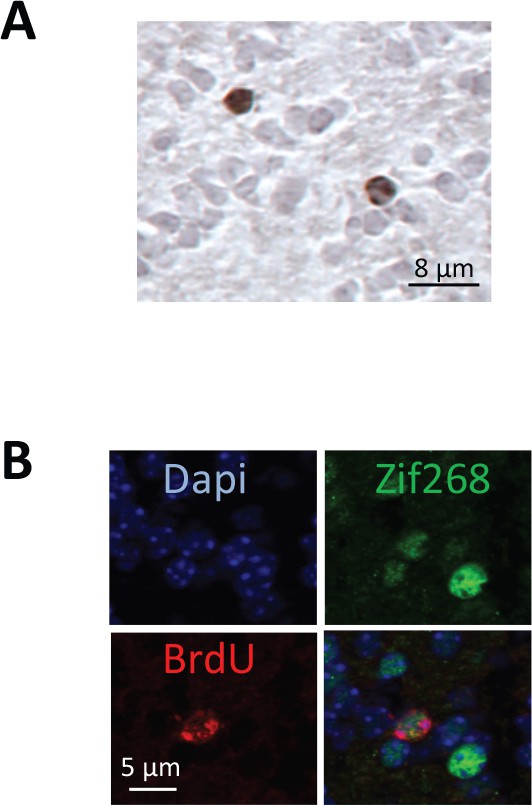
Adult-born neuron survival and responsiveness to learned odorant.
(A) Adult-born cells were labeled before training using cell division marker bromodeoxyuridine (BrdU) injection and counted in the granule cell layer of the OB at the end of training (25 days post-BrdU injection). This experimental schedule allowed assessment of the impact of learning on labeled neuron survival. This image is representative of all BrdU positive cells counted. (B) Representative image of a double labeled BrdU/Zif268-positive cell.
Figure 1—figure supplement 2
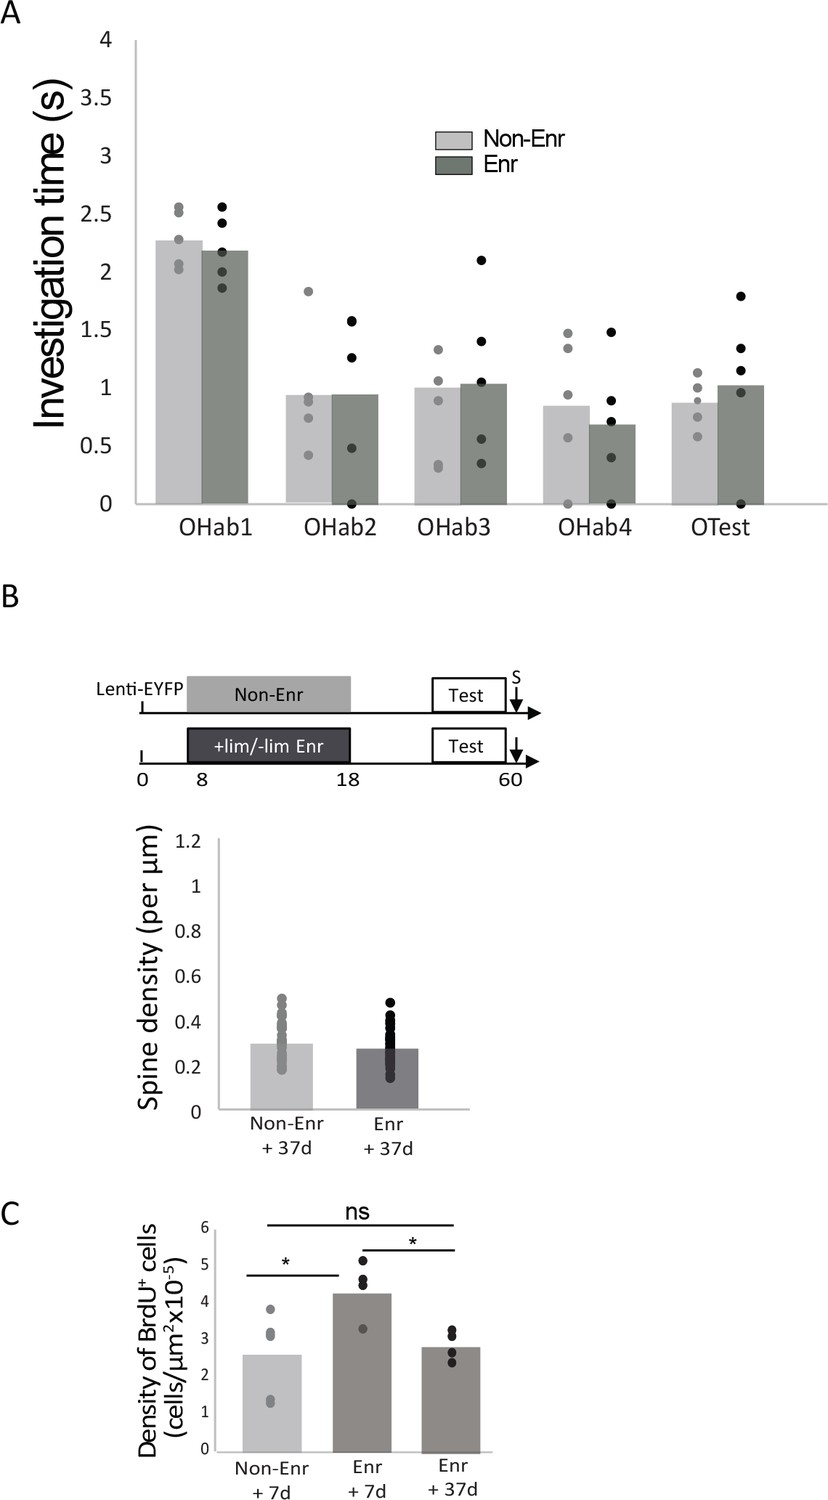
Long-term delay after implicit learning.
(A) 42 days after implicit learning, the habituation/cross habituation task indicated that there was still no discrimination between +lim and –lim in the non-enriched control group (Non-Enr) and that the enriched (Enr) group could not longer discriminate them. Indeed, investigation time remained similar between OTest and OHab4 in the non-enriched (Wilcoxon p=0.8, n = 5) and the enriched group (Wilcoxon p=0.34). Both groups habituated correctly (Friedman test, Non-Enr (n = 5, p=0.02; Enr (n = 5, p=0.01). (B) 42 days after implicit learning, no difference in spine density in the apical domain was observed between Non-Enriched (Non-Enr) and Enriched (Enr) animals (Mann-Whitney p=0.23; Enr: 48 dendritic segments n = 4 mice and Non-Enr: 38 dendritic segments n = 4 mice). (C) 37 days after implicit learning, the density of BrdU-positive cells has returned to control non-enriched level (Enr +37 d: n = 5; Anova group effect: F(2,12)=6 p=0.015; 7 days versus 37 days post enrichment, Bonferroni test p=0.04). The data are expressed as mean values ± SEM.
Figure 1—figure supplement 3
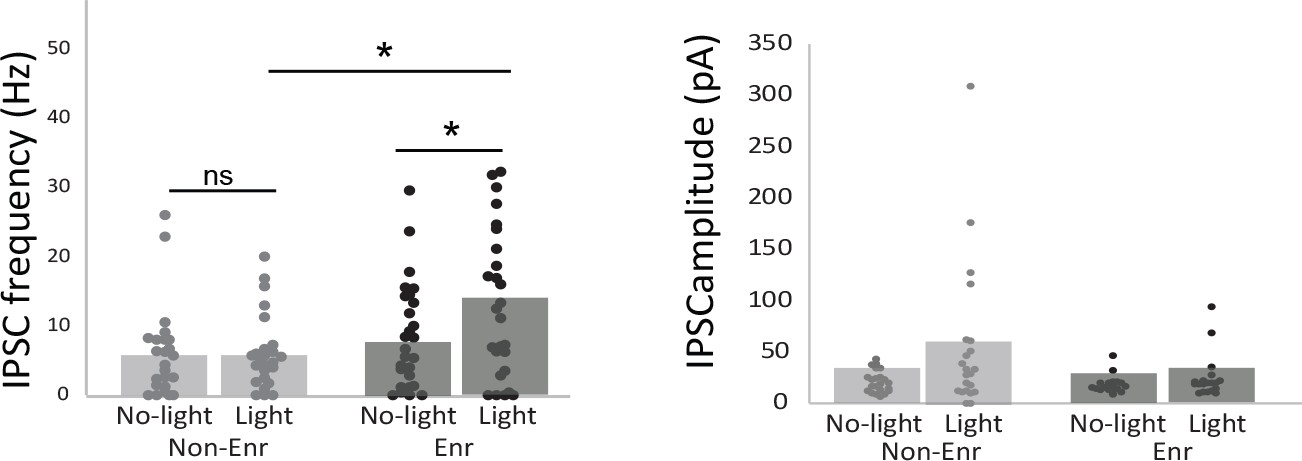
Effect of light stimulation of adult-born neuron on mitral cell activity.
(A) IPSC frequency (Non-Enr n = 25; Enr n = 27 cells; No-light versus Light in Non-Enr group p=0.2; No-light versus Light in Enr group p=0.025; Non-Enr light versus Enr light p=0.04) and (B) amplitude (Non-Enr n = 21; Enr n = 23 cells; No-light versus Light in Non-Enr group p=0.16; No-light versus Light in Enr group p=0.22 Non-Enr light versus Enr light p=0.17) were recorded on mitral cells in OB slices in response to light stimulation of adult-born granule cells in Non-Enr and Enr groups. Unilateral paired t-test for comparison between No-light and Light conditions and permutation tests for comparisons between Non-Enr and Enr animals, *:p<0.05.
Figure 1—figure supplement 4
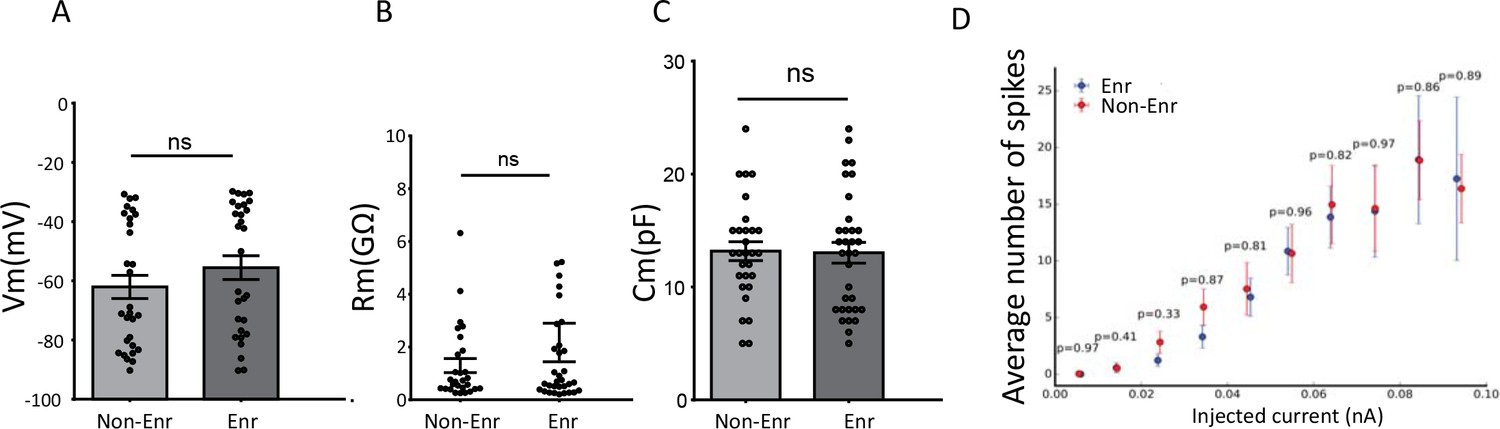
The biophysical properties of adult-born neurons.
Implicit learning did not modify (A) the resting membrane potential (Mann-Whitney: Non-Enr vs Enr p=0.2). (B) the membrane resistance (Mann-Whitney: Non-Enr vs Enr p=0.76) or (C) the membrane capacitance of adult-born neurons (Mann-Whitney: Non-Enr vs Enr p=0.91) (Non-enriched: Non-Enr; Enriched: Enr). (D) The input-output curves of adult-born cells produced by 500 ms steps of injected currents at different intensities were not modified by implicit learning (Non-Enr n = 22 and Enr n = 19; Mann-Whitney test). Only neurons that were not silent were considered. The data are expressed as mean values ± SEM.
Figure 1—figure supplement 5
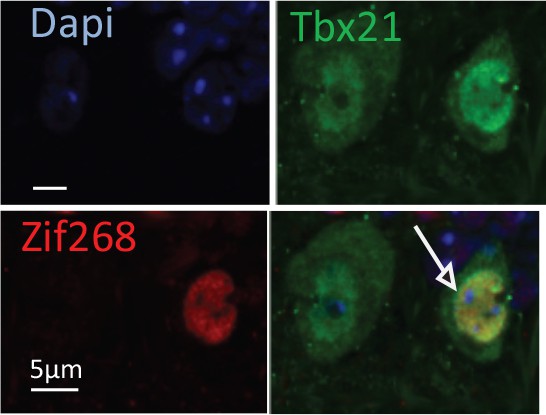
Example of Tbx21/Zif268-positive mitral cell.
This image is representative of all cells counted.
Figure 2 with 4 supplements
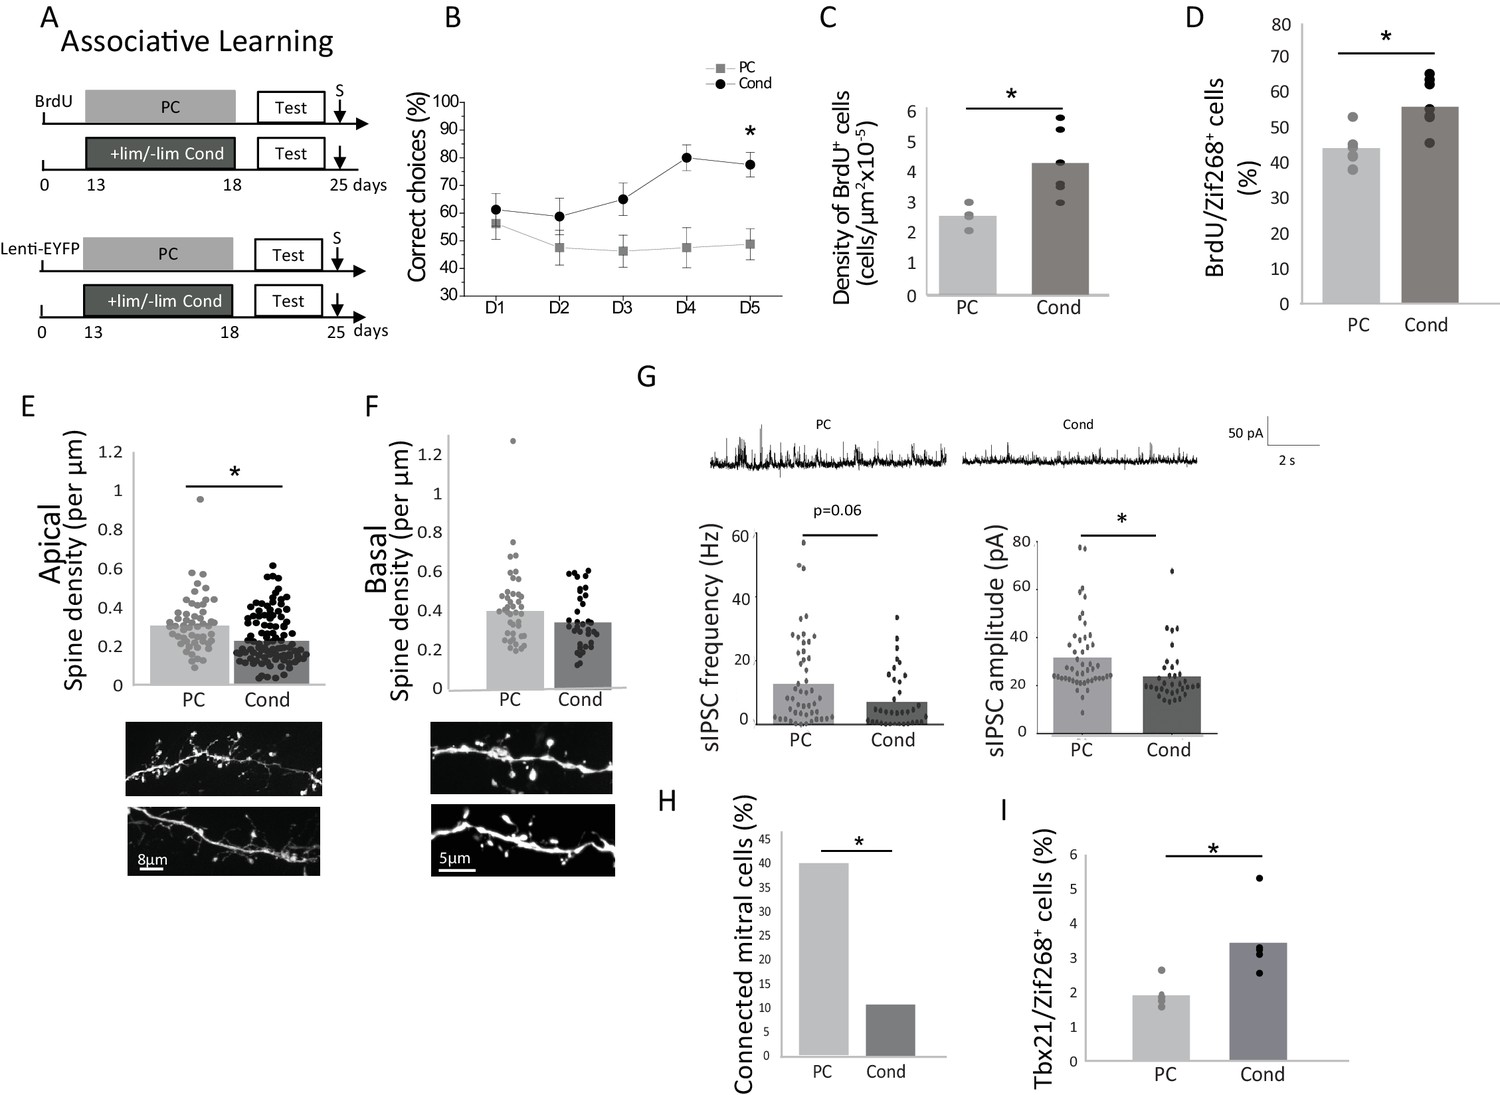
Behavioral and neural effects of explicit learning.
(A) Experimental design for explicit learning (S: Sacrifice, Test:Habituation/Cross Habituation Task). (B) From D1 to D5 of training, the percentage of correct choices increased in conditioned (Cond) but not pseudo-conditioned animals (PC) indicating that learning occurred only in the conditioned animals (C) Adult-born cell (BrdU-positive cell) density is increased after explicit learning (D) The percentage of odor-responsive adult-born cells (expressing Zif268) is increased after explicit learning. (E). Spine density of the apical domain decreased after explicit learning. (F) Spine density of the basal domain is unchanged after explicit learning. (G) Representative traces of sIPSC for Cond and PC (up). sIPSC frequency and amplitude are decreased after explicit learning (down). (H) Percentage of mitral cells exhibiting a significant response to light stimulation of adult-born granule cells. (I) The percentage of mitral cells (Tbx21) expressing Zif268 is higher in Cond versus PC animals. *p<0.05; the data are expressed as mean values ± SEM.
-
Figure 2—source data 1
Raw Data Figure 2.
- https://doi.org/10.7554/eLife.34976.015
Figure 2—figure supplement 1
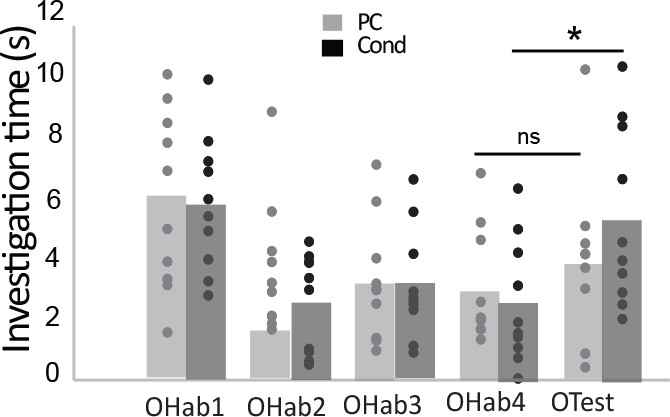
Improvement in discrimination after explicit learning.
At the end of the associative learning, the habituation/cross habituation task indicated that +lim and -lim were not discriminated in the pseudo-conditioned (PC) group (n = 10; Friedman test for Habituation, p=0.02; Wilcoxon test for discri- mination p=0.44). In contrast, conditioning allowed discrimination as observed by the significant increase of investigation time between the last habituation trial (OHab4) and the presentation of the second odorant of the pair (Otest) (n = 10; Friedman test for Habituation, p=0.00073; Wilcoxon test for discrimination p=0.005).
Figure 2—figure supplement 2
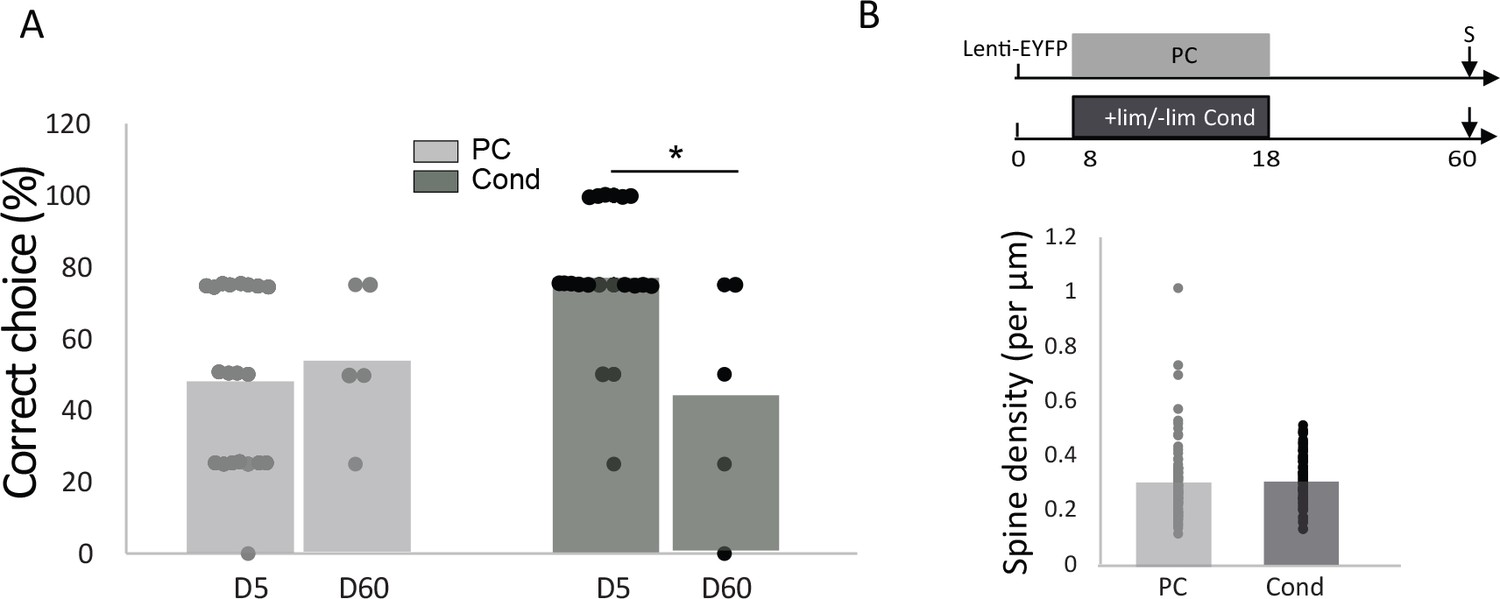
Long-term delay after explicit learning A.
The percentage of correct choices returned to the control level in conditioned animals (Cond D60, Mann-Whitney p=0.36, n = 5) and remained low in pseudo-conditioned animals (PC D60, Mann-Whitney p=0.42, n = 5). (B) 42 days after explicit learning, no difference in spine density in the apical domain was observed between Conditioned (Cond) and Pseu- do-conditioned (PC) animals (Mann-Whitney p=0.07; Cond: 82 dendritic segments n = 4 mice and PC: 93 dendritic segments n = 4 mice).
Figure 2—figure supplement 3

Effect of light stimulation of adult-born neuron on mitral cell activity.
(A) IPSC frequency (PC n = 23; Cond n = 22 cells; No-light versus Light in PC group p=0.015; No-light versus Light in Cond group p=0.01; PC light versus Cond light p=0.0015) and (B) amplitude (PC n = 22; Cond n = 18 cells; No-light versus Light in PC group p=0.15; No-light versus Light in Cond group p=0.0076; PC light versus Cond light p=0.25) were recorded on mitral cells in OB slices in response to light stimulation of adult-born granule cells in PC and Cond groups. Unilateral paired t-test for comparison between No-light and Light conditions and permutation tests for comparisons between Non-Enr and Enr animals, *p<0.05.
Figure 2—figure supplement 4

The biophysical properties of adult-born neurons.
Explicit learning did not modify (A) the resting membrane potential (Mann-Whitney: PC vs Cond p=0.12). (B) the membrane resistance (Mann-Whitney: PC vs Cond p=0.1) or (C) the membrane capacitance of adult-born neurons (Mann-Whitney: PC vs Cond p=0.16) (Pseudo-conditioned: PC; Conditioned: Cond). (D) The input-output curves of adult-born cells produced by 500 ms steps of injected currents at different intensities were not modified by explicit learning (PC n = 37 and Cond n = 49 cells). Only neurons that were not silent were considered (Mann Whitney, p>0.05). The data are expressed as mean values ± SEM.
Tables
Table 1
Summary of statistical comparisons described in the text.
For normal data, Anova followed by parametric Bonferroni post hoc test were used. For data that did not reach normality, Kruskall-Wallis Anova followed by FDR-corrected permutation tests were used. *p<0.05; **p<0.001; ***p<0.0001 and =: not different
| Cond vs Enr | PC vs Non-Enr | PC vs Enr | PC vs Cond | Cond vs Non-Enr | Enr vs Non-Enr | |
|---|---|---|---|---|---|---|
| BrdU Anova F(3,18)=6.63, p=0.003 | Cond = Enr (p=0.99) | PC = Non-Enr (p=0.99) | PC < Enr * (p=0.024) | PC < Cond * (p=0.025) | Cond > Non-Enr * (p=0.048) | Enr > Non-Enr * (p=0.042) |
| BrdU/Zif268 Anova F(3,23)=9.25, p=0.0003 | Cond = Enr (p=0.99) | PC = Non-Enr (p=0.99) | PC < Enr * (p=0.006) | PC < Cond * (p=0.005) | Cond > Non-Enr * (p=0.0073) | Enr > Non-Enr * (p=0.0078) |
| Tbx21/Zif268 Anova F(3,15)=7.33, p=0.002 | Cond > Enr * (p=0.015) | PC = Non-Enr (p=0.053) | PC = Enr (p=0.99) | PC < Cond * (p=0.044) | Cond = Non-Enr (p=0.99) | Enr < Non-Enr * (p=0.02) |
| Spine density Apical Kruskal-Wallis H(3, N = 240)=44.55 p<0.0001 | Cond < Enr *** (p=0.0003) | PC = Non-Enr (p=0.59) | PC < Enr * (p=0.001) | PC > Cond * (p=0.00255) | Cond < Non-Enr * (p=0.0132) | Enr > Non-Enr ** (p=0.0003) |
| Spine density Basal Kruskal-Wallis H(3, N = 187)=20.15 p<0.0001 | Cond = Enr (p=0.36) | PC > Non-Enr ** (p=0.0006) | PC = Enr (p=0.36) | PC = Cond (p=0.09) | Cond > Non-Enr * (p=0.042) | Enr > Non-Enr * (p=0.0015) |
| sIPSCs (Frequency) Kruskal-Wallis H(3, N = 177)=10.68 p=0.013 | Cond = Enr (p=0.55) | PC > Non-Enr ** (p=0.0006) | PC = Enr (p=0.13) | PC > Cond (p=0.06) | Cond = Non-Enr (p=0.13) | Enr > Non-Enr (p=0.06) |
| sIPSCs (Amplitude) Kruskal-Wallis H(3, N = 175)=21.30 p<0.0001 | Cond < Enr * (p=0.0048) | PC = Non-Enr (p=0.48) | PC = Enr (p=0.7) | PC > Cond * (p=0.015) | Cond < Non-Enr * (p=0.018) | Enr = Non-Enr (p=0.48) |
Additional files
-
Transparent reporting form
- https://doi.org/10.7554/eLife.34976.016
Download links
A two-part list of links to download the article, or parts of the article, in various formats.
Downloads (link to download the article as PDF)
Open citations (links to open the citations from this article in various online reference manager services)
Cite this article (links to download the citations from this article in formats compatible with various reference manager tools)
Opposite regulation of inhibition by adult-born granule cells during implicit versus explicit olfactory learning
eLife 7:e34976.
https://doi.org/10.7554/eLife.34976


