Cellular tolerance at the µ-opioid receptor is phosphorylation dependent
- Oregon Health and Science University, United States
Figures
Figure 1
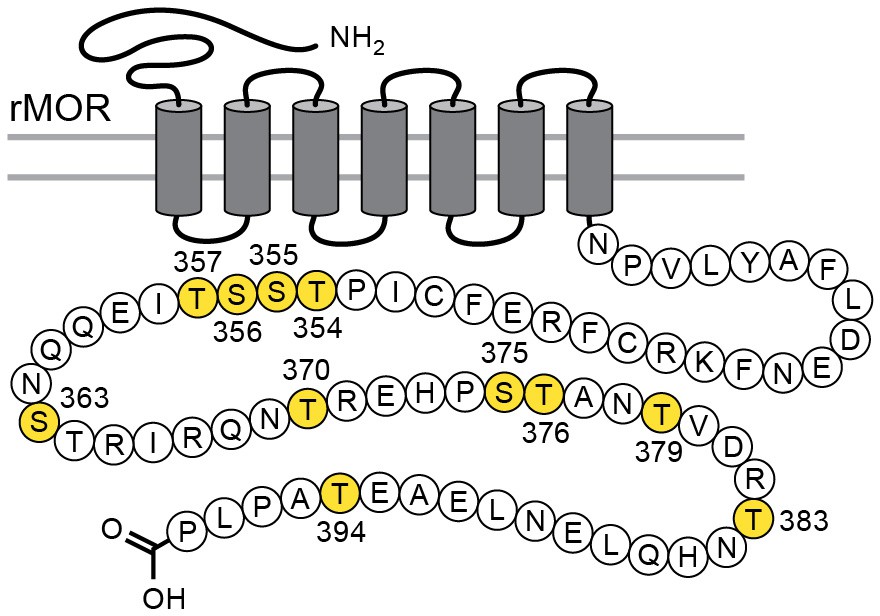
Schematic illustrates the phosphorylation sites (in yellow) that were mutated to alanine for the TPD receptor.
https://doi.org/10.7554/eLife.34989.002
Figure 2 with 1 supplement

Locus coeruleus neurons are not sensitive to opioids in the MOR knockout rat.
(A) from a MOR knockout animal where the alpha-2-adrenoceptor agonist, UK14304 (3 µM) and OFQ both activate potassium currents whereas ME (30 µM) had no effect. (B) from a neuron where the wild type MOR (exWT) was expressed in the MOR knockout animal. In this recording ME (1 µM), morphine (10 µM) as well as UK14304 (3 µM) all caused outward currents.
Figure 2—figure supplement 1
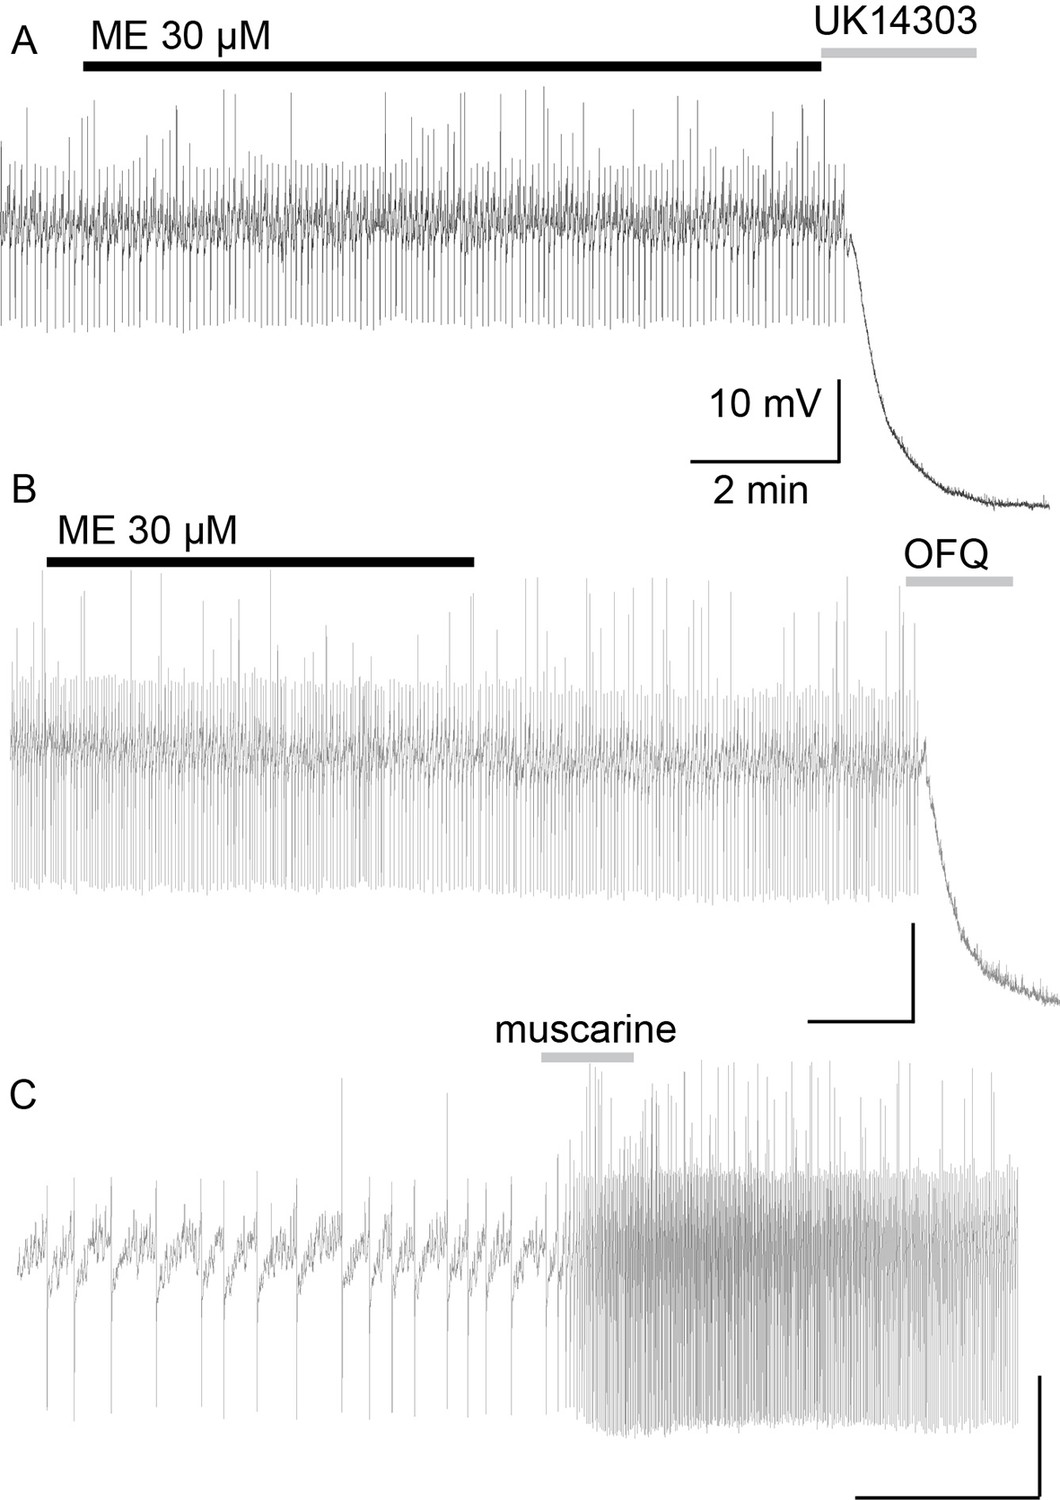
The firing rate of locus coeruleus neurons is not changed by opioids in recordings from the MOR knockout animal.
Examples of recording with intracellular electrodes from three neurons. Application of ME (30 µM) had no effect on the firing rate however both UK14304 (3 µM, A) and OFQ (1 µM, B) inhibited firing and caused a hyperpolarization of the membrane potential. (C) application of muscarine (10 µM) increased the firing rate of the LC neuron.
Figure 3
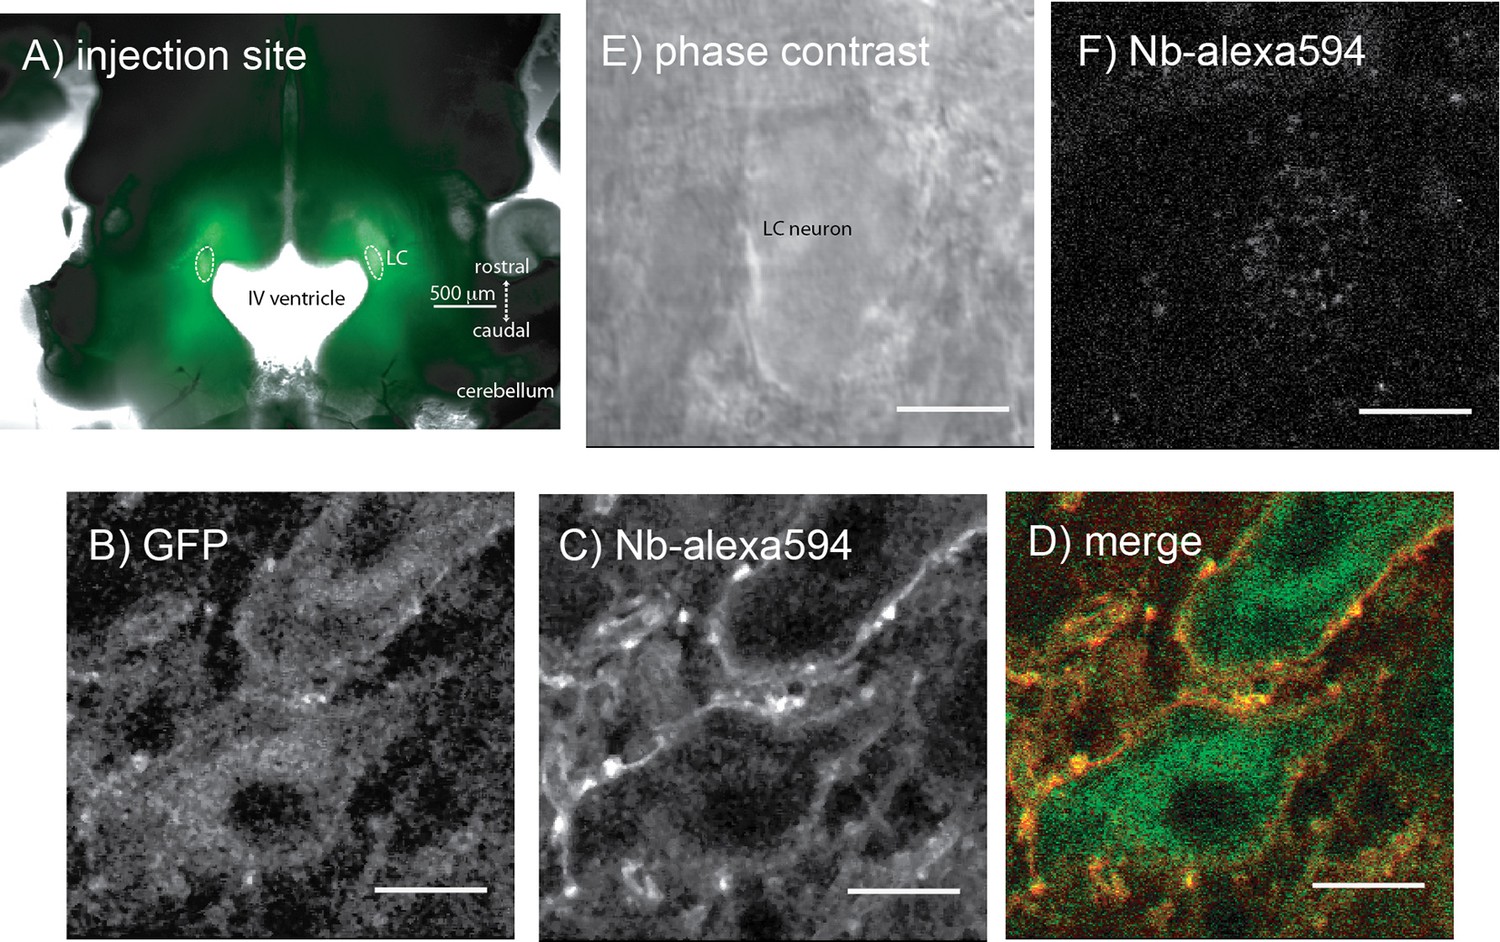
Microinjection of virus expressing GFP-tagged exWT receptors in the locus coeruleus of MOR knockout rat.
(A) low power image of the GFP fluorescence observed in a horizontal slice containing the LC. (B) shows an image obtained with a 2-photon microscope showing the GFP fluorescence. (C) the same neuron showing the plasma membrane associated receptors following incubation of the slices with an anti-GFP nanobody conjugated with alexa594. (D) the merged image of the GFP and alexa594 fluorescence. (E) a scanning DIC image of a LC neuron from a knockout animal that had not been injected with virus. (F) the same neuron following incubation of the slice with the anti-GFP nanobody conjugated with alexa594 showing that without the expression of the GFP-tagged receptors there was no staining. Scale bar = 10 μm.
Figure 4
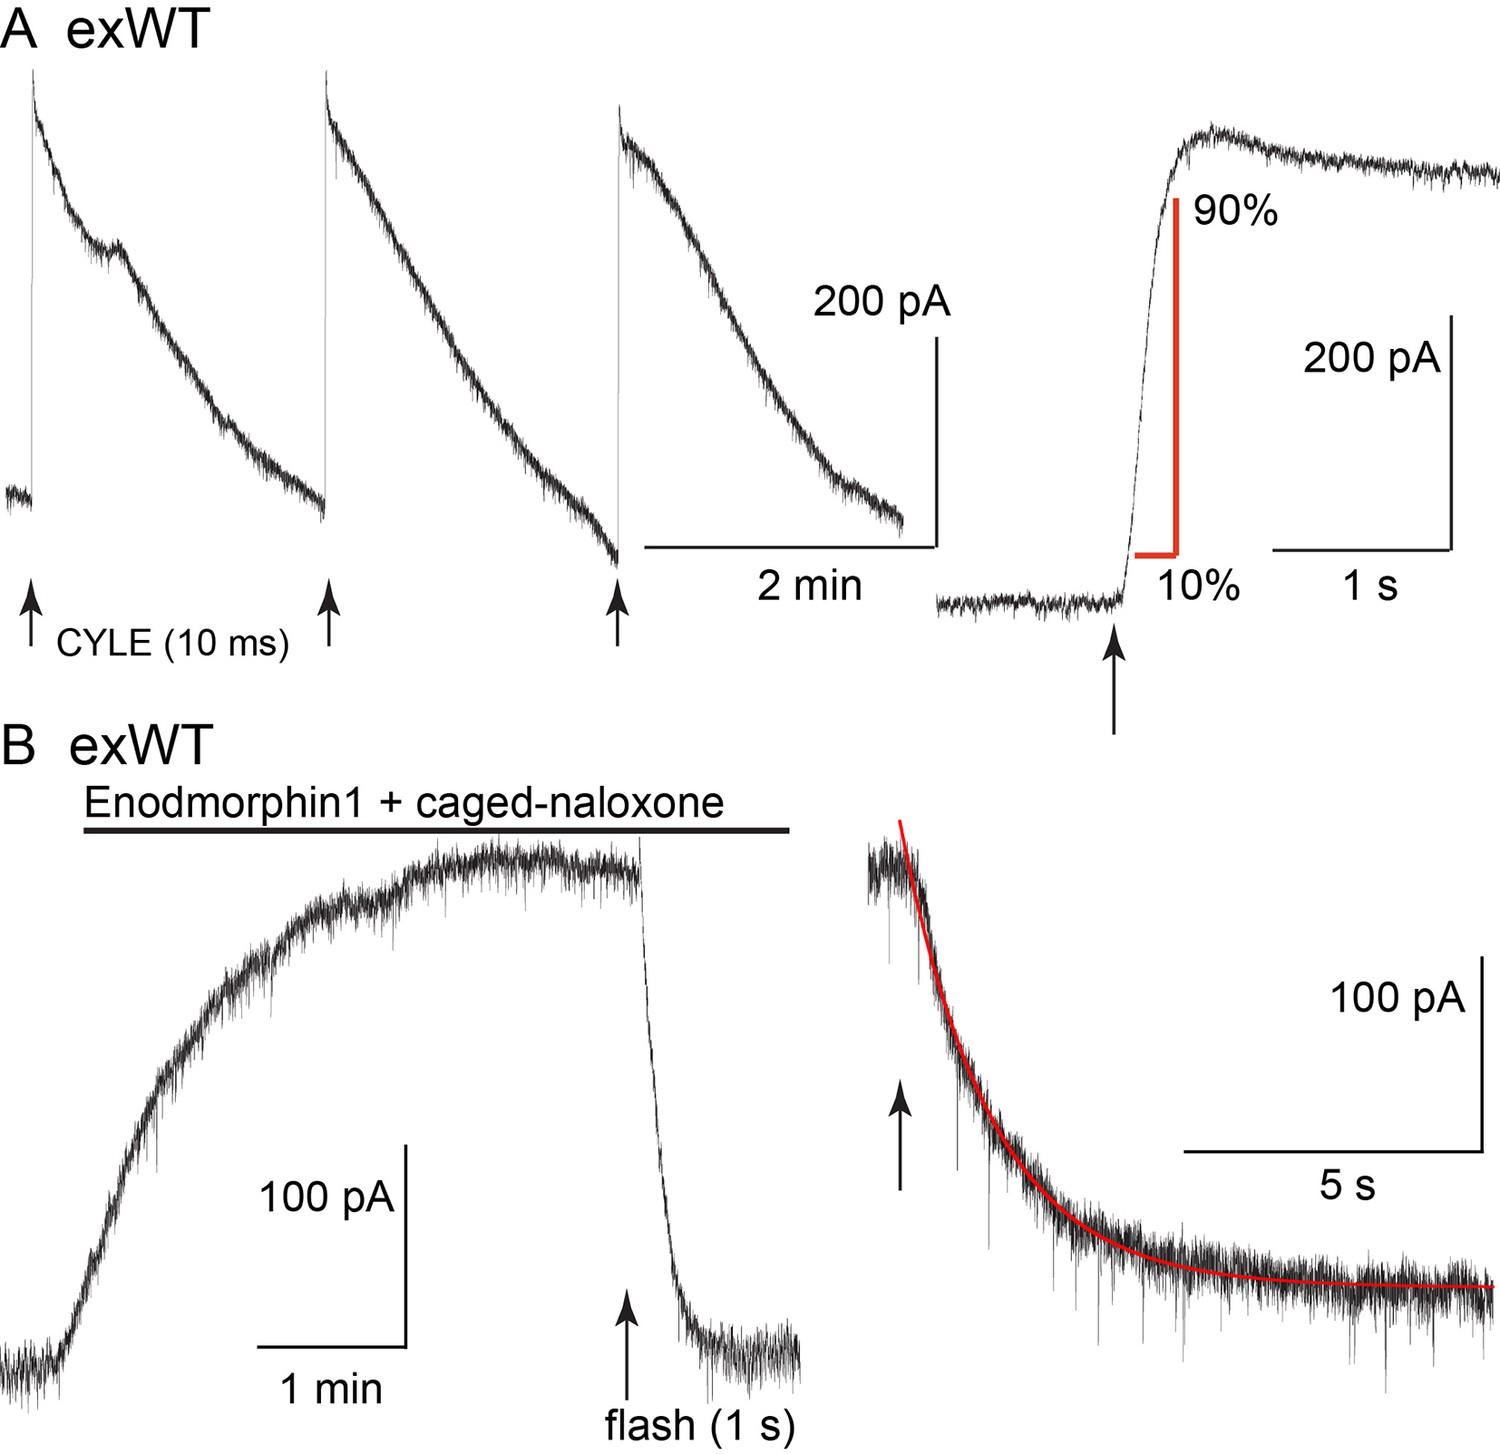
The kinetics of activation and inhibition of expressed wild type receptors (exWT) in LC neurons from the MOR knockout measured with photolysis of caged enkephalin (CYLE).
(A) repeated photolysis events (1/2 min) resulted in rapidly rising outward currents. Right side, the rate of rise was measured as the time it took to go from 10% to 90% of the peak. (B) the high affinity agonist endomorphin1 (100 nM) was applied along with caged-naloxone (5 µM). At the arrow a 1 s photolysis flash was applied and the decrease in the outward current was measured. Right side is an expanded time base of the decrease in outward current and the single exponential fit to that decline.
Figure 5 with 1 supplement
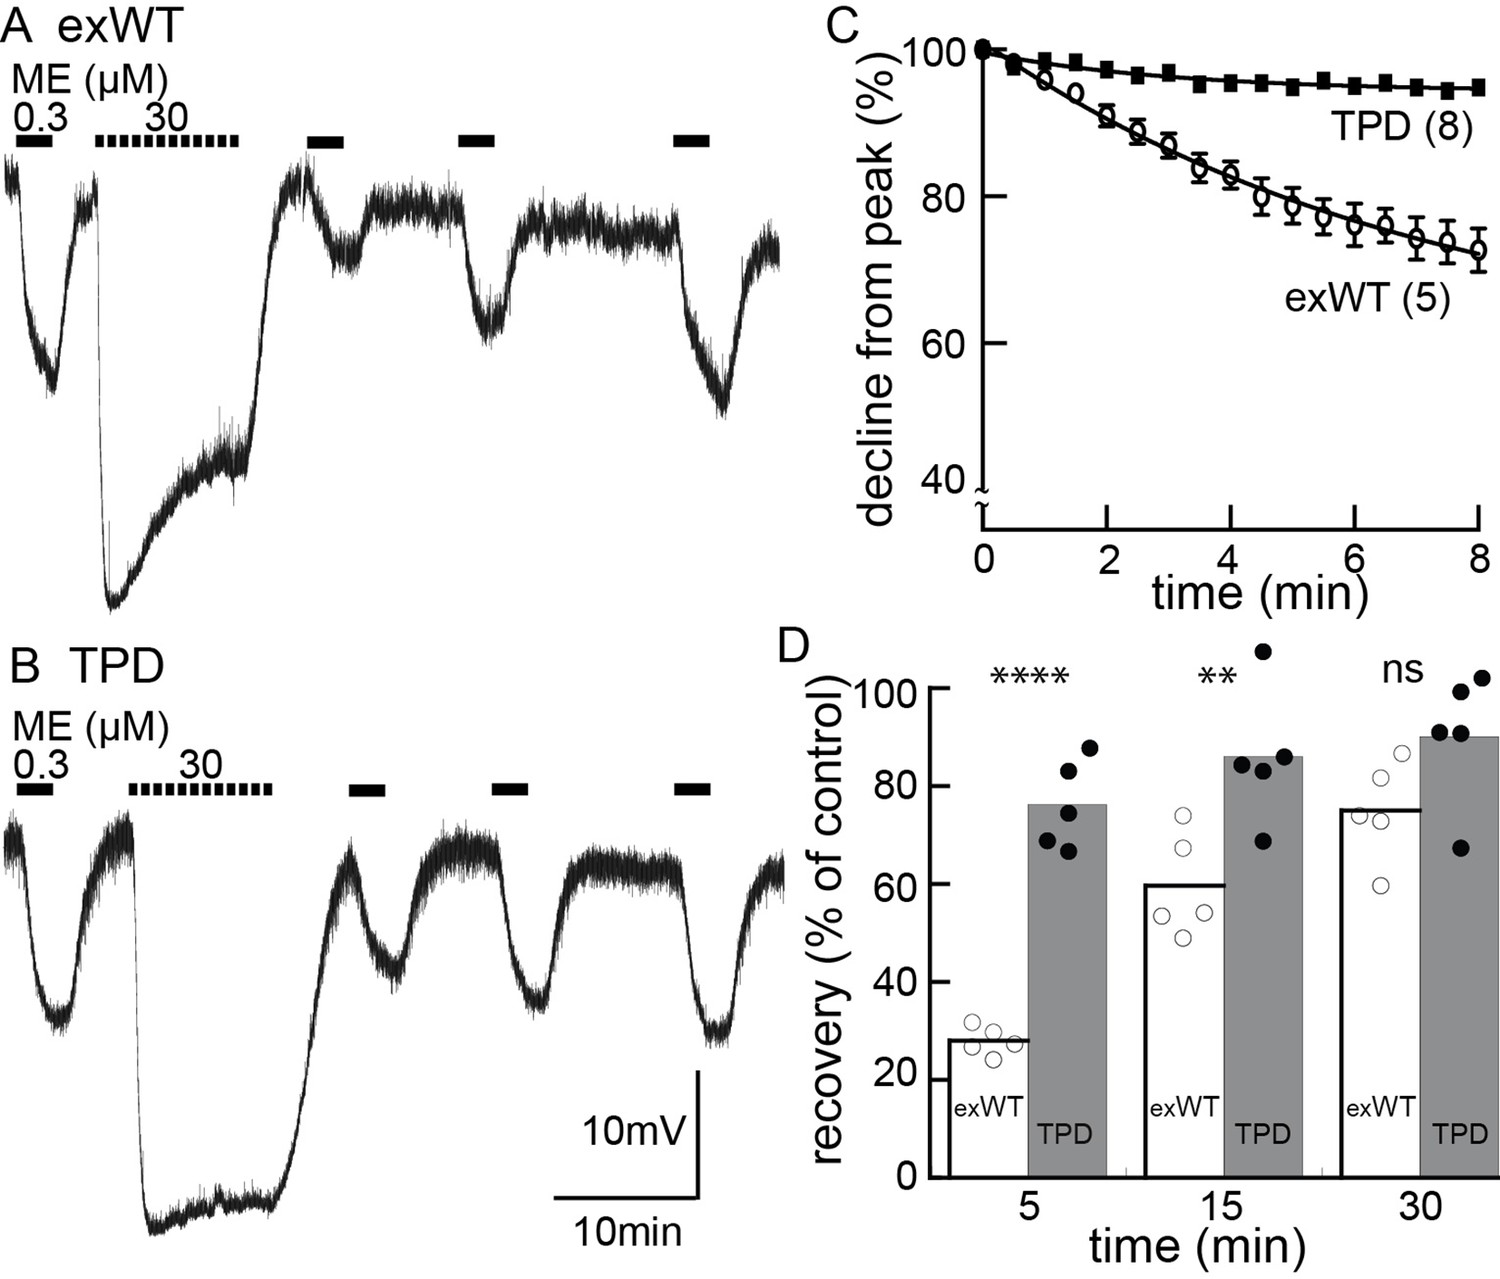
Desensitization is largely blocked in experiments carried out in neurons expressing the TPD.
Experiments carried out with intracellular recordings of membrane potential. (A) an example of an experiment with a cell expressing the exWT receptor. ME (300 nM) was applied before and following application of a saturating concentration of ME. The amplitude of the hyperpolarization induced by ME (30 µM) decreased during the 10 min application. The hyperpolarization induced by ME (300 nM) was reduced and recovered slowly following washout of ME (30 µM). (B) the same experiment carried out in neurons that expressed the TPD receptor. (C) summarized results showing the decline in the hyperpolarization during the application of ME (30 µM). There is only a small decline in experiments carried out with the TPD receptor. (D) summarized results showing the recovery from desensitization. Experiments with neuron in wild type animal (WT) and the expressed exWT receptors show a slow recovery, whereas there was little sign of desensitization in the experiments from the TPD receptor.
Figure 5—figure supplement 1
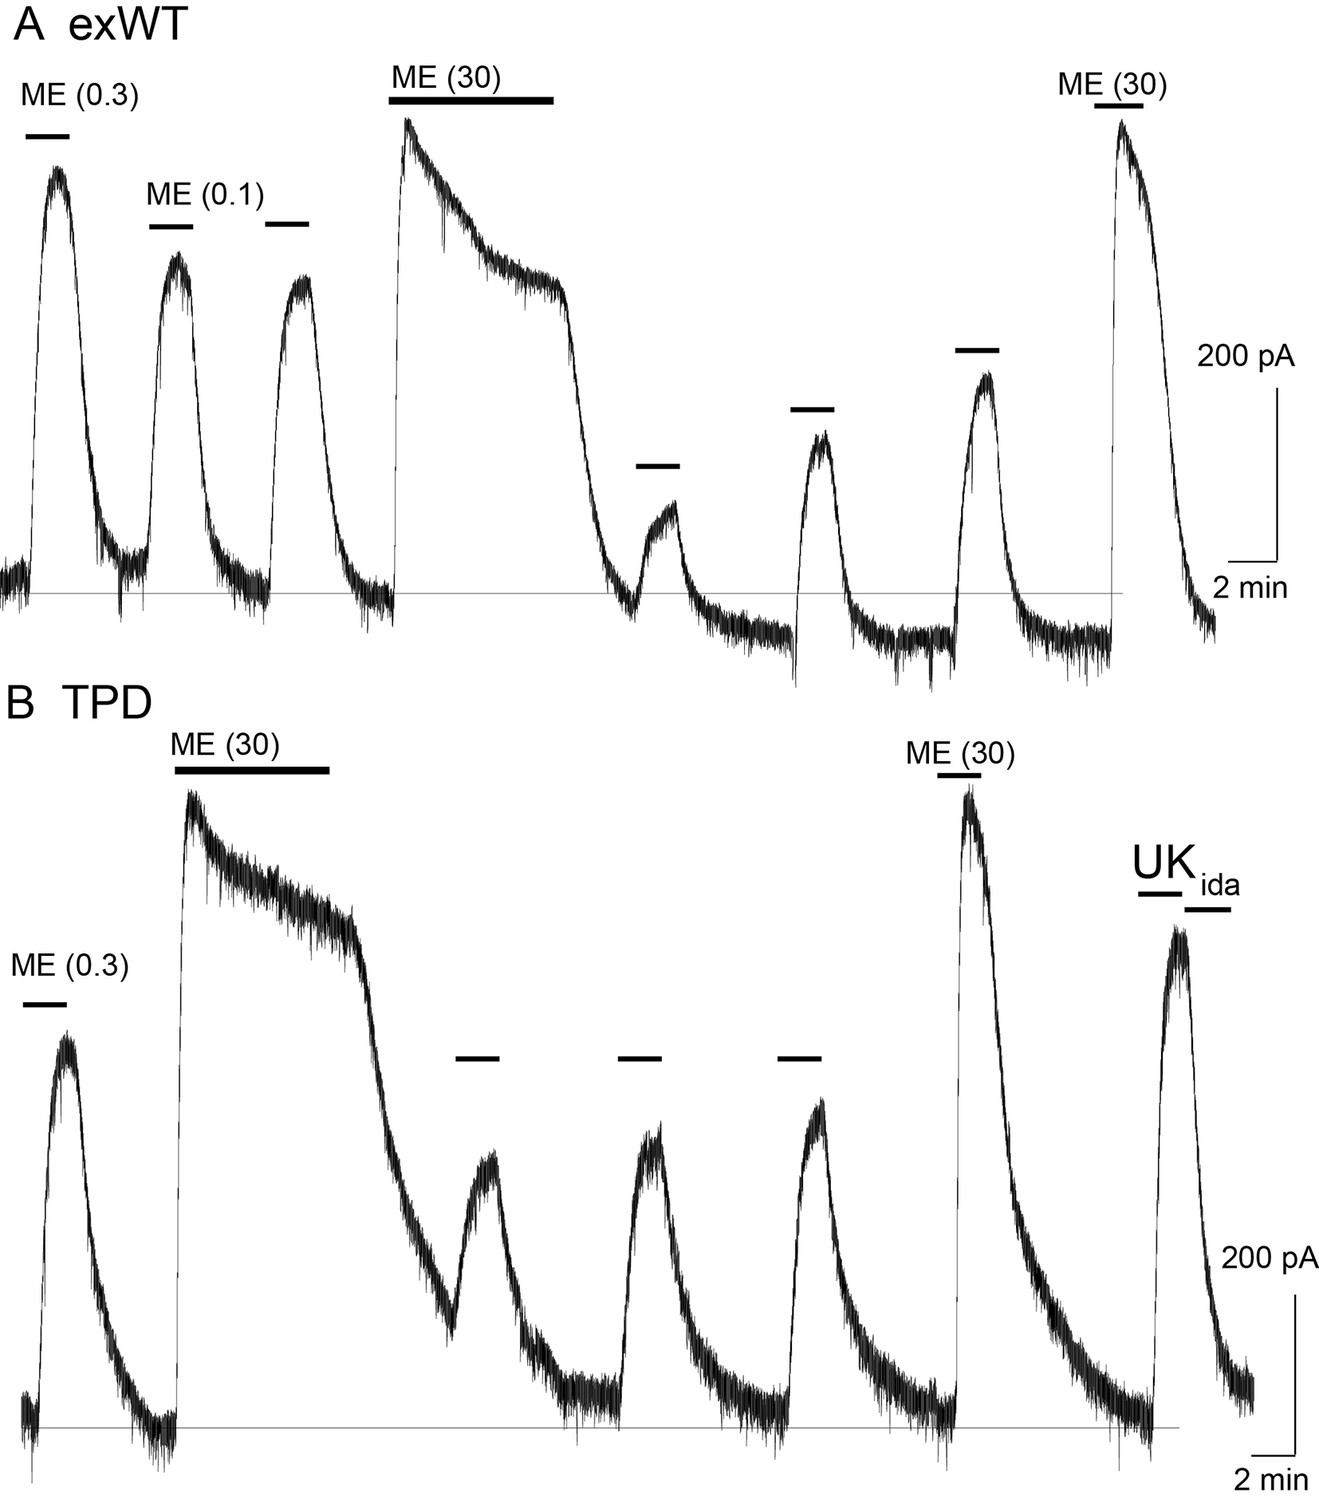
Reduced desensitization of the TPD receptor measured with whole cell voltage clamp recording.
(A) shows the outward current induced by application of different concentrations of ME. In this experiment ME (0.1 µM) was tested before and following the application of ME (30 µM, 10 min). The current induced by ME (30 µM) peaked and declined during the 10 min application and following the washout the current induced by ME (0.1 µM) was reduced and recovered slowly. (B) the same experiment carried out with a neuron expressing the TPD receptor. The decline in the current induced by ME (30 µM) over 10 min was smaller than that in the exWT experiment and the decrease in the current induced by ME (0.3 µM) was also largely eliminated.
Figure 6 with 1 supplement

Muscarine inhibits ME-induced hyperpolarization and increases desensitization of WT, exWT and TPD receptors.
Recording of membrane potential made using intracellular electrodes. (A) a recording from a neuron in a slice from a wild type animal. The hyperpolarizations induced by ME (300 nM) and noradrenline (NA 5 µM, plus cocaine 3 µM to prevent reuptake and prazosin 500 nM to block alpha-1-adrenoceptors) were both decreased in the presence of muscarine (10 µM). The hyperpolarization induced by ME (30 µM) peaked and declined during the 10 min application. (B) the same experiment carried out in a recording from an exWT receptor. The hyperpolarization induced by ME (300 nM) was reduced and the decline in the hyperpolarization induced by ME (30 µM) was increased in the presence of muscarine (10 µM). (C) an experiment with the TPD receptor showing the lack of decline in the hyperpolarization during the application of ME (30 µM). (D) the same experiment carried out in the presence of muscarine (10 µM). The initial hyperpolarization induced by ME (300 nM) is reduced and there is a greater decline in the hyperpolarization during the application of ME (30 µM). (E) summary of the inhibition of the initial hyperpolarization induced by ME and NA in WT, exWT and TPD receptors, two-tailed paired t-test (**p<0.01, ****p<0.0001). (F) summary of the decline in the hyperpolarization in control and in the presence of muscarine. The muscarine-induced increase in decline in experiments from WT and exWT receptors is the same (WT n = 15 in control 11 in muscarine; exWT n = 5 in control, five in muscarine). There is also a small but significant increase in the decline found in experiments with the TPD receptor (n = 8 in control, six in muscarine, p<0.0001, two way ANOVA, Bonferroni post hoc).
Figure 6—figure supplement 1
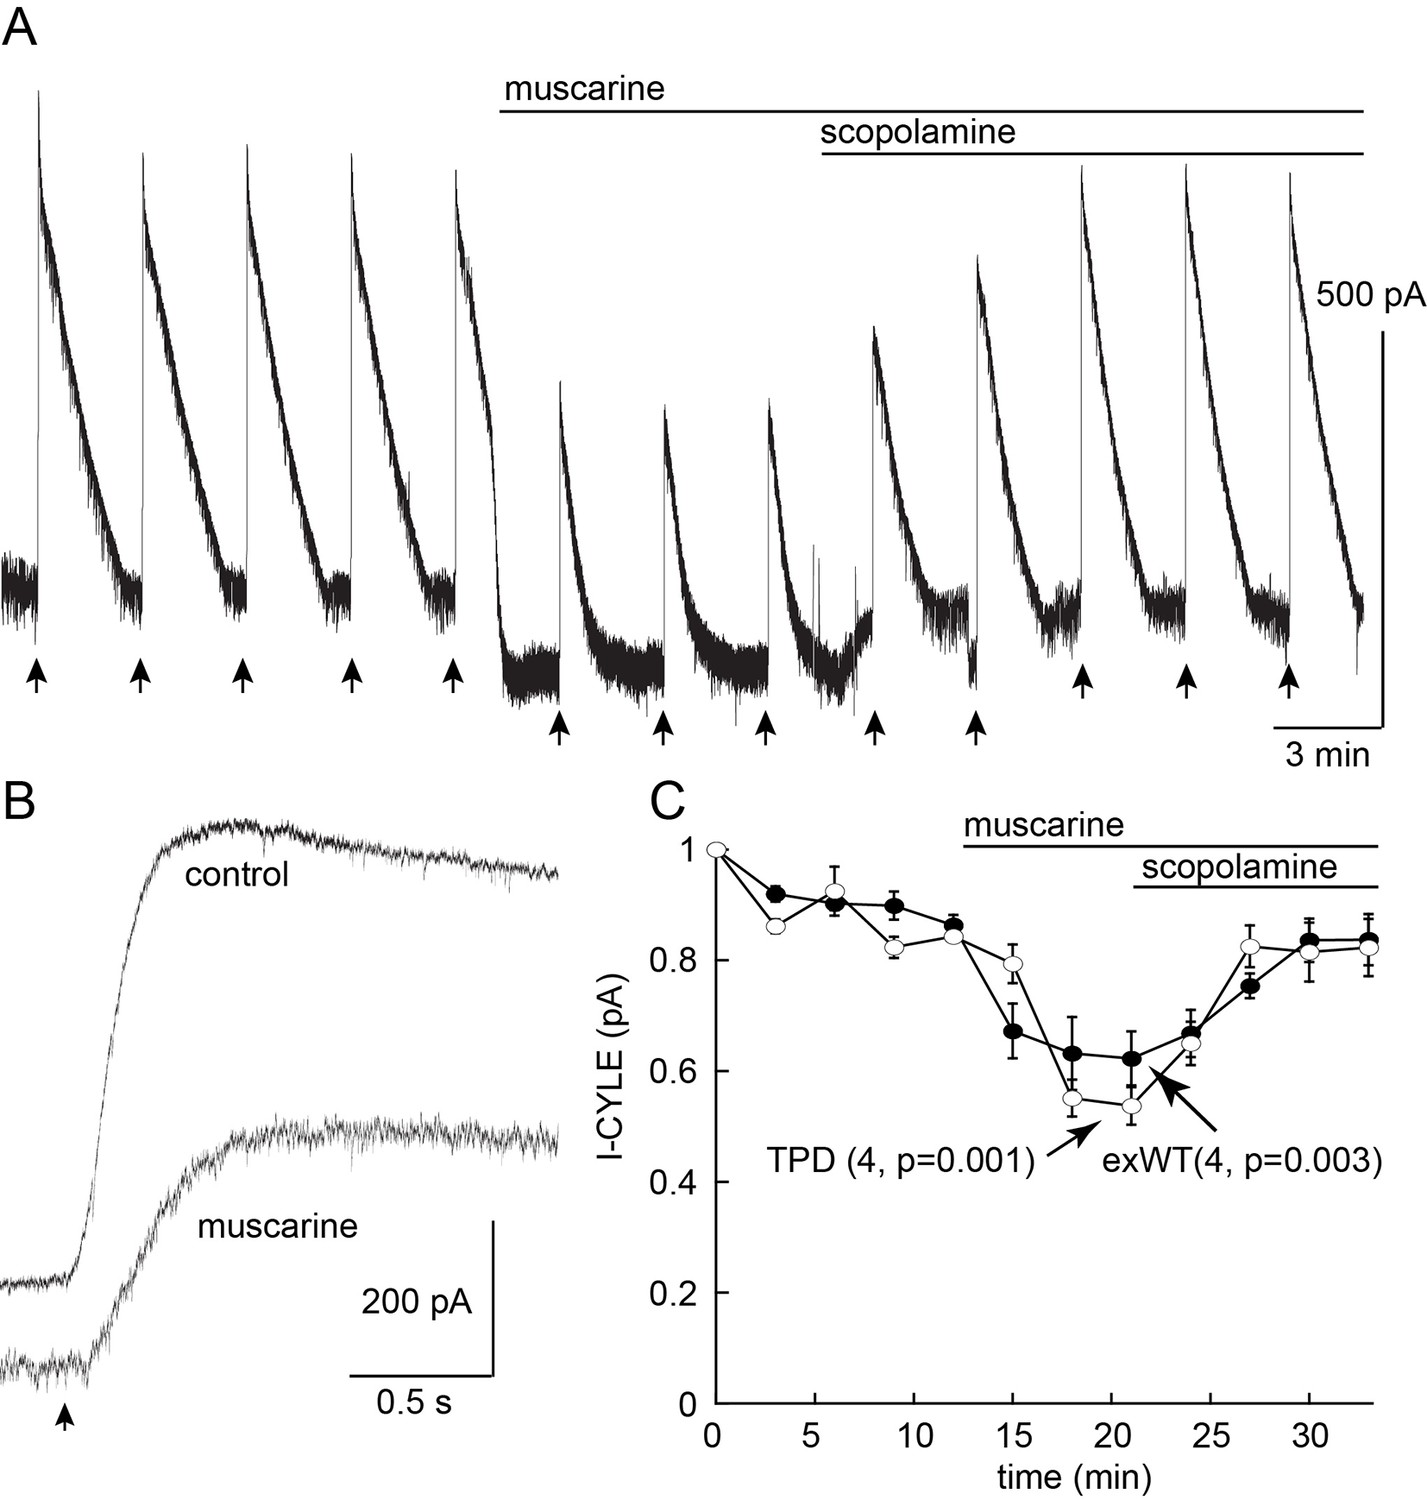
Whole cell voltage clamp experiment showing the inhibition of the outward current induced by photolysis of CYLE caused by muscarine (10 µM).
(A) an example of an experiment. Outward currents were induced before the application of muscarine (10 µM) and following the addition of the muscarinic antagonist, scopolamine (1 µM). Muscarine caused in inward current and the outward CYLE current was reversibly decreased. (B) the rate of rise of the current induced by photolysis of CYLE was reduced by muscarine, similar to that reported following acute desensitization. (C) summarized results from experiments carried out in exWT and TPD receptors. There was a significant inhibition by muscarine in experiments from both exWT and TPD receptors (n = 4 for each receptor).
Figure 7
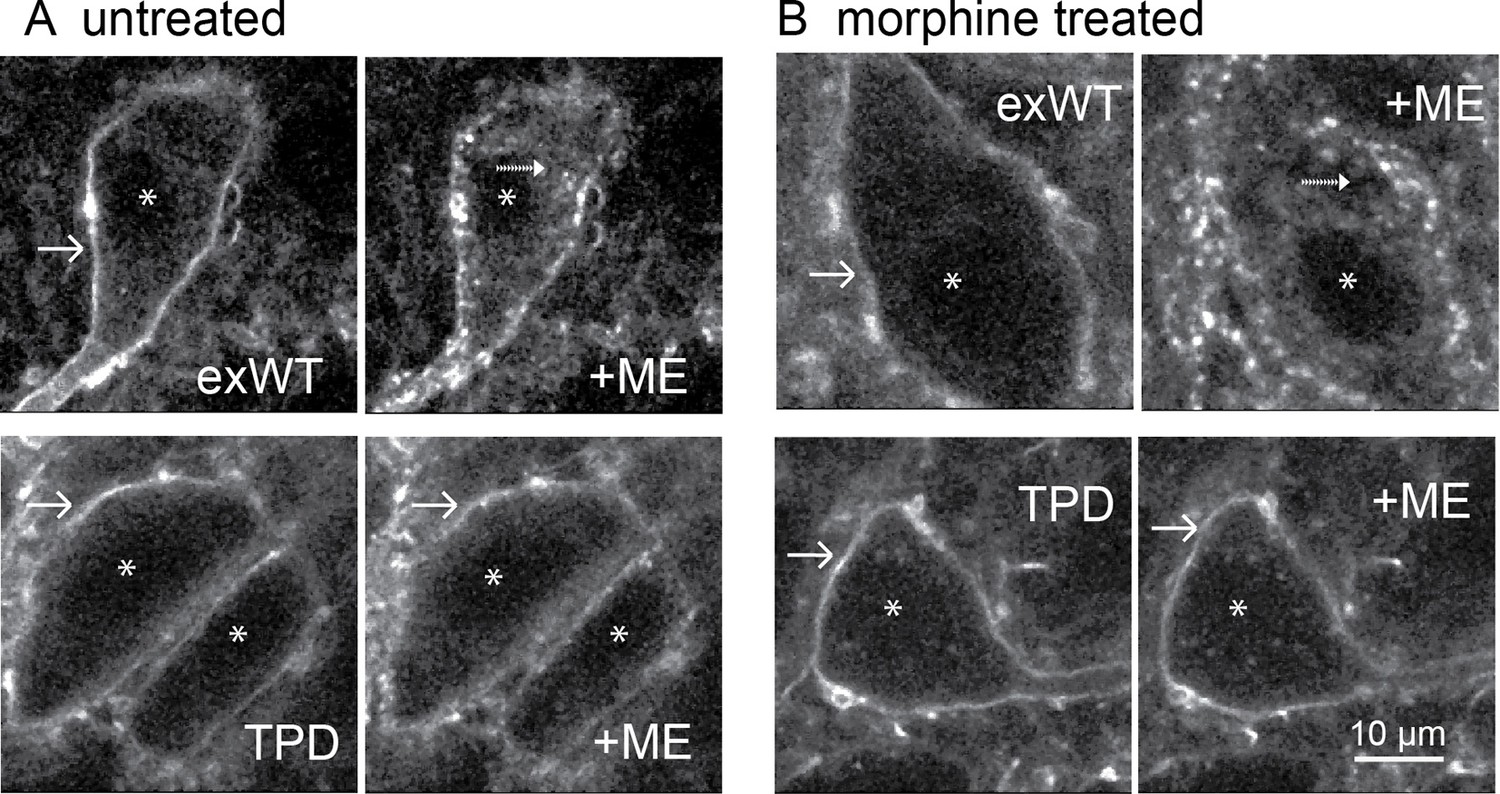
Receptor trafficking of the TPD is blocked in slices from untreated and morphine treated animals.
Images from exWT (top) and TPD (bottom) showed receptor distribution before and following application of ME (30 µM, 10 min). The exWT receptors became punctate and moved into the cytoplasm in slices from untreated (A, top) and morphine treated (B, top) animals. The TPD receptors did not traffic in slices from untreated (A, bottom) or morphine treated animals (B, bottom). Scale bar = 10 μm. Solid-arrows showed plasma membrane receptors. Dash-arrows showed receptors that were internalized after ME treatment. Asterisks indicated nucleuses.
Figure 8 with 1 supplement
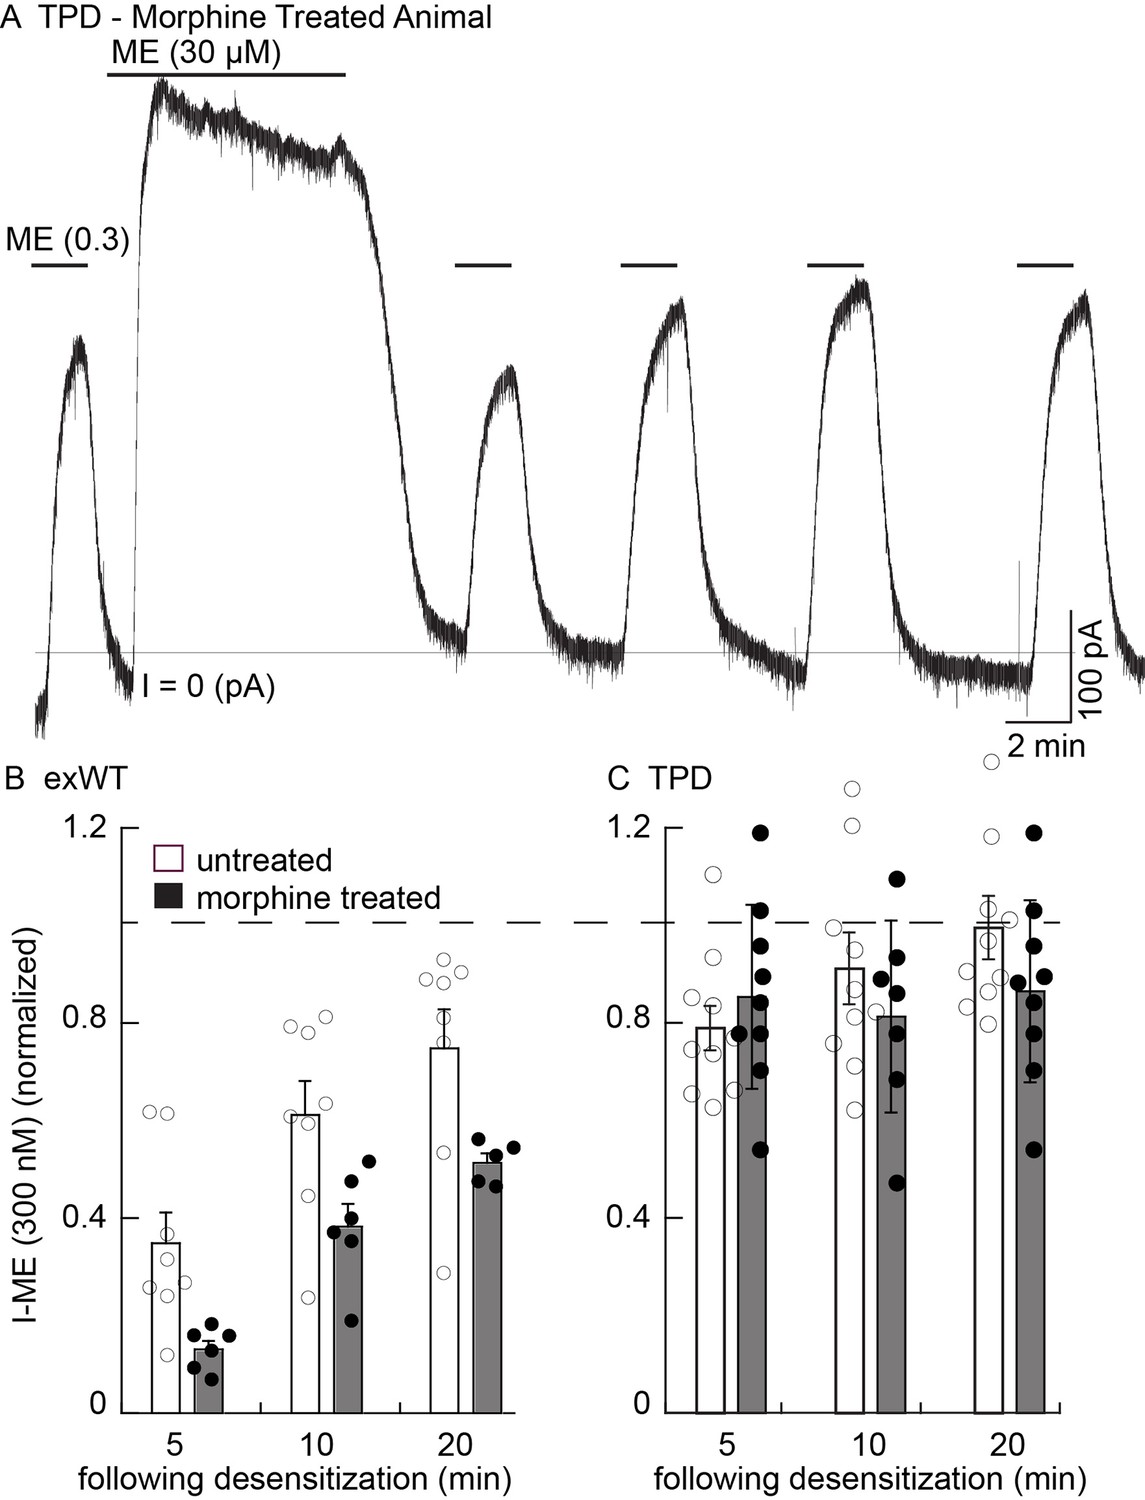
There is no sign of one measure of long-term tolerance induced in the TPD receptor following chronic morphine treatment.
Whole cell voltage clamp experiments. (A) an example from a morphine treated animal expressing the TPD receptor. There was a small decline in the current induced by a saturating concentration of ME (30 µM, 10 min) and a small and transient decrease in the current induced by ME (0.3 µM) following the washout of the ME (30 µM). (B) summary shows the recovery from desensitization induced by ME (30 µM, 10 min) in exWT. There is significantly less recovery from desensitization seen in experiments from morphine treated animals than untreated controls with the exWT receptor (p=0.0001, two way ANOVA, Bonferroni post hoc). (C) summarized results from untreated and the morphine treated animals expressing the TPD receptors. There was a small (not significant) decrease in the ME (0.3 µM) current immediately after the ME (30 µM) treatment in experiments from animals expressing the TPD receptor that did not change with time. There were no difference with repeated applications of ME (300 nM) in slices from untreated and morphine treated animals at any point.
Figure 8—figure supplement 1

Variation in receptor expression limits the ability to construct concentration response curves among groups of animals.
In this plot the current induced by ME (300 nM) relative to that induced by ME (30 µM) is plotted for cells in each group of animal. Although the mean current is near that of an EC50 concentration, the variability limits interpretation of any possible changed in sensitivity induced after chronic morphine treatment.
Figure 9
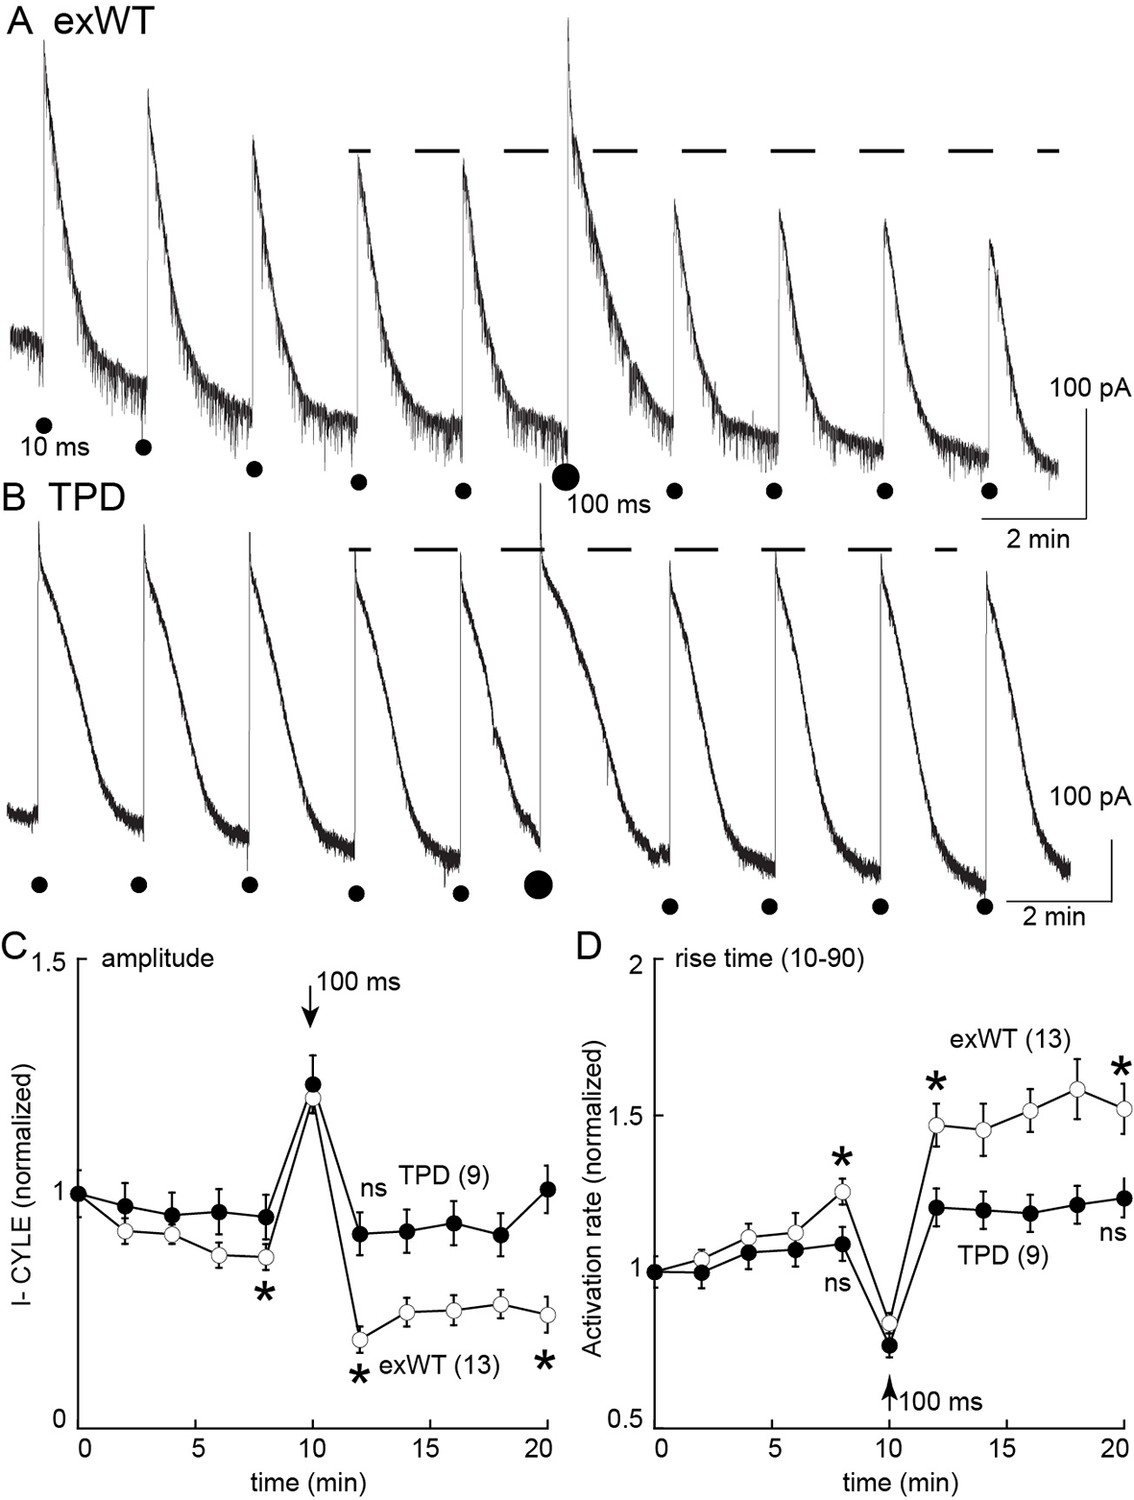
Measures of acute desensitization induced by photolysis of caged enkephalin (CYLE) in slices from morphine treated animals.
Whole cell voltage clamp recordings were made from neurons expressing the TPD or exWT receptors. (A) exWT and (B) TPD are example experiments where photolysis of CYLE was carried out every 2 min. The initial duration of the flash was 10 ms, after five flashes the duration of the flash was increased to 100 ms and subsequent flashes were 10 ms. (C) shows summarized results of the amplitude of the outward currents. In recordings from exWT receptors the amplitude of the current induce by the 10 ms flash decreased steadily. Increasing the duration of the flash increased the peak current and the amplitude of the subsequent currents induced by 10 ms flashes was decreased. The current induced by the 10 ms flashes in experiments from the TPD receptor were not changed (ANOVA, Dunnett test). (D) Summary of the rise time (10–90%) of the outward current in exWT and TPD receptors. The rise increased steadly in exWT receptors whereas there was no significant change in recordings from the TPD receptors.
Additional files
-
Transparent reporting form
- https://doi.org/10.7554/eLife.34989.015
Download links
A two-part list of links to download the article, or parts of the article, in various formats.
Downloads (link to download the article as PDF)
Open citations (links to open the citations from this article in various online reference manager services)
Cite this article (links to download the citations from this article in formats compatible with various reference manager tools)
Cellular tolerance at the µ-opioid receptor is phosphorylation dependent
eLife 7:e34989.
https://doi.org/10.7554/eLife.34989


