Dynamic action of the Sec machinery during initiation, protein translocation and termination
- University of Leeds, United Kingdom
- University of South Bohemia, Czech Republic
- University of Bristol, United Kingdom
Figures
Figure 1 with 2 supplements

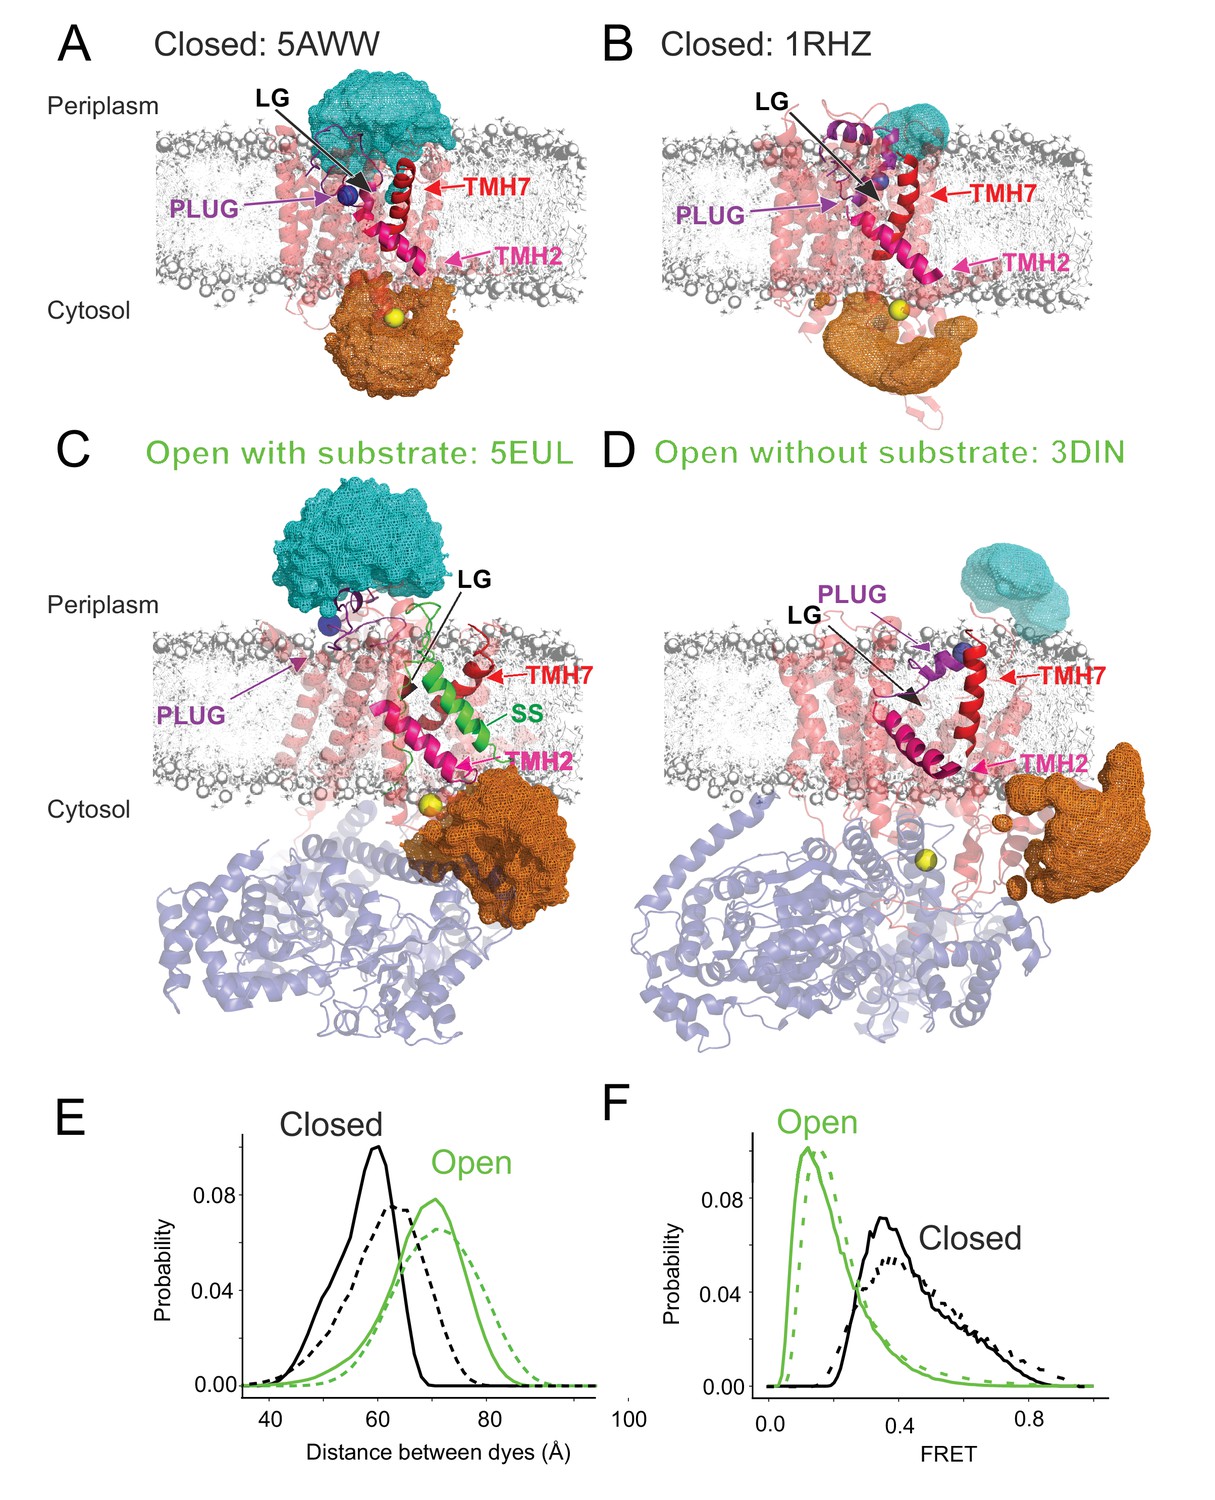
Channel opening and helical plug motion illustrated by available high-resolution structures.
(A) Closed SecYEG (PDB: 5AWW, Tanaka et al., 2015). SecYEG (light red) is shown embedded in a modelled membrane (grey) with the plug helix highlighted (purple). Also identified are the transmembrane helices TMH2 (magenta) and TMH7 (red) that are demarking the lateral gate (LG). The structurally equivalent position of E. coli SecY residue M63 within the plug is depicted as a blue ball while a cytoplasmic side reference residue K106 is shown as a yellow ball. A side view (left) and a periplasmic view (right) are shown together with a schematic of each state (SecYEG in red, the plug in purple). The respective distances are shown as yellow double-arrow line with the dyes shown as stars (blue and yellow). (B) The open state SecYEG:SecA (PDB: 5EUL, (Li et al., 2016). Colours and labelling are as in panel A, with Sec A in transparent blue and the translocated polypeptide (green) and signal sequence (SS, green with black outline). Sec A is depicted blue in the schematics.
Figure 1—figure supplement 1
Modelling of fluorescent dye accessible volumes.
(A) Closed state (PDB: 1RHZ) (Van den Berg et al., 2004). Accessible volumes (orange for dye attached to the reference residue and cyan for the plug probe) obtained by modelling the dye positions when attached to the mutated residues (blue and yellow spheres) via a short C6 aliphatic linker (not shown). Ribbon colours: SecYEG (light red), TMH2 (magenta) and TMH7 (red), plug (purple). Note that the orientation of the lateral gate (LG) is slightly different from that shown in Figure 1 to aid visualisation of the accessible volumes. (B) As (A), but for the Closed state (PDB:5AWW) (Tanaka et al., 2015). (C) As (A), but for the Open state (PDB:5EUL) (Li et al., 2016). SecA is shown in transparent blue and SS is green. (D) As (A), but for the Open state (PDB:3DIN) (Zimmer et al., 2008). SecA is shown in transparent blue. (E) Distributions of inter-probe distances computed from the accessible volumes in panels (A–D). Open states are in green (PDB: 5eul solid and 3din dashed line) while closed states are black (PDB: 5aww solid and 1rhz dashed line). (F) Distribution of FRET efficiencies derived from the distance distributions in panel (E). Colour coding as in panel E.
Figure 1—figure supplement 2
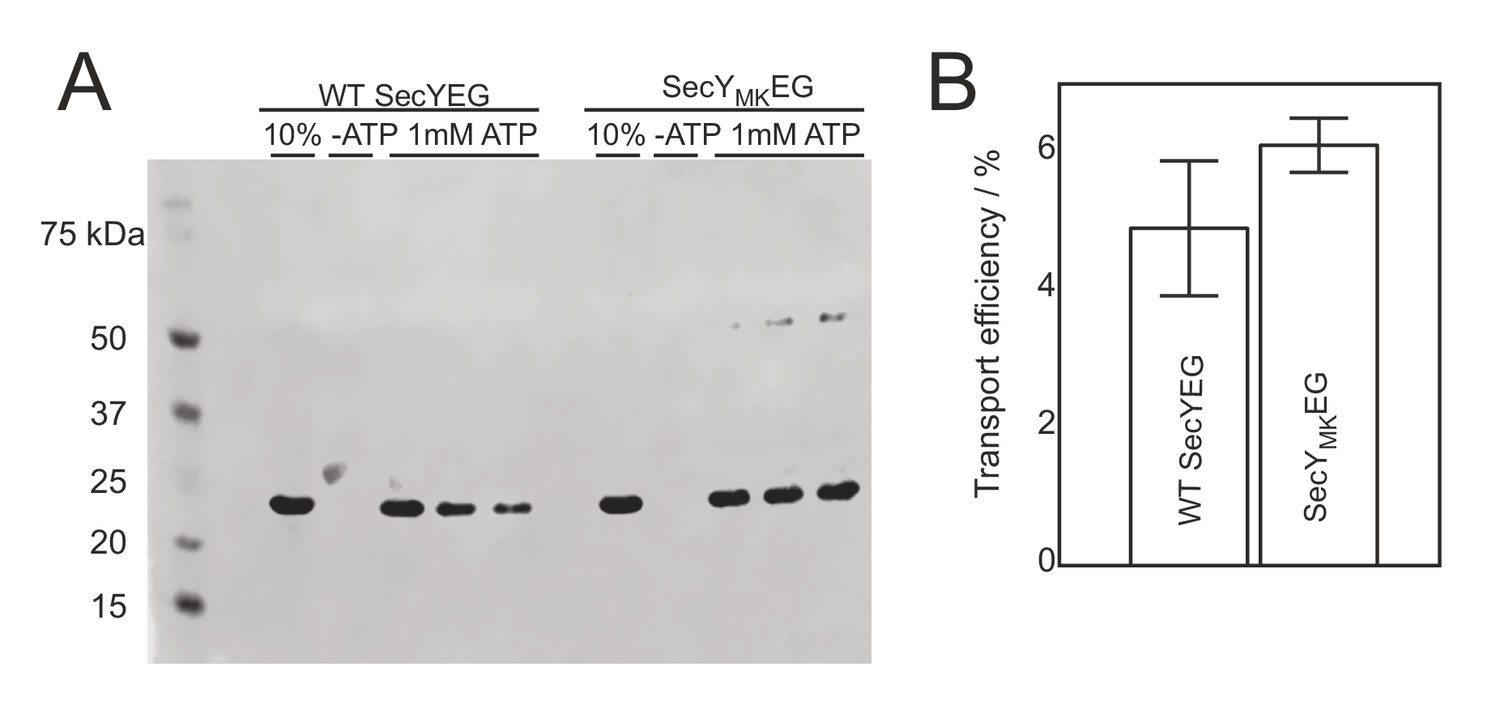
Activity of dual labelled SecYMKEG in a translocation assay.
(A) Protease protection assay performed with wild-type WT SecYEG (unlabelled) and SecYMKEG mutant labelled with AlexaFluor dyes. A 233 amino acid N-terminal fragment of proOmpA was used as substrate. 10% lane corresponds to the 10% fraction of the substrate added to the reaction and was used to quantify the amount of protected polypeptide after quenching the reaction (lanes labelled 1 mM ATP represent triplicate samples). A negative control reaction was performed in the absence of ATP (-ATP lane). (B) Efficiency obtained by densitometry using the density of 10% control band as an internal standard. Error bars represent standard deviations estimated from the three repeats in (A).
Figure 2 with 3 supplements
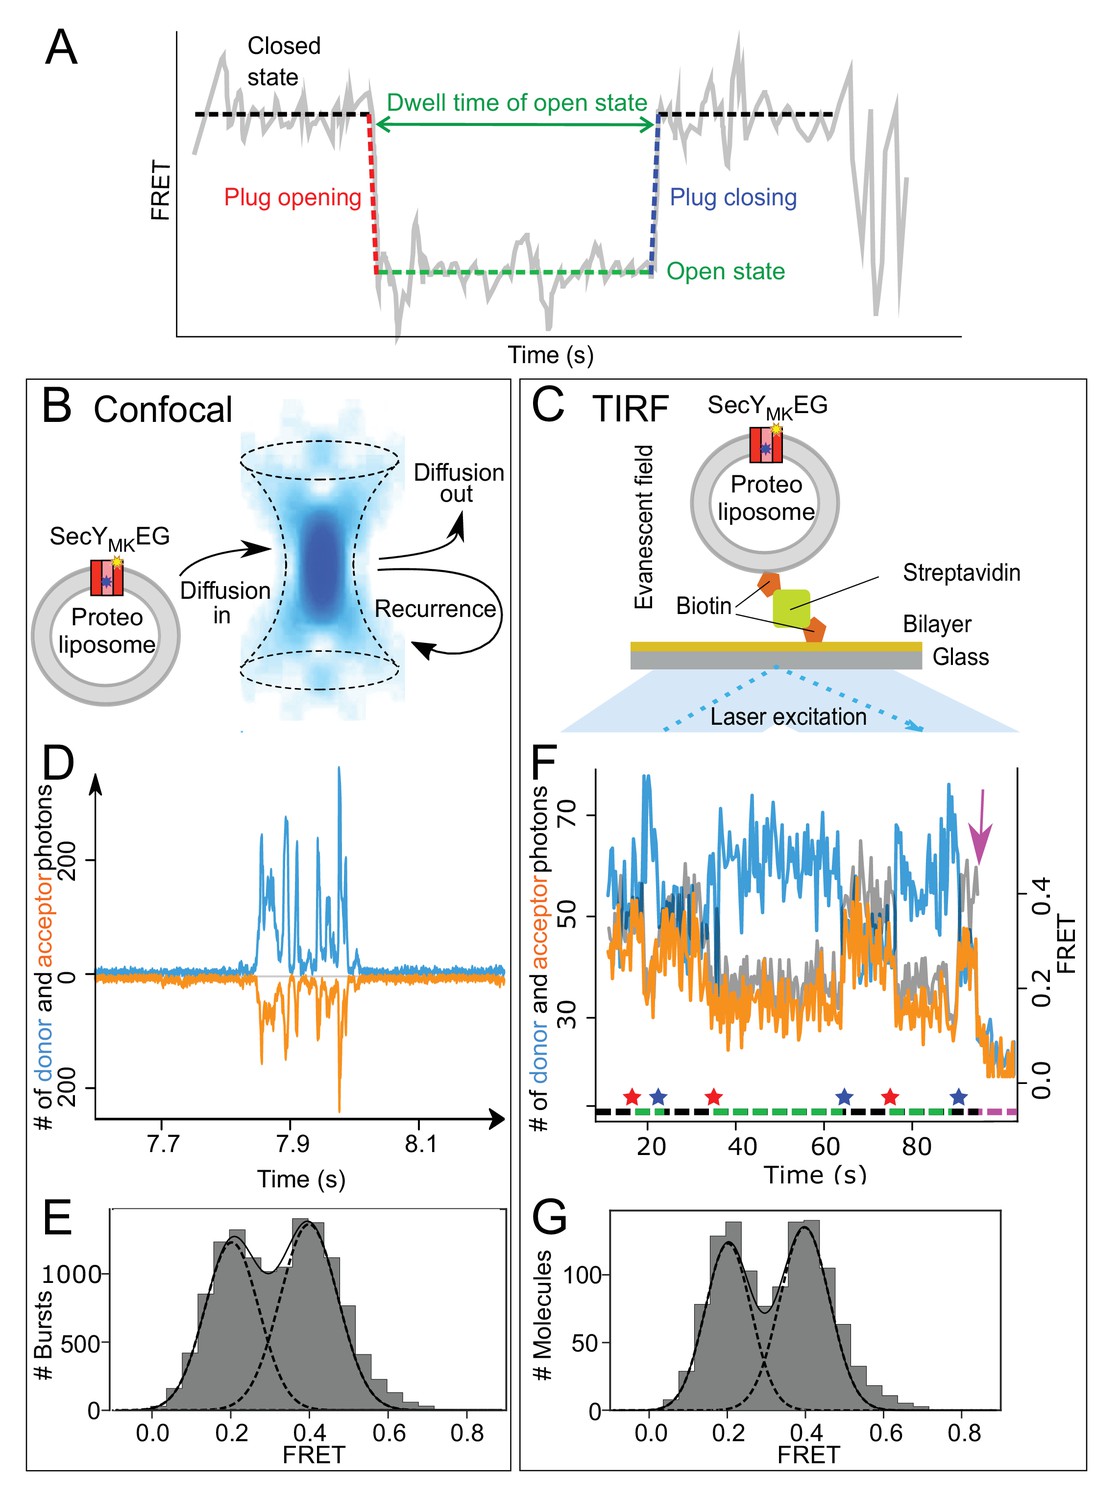
Monitoring plug movement by single molecule FRET.
(A) Expected changes in the FRET efficiency as a consequence of plug displacement during translocation. Pre-translocation, high FRET closed state (black dashed line) changes rapidly to a low FRET, open state (red dashed line) and remains open (green dashed line) until closing (blue dashed line). (B) Schematic depiction of confocal (blue confocal volume) detection of freely diffusing proteoliposomes containing SecYMKEG (red) embedded in the bilayer (grey) with recurrence and diffusion paths shown as arrows. (C) Schematic depiction of proteoliposome immobilized via a biotinylated lipid to a streptavidin (green) coated cover slip. Laser beam (blue) in a total internal reflection fluorescence (TIRF) mode creates a thin layer (~500 nm) of evanescent optical field close to the surface. (D) Example of fluorescence time traces collected in confocal microscope (donor channel -blue, acceptor channel – orange, shown with opposite sign for clarity) containing a train of bursts from recurrence. FRET data sets were collected under steady state translocation conditions, that is in the presence of short proOmpA substrate (100 aa, 700 nM), the ATPase SecA (1 μM), the chaperone SecB (10 μM) and 2 mM ATP. (E) FRET efficiency histograms derived from confocal data (10,000 events) under steady state translocation conditions. A sum (solid black line) of two Gaussian functions (black dashed lines) approximates the experimental histograms. The histogram was corrected for contribution from the 50% SecYMKEG in opposite orientation which is unable to bind SecA and translocate (see Materials and methods and Figure 2—figure supplement 2 for further details). (F) Example of TIRF fluorescence trace for translocation of proOmpA 100 aa substrate with dwell times on the order of seconds (donor channel is blue, acceptor orange and FRET efficiency shown in grey). The system starts in a closed state, undergoes initiation and opening of the plug (indicated by a red star below the trace), which remains open during translocation (green dashed line under the trace). After translocation is finished, the plug snaps back (blue star) to seal the pore and the system remains in the closed state (black dashed line) until another round of translocation or one of the dyes photobleaches (magenta arrow). Note that duration of the translocation events varies and reflects the stochastic nature of the process. (G) TIRF data histogram (300 events) collected during translocation of proOmpA 100 aa under steady state, multiple turnover conditions as seen in panel F above. Fitting to two Gaussians is depicted as in the panel E.
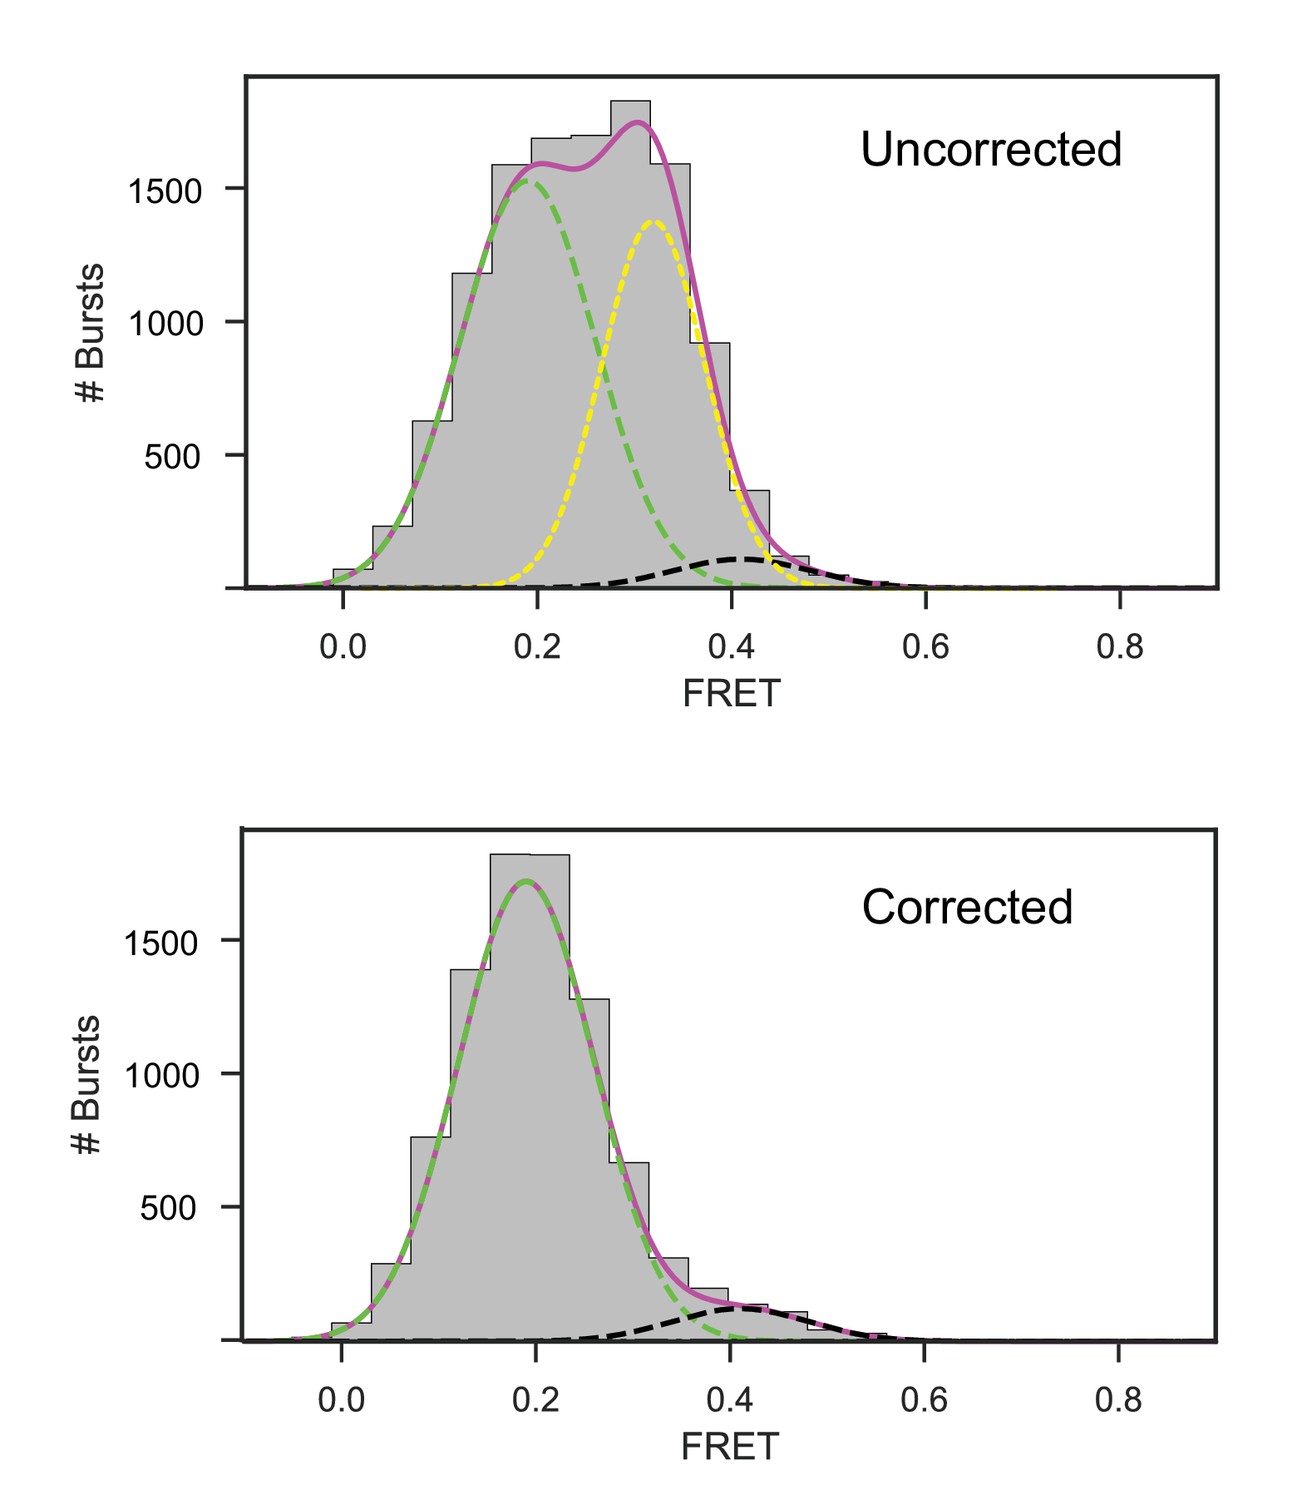
Figure 2—figure supplement 1
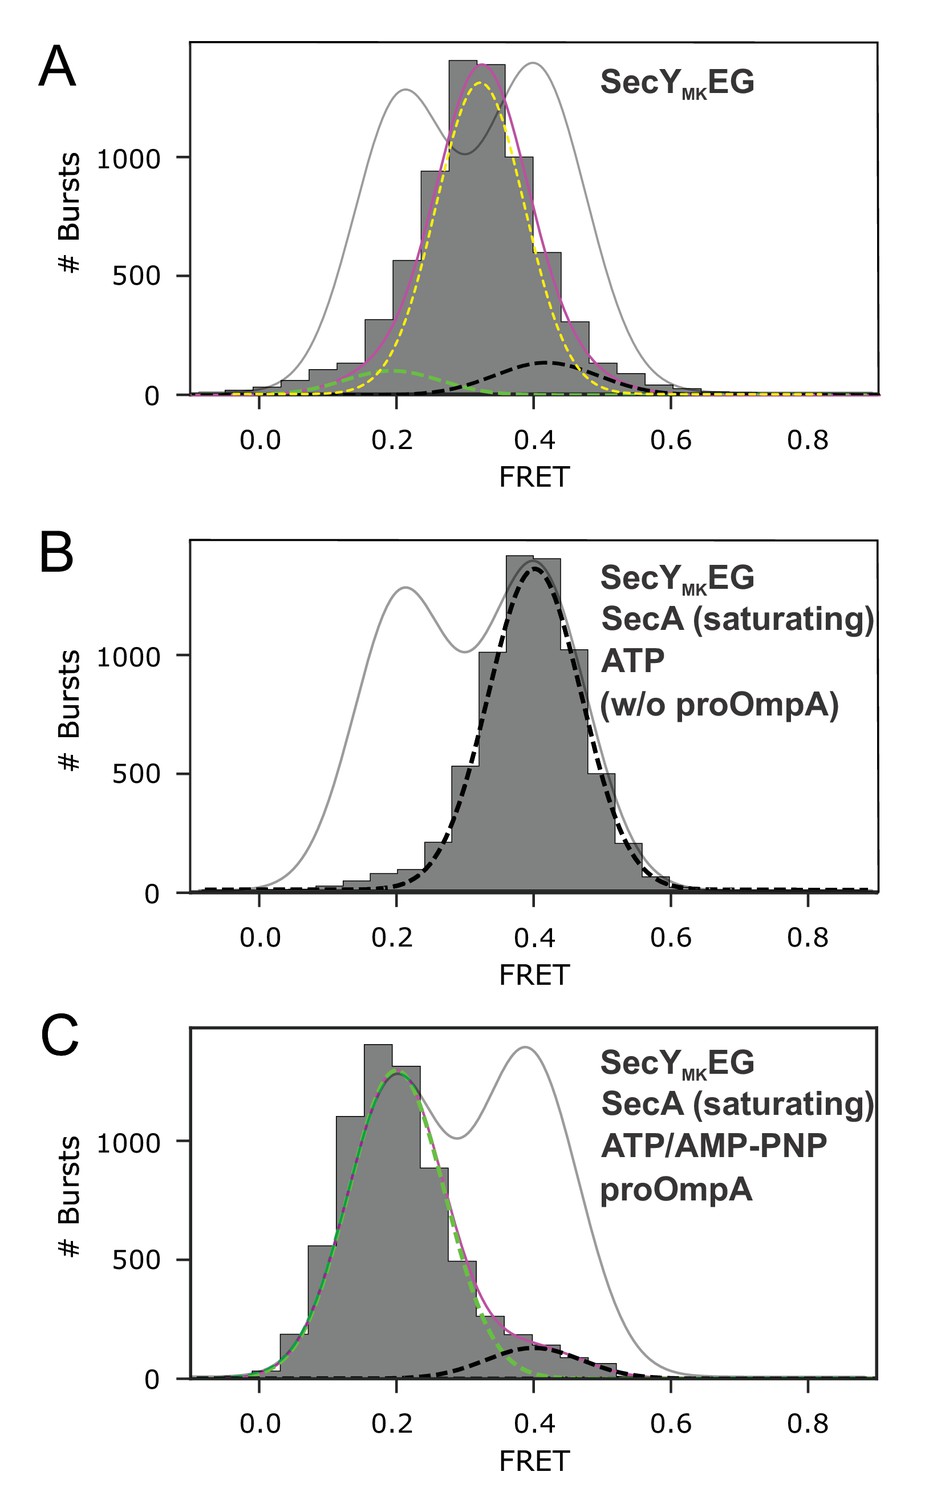
1D FRET efficiency histograms for controls.
(A) SecYMKEG alone. All data were collected using the confocal setup and histograms are fitted to a sum (solid magenta) of three Gaussians (dashed lines), of which the two minor contributions (dashed green and black lines) had the positions and widths fixed to the values obtained for the closed and open distributions in panels B and C, respectively. A part open state component is shown as dashed yellow. The fit from Figure 2, panel E is shown for reference (grey solid line). (B) SecYMKEG:SecA in 2 mM ATP. The histogram was corrected for contribution from the 50% SecYMKEG in opposite orientation which is unable to bind SecA (unresponsive population), that is by subtracting appropriately scaled histogram shown in Panel A from the data (see Figure 2—figure supplement 2). A black dashed line represents a fit to a single Gaussian corresponding to the closed state. The fit from Figure 2, panel E is shown for reference (grey solid line). (C) Open state trapped by addition of 5 mM AMP-PNP to translocating SecYMKEG:SecA:SecB:pOA:ATP. Corrected for the contribution from the unresponsive population of SecYMKEG (see Figure 2—figure supplement 2). A green dashed line represents a fit to a single Gaussian corresponding to the open state. A black dashed line represents a fit to a single Gaussian corresponding to the closed state. Solid magenta line represents the sum of the two fitted Gaussians. The fit from Figure 2, panel E is shown for reference (grey solid line).
Figure 2—figure supplement 2
Correction of 1D FRET efficiency histograms for unresponsive population of SecYMKEG in opposite orientation.
FRET distributions from confocal experiment were corrected for contribution from the 50% SecYMKEG in opposite orientation by subtracting appropriately scaled FRET distribution of SecYMKEG alone (Figure 2—figure supplement 1A). Top panel shows the raw histogram for the open trapped configuration prior to the subtraction of the SecYMKEG alone data. The bottom panel shows the subtraction result. Green dashed line depicts Gaussian fit with the centre fixed at the value representing the open state, black dashed line depicts the closed state envelope, yellow dashed line shows Gaussian corresponding to SecYMKEG alone, magenta envelope is the sum of all contributing Gaussians.
Figure 2—figure supplement 3
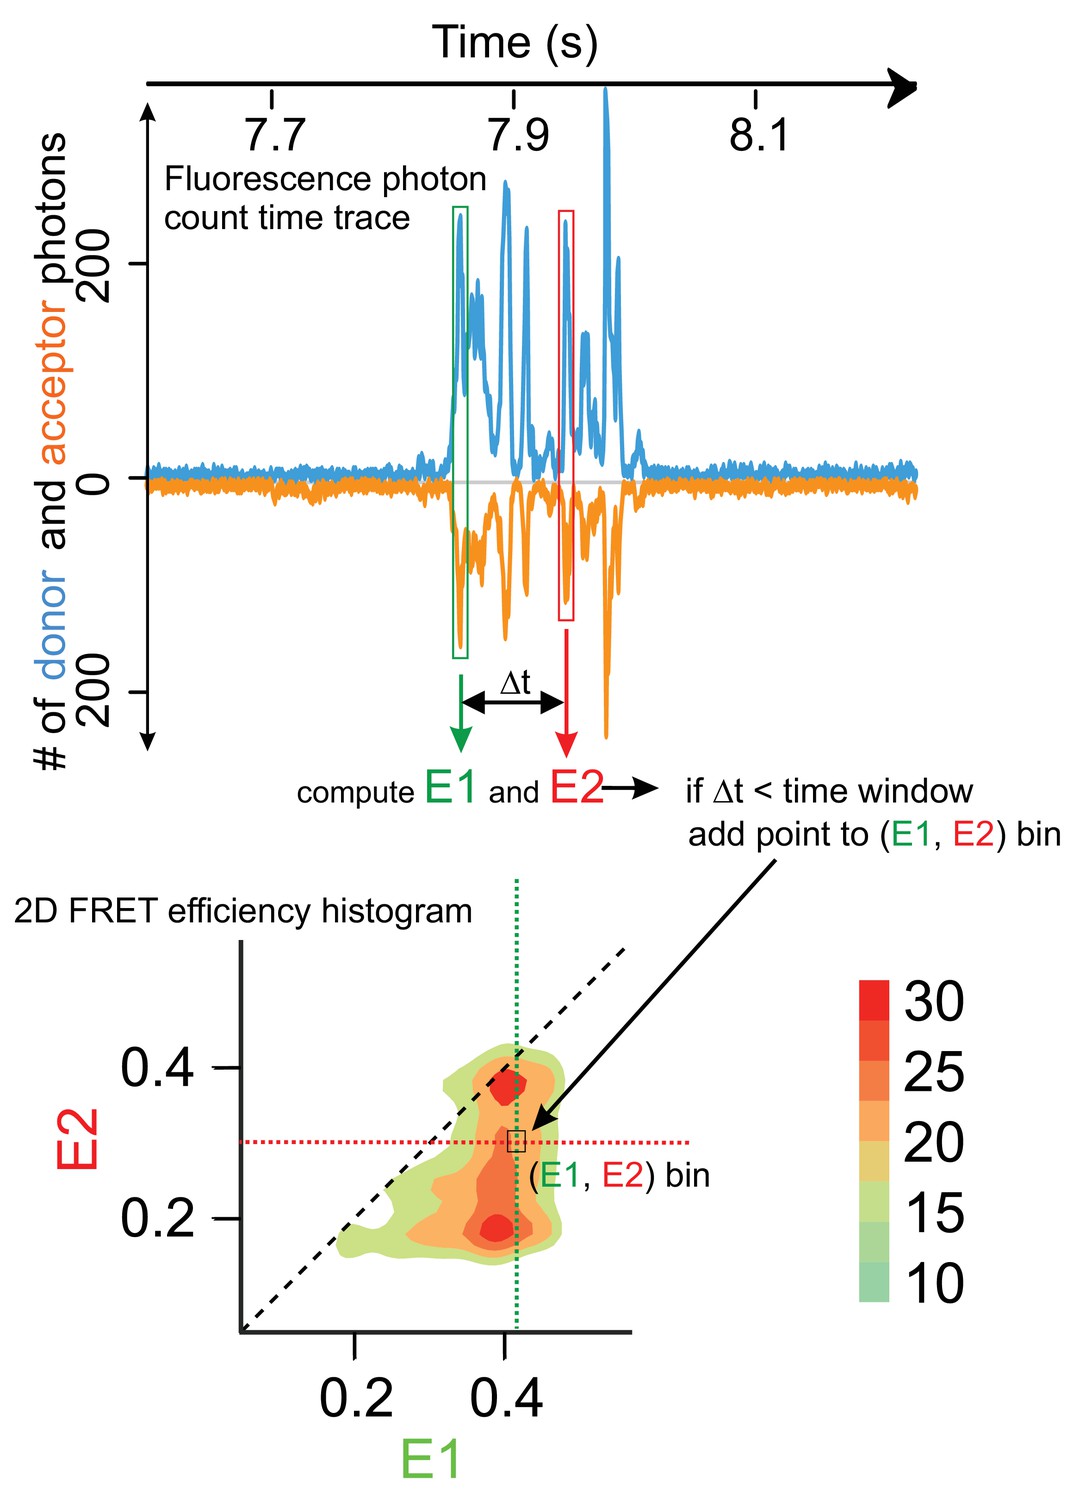
RASP workflow describing how to obtain two-dimensional FRET efficiency histograms and transition density plots from fluorescence bursts.
The top panel depicts a time trace of fluorescence counts with one train of recurring bursts belonging to the same vesicle. For detecting transitions within a set time window (e.g. 50 ms), an initial burst is selected (green box) and the corresponding initial FRET efficiency is calculated from the donor and acceptor photon counts (E1). Another burst is then identified at a time delay Δt (red box) within the set time window (e.g. Δt < 50 ms and belonging to the same burst train) and the final E2 value is computed. A point is added to the bin at the coordinate (E1, E2) in a two-dimensional histogram (lower panel). Since the same molecule (vesicle) is being observed the point essentially represents a trajectory from E1 state to E2 state within the time Δt. This is repeated for all combination of identifiable pairs of bursts within the same train and with time delays falling into the set window and then also for separate trains and the resulting (E1, E2) pairs are collated in the two-dimensional histogram. When enough points are within the histogram, it may be converted into contour plots (colour-coded heat maps) which essentially represent transition probability densities (colour scale bar on the right hand side) for the change from FRET state E1 to E2.
Figure 3 with 5 supplements
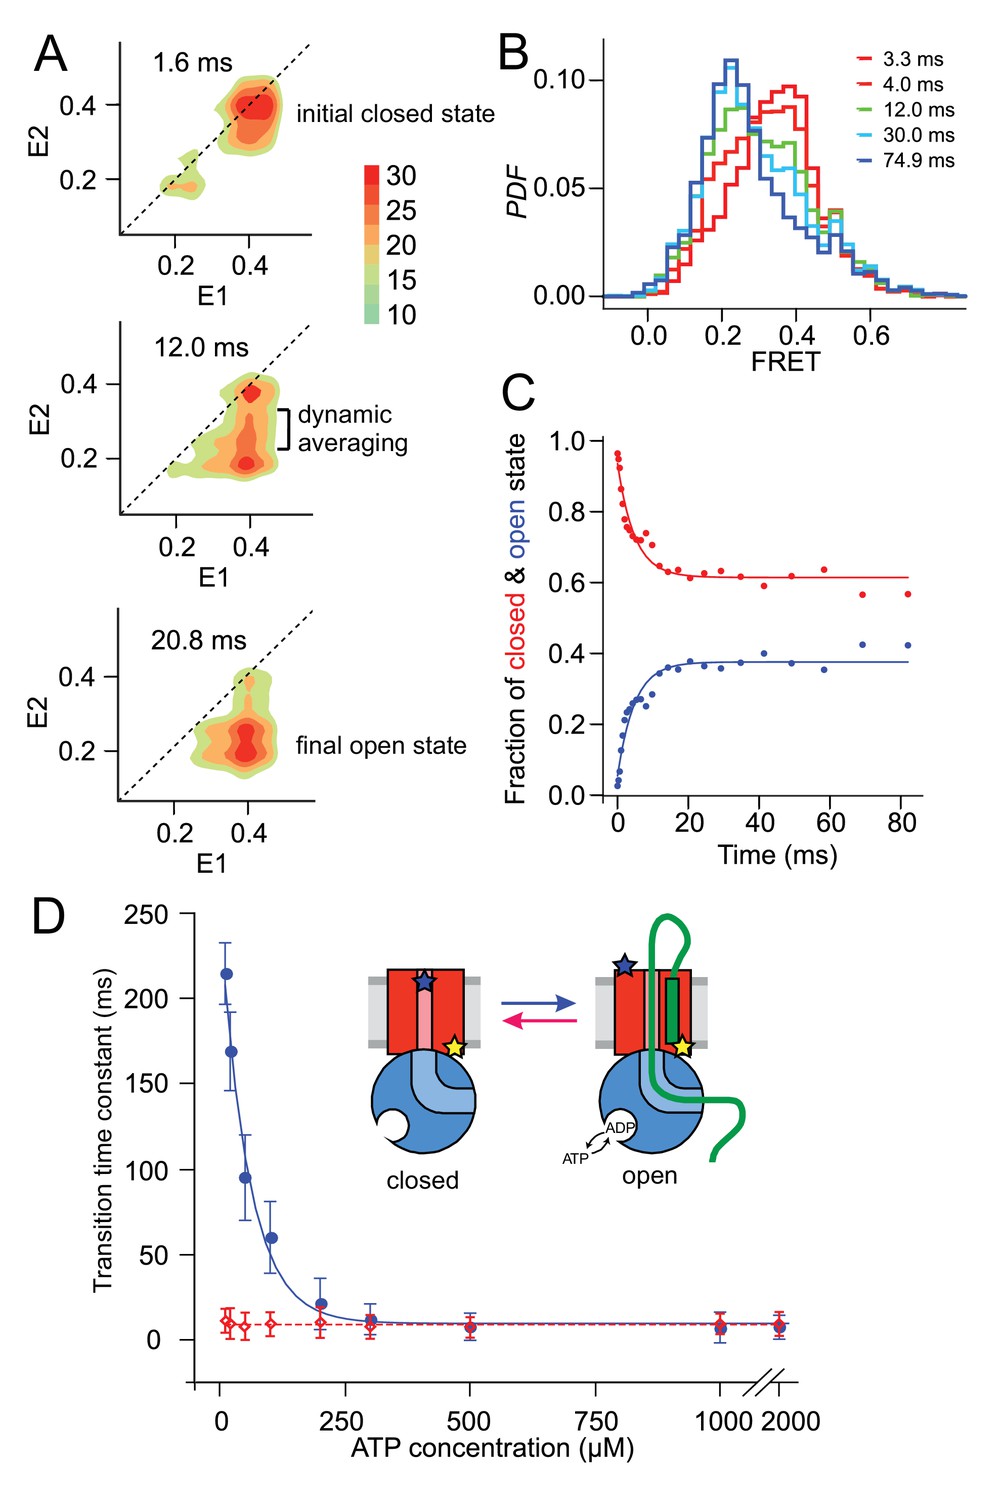
Monitoring fast plug movement during initiation.
(A) Two-dimensional FRET efficiency contour plots (transition density plots) were obtained from bursts collected for SecYMKEG:SecA:SecB:pOA (proOmpA 100 aa) in the presence of 0.1 mM ATP using the confocal setup. The events were classified according to initial FRET (E1) and the burst recurrence FRET (E2) observed after the indicated time delay. Data shown as Probability Density Function (PDF) contour plots with scale on the right. (B) RASP analysis was performed with the initial state interval of 3.9 to 4.1. The RASP PDF shows a rapid decreasing closed state population (red) and concomitantly increasing open state population (blue). Time in these RASP histograms is colour coded according to the legend within the panel. (C) Opening (blue) and closing (red) kinetic profiles extracted by a two-state approximation to the data in B). Solid lines represent least square exponential fitting of the data. (D) ATP concentration dependence of the opening (blue) and closing (red) transition time constants. Open and closed state interconversion is shown schematically in the centre.
Figure 3—figure supplement 1
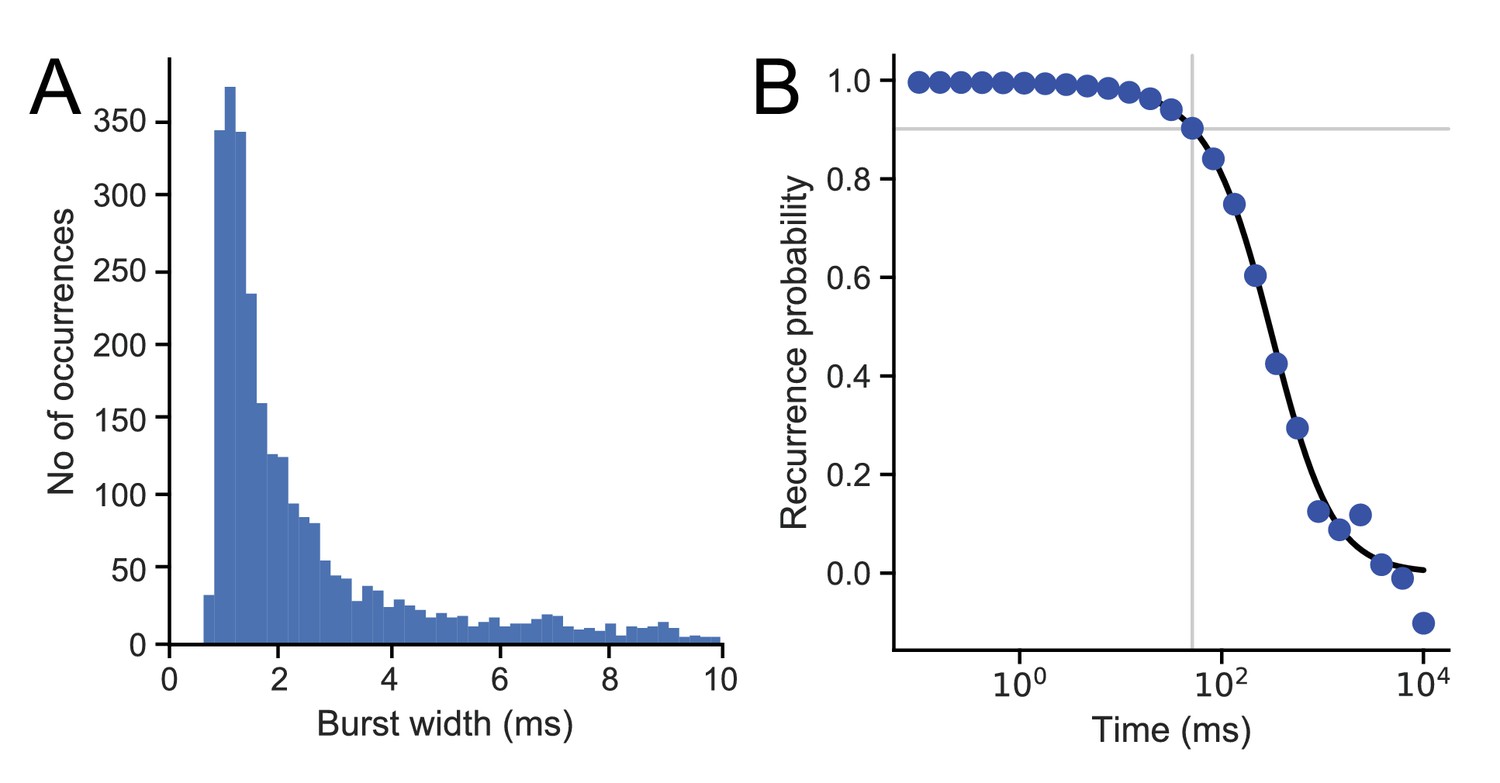
Burst duration and recurrence probability.
(A) Burst width distribution for diffusing proteoliposomes. (B) Recurrence probability was obtained from data in (A) as described in Materials and methods. The recurrence time of 80 ms, corresponding to the 0.9 probability level (grey horizontal line), is indicated by a grey vertical line.
Figure 3—figure supplement 2
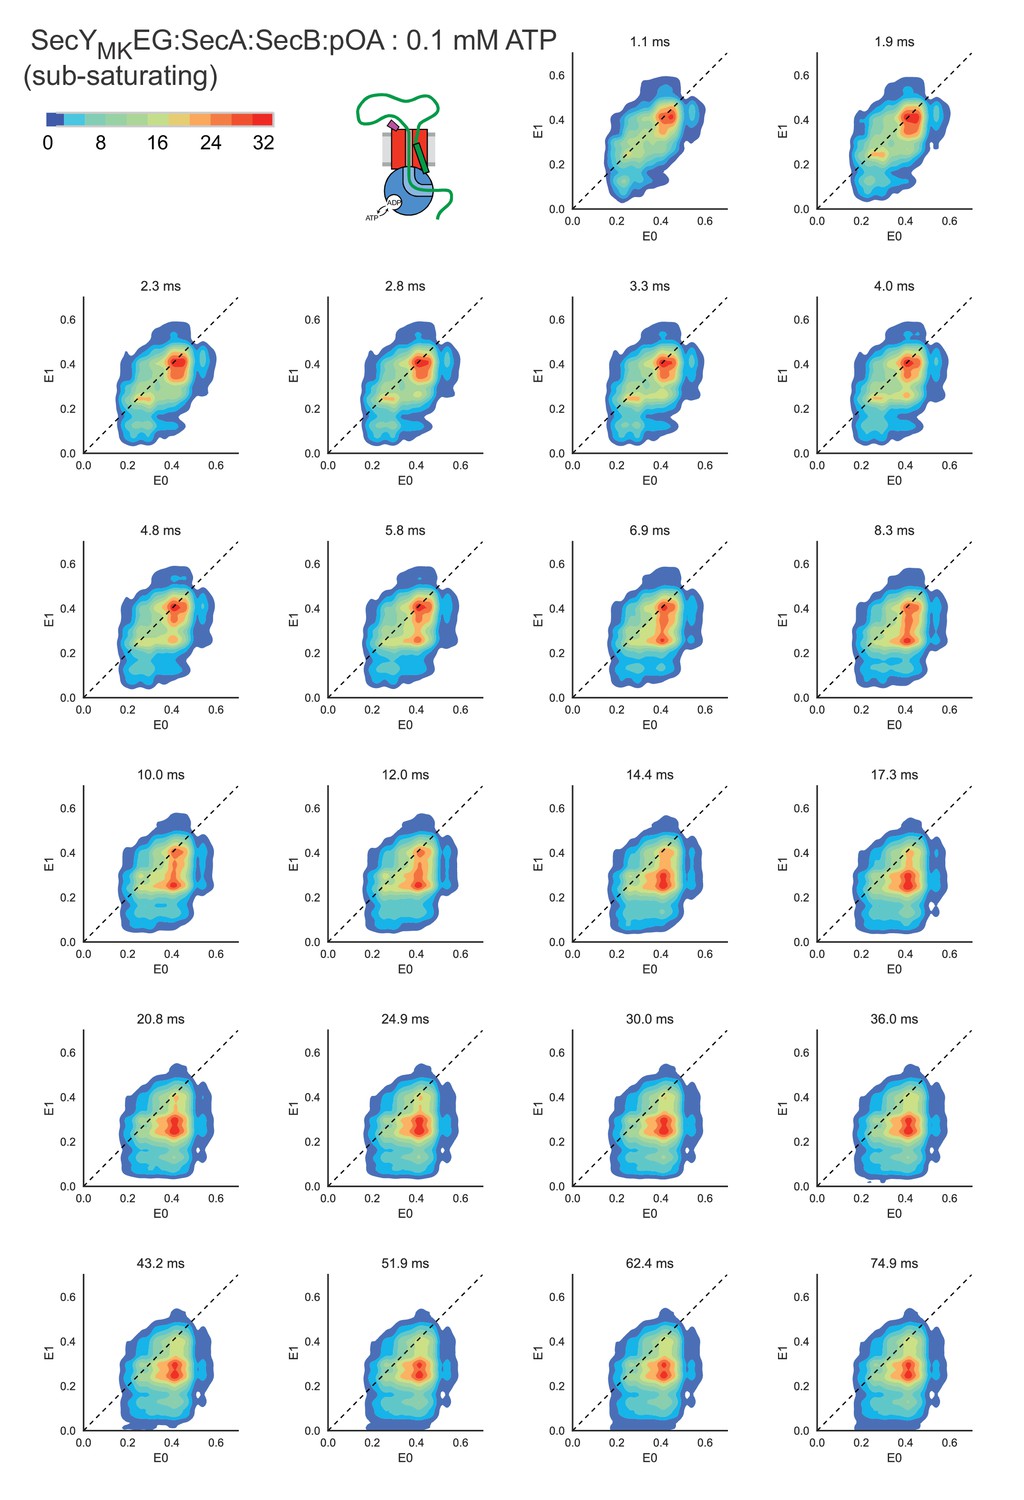
Two-dimensional transition density plots.
A detailed sampling of time resolved transition density plots shown in Figure 3A for SecYMKEG:SecA:SecB:pOA (proOmpA 100 aa) in the presence of 0.1 mM ATP. Note a wider scale (count contour level bar in upper left corner) was used compared with Figure 3A. An animation is shown in Video 1 online.
Figure 3—figure supplement 3

Spontaneous opening and closing in the absence of translocation substrate.
Opening (blue) and closing (red) transition times as a function of ATP concentration for SecYMKEG:SecA:SecB in the presence of 1 mM ATP (no proOmpA). Neither opening (average 24.3 ± 5.2 ms) nor closing (average 10.9 ± 4.4 ms) are ATP dependent. Large errors (s.d.) are due to low number of spontaneous opening events under these conditions.
Figure 3—figure supplement 4
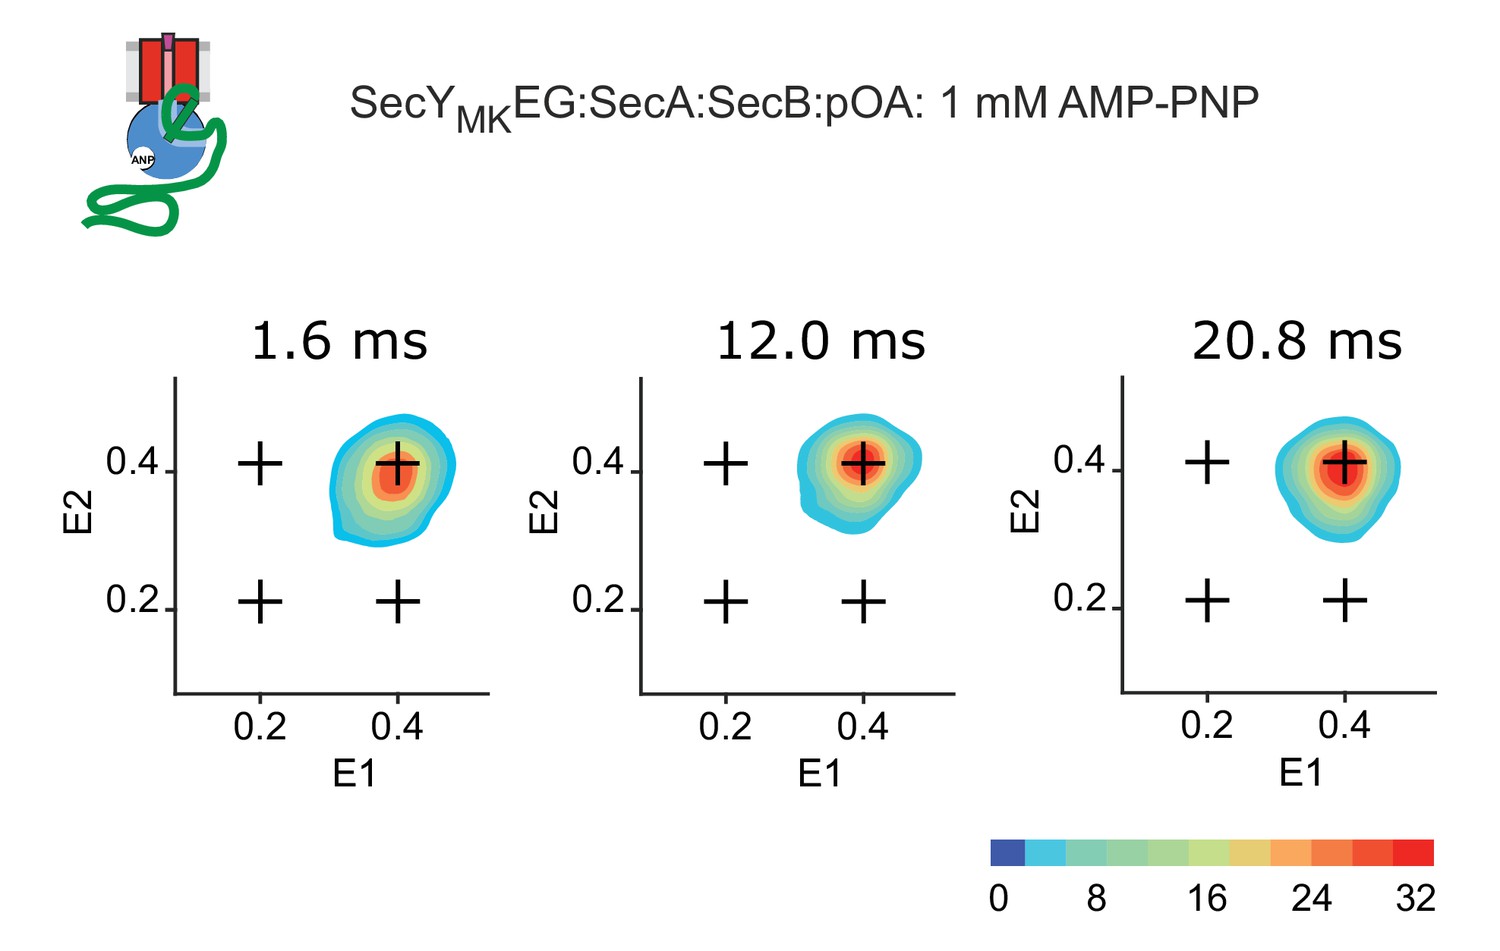
RASP derived two-dimensional transition density plots in the presence of AMP-PNP.
Time evolution of states for SecYMKEG:SecA:SecB:pOA (proOmpA 100 aa) in the presence of 1 mM AMP-PNP. RASP time window is indicated in each panel. The scale bar on the lower right depicts count contour levels.
Figure 3—figure supplement 5
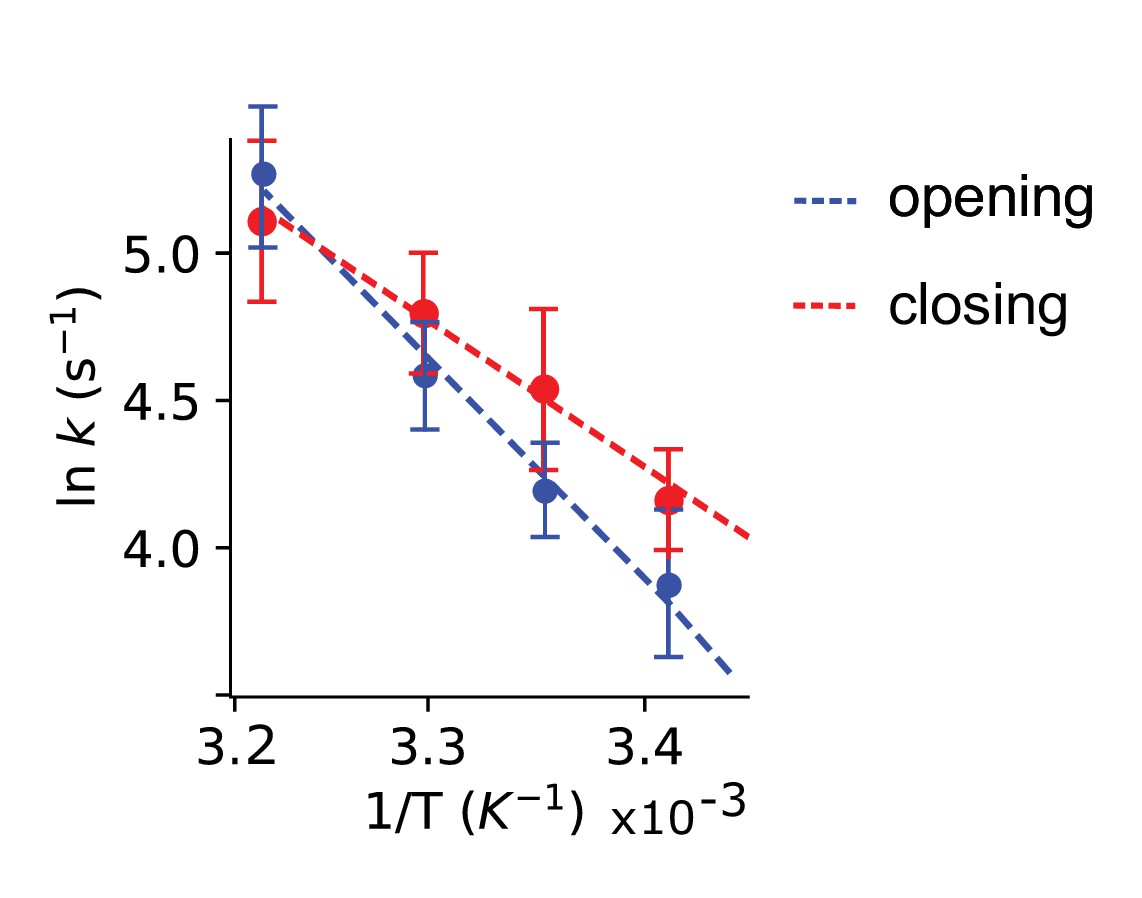
Activation energies for plug opening and closing.
Arrhenius plot of reciprocal transition times (rate constants) for the plug opening (blue) and closing (red) under saturating 2 mM ATP concentration. Activation energy of 61.2 ± 4.5 kJ/mol for opening was obtained from the slope of a linear approximation (blue dashed line). The activation energy for plug closing is 45.1 ± 3.7 kJ/mol (red dashed line).
Figure 4 with 2 supplements
Two-dimensional FRET efficiency histograms detect transitions between states.
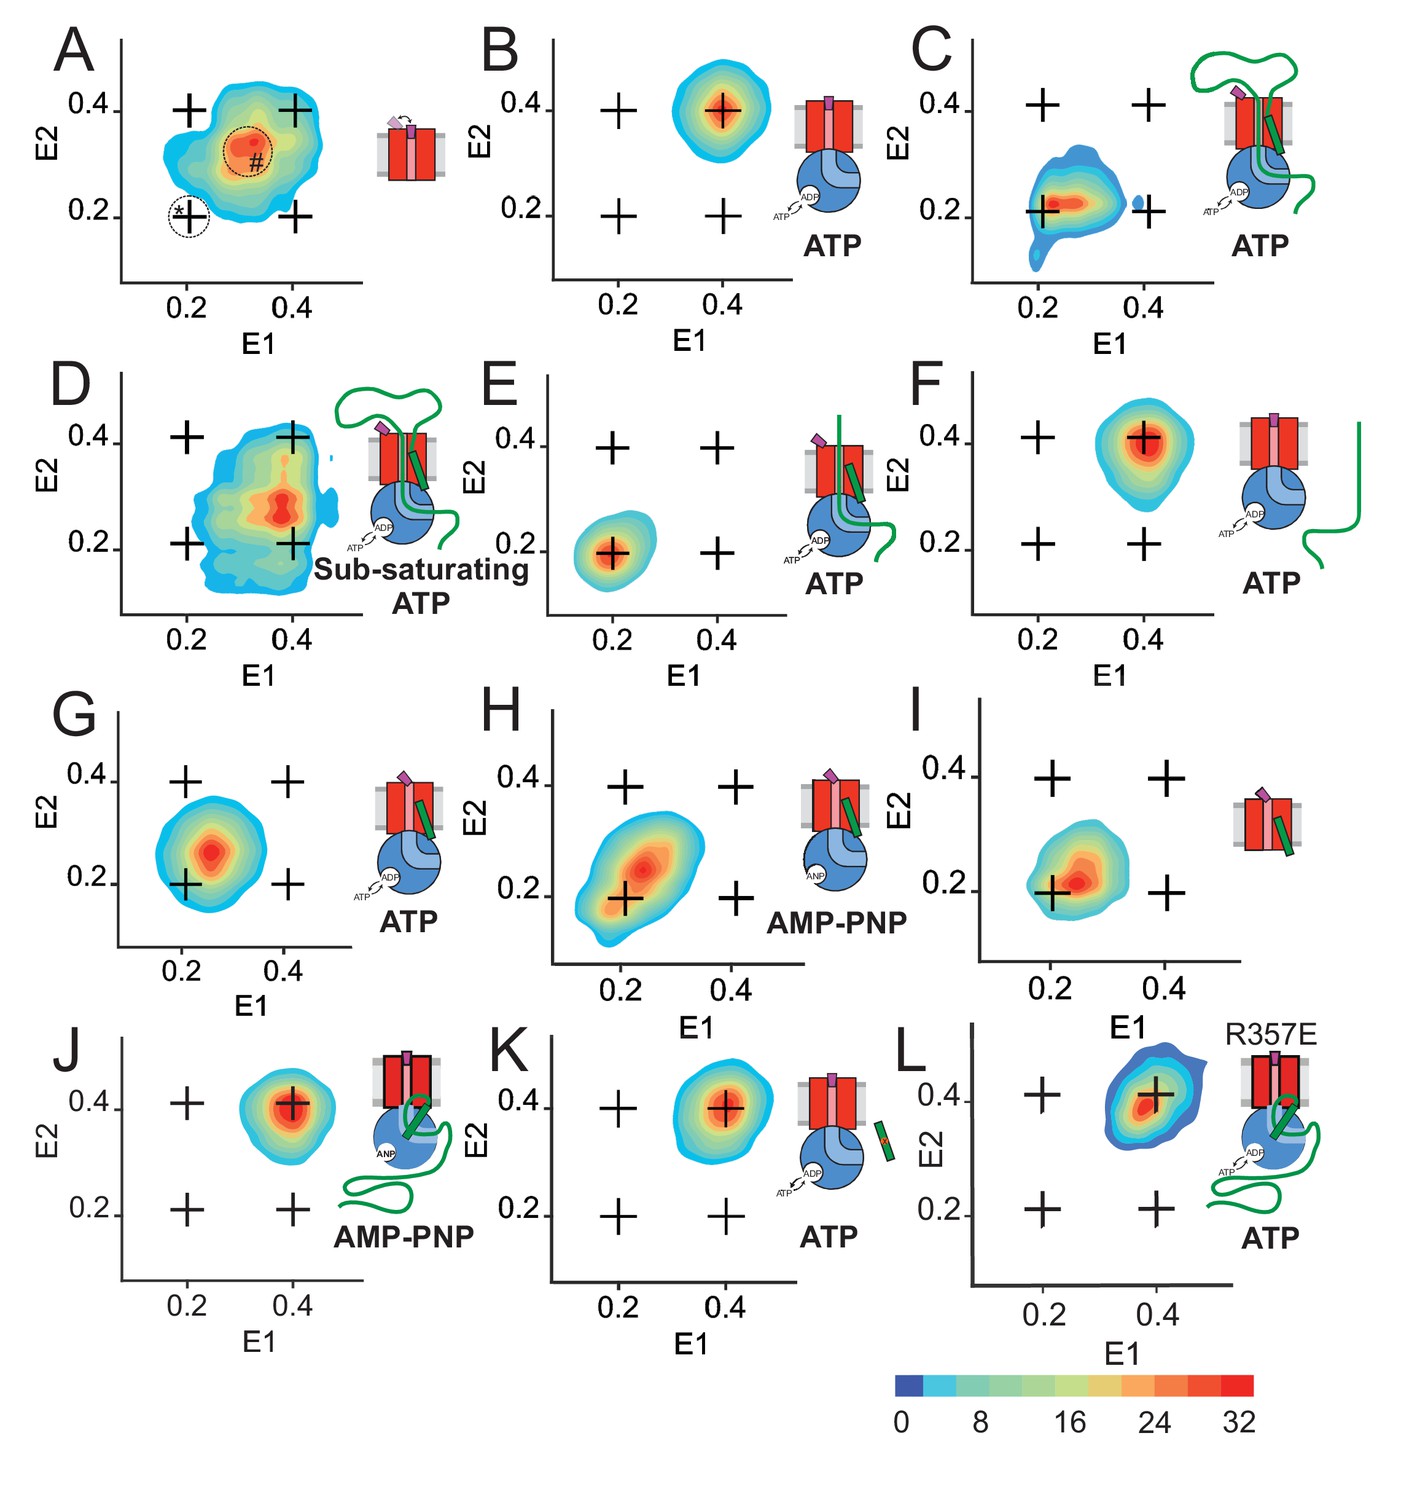
(A) SecYMKEG alone. Transition density for delays up to 21 ms were obtained from RASP analysis of 10,000 events. In all panels, the crosshair symbols indicate positions of the open and closed state FRET values within the E1-E2 plot. A scale bar for count contour levels is shown in the lower right corner. A cartoon in each panel schematically depicts the composition of the SecYEG complex and reaction conditions. In panel A, the positions of stably open state and the stationary part-open state are circled and marked with * and #, respectively. (B) SecYMKEG:SecA in the presence of 1 mM ATP. (C) SecYMKEG:SecA:SecB:pOA in the presence of 1 mM ATP. (D) SecYMKEG:SecA:SecB:pOA in the presence of 0.1 mM ATP (sub-saturating condition). (E) SecYMKEG:SecA:SecB:OmpA (lacking SS) in the presence of SS peptide added in trans and 1 mM ATP. (F) SecYMKEG:SecA:SecB:OmpA in the presence of 1 mM ATP. (G) SecYMKEG:SecA:SecB in the presence of SS peptide and 1 mM ATP. (H) SecYMKEG:SecA:SecB in the presence of SS peptide and 1 mM AMP-PNP (depicted as ANP in the cartoon). (I) SecYMKEG in the presence of SS. (J) SecYMKEG:SecA:SecB:pOA in the presence of 1 mM AMP-PNP (ANP in the cartoon). (K) SecYMKEG:SecA:SecB in the presence of defective (four residue deletion) SS peptide and 1 mM ATP. (L) SecYMK,R357EEG:SecA:SecB:pOA in the presence of 1 mM ATP.
Figure 4—figure supplement 1
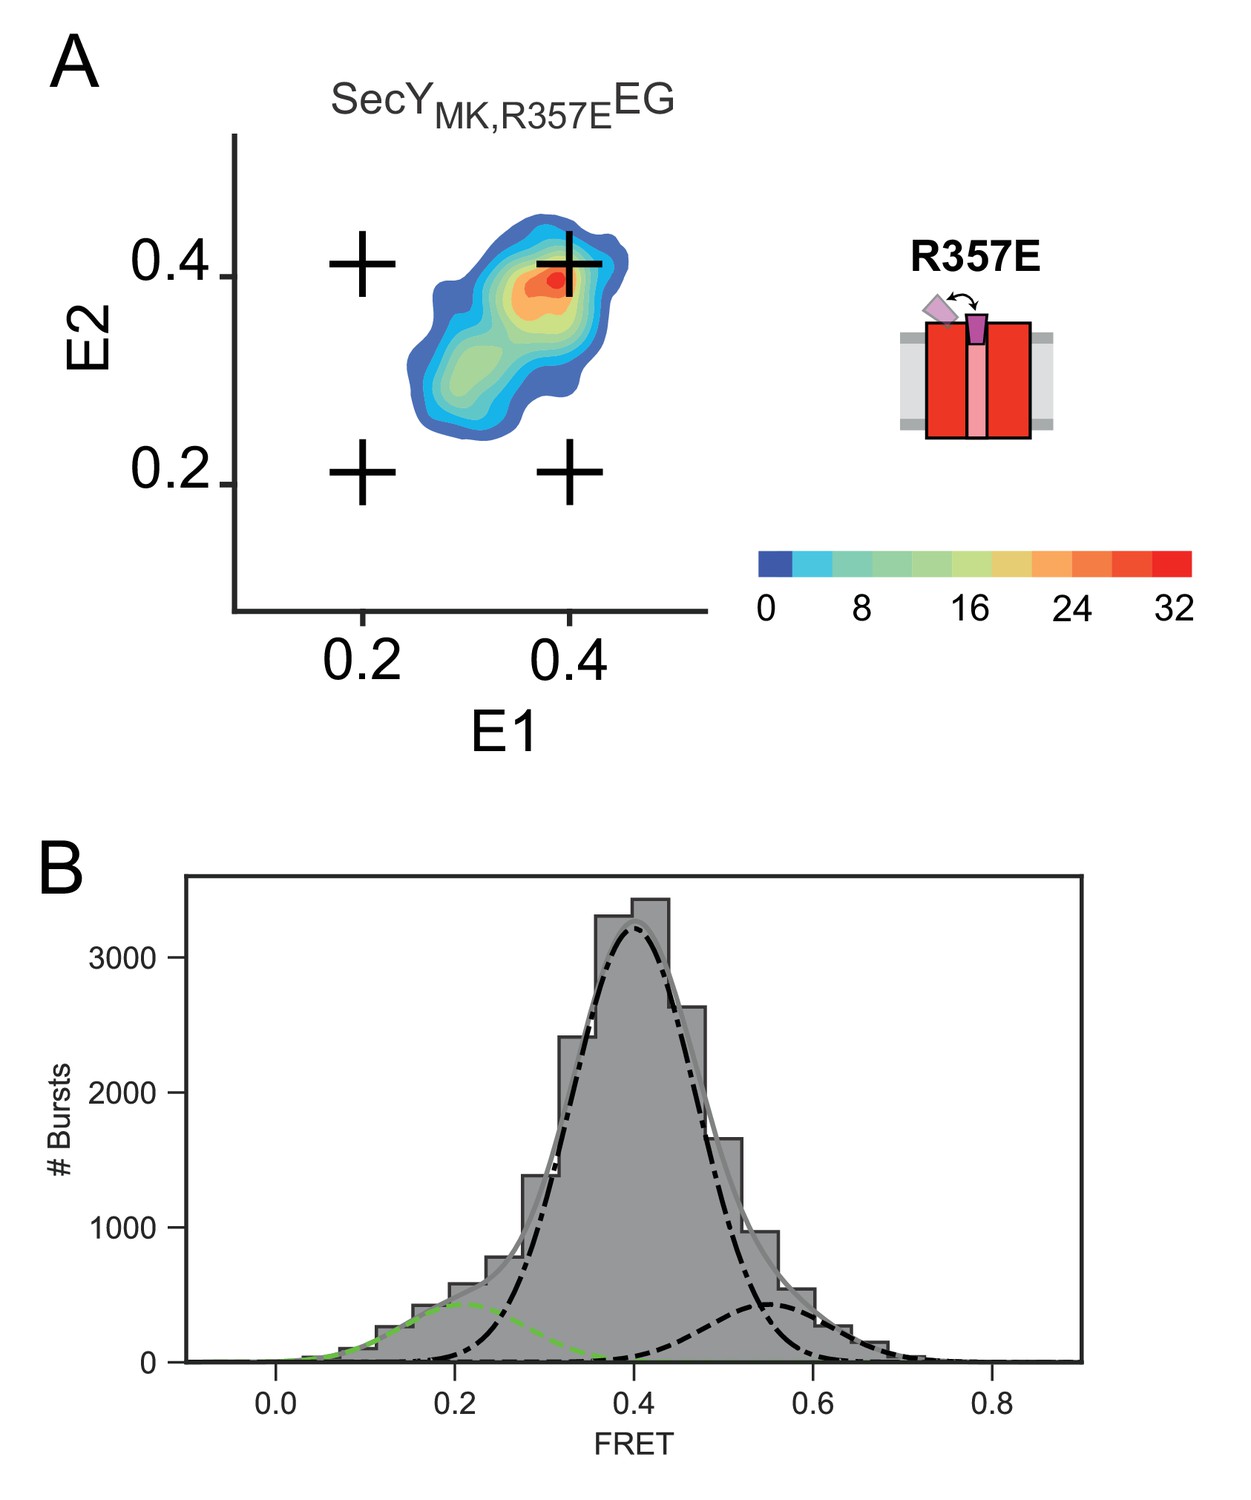
FRET characterization of SecYMK, R357EEG ‘closed’ plug mutant.
(A) Two-dimensional FRET efficiency histograms for SecYMK,R357EEG alone. Transition density for delays up to 21 ms were obtained from RASP analysis of 10,000 events. In all panels, the crosshair symbols indicate positions of the open and closed state FRET values within the E1-E2 plot. A scale bar for count contour levels is shown in lower right corner, with a schematic of the SecYEG mutant alongside. (B) Steady state FRET efficiency histogram for SecYMK, R357EEG alone decomposed into open (0.2 - green dashed) and closed (0.4 – black dash dot and 0.6 – black dashed) contributions. Grey solid line depicts the sum of the fitted components.
Figure 4—figure supplement 2
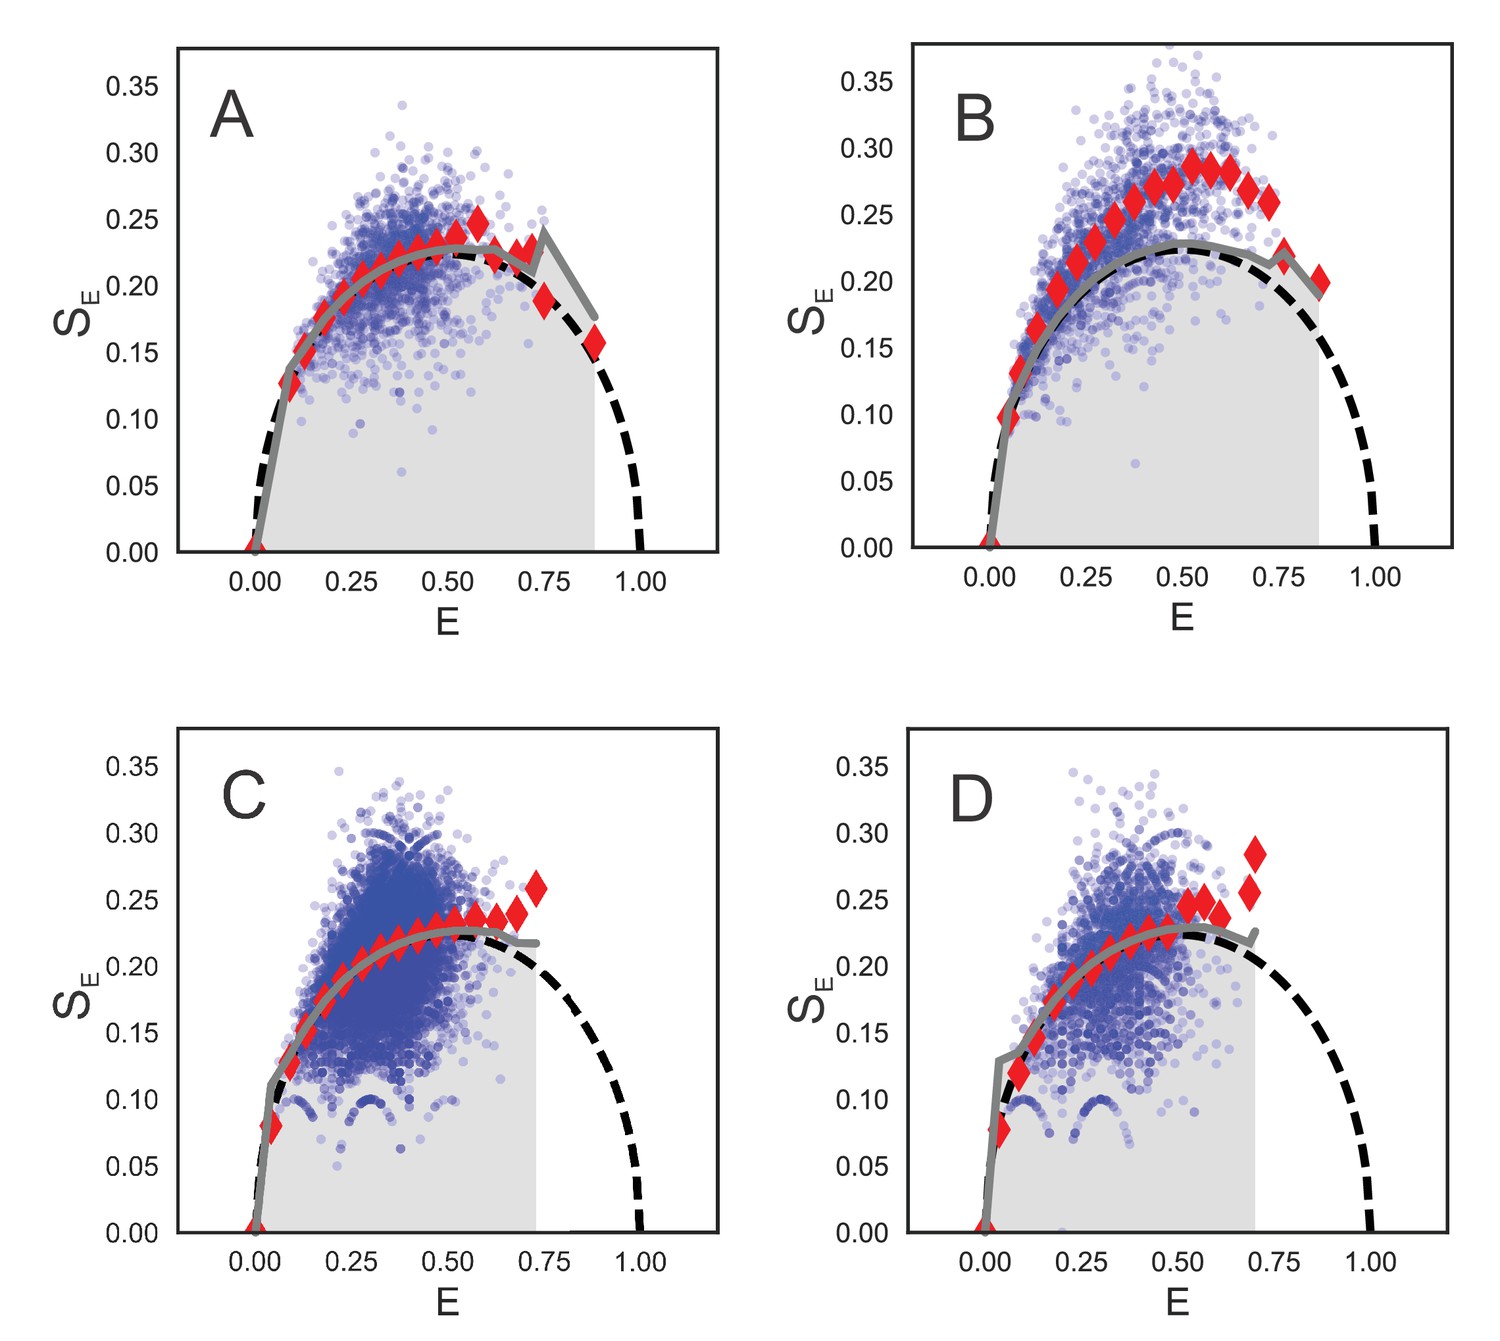
Burst variance analysis for selected states.
BVA can discriminate between static and dynamic heterogeneity. Blue dots show measured standard deviations (SE) for all individual bursts. Due to statistical nature of these estimates, the variance values were averaged for bursts within a narrow range of E values (red diamonds) and compared with the expected (shot noise limited) standard deviation as a function of FRET efficiency (black dashed line). The average values significantly above the expected value indicate dynamics on a timescale faster than the duration of the bursts (few milliseconds). The grey lines correspond to strict confidence intervals (cfi = 99%) and indicate that E values with variance (red diamonds) within this confidence interval represent static FRET while those above the confidence interval reflect underlying dynamics. (A) SecYMKEG: SecA in the presence of 1 mM ATP. (B) SecYMKEG: SecA:pOA (proOmpA 100 aa) in the presence of 1 mM ATP. (C) SecYMKEG: SecA in the presence of SS and 1 mM AMP-PNP. (D) SecYMKEG in the presence of SS.
Figure 5 with 4 supplements
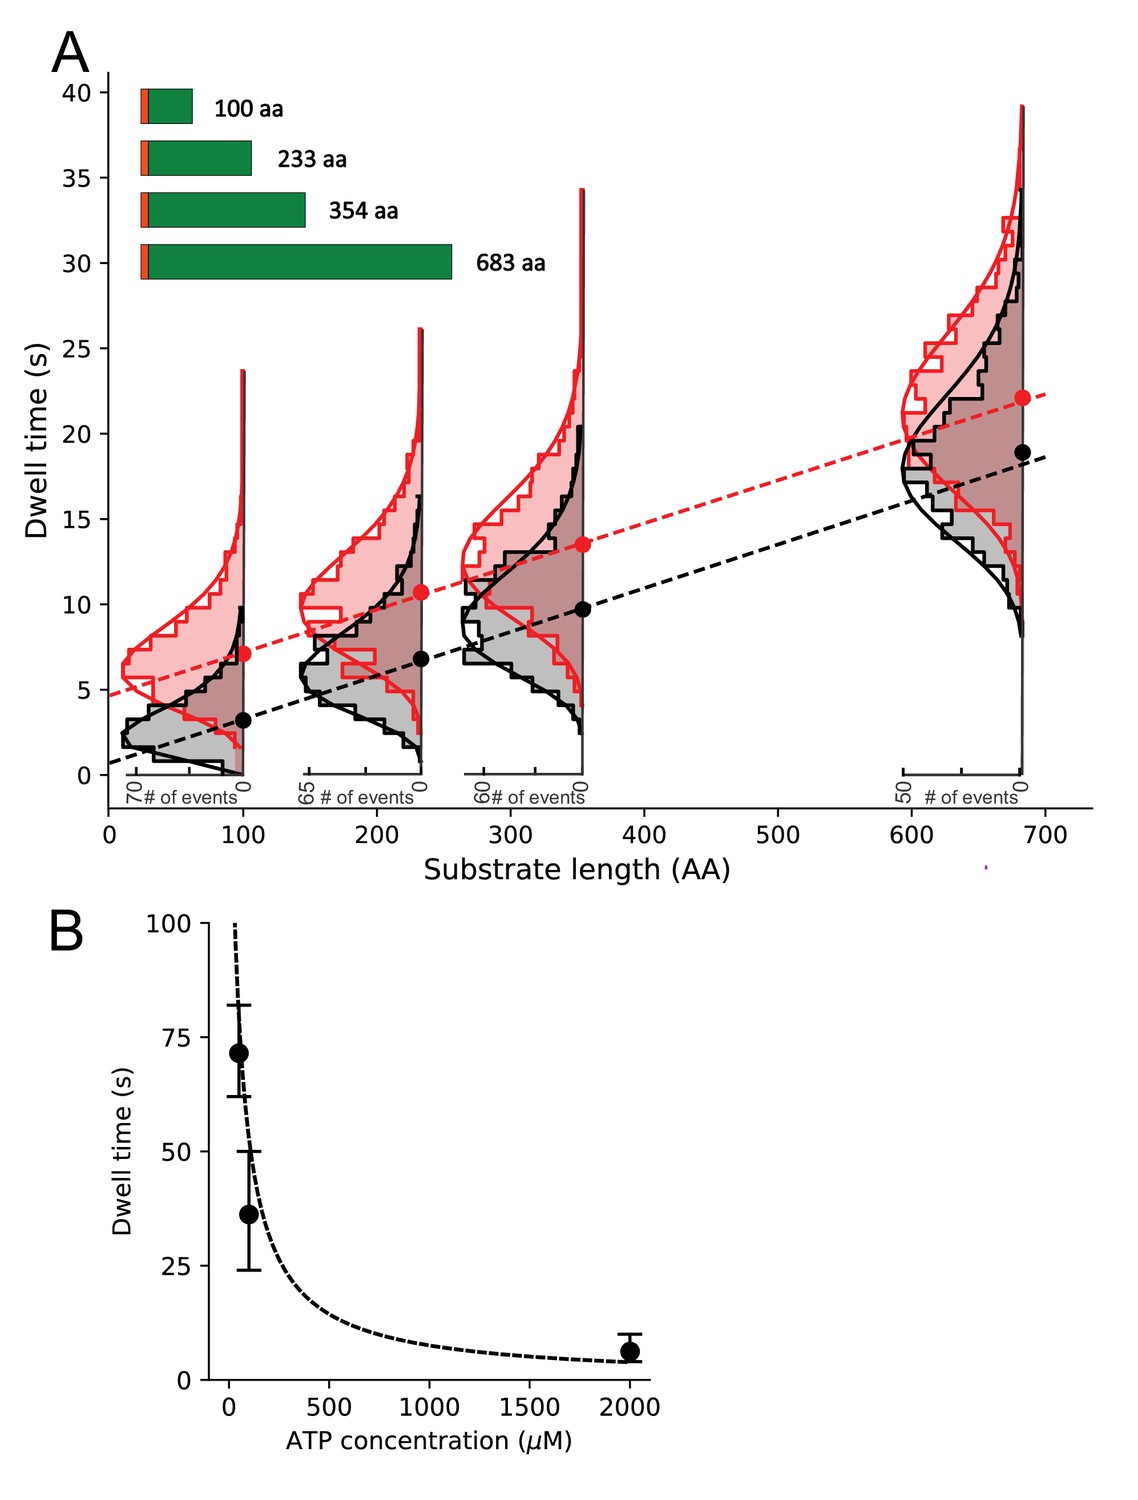
Substrate length dependence of dwell times and determination of translocation rates.
(A) Dwell time dependence for open state (EFRET ~0.2) on the substrate length (schematically shown in the inset, SS depicted as orange bar) in the presence (black) or absence (red) of SecB. Ordinary least squares (OLS) linear regression (dashed lines) on all photobleaching corrected dwell times (see Figure 5—figure supplement 3 for comparison of uncorrected and corrected dwell time distributions) gave slopes corresponding to translocation rates of 39.6 ± 6.0 aa/s (±standard error) in the absence of SecB and 39.0 ± 6.2 aa/s in the presence of SecB. OLS analysis of the sample with SecB resulted in an intercept close to zero (0.5 ± 0.3 s) while in the absence of SecB the intercept is approximately 5 s (4.7 ± 0.3 s). Overlaid are photobleaching corrected dwell time histograms with gamma function fits (solid lines). Only the distributions for the longest substrate were significantly affected by photobleaching (see Figure 5—figure supplement 3 for comparison and Materials and methods for description of the deconvolution correction). (B) Average open state dwell time dependence on ATP concentration for the shortest 100 aa proOmpA substrate in the presence of SecB. Error bars were derived from the distributions of dwell times. The dashed line represents a steady state model with KM fixed at 50 μM and an amplitude scaled to the data (note that photobleaching precluded collection of more data at low ATP concentrations and thus a statistically sound fit to the data could not be performed).
Figure 5—figure supplement 1
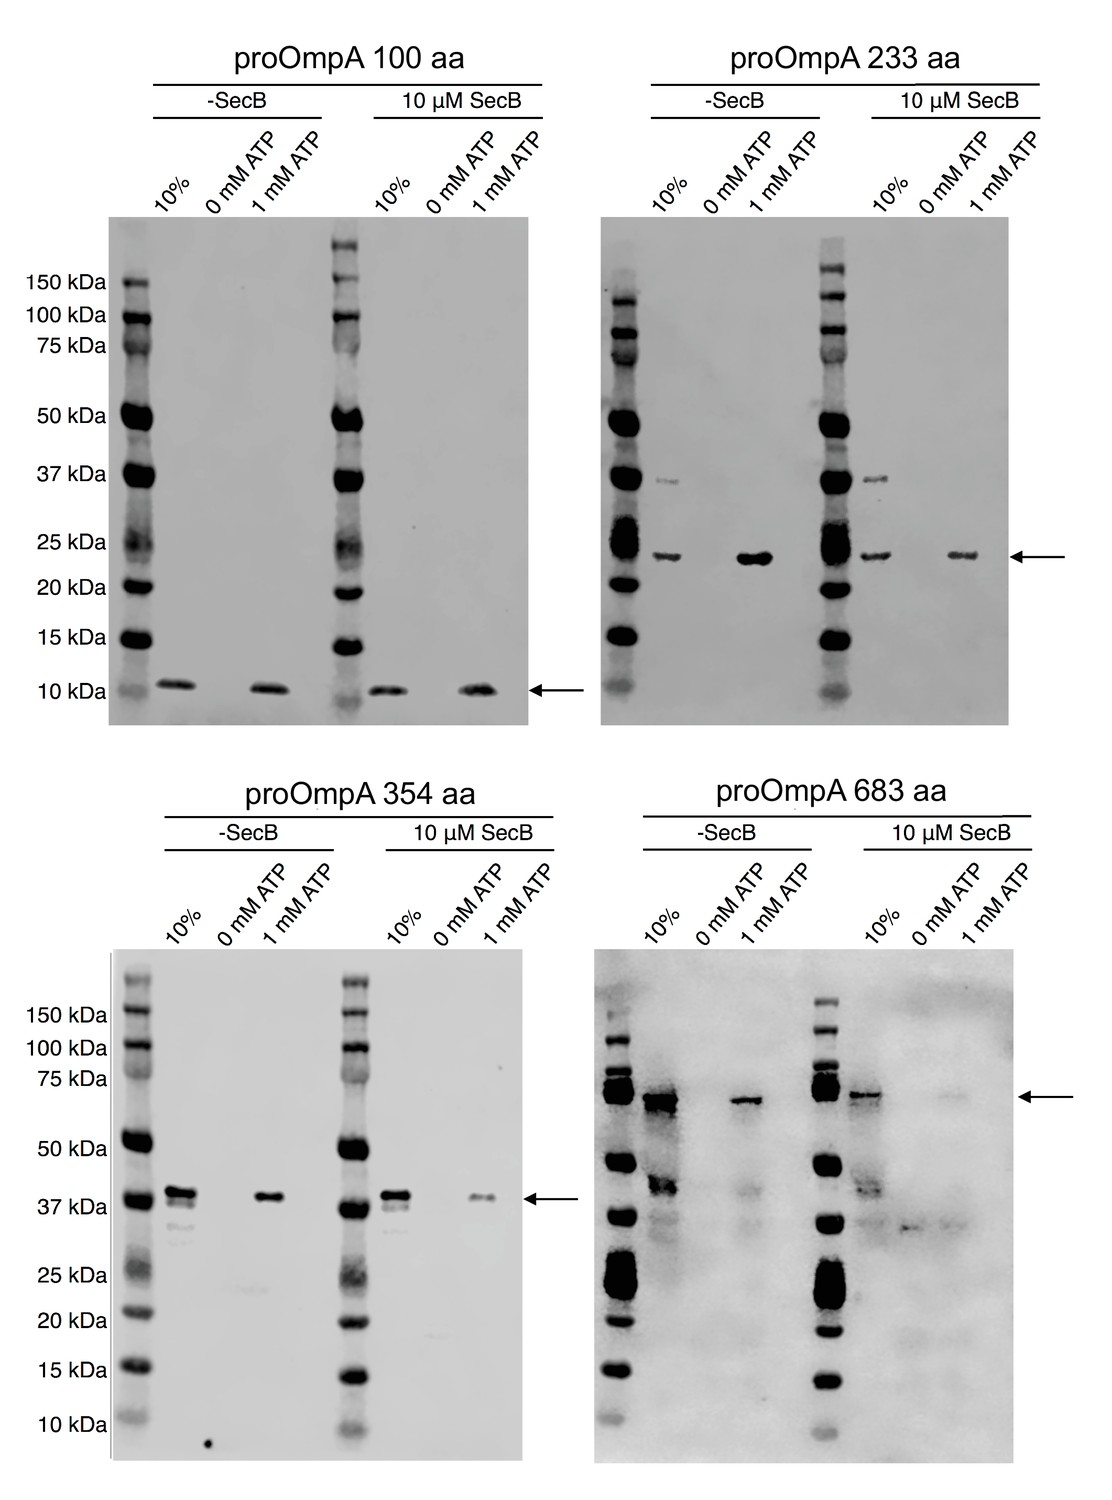
Translocation of proOmpA constructs with different lengths.
Reactions were performed in the presence or absence of SecB. Gel lane: 10% of starting proOmpA loaded without protease treatment (positive and normalization control); control without ATP, translocation mix with 1 mM ATP. Black arrows indicate the expected position of the translocated substrate.
Figure 5—figure supplement 2
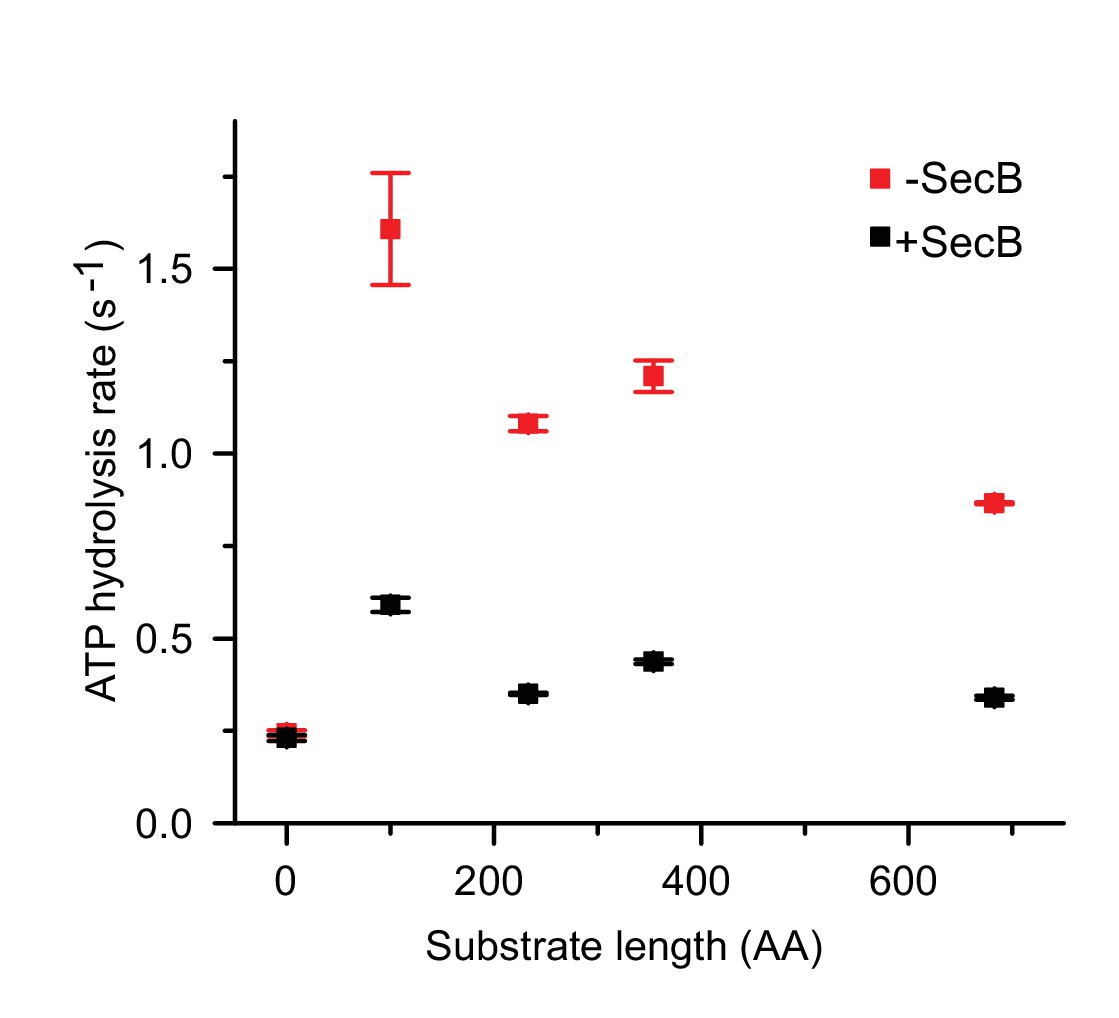
Ensemble ATPase activity stimulated by proOmpA constructs with different lengths.
Ensemble ATPase activity stimulated by proOmpA constructs with different length in the presence (black) or absence (red) of SecB (10 µM). The rates were obtained under saturating ATP/proOmpA conditions. The zero-length substrate represents basal ATP hydrolysis activity by SecA alone. Standard deviations (error bars) were estimated from three independent experiments. Note that SecB seems to decrease the translocation efficiency of longer substrates. One plausible explanation is that SecB competes with SecA and sequesters longer pOA in ensemble translocation assays while at the same time assisting in unfolding of a smaller portion of SecYEG:SecA bound proOmpA, and thus accelerating the initial phase in the single molecule assays presented in Figure 5.
Figure 5—figure supplement 3
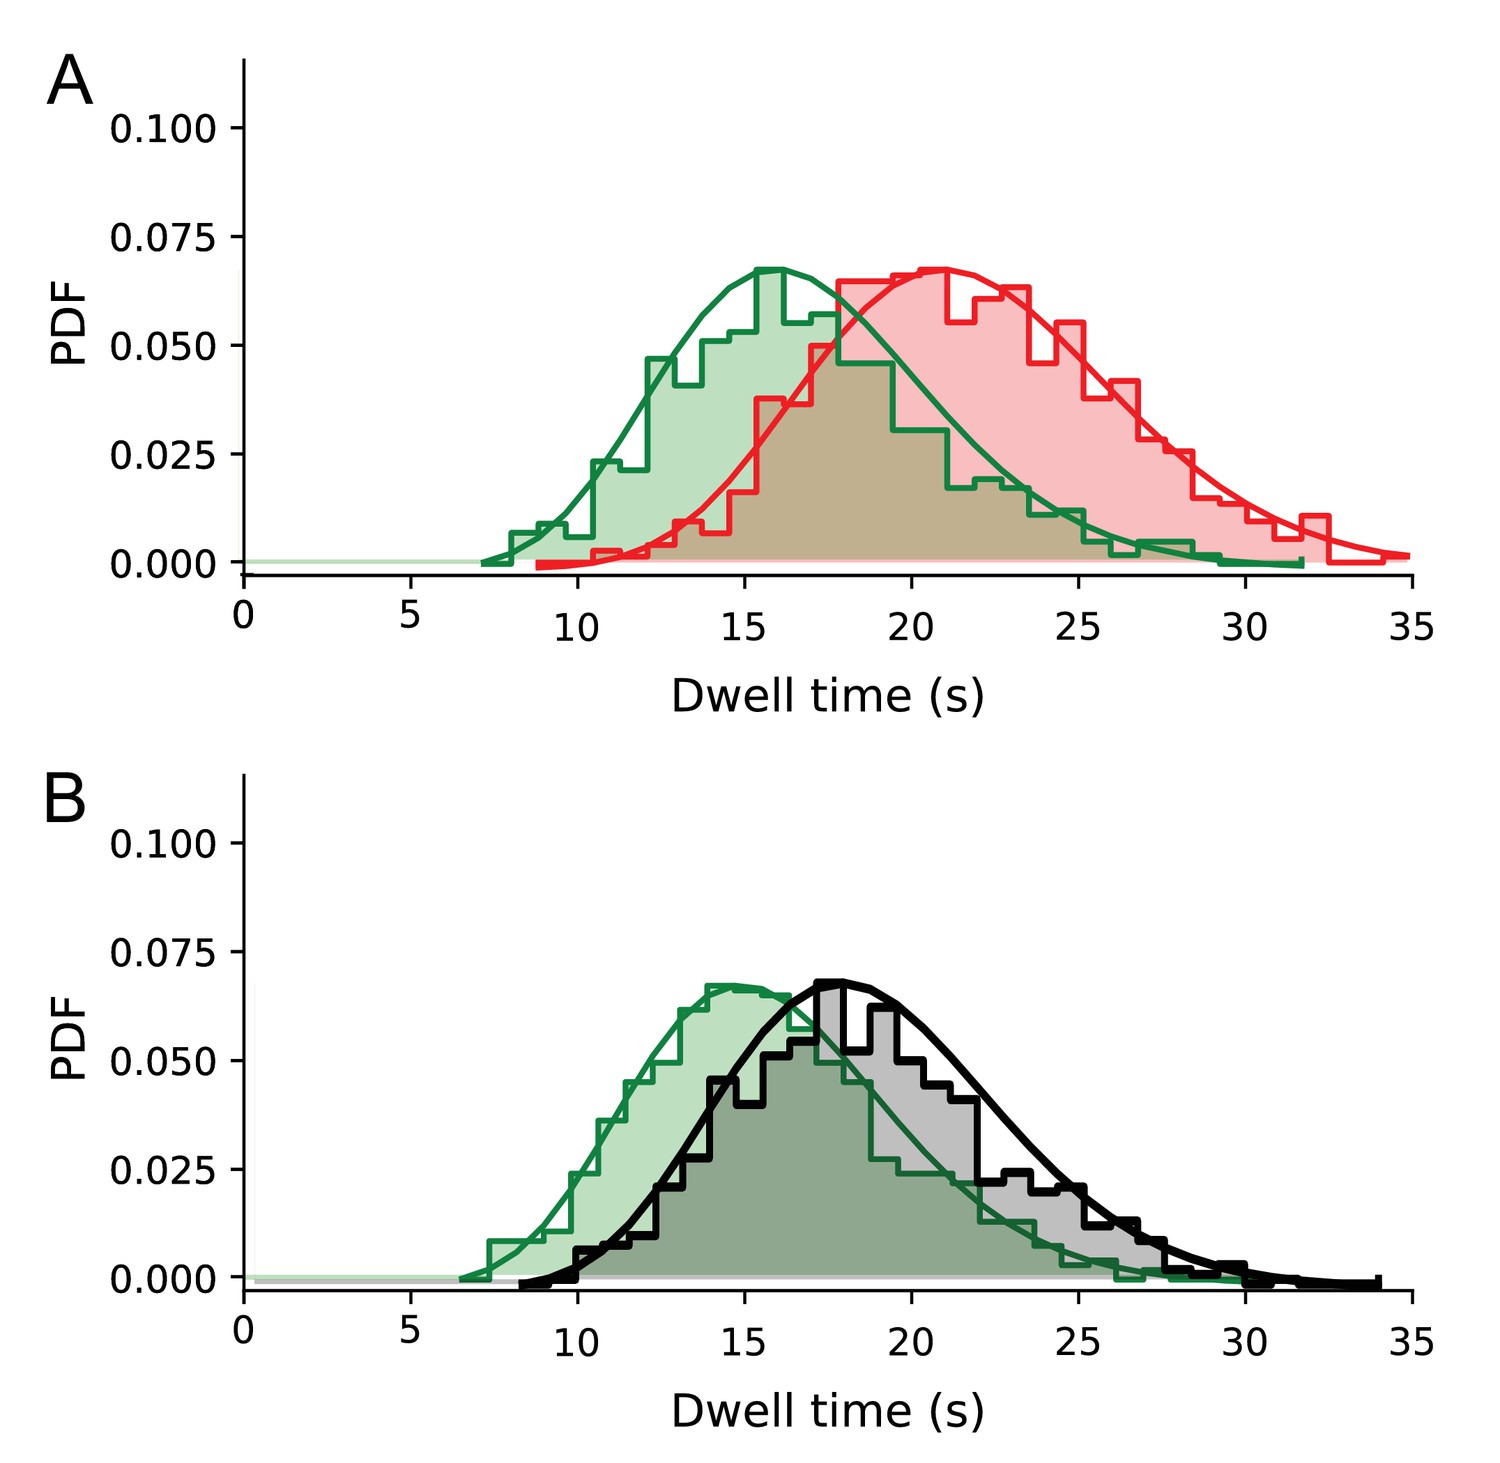
Deconvolution of photobleaching effect from the dwell time distributions for the longest 683 aa substrate.
(A) Without SecB, uncorrected distributions (shown as probability density functions) are shown in green, corrected distribution shown in red. Solid lines represent fitted gamma distribution functions. (B) As A), but in the presence of SecB (10 μM). The corrected distribution is shown in grey (as in Figure 5A). Solid lines represent fitted gamma distribution functions.
Figure 5—figure supplement 4

Dwell time of the closed EFRET ~ 0.4 state as a function of the translocating substrate length.
(A) Without SecB. Error bars represent the standard deviation (s.d.) computed from the distribution of the dwell times. (B) As A), but in the presence of SecB (10 μM).
Figure 6
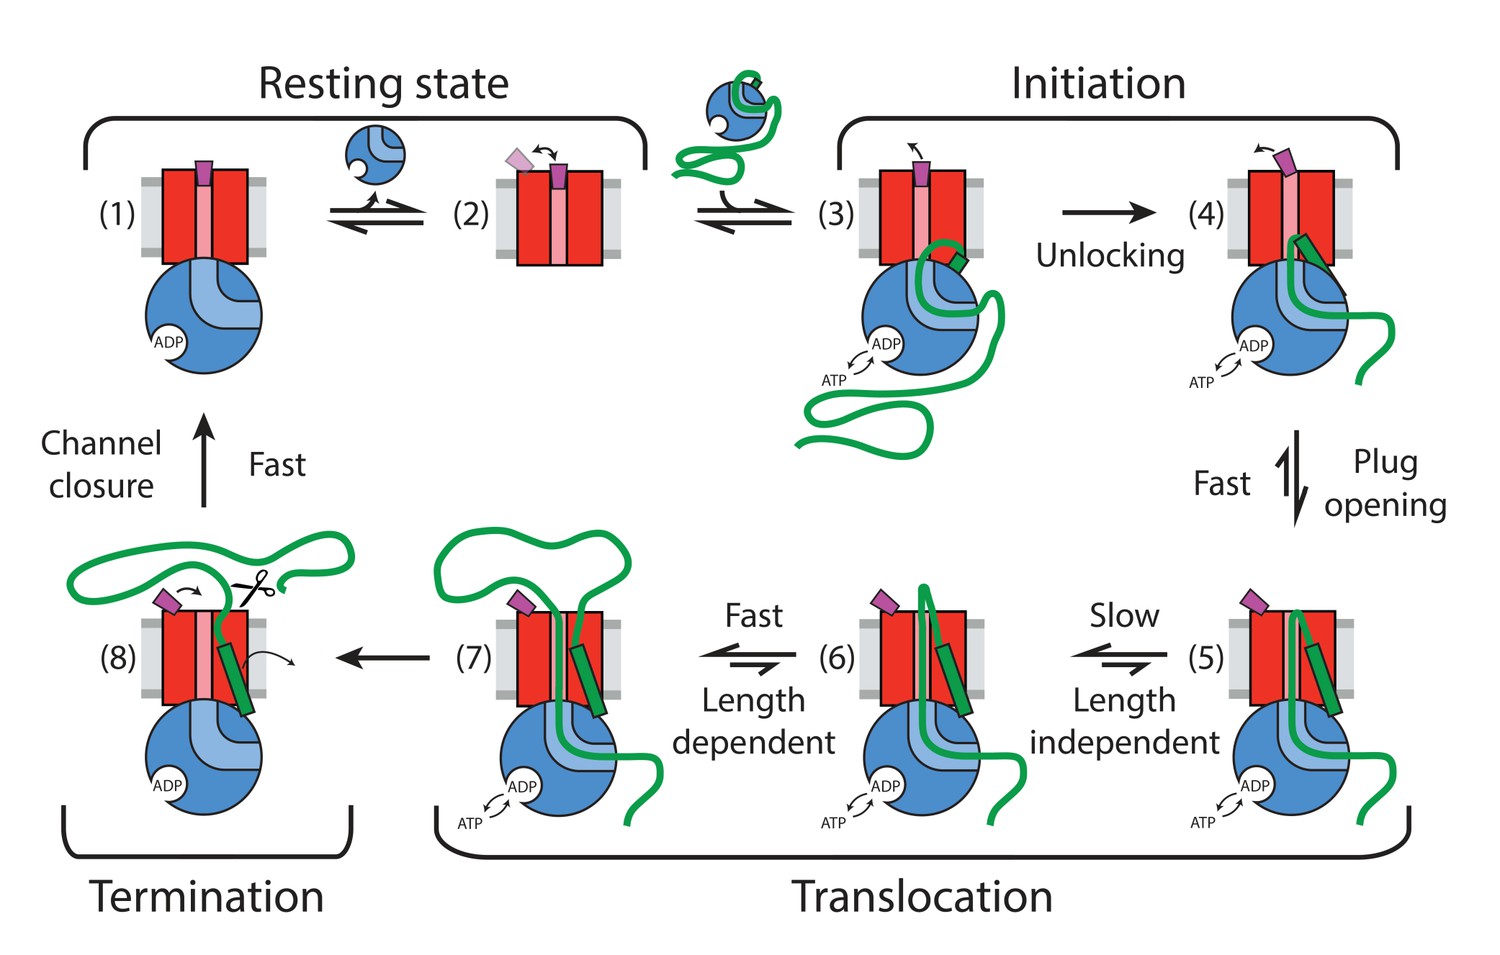
Summary of detected plug states and initiation and translocation stages.
Colour coding: SecYEG – red, SecA – blue, proOmpA/OmpA – thick green line, SS –green rectangle, stationary plug – purple, plug in intermediate or transient state – magenta, lipid bilayer – grey. Scissor symbol indicates substrate liberation by signal peptidase (if present). Thin arrows indicate motion of plug and SS.
Videos
Video 1
Detailed sampling of time resolved transition density plots shown in Figure 3A.
Conditions: SecYMKEG:SecA:SecB:pOA in the presence of 0.1 mM ATP.
Tables
Key resources table
| Reagent type (species) or resource | Designation | Source or reference | Identifiers | Additional information |
|---|---|---|---|---|
| Software, algorithm | iSMS software | (Preus et al., 2015) - doi:10.1038/nmeth.3435 | ||
| Software, algorithm | LabView | (Lee et al., 2005) - doi: 10.1529/biophysj.104.054114 | ||
| Software, algorithm | FRETbursts | (Ingargiola et al., 2016b) - doi: 10.1371/journal.pone.0160716 | ||
| Software, algorithm | photon-hdf5 | (Ingargiola et al., 2016a) - doi: 10.1016/j.bpj.2015.11.013 | ||
| Software, algorithm | dual-channel burst search | (Nir et al., 2006) - DOI: - 10.1021/jp063483n | ||
| Software, algorithm | regularized inverse transform | (Provencher, 1982) - DOI10.1016/0010-4655(82)90173-4 | ||
| Software, algorithm | graphics: library Seaborn, based on Matplotlib | (Hunter, 2007) - DOI10.1109/MCSE.2007.55 |
Additional files
-
Source code 1
Python script source code.
- https://doi.org/10.7554/eLife.35112.025
-
Source data 1
Primary single molecule fluorescence data file for use with the Python script.
- https://doi.org/10.7554/eLife.35112.026
-
Transparent reporting form
- https://doi.org/10.7554/eLife.35112.027
Download links
A two-part list of links to download the article, or parts of the article, in various formats.
Downloads (link to download the article as PDF)
Open citations (links to open the citations from this article in various online reference manager services)
Cite this article (links to download the citations from this article in formats compatible with various reference manager tools)
Dynamic action of the Sec machinery during initiation, protein translocation and termination
eLife 7:e35112.
https://doi.org/10.7554/eLife.35112


