Fast-backward replay of sequentially memorized items in humans
- Peking University, China
Figures
Figure 1
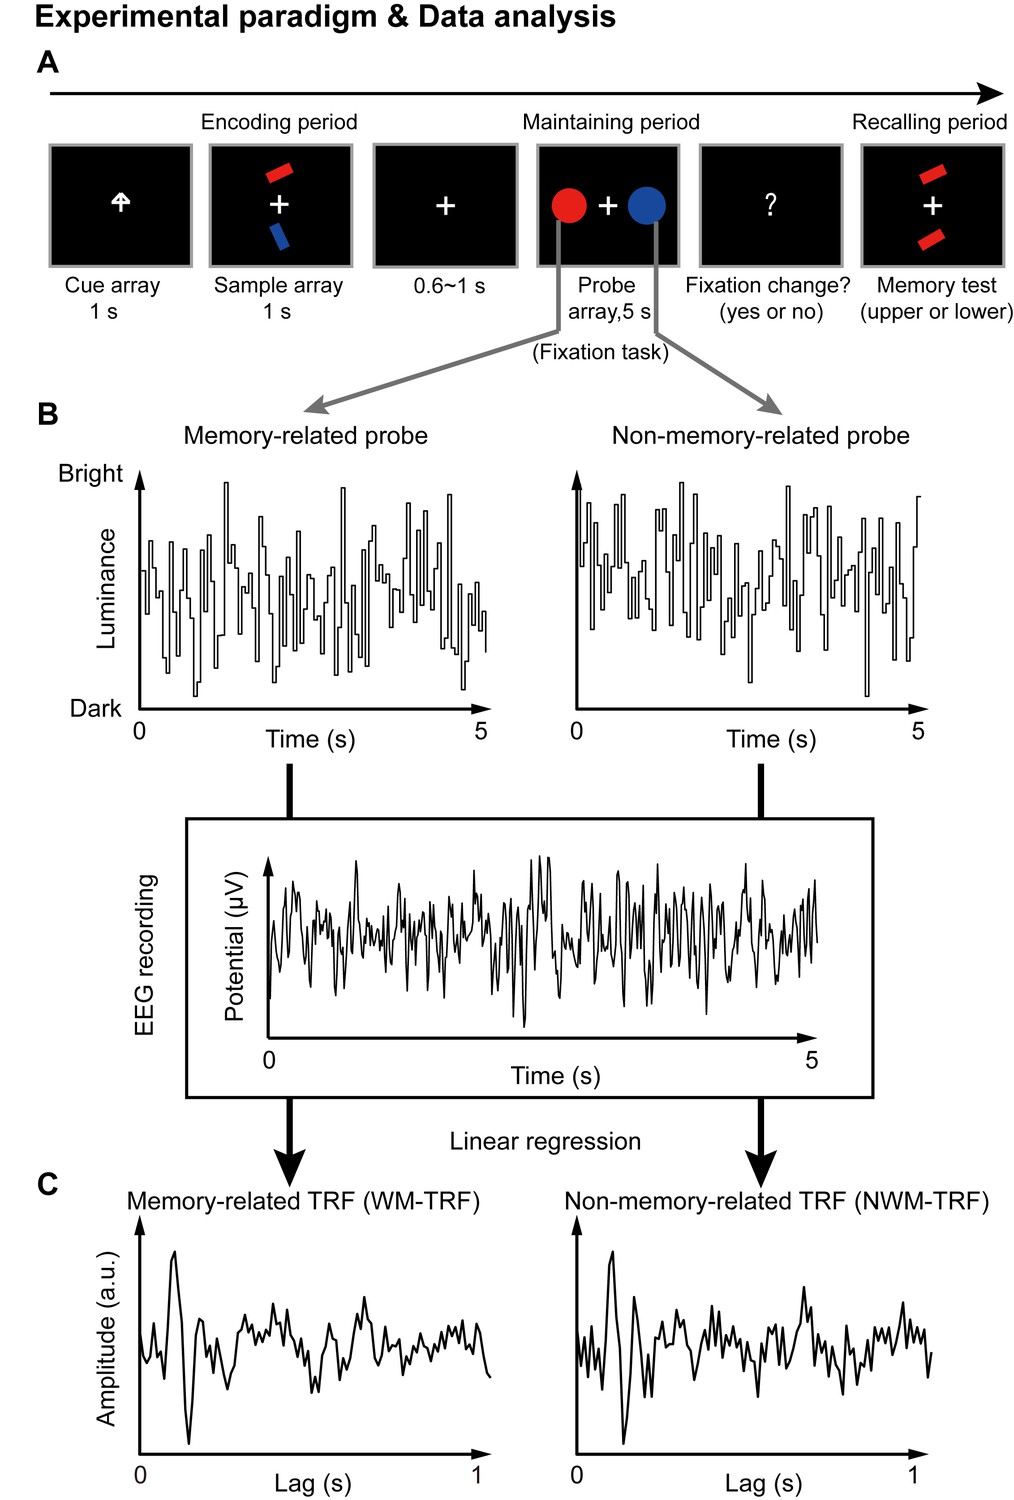
Paradigm for Experiment 1(1-item memory task) and illustration of the TRF approach.
(A) A central arrow cue was first presented to indicate which of the bars the participants should examine. A sample array containing two bars then appeared and participants were asked to memorize the orientation of the cued bar (‘encoding period’). Next, a probe array containing two task-irrelevant disc probes with memory-matching color and non-memory-matching color was presented for 5 s (‘maintaining period’), during which participants performed a central fixation task by monitoring an abrupt luminance change of the central fixation cross, while simultaneously holding the orientation information in memory. In the final ‘recalling period’, participants were asked to judge which bar (upper or lower) had the same orientation as the cued bar. (B) During the 5 s maintaining period, the luminance of the two discs was continuously modulated according to two random temporal sequences respectively. At the same time, electroencephalography (EEG) responses were recorded. (C) The TRF approach was used to calculate the impulse brain response for the memory-related (left, WM-TRF) and non-memory-related (NWM-TRF) disc probes. TRF response characterizes the brain response to a unit increase in luminance of a stimulus sequence, as a function of time lag after each transient. Note that the WM-TRF and NWM-TRF were derived from the same EEG responses but were separated based on the corresponding stimulus luminance sequence. As a result, the computed WM-TRF and NWM-TRF would represent the elicited response for each unit transient at the WM and NWM probes, respectively, throughout the memory retention interval.
Figure 2 with 4 supplements

Results for Experiment 1 (1-item memory task).
(A) Grand average (N = 18) time-frequency power profile for memory-related (WM, left) and non-memory-related (NWM, right) TRFs as a function of latency (0 – 0.6 s) and frequency (0 – 30 Hz) for all EEG channels. (B) Grand average distribution map for the normalized WM – NWM alpha-band (8 – 11 Hz) power difference in combination with the normalized WM + NWM alpha-band power within the first 0.6 s. Red dots indicate channel-of-interest (Pz, P1, P2) (see details of selection criteria in Materials and methods), which were analyzed for all subsequent analyses, including those in Exp. 2. (C) Grand average time–frequency plots for WM – NWM power difference as a function of latency and frequency in the channel-of-interest. (D) Grand average alpha (8 – 11 Hz) power time courses (mean ±SEM) for WM-TRF and NWM-TRF responses in the channel-of-interest. Black dots at the bottom indicate time points showing significant WM-NWM differences (bootstrap test, p < 0.05, FDR corrected across time points). See also Figure 2—figure supplements 1–4. The data are provided in source data 1.
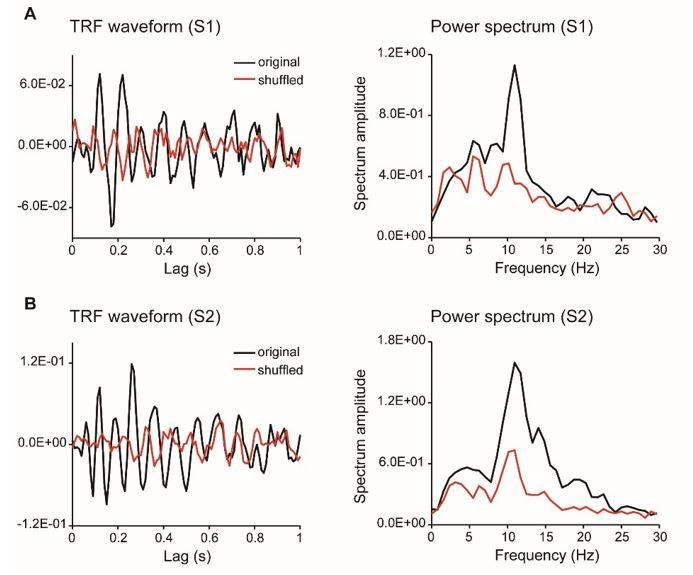
Figure 2—figure supplement 1
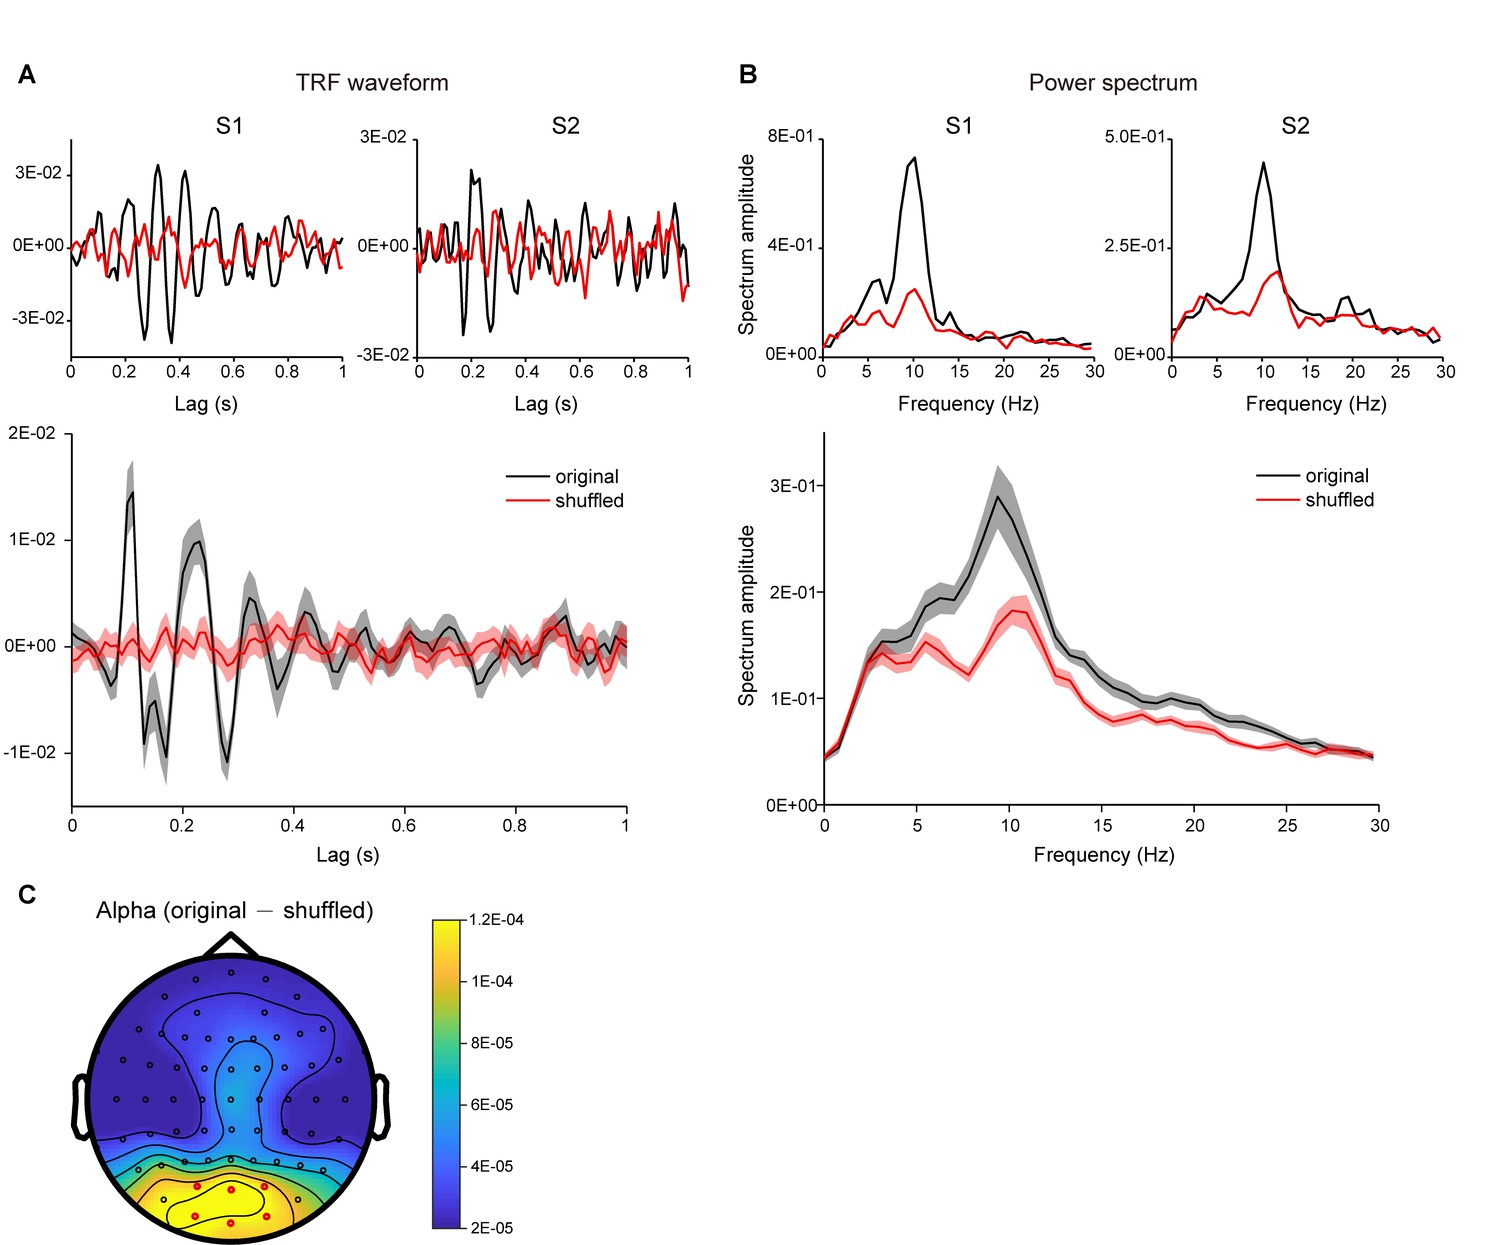
Validation of TRF response.
(A) TRF temporal waveforms of two representative subjects (upper panel) and grand average results (N = 18; lower panel, shaded areas represent SEM across subjects), calculated by the linear regression between luminance sequence and the corresponding EEG signal (black line, original data), or by shuffling the pairing between luminance sequence and EEG signals (red line, shuffled data). (B) Power spectrum of TRF responses for representative subjects (upper panel) and grand average (N = 18) power spectrum (lower panel), for original data (black) and shuffled data (red). (C) Distribution map for the alpha-band (8 – 11 Hz) power difference between the original data and the shuffled data. The TRF responses in the current experiment are thus consistent with previous findings (Jia et al., 2017; VanRullen and Macdonald, 2012) and robust at single subject level.
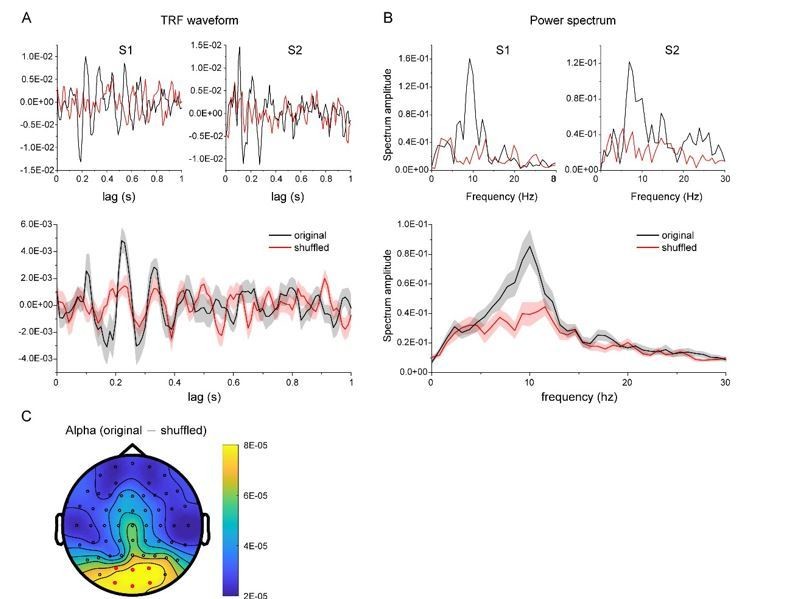
Figure 2—figure supplement 2
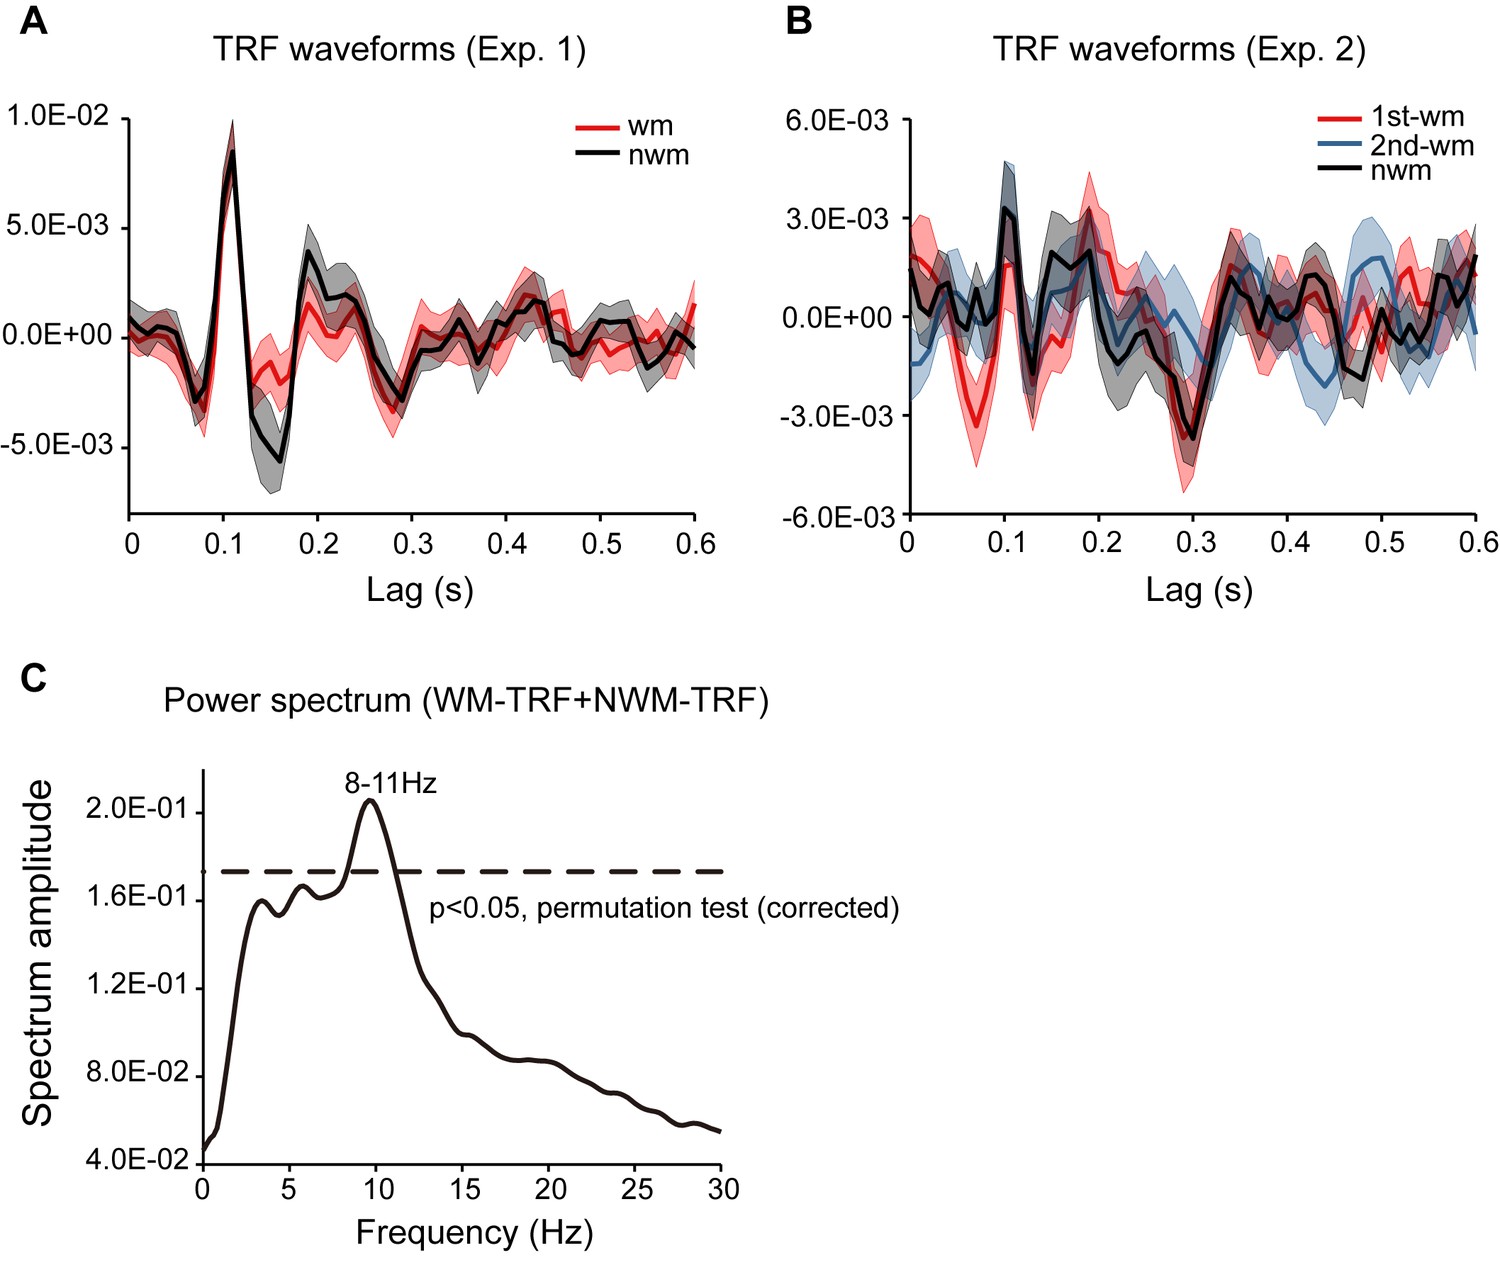
TRF waveforms in channel-of-interest (Pz, P1, P2) in Experiment 1 and Experiment 2 and the TRF power spectrum.
(A) TRF waveforms for Experiment 1. Grand average (N = 18) WM-TRF (red line, mean ±SEM), and NWM-TRF waveforms (black line, mean ±SEM). (B) TRF waveforms for Experiment 2. Grand average (N = 19) 1st-WM-TRF (red line, mean ±SEM), 2nd-WM-TRF (blue lines, mean ±SEM), and NWM-TRF waveforms (black line, mean ±SEM). It is notable that our main results (Figures 2–3) were based on induced analysis (e.g., performing time-frequency analysis in individual subject and then averaging time-frequency power across subjects), whereas the temporal waveforms here plot the ‘evoked’ activities (the grand average temporal waveforms). Only when an individual subject elicited a phase-locked alpha-band TRF response, would we observe a clear 10 Hz oscillatory pattern in the grand average TRF responses. (C) Grand average (N = 18) power spectrum for TRF response in Experiment 1 across all conditions and all EEG electrodes in Experiment 1. The dashed lines represent the statistical significance threshold (permutation test, corrected).
Figure 2—figure supplement 3
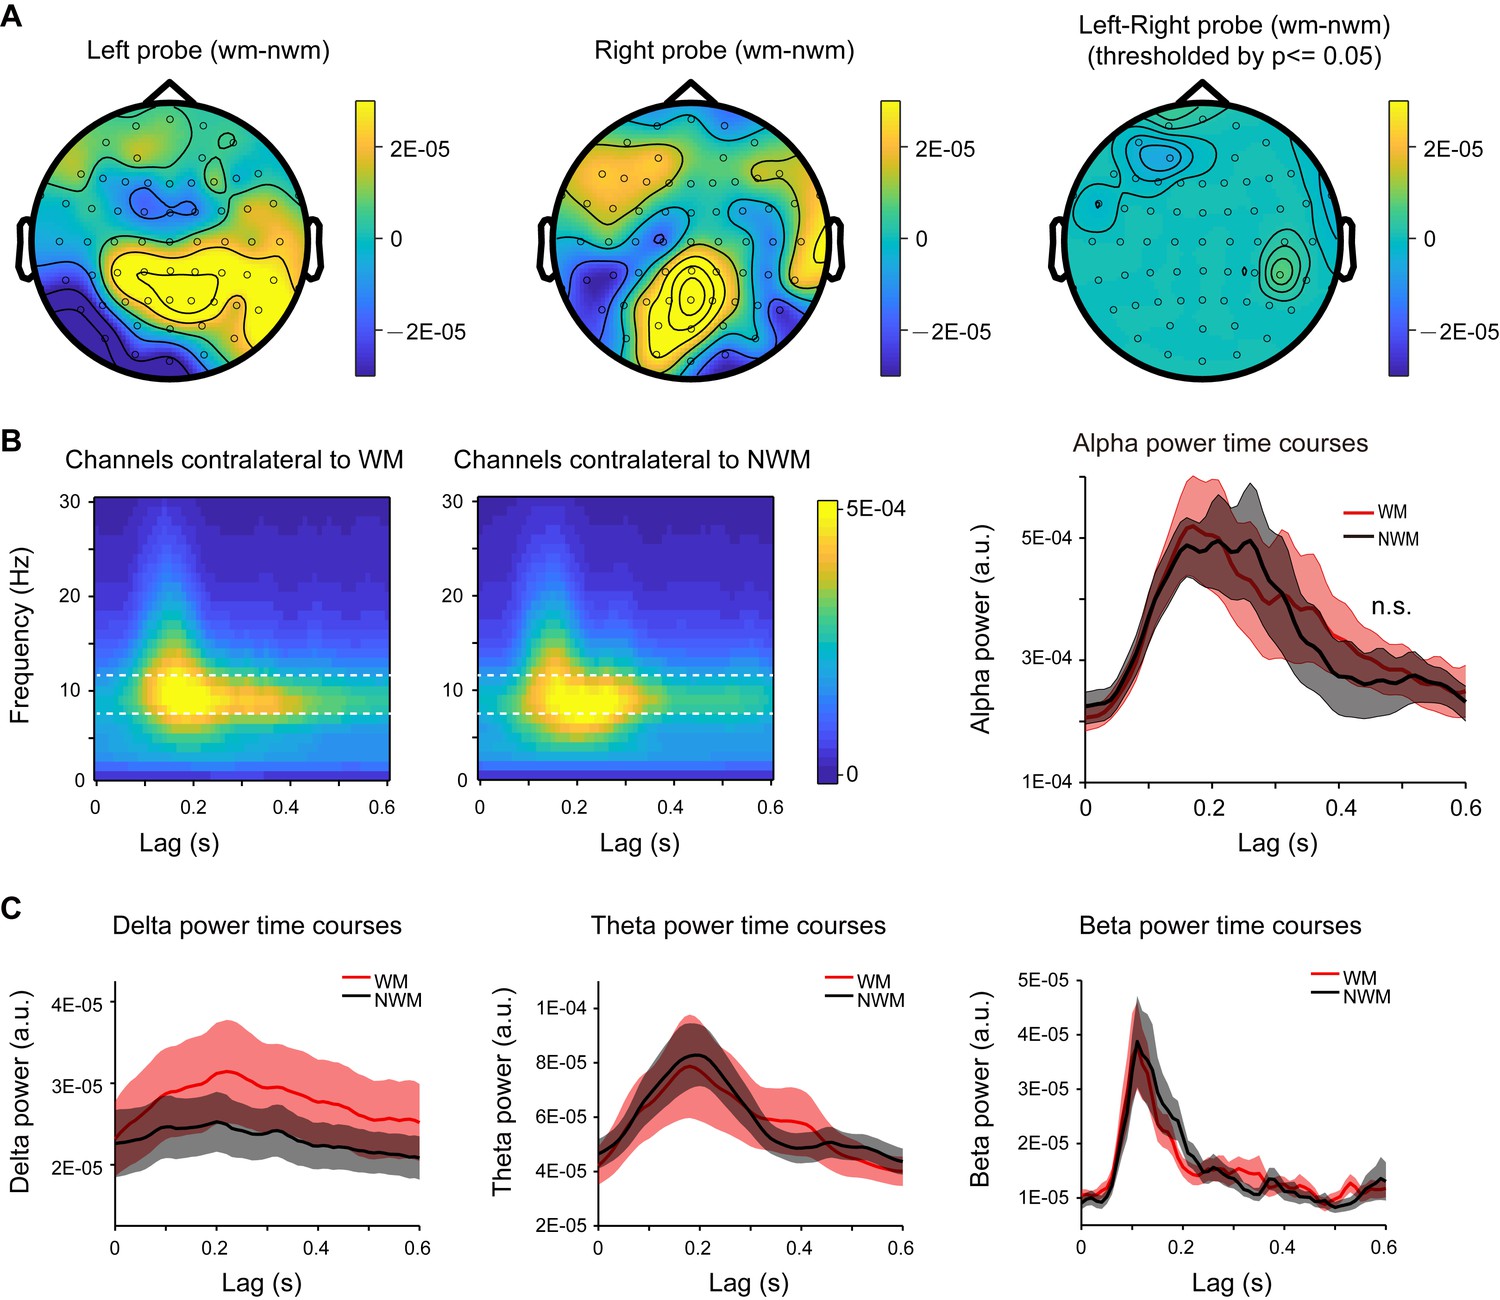
Alpha-mediated memory effect did not show spatial lateralization, and analysis within other frequencies.
(A) Grand average distribution map for the normalized WM-NWM alpha-band (8–11 Hz) power difference when the probe was presented in the left visual field (left panel) or right visual field (middle panel) and the map for their difference (right panel, threshold by p < 0.05). The two maps did not show any significant difference (paired t-test, p < 0.05). (B) Time-frequency power plots for channels contralateral to the WM probe (left panel) and channels contralateral to the NWM probe (middle panel) in the same recording. Posterior channels were selected (P7, P5, P3, P1, PO7, PO3, O1 versus P8, P6, P4, P2, PO8, PO4, O2). Right panel: alpha-band TRF power temporal profiles (mean ±SEM) for channels that are contralateral to WM probe (red line) and channels contralateral to the NWM probe (black line); no significant difference was found (paired t-test). (C) Grand average power time courses (mean ±SEM) for WM-TRF and NWM-TRF responses in the channel-of-interest, within other frequency bands (delta band: 1 – 2 Hz; theta-band: 3 – 6 Hz; beta-band: 15 – 25 Hz) in Experiment 1.
Figure 2—figure supplement 4
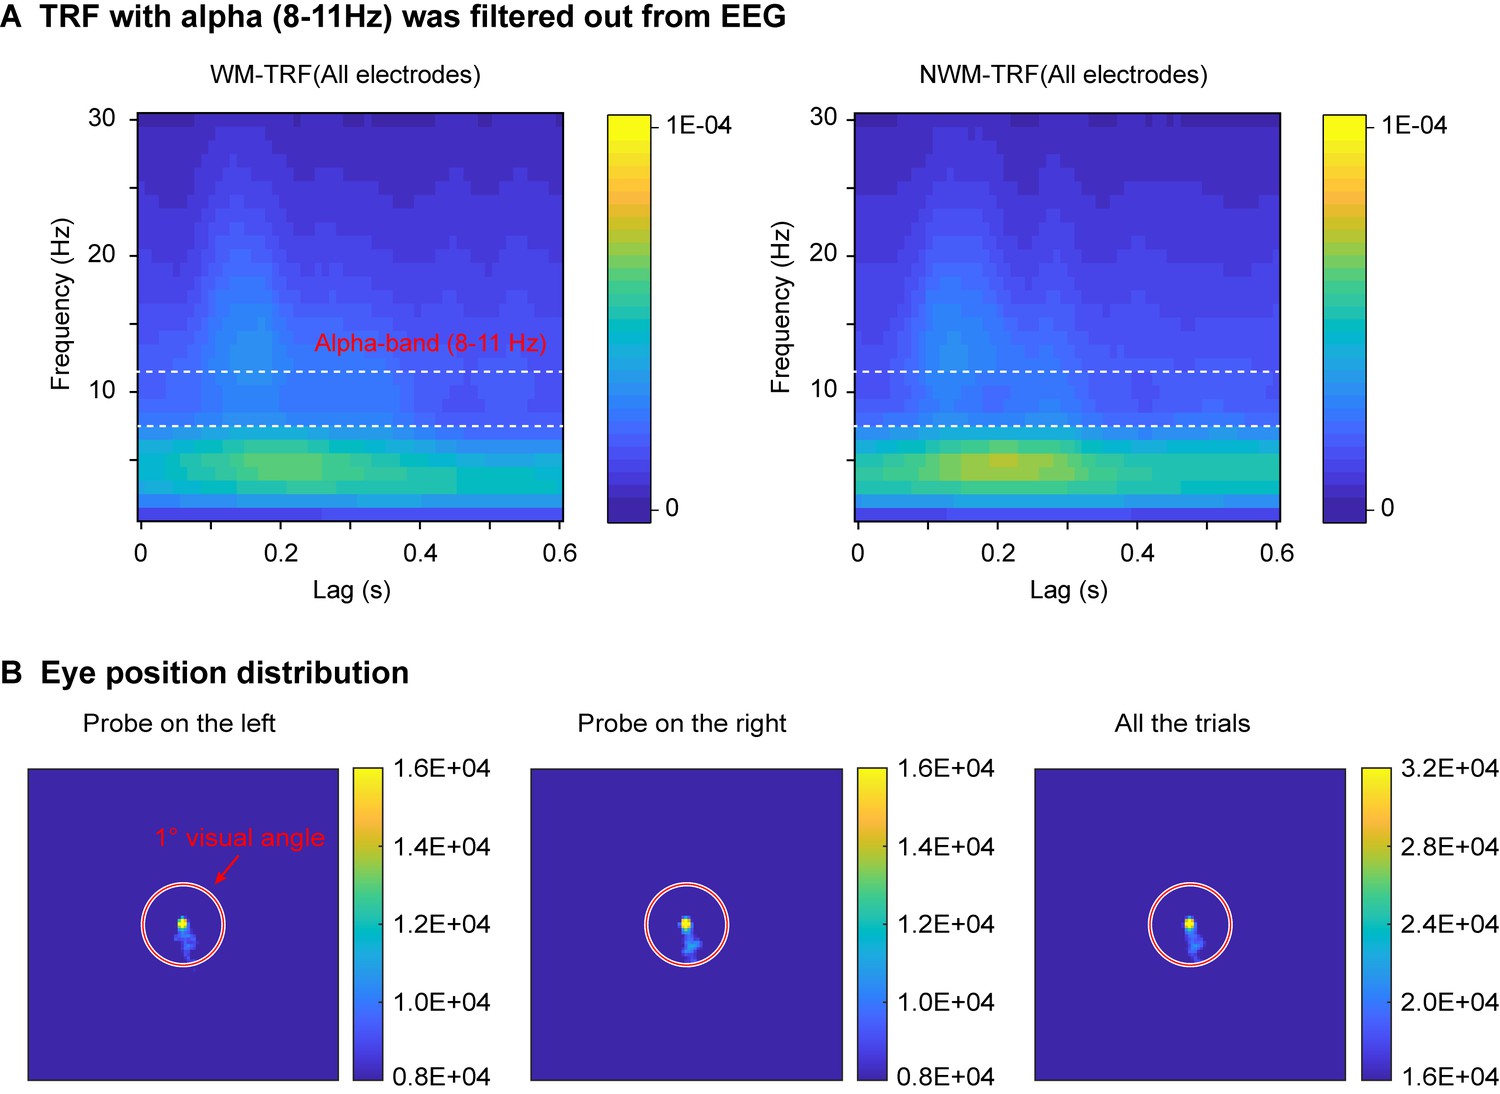
Control analysis and eye movement distribution.
(A) The alpha-band activities were filtered out before TRF calculation, resulting in a lack of alpha-band activities in TRF responses (compared to Figure 2A). The results are consistent with previous findings (VanRullen and Macdonald, 2012) and support the view that the alpha in TRF derives from the ‘real’ alpha-band activity in EEG signals rather than reflecting other high-frequency components. (B) The subject maintained good central fixation throughout the experiment (right panel). The eye position distribution did not show spatial bias when the WM probe was either at the left side (left panel) or the right side (middle panel).
Figure 3 with 2 supplements
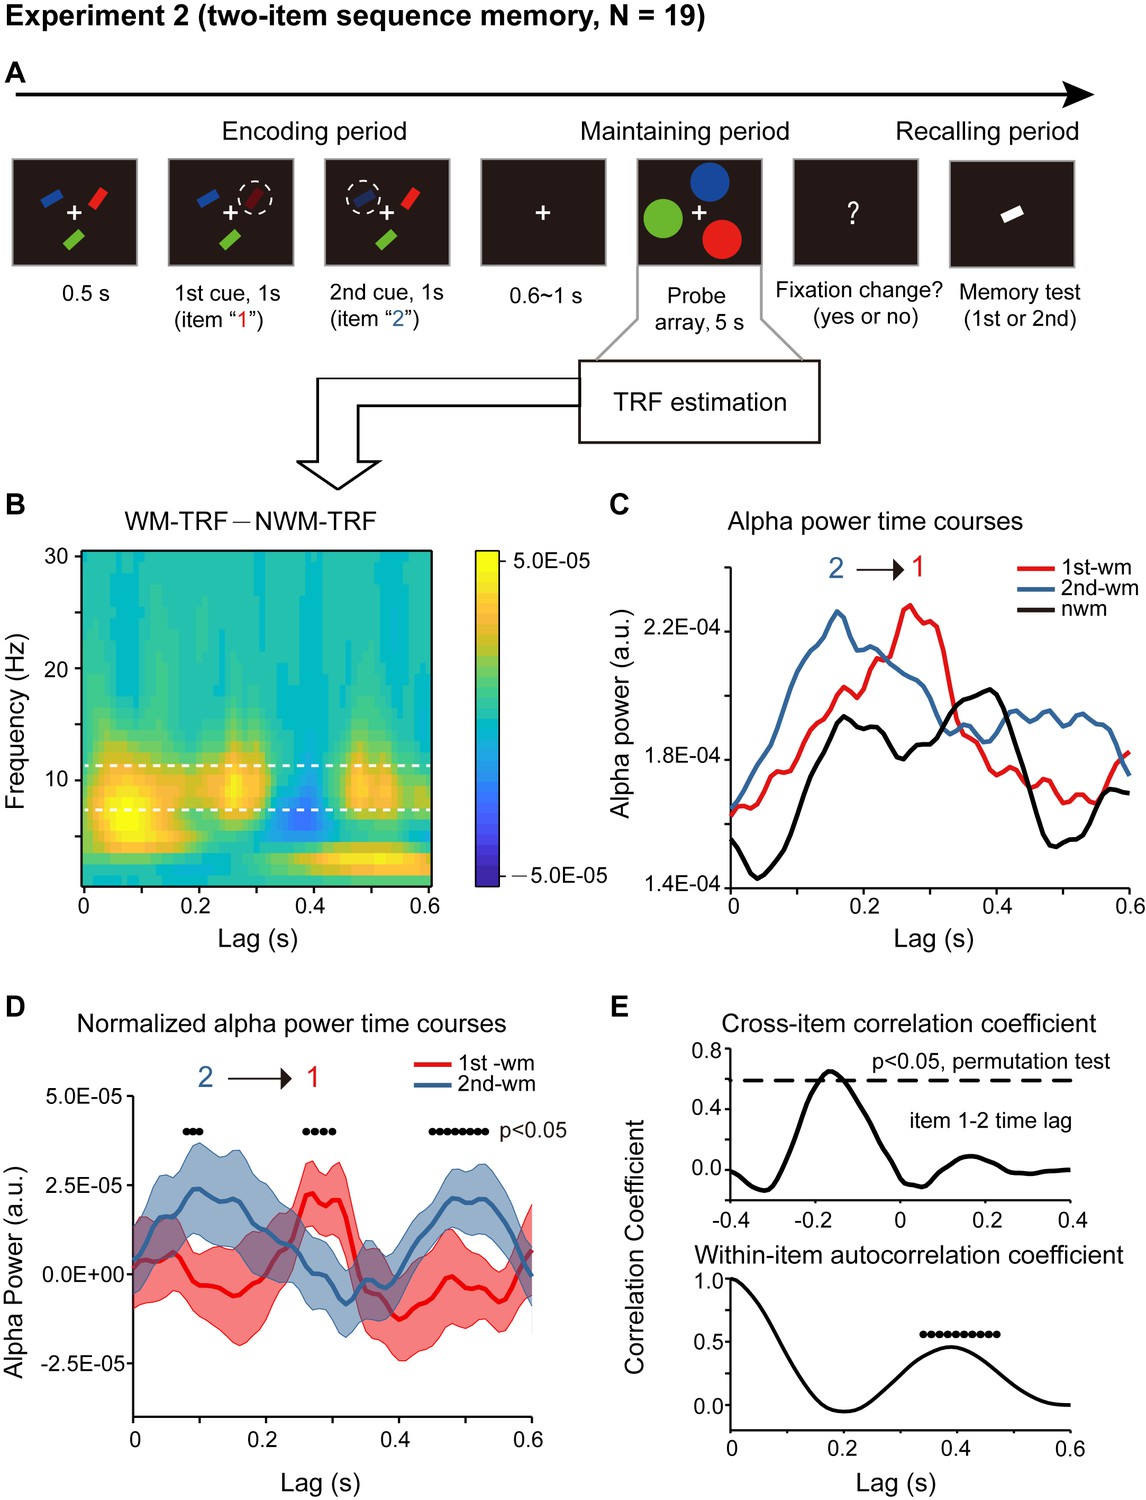
Paradigm and results for Experiment 2 (two-item sequence memory task)(A) Participants were first presented with a sample array containing three bars with different orientations and different colors.
https://doi.org/10.7554/eLife.35164.009
Figure 3—figure supplement 1
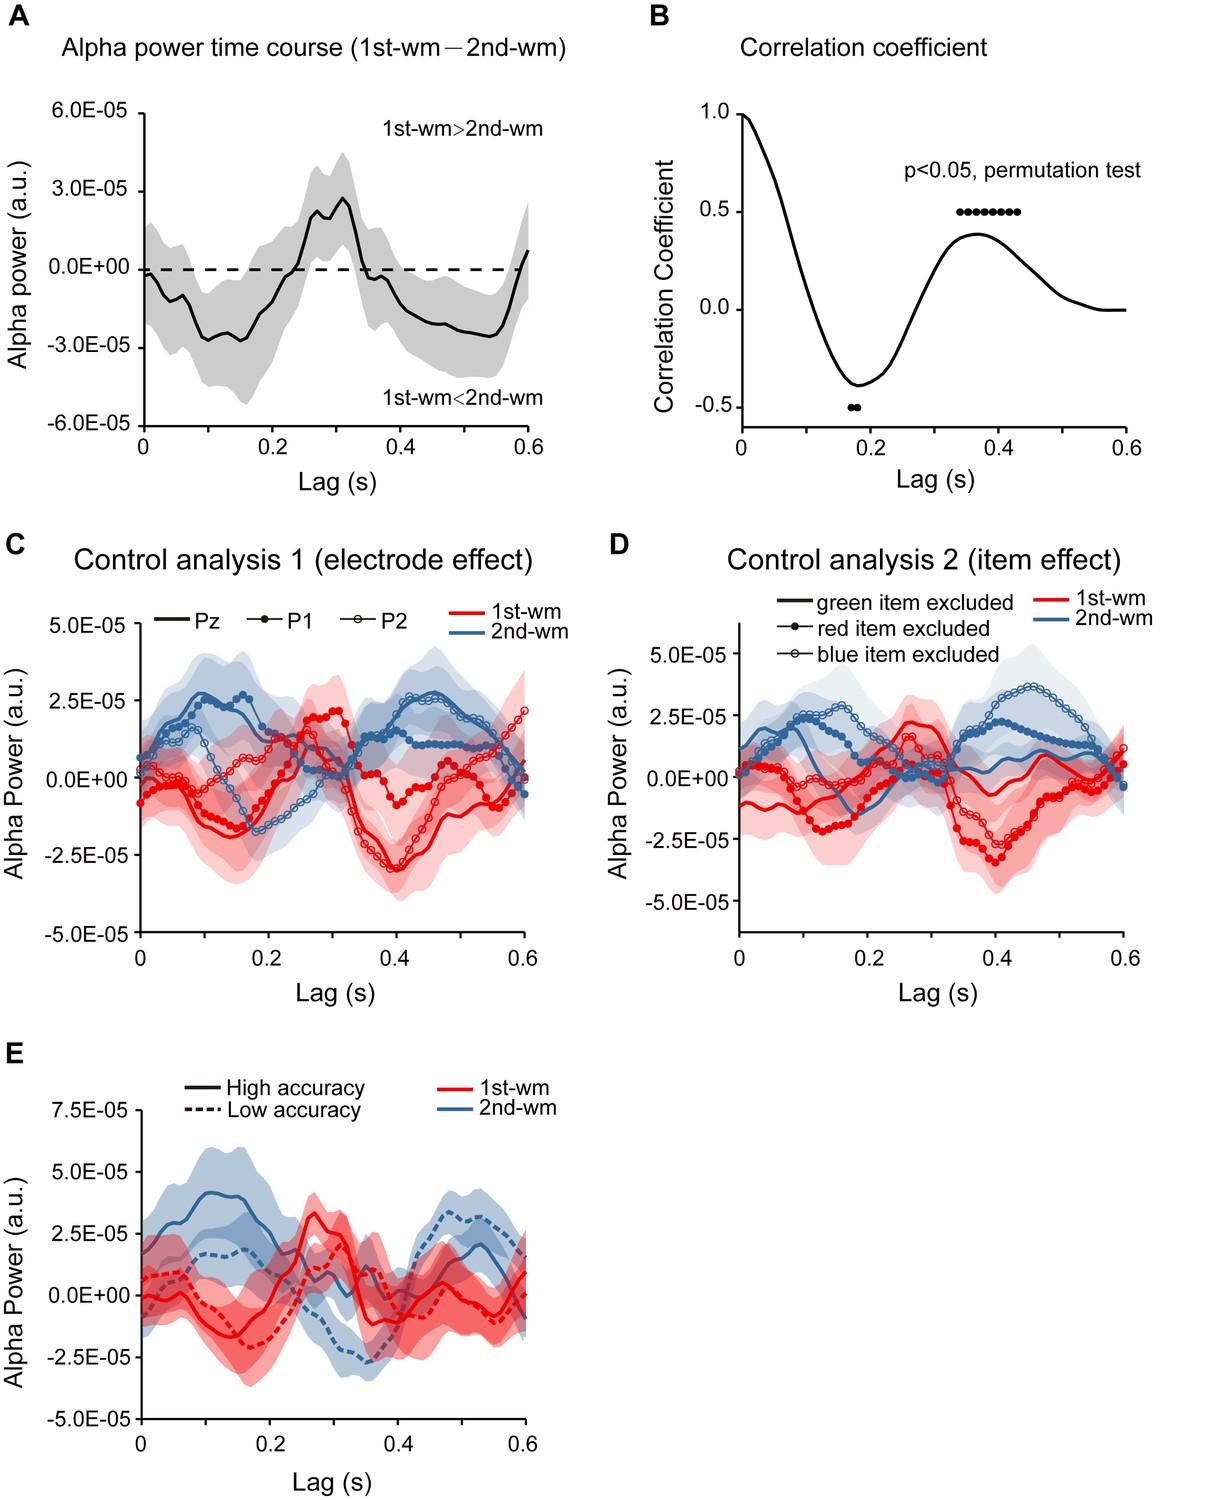
Control analysis.
(A) Grand average (N = 19, Experiment 2) alpha-band power time courses (mean ±SEM) for the difference between 1st-WM-TRF and 2nd-WM-TRF responses. (B) Correlation coefficient for the 1st-WM-TRF – 2nd-WM-TRF alpha power time course (black dots: p < 0.05, permutation test). The analysis did not include the NWM items but showed the same results as before, thus excluding the interpretation that the observed backward-sequential reactivation was simply caused by subtraction of the NWM response. (C) Grand average (N = 30, pooling across experiment two and response bias control experiment) normalized alpha power time courses (mean ±SEM) for 1st-WM-TRF (red) and 2nd-WM-TRF (blue) on electrode Pz (solid line), P1 (line with solid circle), and P2 (line with hollow circle), supporting that the backward sequential profiles were consistent across electrodes. (D) To examine whether different items would elicit distinct temporal patterns (e.g., red probes would be associated with responses with earlier latency), we replotted the TRF responses for different combinations of colors (i.e., red, blue, and green). If probes with different colors elicited different temporal patterns, we would expect to see inconsistent response profiles for different items. Grand average normalized alpha power time courses (mean ±SEM) for 1st-WM-TRF (red) and 2nd-WM-TRF (blue) for different combinations of items (solid line: red +yellow; line with solid circle: blue +green; line with hollow circle: red +blue). All three combinations showed similar backward sequential activations, supporting that the observed sequential activations were consistent across items, and not biased by certain items. (E) To test the ‘memory strength’ interpretation (the better the memory strength of the item is, the earlier the response latency would be), subjects in Experiment 2 were divided into two groups based on their memory accuracy rather than the recency effect. Grand average normalized alpha-band power time courses for 1st-WM-TRF (red) and 2nd-WM-TRF (blue) for the high-accuracy (sold line) and low-accuracy groups (dashed line). The two groups elicited quite similar backward sequential responses rather than showing temporal shift, excluding the possibility that it is memory strength rather than the recency effect that leads to the observed backward sequential responses.
Figure 3—figure supplement 2
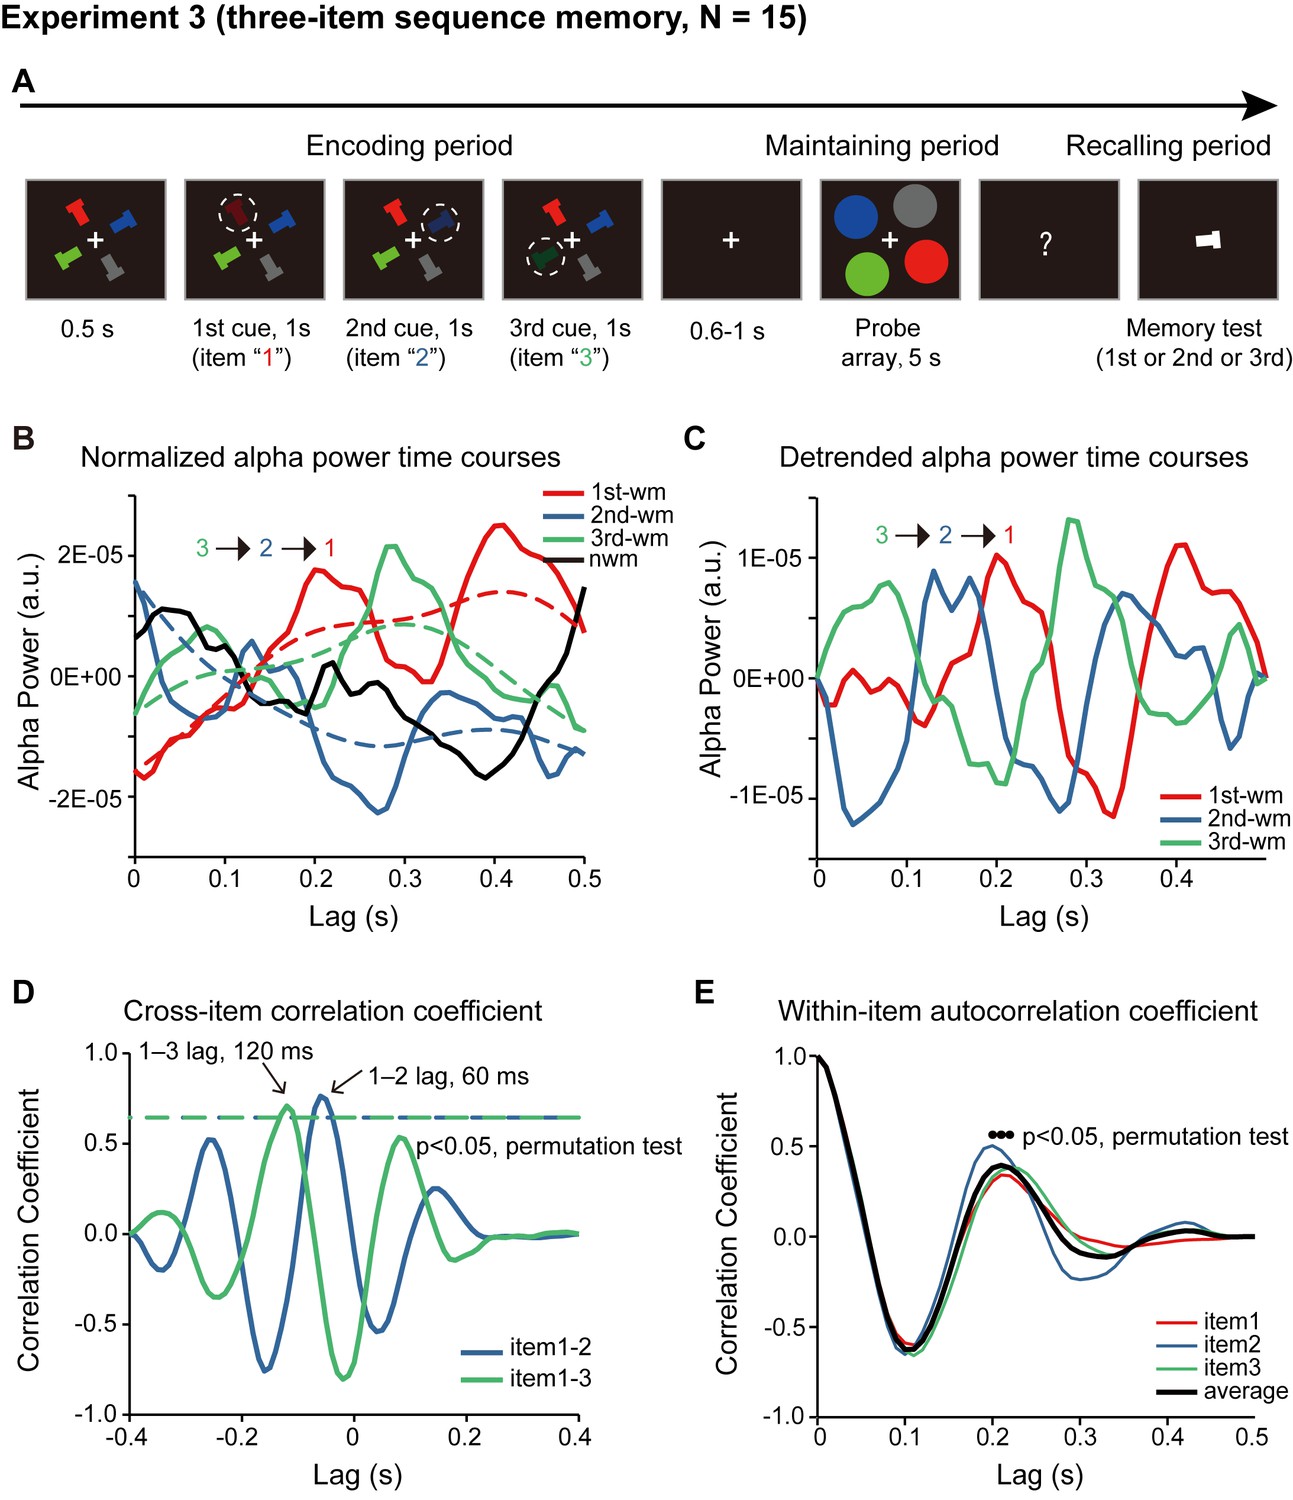
Paradigm and results for three-item sequence memory task (N = 15).
(A) Four T-like items with different colors and different orientations were first presented. Three of the four items were randomly selected and serially cued, and participants were asked to memorize not only the orientation of the three cued bars but also their temporal order (i.e., the 1st, the 2nd and the 3rd orientation). During the 5 s ‘maintaining period’, participants performed a central fixation task and held the three-item orientation sequence in memory. In the final ‘recalling period’, participants compared the orientation of the bar in the test array with the memorized orientations (e.g. is it more similar to the orientation of the 1st or the 2nd or the 3rd cued bars?). Correspondingly, the probe array during the 5 s maintaining period then consisted of four disc probes, three memory-related probes and one non-memory-related probe, the luminance of which were modulated continuously, and their respective TRF responses (1st-WM-TRF, 2nd-WM-TRF, 3rd-WM-TRF, and NWM-TRF) were calculated. The same spectrotemporal and normalization analysis was performed on the TRF responses for each channel and in each participant separately. (B) Normalized grand average (N = 15) alpha power time courses in the channel-of-interest defined in Experiment 1, for 1st-WM-TRF (red), 2nd-WM-TRF (blue), 3rd-WM-TRF (green), and NWM-TRF (black). Notably, consistent with Experiment 2, the normalized three-item alpha-band power profile again displayed a reverse response trend, but on top of a slowly developing trend (dotted lines). (C) The three normalized alpha-band time courses were further detrended by removing their respective slow developing trends (dotted lines) to better visualize the sequential temporal profiles. Normalized and detrended alpha power time courses for 1st-WM-TRF (red), 2nd-WM-TRF (blue), and 3rd-WM-TRF (green) in the channel-of-interest. (D) Cross-correlation coefficient between the normalized and detrended alpha-band profile for the 1st-WM-TRF and the 2nd-WM-TRF responses (blue line), and that between the 1st-WM-TRF and 3rd-WM-TRF (green line). The dashed lines represent the corresponding statistical significance threshold (p < 0.05, permutation test, corrected). The 1st-2nd (green line) and the 1st-3rd (blue line) cross-correlation coefficients were significant at a temporal lag of around –60 ms and –120 ms, respectively. (E) Autocorrelation coefficient for the detrended and normalized alpha power time courses for 1st-WM-TRF (red), 2nd-WM-TRF (blue), 3rd-WM-TRF (green), and the averaged autocorrelation coefficient (black) (black dots: p < 0.05, permutation test, corrected).
Figure 4 with 1 supplement
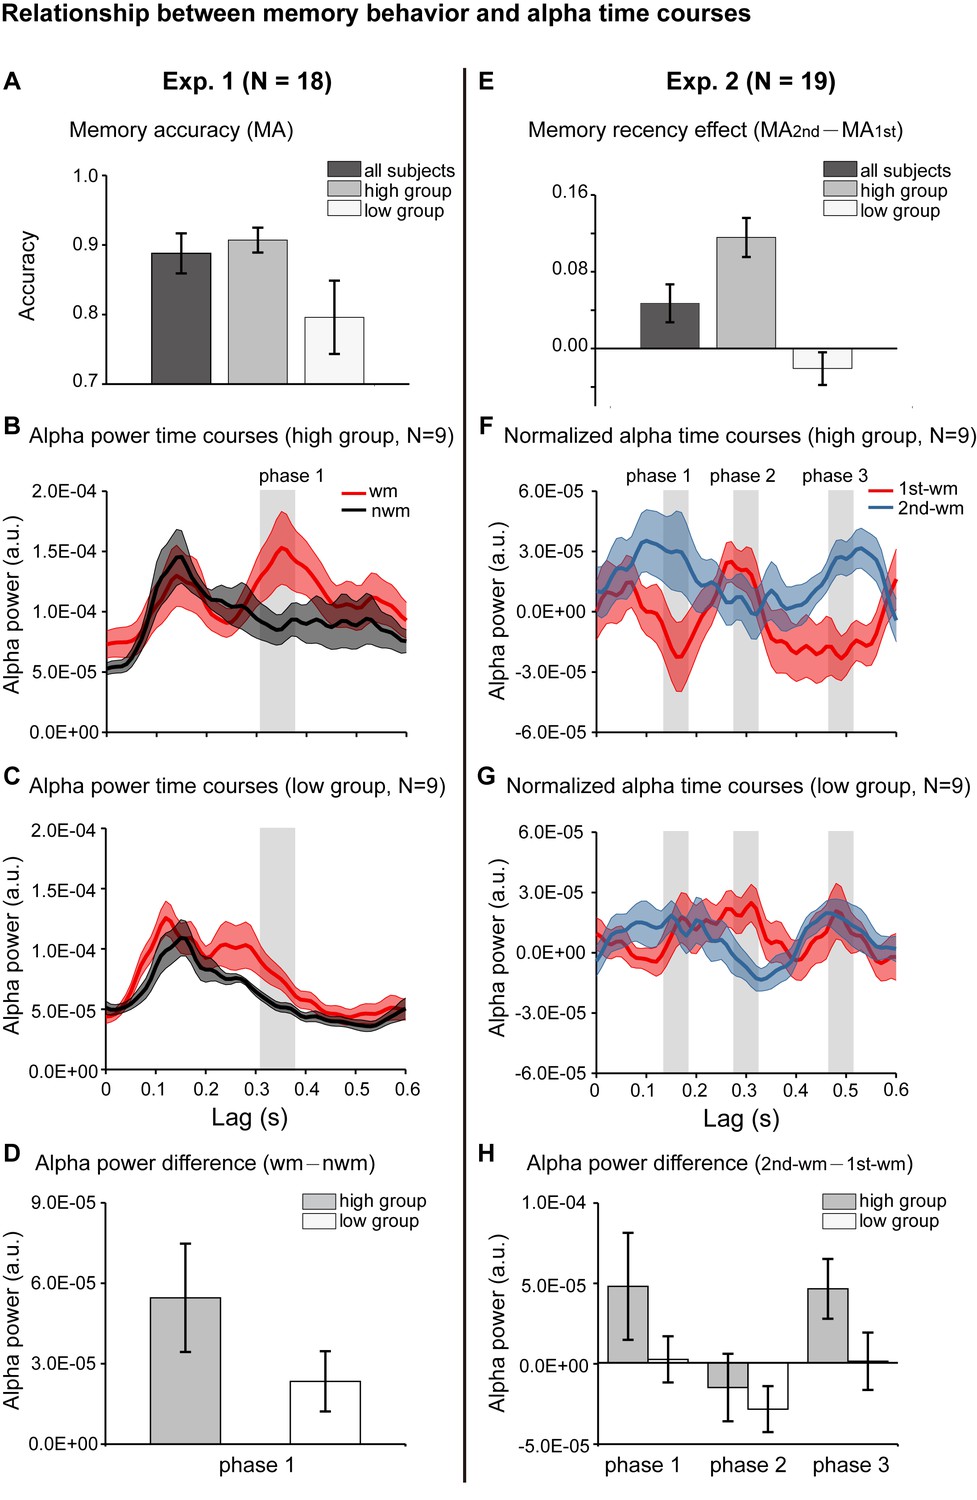
Relationship between memory behavior and alpha-band TRF profiles.
(A) Participants in Experiment 1 were grouped based on the memory behavioral accuracy into ‘high-performance’ and ‘low-performance’. Grand average (mean ±SEM) memory accuracy (MA) for all participants (N = 18), high-performance group (N = 9), and low-performance group (N = 9). (B) Grand average alpha-band power time courses (mean ±confidence interval) for the high-performance group (red: WM-TRF; black: NWN-TRF). (C) Grand average alpha-band power time courses (mean ±confidence interval) for the low-performance group (red: WM; black: NWN). The shaded box (310-370 ms) representing the time range for the alpha-band memory effect (WM – NWM), was defined based on group results (see Figure 2D). (D) Averaged alpha-band memory effect (WM – NWM) within the time range (shaded box in Figure 4BC) for the high- and low-performance groups (mean ±confidence interval). (E) Participants in Experiment 2 were grouped into two groups based on memory recency effects (MA for 2nd item –MA for 1st item). Grand average (mean ±SEM) memory recency effect for high-recency group (N = 9) and low-recency group (N = 9). (F) Grand average normalized alpha-band power time courses (mean ±confidence interval) for the high-recency group (red: 1st WM; blue: 2nd WM). The three shaded boxes (phase 1: 140 – 180 ms; phase 2: 280 – 320 ms; phase 3: 470 – 510 ms), representing the time ranges for the sequential effect (2nd WM − 1st WM), were defined based on the group results (see Figure 3D). (G) Grand average normalized alpha-band power time courses (mean ±confidence interval) for the low-recency group (red: 1st WM; blue: 2nd WM). (H) 2nd − 1st alpha-band difference averaged within phase 1, phase 2, and phase 3 (shaded box in Figure 4FG) for the high-recency (grey) and low-recency (white) groups (mean ±confidence interval). The two groups showed non-overlapping confidence intervals for the 2nd −1st alpha-band difference in phase 1 and phase 3. All the confidence intervals were calculated using a jackknife procedure. See also Figure 4—figure supplement 1. The data are provided in source data 3.
Figure 4—figure supplement 1
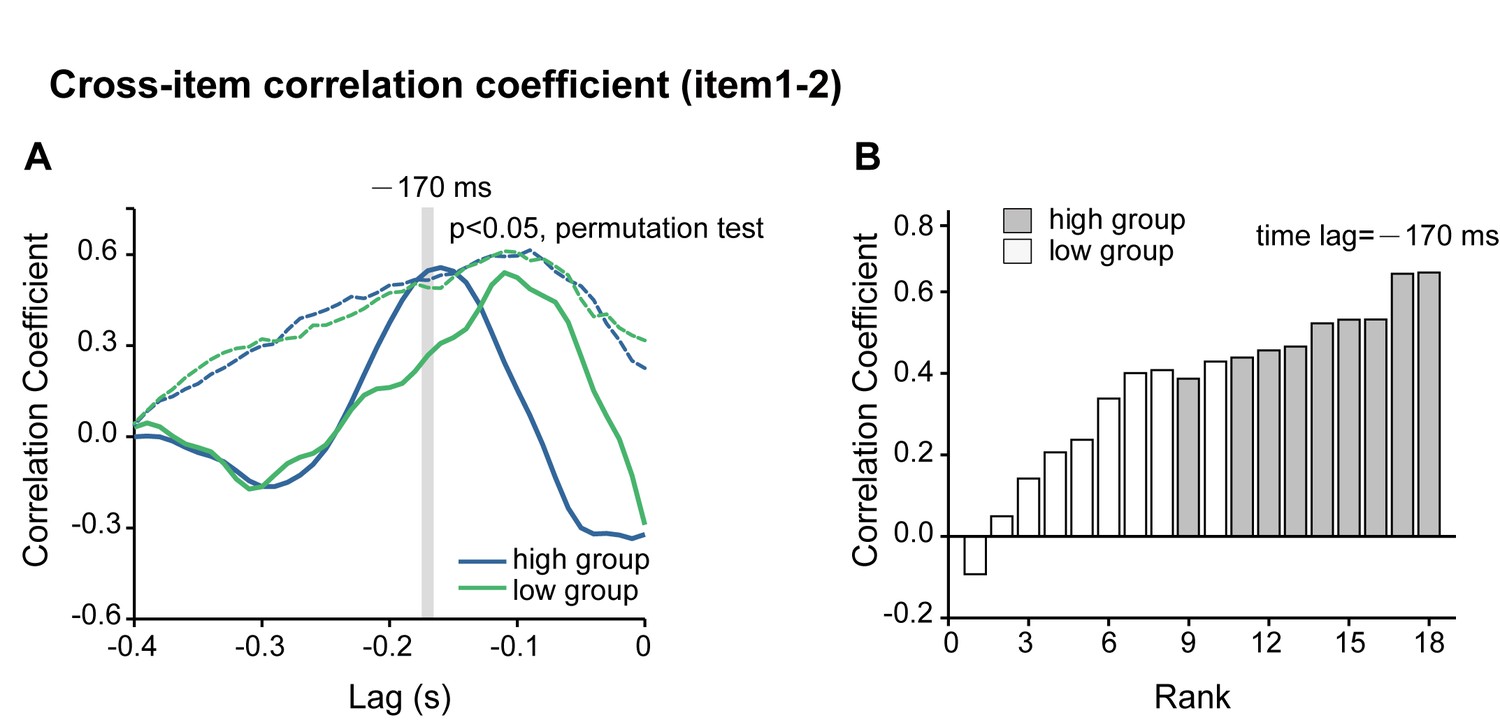
Permutation test of the backward sequential reactivation for the high-recency and low-recency groups in Experiment 2.
(A) Experiment 2 results. Cross-correlation coefficients between the normalized alpha-band profile of the 1st-WM-TRF and the 2nd-WM-TRF responses for the high-recency group (blue line, n = 9) and the low-recency group (green line, n = 9). The dashed lines represent their corresponding permutation test thresholds (p < 0.05, permutation test). It is notable that the high-recency group passed the test whereas the low-recency group did not. (B) A jackknife procedure was used to produce the distribution for the 1st-2nd correlation coefficient at a time lag of −170 ms (the significant time lag in the original group results, see Figure 3E) for the high- and low-recency groups, respectively. It is notable that the samples in the high-recency group showed dominant higher ranks compared to those in the low-recency group.
Figure 5
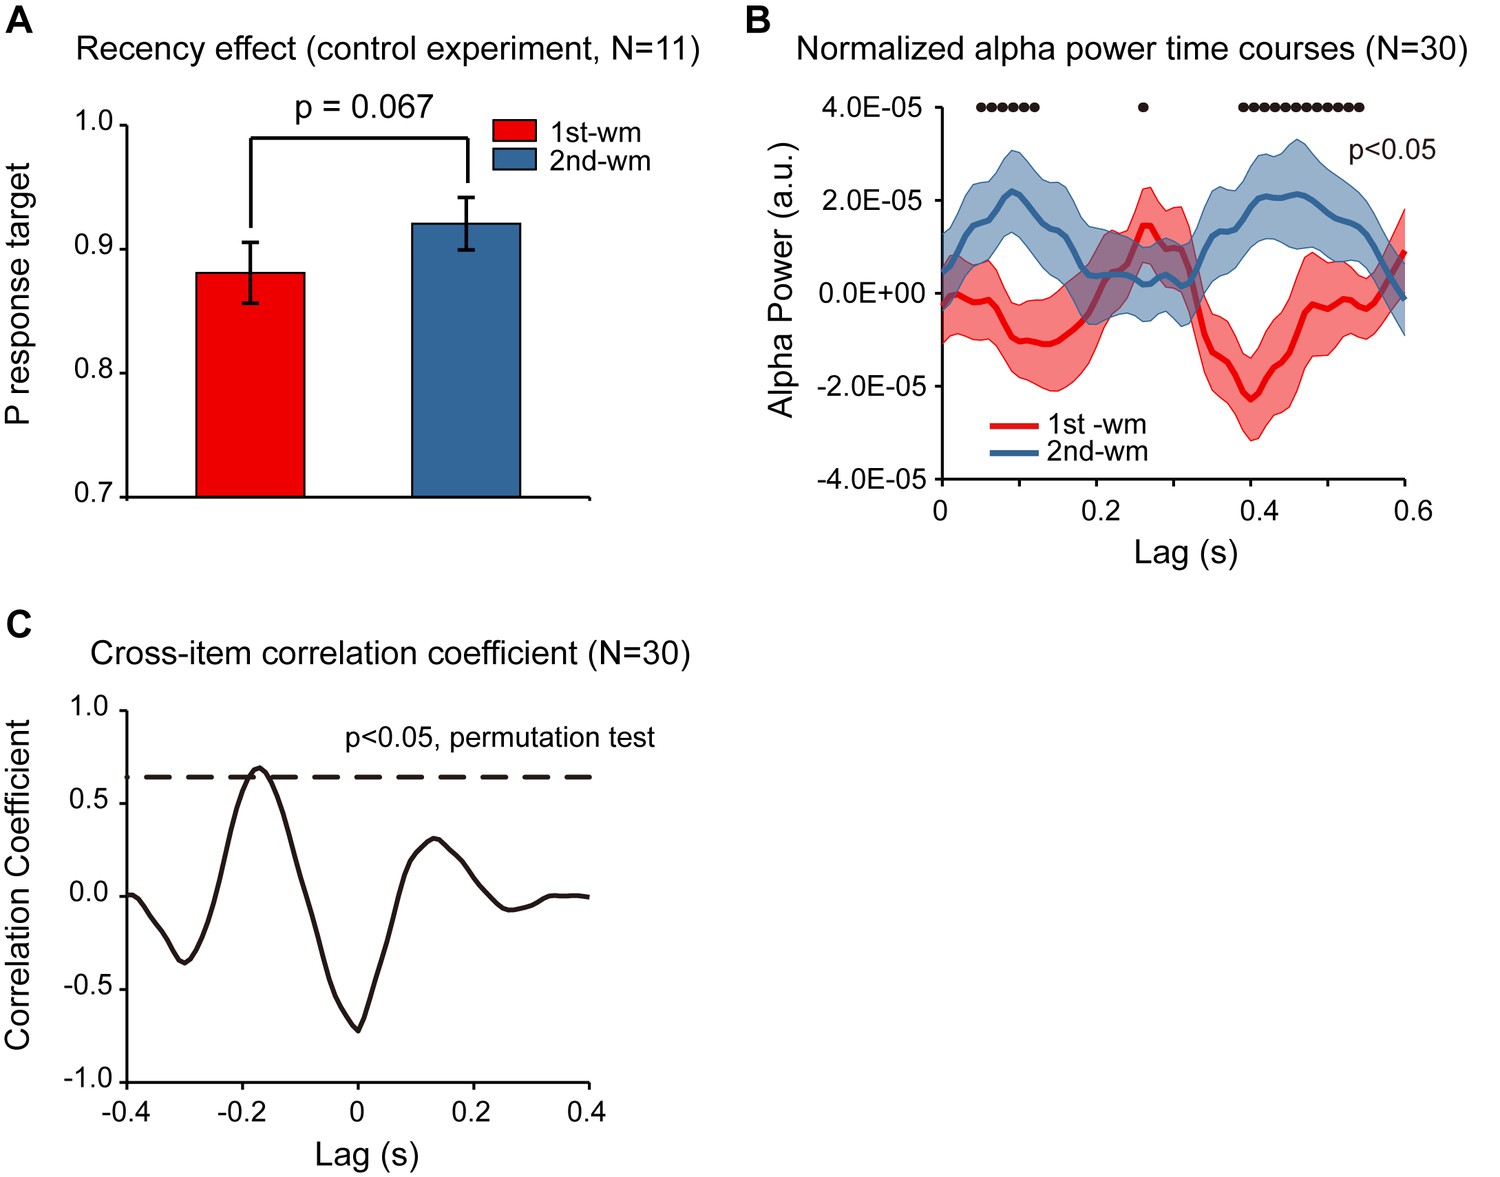
Response bias control and pooled results.
(A) Grand average (mean ±SEM) target probability estimation in the control study (N = 11) for the 1st (red) and 2nd (blue) memorized orientation. The 2nd WM showed larger target probability than the 1st WM (*: p < 0.05, one-sided paired t-test), confirming the recency effect and excluding the response bias interpretation. Note that the procedure was the same as that for Experiment 2 except during the recalling period, subjects were instructed to rotate a bar to the memorized orientation rather than making a binary response. We next pooled the neural data from the control study and that from Experiment 2, resulting in a 30-subject dataset. (B) Grand average (N = 30) normalized alpha power time courses (mean ±SEM) for 1st-WM-TRF (red) and 2nd-WM-TRF (blue) of the pooled data. Black dots indicate points at which the alpha power was significantly above zero (p < 0.05, one-sided paired t-test, uncorrected). (C) Cross-correlation coefficient between the normalized alpha-band profile for the 1st-WM-TRF and the 2nd-WM-TRF responses of the pooled data. The dashed lines represent the corresponding statistical significance threshold (p < 0.05, permutation test, corrected). The data are provided in source data 4.
Author response image 1

Author response image 2
Author response image 3
TRF responses for the single color probe experiment (as suggested by reviewer 4, two subjects).
https://doi.org/10.7554/eLife.35164.019
Author response image 4
TRF response for a new dataset in another experiment (N = 13).
https://doi.org/10.7554/eLife.35164.020
Author response image 5
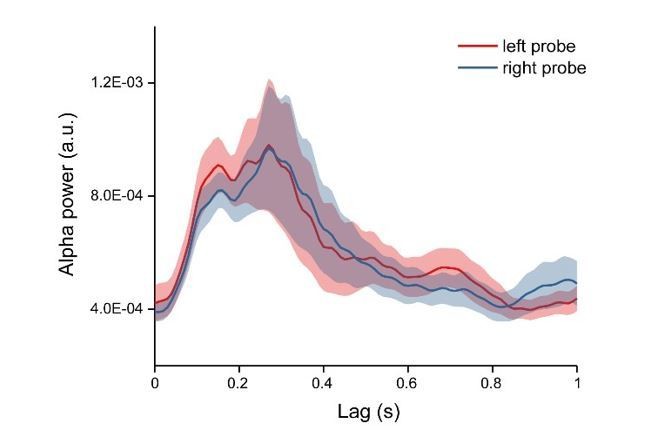
Alpha power time courses for left and right probe.
https://doi.org/10.7554/eLife.35164.021
Author response image 6

Color Control experiment (N = 6).
Six subjects were presented with single color probes (blue or red), while performing a central fixation task. The TRF response was calculated for red and blue color probes respectively (Red-TRF and Blue-TRF). Each condition was ran for 64 trials. (A) Grand average alpha (8-12 Hz) power time courses (mean ±SEM) of blue-TRF and red-TRF. (B) Peak latency of the alpha-band response profiles of blue-TRF and red-TRF (Wilcoxon signed-rank test, p = 0.14). (C) Power spectrum of blue-TRF and red-TRF responses (alpha-band power: paired t test, p = 0.13).
Additional files
-
Transparent reporting form
- https://doi.org/10.7554/eLife.35164.015
Download links
A two-part list of links to download the article, or parts of the article, in various formats.
Downloads (link to download the article as PDF)
Open citations (links to open the citations from this article in various online reference manager services)
Cite this article (links to download the citations from this article in formats compatible with various reference manager tools)
Fast-backward replay of sequentially memorized items in humans
eLife 7:e35164.
https://doi.org/10.7554/eLife.35164


